

Abstract
Noise-induced hearing loss (NIHL) is known to have significant consequences for temporal, spectral, and spatial resolution. However, much remains to be discovered about their underlying pathophysiology. This report extends the recent development of a nonhuman primate model of NIHL to explore its consequences for hearing in noisy environments, and its correlations with the underlying cochlear pathology. Ten macaques (seven with normal-hearing, three with NIHL) were used in studies of masked tone detection in which the temporal or spatial properties of the masker were varied to assess metrics of temporal and spatial processing. Normal-hearing (NH) macaques showed lower tone detection thresholds for sinusoidally amplitude modulated (SAM) broadband noise maskers relative to unmodulated maskers (modulation masking release, MMR). Tone detection thresholds were lowest at low noise modulation frequencies, and increased as modulation frequency increased, until they matched threshold in unmodulated noise. NH macaques also showed lower tone detection thresholds for spatially separated tone and noise relative to co-localized tone and noise (spatial release from masking, SRM). Noise exposure caused permanent threshold shifts that were verified behaviorally and audiologically. In hearing-impaired (HI) macaques, MMR was reduced at tone frequencies above that of the noise exposure. HI macaques also showed degraded SRM, with no SRM observed across all tested tone frequencies. Deficits in MMR correlated with audiometric threshold changes, outer hair cell loss, and synapse loss, while the differences in SRM did not correlate with audiometric changes, or any measure of cochlear pathophysiology. This difference in anatomical-behavioral correlations suggests that while many behavioral deficits may arise from cochlear pathology, only some are predictable from the frequency place of damage in the cochlea.
Keywords: Spatial release from masking, modulation masking release, sensorineural hearing loss, noise exposure, nonhuman primate
1. INTRODUCTION
Noise-induced hearing loss (NIHL) is a major concern in industrialized countries. Members of the military, musicians, construction workers, and more are affected by occupational noise exposure (Humes, 2005; Lew et al., 2007; Gallun et al., 2012; Schink et al., 2014; Seixas et al., 2012). The perceptual effects of NIHL are most prominent in navigating complex scenes, such as understanding speech in noisy, complex environments (Bronkhorst and Plomp, 1992; Bacon et al., 1998). These environments are demanding due to the challenges they present to both the sensory periphery, as well as cortical control networks that underlie attention (Dai & Shinn-Cunningham, 2016; Bressler et al., 2017; Dai et al., 2018). The problem of hearing in such environments has been termed the cocktail party problem, which in more recent years has been recast in terms of sound source segregation, or auditory scene analysis (Cherry, 1953; Bregman, 1990; Yost, 1991). Within this framework, the nervous system uses various physical attributes of sounds to segregate objects, a phenomenon necessary to the navigation of complex auditory environments. Thus, if noise exposure causes deficits in hearing in these environments, then it stands to reason that the impaired auditory system is less able to exploit cues that are readily available to the unimpaired auditory system.
A common feature of natural environments is that noise sound pressure levels (SPLs) are dynamic (Richards and Wiley, 1980; Nelken et al., 1999). Humans and other animals are able to exploit the fluctuations by detecting or recognizing sounds at a much lower threshold in fluctuating noise compared to unmodulated noise (humans: Arlinger & Gustaffson, 1991; Bacon et al., 1998; Vestergaard et al. 2011; macaques: Dylla et al. 2013, Hauser et al. 2018; starlings: Langemann and Klump 2001; gerbils: Ihlefeld et al. 2016; treefrogs: Vélez and Bee, 2011). This has been termed modulation masking release (MMR; Ihlefeld et al. 2016), and is attributed to the listener’s ability to catch brief “acoustic glimpses” of the signal when the background noise dips to a low level and the signal to noise ratio is very high (Vélez et al. 2012). MMR is greatest at lower masker modulation frequencies (Arlinger and Gustaffson, 1991; Füllgrabe et al. 2006). Humans with hearing loss show impaired MMR (Festen and Plomp 1986; 1990; Dubno et al., 2002; Lorenzi et al. 2006) as do gerbils with conductive hearing loss (Ihlefeld et al., 2016). Impaired MMR likely reflects a deficit in the auditory system’s ability to track rapid changes that are of enormous communicative value when attempting to understand speech in noisy settings.
Other cues that are exploited are spatial. Irrelevant signals (noise) at a spatial location that is different from the relevant signal (target) location show reduced masking/distracting effects, such that the detection or recognition threshold for a target masked by a spatially disparate masker is lower than for a target co-localized with the same masker/distractor (spatial release from masking, SRM; humans: Arbogast et al., 2002; Carhart et al., 1968; Freyman et al. 2001; Freyman et al., 1999; Hirsh, 1950; Saberi et al., 1991; pinnipeds: Holt and Schusterman, 2007; treefrogs: Bee, 2008; primates: Rocchi et al., 2017). SRM is also impacted by hearing loss: subjects with hearing loss show reduced SRM relative to normal-hearing subjects (Arbogast et al., 2005; Gelfand et al., 1988; Best et al., 2011).
Despite extensive work characterizing these forms of temporal and spatial processing in humans and animal models, the audiological correlates and the underlying cochlear pathological changes have not been thoroughly explored, especially in humans and NHPs (Burton et al 2019). Recent controlled studies in macaques exposed to high-level noise showed hair cell loss, as well as inner hair cell ribbon synaptopathy of up to 80%, at frequency places in the cochlea basal to the noise exposure frequency (Valero et al. 2017). Consistent with the pathology, such noise exposures caused permanent audiometric threshold elevations and hearing deficits in noisy environments (Hauser et al. 2018). However, since measures of basic auditory processing, like the audiogram and masked audiograms, do not sufficiently reflect hearing in realistic acoustic environments, indices that model hearing in natural acoustic complexity may better reflect cochlear pathophysiology (Stebbins, 1982). To date, no studies have used such realistic acoustic environments (e.g. those affording MMR, or SRM) to assess the effects of a controlled noise exposure. Accordingly, the present work sought to expand the understanding of temporal and spatial processing deficits caused by NIHL by correlating cochlear histopathology, audiologic data and behavioral performance in a masked tone detection task in which temporal and spatial characteristics of the maskers were varied.
2. METHODS
2.1. Subjects
All experimental procedures were strictly in compliance with guidelines set forth by the National Institutes of Health, and were approved by the Vanderbilt University Medical Center Animal Care and Use Committee (ACUC). Experiments were performed on normal-hearing macaques (Macaca mulatta, n=7), noise-exposed macaques (Macaca mulatta, n=1, Macaca radiata n=1), and one macaque before and after noise exposure (Macaca radiata n=1). For HI monkeys, ages at the time of noise exposure were as follows: 10 years (Monkey L), 9 years (Monkey G), and 11 years (Monkey E). Monkeys G and L in the present study were also subjects in a previous study, and are Monkeys G and L in Hauser et al. (2018). Macaca mulatta and Macaca radiata were used interchangeably in the noise-exposure group as the authors know of no differences relevant to this study that would make the combined use of the two species problematic. The average age of the control group was slightly lower than the noise-exposed group. However, this is likely not a concern for this study because these ages are still in the young-adult range – age-related hearing loss becomes prominent much later in life (Ng et al. 2015). The size of the noise-exposed group (n=3) is due to the practical considerations necessary in undertaking a non-human primate study of NIHL (detailed in section V of Burton et al., 2019). Namely, these studies require extensive time and financial resources in order to be carried out. This precludes the use of larger sample sizes seen in small animal studies. Primate studies using complex listening tasks are commonly limited to 2–3 monkeys (Christison-Lagay & Cohen, 2014; Gifford & Cohen, 2005; Hauser et al., 2018; Niwa et al., 2012; Pages et al., 2016). The use of small sample sizes also stems partially from ethical obligations in primate research. Non-human primate researchers are obligated to maximize the data collected before euthanasia and subsequent histological processing, which increases the duration of such studies, making large sample sizes difficult to attain. This sample size was small enough for these purposes, but large enough to attain valid statistical measures of individual differences (see Methods 2.6.5). For NH monkeys (and Monkey E pre-exposure), ages at the commencement of data collection for these studies were as follows: 5 years (Monkey B), 9 years (Monkeys C, D, and E), 7 years (Monkeys G’ and H). Noise exposed monkey G will be denoted as G, whereas unexposed monkey G will appear as G’ in all figures and text. Macaques were fed a commercial diet (LabDiet Monkey Diet 5037 and 5050, Purina, St Louis, MO) as well as fresh produce and foraging items. Manipulanda as well as auditory, visual, and olfactory enrichment were provided in rotations. Macaques were fluid restricted for the study and received filtered municipal water averaging at least 20 ml/kg of body weight/day (typically closer to 25 ml/g/day). Their weight was monitored at least weekly (typically 4 – 5 days each week). For the entirety of the study, weights were within bounds of the reference weights set to index the animal’s health while on study. Macaques were maintained on a 12:12-h light:dark cycle. All procedures occurred between 8 AM and 6 PM. With the exception of G and E who were socially housed, these macaques were individually housed due to incompatibility with available cohorts, but had visual, auditory, and olfactory contact maintained with conspecifics in their housing room.
2.2. Surgical procedures
Standard techniques were used to prepare monkeys for behavioral experiments, described in more detail in previous studies from this laboratory (e.g. Dylla et al., 2013; Bohlen et al., 2014). Briefly, a headpost was implanted on the skull of the monkeys to maintain the position of their head at a relatively constant location with respect to the loudspeakers. The headpost was secured to bone using 8 mm titanium screws (Veterinary Orthopedic Instruments) and encapsulated in bone cement (Zimmer). Analgesics (pre- and post-procedure) and antibiotics (intra-procedure) were administered under veterinary oversight, as specified in the ACUC protocol.
2.3. Apparatus and Stimuli
The apparatus used for these behavioral experiments has been described in previous publications (e.g., Dylla et al., 2013; Rocchi et al., 2017). Briefly, monkeys were seated in a custom designed primate chair situated inside a sound treated booth (IAC, model 1200A and Acoustic Systems, model ER-247). Sounds were delivered from a free-field speaker (Rhyme Acoustics) located in the frontal field at a distance of 90 cm from the center of the monkey’s head. Both tones and noise were presented from the same speaker for the MMR experiments; signals and noise were presented from different speakers for the 45-degree and 90-degree conditions of the SRM experiments. For the MMR experiments, speakers were located directly in front of the monkeys. For the SRM experiments, the speaker presenting the masker was placed at different angles on the azimuthal plane. The speakers were calibrated with a ¼ inch microphone (378C01, PCB Piezotronics) that was located just outside the monkey’s ear canal. Care was taken to make sure that the speaker outputs were within 3 dB across all frequencies to ensure that that there were not speaker specific cues. Calibrations were also performed at the different speaker locations used in the spatial experiment to ensure that the sound level at the entry to the ear canal was as specified.
Experimental flow was controlled by a computer running OpenEx software (System 3, TDT Inc., Alachua, FL). Tones and broadband, uniformly distributed noise were generated using a sampling rate of 97.6 kHz. The lever state was sampled at a rate of 24.4 kHz, leading to a temporal resolution of about 40 μs on the lever release. A full description of the apparatus used to generate the signals and masker is provided in Dylla et al. (2013).
2.4. Noise exposure
The parameters of the noise exposure have been described elsewhere (Hauser et al. 2018). Briefly, following characterization of baseline behavior and physiology (audiograms, masked thresholds, ABRs, DPOAEs) three macaques (Macaca radiata E and G, and Macaca mulatta L) were subjected to noise exposure. Monkeys were treated with atropine and anesthetized with a mixture of ketamine (10 mg/kg) and midazolam (0.05 mg/kg). They were then intubated, following which anesthesia was maintained with isoflurane (1.5 – 2%). The exposure noise was delivered through a closed acoustic system. MF1 speakers (TDT Inc.) coupled with probe tips were inserted into the ear canal. The exposure noise was a 50 Hz band of Gaussian noise around 2000 Hz played for four hours at 146 dB SPL for monkeys E and G, and 141 dB SPL for monkey L.
The deficits due to the noise exposure were characterized behaviorally through the audiogram and masked tone detection, as well as through non-invasive physiological means (Hauser et al. 2018). Auditory brainstem responses (ABR) to tones (frequency = 0.5, 1, 1.4, 2, 2.8, 4, 8, 16, and 32 kHz) and clicks were measured after the noise exposure and compared to pre-exposure values. Frequency specific threshold increases of at least 20 dB suggested a permanent threshold shift (see Hauser et al., 2018 for details). Distortion product otoacoustic emissions (DPOAEs) were absent when measured 0.5 – 8 kHz (f2/f1=1.22, L2-L1=10 dB) at L2=65, L1=55 dB SPL after noise exposure. The behavioral procedures described here commenced well after audiometric thresholds had stabilized (at least 5 weeks) following noise exposure. Following this initial threshold shift and stabilization, secondary threshold shifts were observed. The temporal order of initial shift, secondary shift, MMR and SRM data collection will be explicitly addressed in Results section 3.3.
2.5. Experimental Procedures
Monkeys performed a reaction time Go/No Go task with lever release to report tone detection. Details of the task have been reported elsewhere (e.g., Dylla et al. 2013; Rocchi et al. 2017; Hauser et al. 2018). Briefly, monkeys initiated a trial by pressing a lever. Trials could be signal trials (80%) in which a tone signal (200 ms duration) was played after a random delay period, or they could be catch trials (20%), in which no tone signal was played. Both types of trials occurred embedded in continuous broadband noise (5 – 40000 Hz, 30 or 40 dB SPL spectrum level). The monkey was required to release the lever within a response window (600 ms after the onset of the tone) to indicate detection on signal trials, and required to hold the lever pressed on catch trials. Correct lever releases (hits) on signal trials were rewarded with fluid. Non-release of the lever on signal trials (misses) was taken to indicate non-detection and were not rewarded or punished. A lever release on catch trials (false alarm) resulted in a 6–10 s timeout in which no trial could be initiated. The correct reject responses were not rewarded. The spatial and temporal experiments were performed after the monkeys’ audiograms and masked detection performances in unmodulated maskers were characterized (Dylla et al. 2013; Hauser et al. 2018).
2.5.1. Modulation Masking Release (MMR) task
Data were collected from ten subjects: seven normal-hearing male macaques, two noise-exposed male macaques, and one male macaque (Monkey E) whose data were collected both pre and post noise exposure. In the MMR task, the monkeys detected a tone signal in continuous unmodulated and sinusoidally amplitude modulated broadband noise masker. The noise level typically used was 30 dB SPL spectrum level (76 dB SPL); in some cases, 40 dB SPL spectrum level (86 dB SPL) noise was used as a masker to verify that deficits observed in the noise-exposed monkeys were not dependent on audibility. Tone frequencies used were 0.5, 1, 2, 2.828, 4, 8, and 16 kHz. The noise modulation frequencies were either 10, 20, 40, 80, 100, or 150 Hz. Noise modulation depth was 100%. Monkeys also reported detection in unmodulated noise for comparison. Onset phase of modulation was set at −90°. Tone levels used were based on individual macaque masked audiograms; tone levels were chosen to straddle expected threshold. Tone level increments were telescoping; they were 2.5 dB around the expected threshold, and could be 15 dB at levels 15 dB above and below estimated threshold. The method of constant stimuli was applied with randomized presentation order of each tone level, and each level was used a minimum of 15 and a maximum of 30 times. Noise level and modulation frequencies were blocked.
2.5.2. Spatial release from masking (SRM) task:
A task in which the tone and noise were spatially separated was used to compare spatial processing between normal-hearing and noise-exposed monkeys. The methods used were identical to a previous report (Rocchi et al., 2017). Briefly, data was collected from seven macaques. The normal-hearing cohort (n=6) was composed of monkeys B, C, D, G’, H, and monkey E pre-noise exposure. The HI group was composed of monkeys L and E post noise-exposure. Macaques detected tones in broadband noise masker that was either co-localized with the tone signals, or that were spatially separated from them. Tone frequencies used were 0.5, 1, 2, 2.828, 4, 8, 16, and 32 kHz. Typically, the signal was presented at 0° azimuth and the masking noise was played from the same speaker, or from a different speaker located at 45°, or 90° azimuth. Broadband noise (5 Hz – 40000 Hz) was played continuously. The noise level typically used was 30 dB SPL spectrum level (76 dB SPL overall level); in some cases, 40 dB SPL spectrum level (86 dB SPL overall level) noise was used as a masker to verify that deficits were not audibility or level dependent. Tone levels used were similar to the temporal task, with 15 to 30 repeats per tone level. Masker spatial location and tone frequency were blocked.
2.5.3. Cochlear Histology
Histology and imaging were performed using procedures detailed previously (Valero et al 2017). Briefly, following completion of the behavioral assays, animals were euthanized by an overdose of sodium pentobarbital (130 mg/kg), followed immediately by transcardial perfusion (2 liters 0.9% phosphate-buffered saline, PBS; 2 liters 4% phosphate-buffered paraformaldehyde, PFA). The round and oval windows were opened, cochleas perfused through the scala tympani with PFA, submerged in PFA for 2 hours, then transferred to 0.12 M EDTA for decalcification.
Decalcified cochleas were dissected into quarter turns to obtain epithelial whole mounts of the organ of Corti containing the hair cells and most of the osseous spiral lamina at each location from base to apex. Immunohistochemistry was used to label pre-synaptic ribbons (mouse IgG1 anti-CtBP2 (C-terminal binding protein 2); BD Transduction Labs; 1:200); ii) glutamate receptor patches (mouse IgG2 anti-GluA2; Millipore; 1:200), iii) hair cell cytoplasm (rabbit anti-myo7a (myosin VIIa); Proteus Biosciences; 1:200), and iv) cochlear afferent and efferent fibers (chicken anti-NFH (neurofilament-H); Chemicon; 1:1000). Tissue was incubated in species-appropriate fluorescent secondary antibody conjugates (AlexaFluor) for secondary detection.
2.6. Data Analysis
2.6.1. Probability correct, and threshold criterion
Signal detection theoretic methods were used, and were based on methods used in previous publications (e.g., Dylla et al. 2013; Bohlen et al. 2014; Rocchi et al. 2017; Hauser et al. 2018). The proportion of lever releases from each block of data was analyzed to calculate the hit rate at each tone level (H(level)) and false alarm rate (F). From the hit rate and false alarm rate, sensitivity was calculated as dʹ(level) = (z(H(level)) – z(F)), where z represents calculation of the z-score of the value, implemented in MATLAB via the function “norminv.” From d’, probability correct in a two-alternative forced-choice experiment was given by pc(level), as pc(level) = z−1(dʹ(level)/2), where z−1 represents the transformation from a standard normal variate to probability correct. The psychometric function was plotted as pc(level) vs. tone sound pressure level (SPL). These functions were fit with a modified Weibull cumulative distribution function (CDF): , where c represents saturated performance, and d represents the range of the function. Additionally, λ and κ represent the threshold and slope parameters respectively. Threshold criterion was pcfit(level)=0.76.
2.6.2. Modulation-based masking release (MMR) threshold extraction
The masking release observed in the task in which tones were embedded in amplitude-modulated noise will be referred to as modulation-based masking release (MMR). In the MMR task, thresholds were measured for the unmodulated masker condition as well as for the different masker modulation frequencies. Previous studies from this laboratory showed that when the noise was modulated at 10 Hz, the monkeys’ detection threshold of a signal tone was lower relative to when the noise was unmodulated (Dylla et al., 2013; Hauser et al., 2018). The relationship between masking release and noise modulation frequency was quantified by fitting a sigmoidal function (a Weibull CDF) to the threshold vs. noise modulation frequency data. The threshold parameter (α) of the MMR Weibull function was taken to be the MMR threshold (the highest noise modulation frequency that caused a significant and reliable reduction in masked tone detection thresholds). To further characterize MMR, the amplitude (d parameter of the Weibull CDF) of each of the MMR functions was taken as an estimate of the magnitude of masking release. The MMR threshold and amplitude provide complementary estimates of temporal processing. MMR threshold was taken to be the lowest value measured (10 Hz) if the MMR amplitude was less than 6 dB (termed “MMR Criterion”), as this appeared to be roughly 50% of the typical MMR amplitude observed (see Results).
The control data to this study were not obtained in monkeys G and L before they were noise-exposed. The effects of noise exposure were obtained by comparing with a separate group of unexposed macaques that had normal hearing as assessed by behavioral and audiological (non-invasive physiological) methods.
2.6.3. Spatial release from masking (SRM)
For the spatial task, psychometric functions were plotted and thresholds calculated for each tone frequency, and for each noise location. The decrease in threshold due to the spatial separation of signal (tone) and noise was quantified as the spatial release from masking, and was calculated as , where θ was the spatial separation between signal and masker. Thus, negative values represent spatial release from masking, and values close to zero represent a lack thereof.
2.6.4. Cochlear Histology
The tissue was imaged on a Leica SP8 confocal microscope, using a 63X glycerol objective (1.3 N.A.), to acquire 3-dimensional image stacks at each of 8 octave-spaced positions along the cochlear spiral from 0.125 to 32 kHz, with half-octave spacing in regions of significant hair cell loss. The frequency correlate of each image stack was computed from a cochlear frequency map based on a Greenwood function (Greenwood, 1990), assuming an upper frequency limit of 45 kHz. OHC, IHC, and ribbon synapse counts were averaged across two adjacent stacks for each cochlear place. Amira software (Visage Imaging) was used to quantify IHC afferent synapses from confocal z-stacks by identification of thresholded CtBP2-labeled puncta within hair cells. Hair cell survival was assessed in low-power confocal z-stacks by counting cuticular plates normalized to the expected number of hair cells within each row.
2.6.5. Correlation of histological and behavioral data
Correlations between MMR and SRM with audiometric shift and histological data were calculated using the “corrcoef” function in MATLAB (2018a), which gives Pearson’s correlation coefficient, R and significance value. Additionally, “fitlm” and “fitnlm” were used to assess goodness of fit of each linear or non-linear fit, respectively. Choice of model was always validated using the “fitlm” and “fitnlm” functions, which gives Bayesian Information Criteria (BIC). Statistical analysis of the differences between noise-exposed and control data were conducted using linear mixed effects models (“fitlme”) in MATLAB 2018a. These models accommodate datasets with missing points. This reason, among others, has motivated many researchers to opt for mixed effects models over repeated measures ANOVA (Krueger & Tian, 2004). The dependent variable in each model was either MMR threshold, MMR amplitude, or SRM. Noise exposure status, tone frequency, and an interaction term between the two were entered as fixed effects into the model, while intercepts for individual macaques were entered as random effects. P-values were obtained by likelihood ratio testing of the model with the effect in question against the model without the effect in question.
The histological-behavioral models that incorporated frequency (tone frequency and frequency place of the cochlea), inner hair cell survival, synapse survival, outer hair cell survival, and behavioral performance (Δ MMR threshold, MMR amplitude, or SRM) were constructed using “stepwiselm” in MATLAB, which starts with a model that contains all of the data, and systematically removes factors and interaction terms that do not add significant (p < 0.05) explanatory power to the model. In all cases the residuals (the error of the model) were compared against the fitted values of the model, and linear regression was only used if the residuals were randomly distributed. For the model using MMR amplitude, the residuals of the stepwise regression were not randomly distributed, and this motivated the use of quadratic terms to fit the data.
The histological-behavioral correlations reported here are presented with the caveat that there was a range of delays (5–22 months) between noise exposure and euthanasia/subsequent histology; a necessary aspect of collecting large behavioral datasets. Despite this limitation, the present paper contains strong histological correlates of behavior (see Results) that are likely underestimated due to the presence of this delay because of the likelihood of progressive deterioration following the behavioral data collection. Evidence is presented here of such deterioration, and compared with previous corroborating findings. This suggests to the authors that the present results provide meaningful insight into the dependence of behavior on cochlear function.
3. RESULTS
3.1. Modulation masking release (MMR) in normal-hearing macaques
Macaques, much like humans, show modulation masking release (MMR) in a masked detection task when the masker is modulated compared to when the masker is unmodulated (Dylla et al., 2013; Hauser et al., 2018). The present results elaborate on these experiments by using multiple masker modulation frequencies to acquire a more comprehensive measure of MMR.
Figure 1A shows the psychometric functions that demonstrate MMR in normal-hearing macaque D detecting a tone (frequency = 1 kHz). When the masker was modulated at high frequencies (e.g. 150 Hz), the sigmoidal psychometric function had a threshold of about 53 dB SPL. This threshold was similar to that measured in unmodulated noise (triangles). However, when the masker was modulated at low frequencies (e.g., 10 Hz), the psychometric function was shifted to lower SPLs relative to the unmodulated masker (diamonds, Figure 1A), with a threshold close to 43 dB SPL, a masking release of 10 dB. MMR achieved at this SAM frequency ranged from ~10 – 20 dB across tone frequencies. This is consistent with previous reports from our group, albeit at lower masker SPLs (Dylla et al., 2013).
FIGURE 1 –

Modulation masking release (MMR) in normal-hearing macaques (Color available online). A. Exemplar psychometric functions showing probability correct as a function of tone level for Monkey D, detecting 1 kHz tones embedded in noise that was unmodulated (triangles), or amplitude modulated at 10 (◊), 40 (○) or 150 Hz (□). B. An example of detection threshold (pc=0.76) as a function of noise modulation frequency, fit with a Weibull function to extract metrics of MMR: MMR threshold (arrow) and amplitude (solid vertical line). C. MMR thresholds of each monkey, at each tone frequency tested. D. MMR amplitudes for each monkey, at each tone frequency tested. MMR previously published in Dylla et al. (2013), estimated by threshold shift in 10 Hz AM noise relative to unmodulated noise shown inset, in grey.
An example of detection thresholds from Monkey D, detecting 1 kHz tones embedded in maskers of various masker modulation frequencies are plotted as a function of noise modulation frequency in Figure 1B. At this tone frequency and every other one tested, detection thresholds were a sigmoidal function of the noise modulation frequency. The thresholds were fit with a Weibull CDF (see Methods 2.6.2). The threshold parameter (α) of the Weibull function provides an estimate of the highest noise modulation frequency that showed reliable MMR. This point was taken to be the MMR threshold, which represents an estimate of the limit of temporal sensitivity. Figure 1C shows how MMR threshold varied with the tone frequency in seven normal-hearing (NH) macaques. At low tone frequencies (1 kHz), MMR threshold frequencies were low (mean=40.7 Hz, SD: 1.6); at intermediate frequencies (2.828 kHz), they were higher (mean=48.5 Hz, SD: 3.7), and at the highest frequencies tested (16 kHz), they had a higher mean than at the lowest frequency, but lower than the intermediate frequencies (42.9 Hz, SD: 4.03). The amplitude parameter (d) of the Weibull function was also taken into account, as it provided a measure of the magnitude of the MMR function between 10–150 Hz modulation frequency, and typically represented the maximum release from masking. Figure 1D shows each monkey’s MMR amplitude across frequency, which provides an estimate of the magnitude of masking release across modulation frequencies (see Methods). These values clustered around 12 dB (Mean: 12.85, SD: 2.3), consistent with previous data from this lab measured as threshold change (Dylla et al., 2013; average data from two macaques shown inset in figure 1D, in grey). Despite the differences in the SPL at which masking release was measured across the two studies, the results converge to suggest MMR is 10–15 dB in these conditions.
3.2. Spatial release from masking (SRM) in normal-hearing macaques
Macaques also show a release from masking when signal and masker were spatially separated, similar to humans and other species, as this lab has previously shown (Rocchi et al. 2017). However, those studies were performed at a lower masker level that would be ineffective as a masker given the permanent threshold shifts experienced by these macaques. In order to characterize SRM deficits after NIHL, this experiment was repeated with higher masker levels (30 and 40 dB SPL spectrum level, 76 and 86 dB SPL overall level). These data are shown in Figure 2.
FIGURE 2 –

Spatial release of masking (SRM) in normal-hearing macaques (Color available online). A. Exemplar psychometric functions showing SRM, the difference between thresholds (pc=0.76) when the noise masker was at 45° (◊) or 90° (∆) and 0° (○) along the azimuthal plane. B. SRM at 45° for each monkey at each tone frequency measured. C. SRM at 90° for each monkey at each tone frequency measured.
Figure 2A shows exemplar psychometric functions for NH Monkey B. The psychometric function for the colocalized tone and masker condition is shown in blue (circles), while the psychometric functions when the masker was separated by 45° and 90° in azimuth are shown in red diamonds and green triangles respectively. The dynamic ranges and detection thresholds for these conditions were shifted to lower SPLs relative to the co-localized masker condition, indicating a release from masking proportional with the degree of spatial separation between the signal and noise.
Figures 2B and 2C show the spatial metric, spatial release from masking (SRM(θ, f), calculated as the difference between detection thresholds when the masker was at 45° or 90° azimuth, compared to 0° azimuth as a function of the tone frequency. SRM at 45° (Figure 2B) was between 2 and 18 dB, and appeared to increase slightly as a function of tone frequency. For the masker at 90° (Figure 2C), the SRM was larger (7–28 dB), as expected, compared to the SRM at 45°. The SRM increased as a function of frequency, and was consistent across the six NH monkeys tested.
3.3. Audiometric shift after noise exposure
After noise exposing monkeys L, E, and G (see Methods section 2.4), their audiometric performance was characterized and compared to baseline performance. These data are shown in Figure 3A. The shift in detection threshold for each monkey reflected the spectrum of the noise exposure stimulus (50 Hz bandwidth around 2 kHz) – thresholds were higher at frequencies above the noise exposure band. The variability in the audiometric shift between monkey L and monkeys E and G can be attributed to the difference in noise level (141 vs. 146 dB SPL), while the differences between E and G are likely due to individual differences in susceptibility to noise exposure. Given that monkeys G and L were subjects in other behavioral studies, one can find their behavioral and neurophysiological in Hauser et al., 2018 and Burton et al., 2020.
FIGURE 3 –

Audiometric shift after noise exposure. (Color available online). Audiograms for monkeys L (□), E (○), and G (∆) pre-exposure (black) and post-noise exposure (red). A. Initial audiometric shift measured at 5 weeks post noise exposure for each monkey. B. Secondary audiometric shift measured at time-points after MMR and SRM data collection for Monkeys L and E, but near MMR collection for Monkey G.
The extended post-exposure survival time required to collect behavioral data created an opportunity to investigate the longer-term consequences of noise exposure. Secondary audiometric threshold shifts were observed (Figure 3B), as observed in other studies (Fernandez et al. 2015; Gates et al. 2000). Importantly, monkeys E, G and L displayed differences in degeneration with time, as in the data reported by Fernandez et al. (2015) and Gates et al. (2000). These differences are thought to be the product of individual variability in genetic and environmental factors. The difference between baseline and post-exposure detection threshold in Figure 3A was used for the correlations with audiometric shift presented in section 3.6 for Monkeys E and L, because of the temporal coincidence of this initial shift with the MMR and SRM data collection. Monkey G completed the MMR task at a later time-point that very closely approximated the secondary shift shown in Figure 3B, resulting in the correlation of those two datasets (secondary audiometric shift with MMR).
3.4. MMR in noise-exposed macaques
MMR was measured in noise-exposed monkeys (E, G, and L) under the same conditions as NH monkeys. The results are shown in Figure 4. Figure 4A shows the detection performance of monkey L in the same format as Figure 1A. Note that the psychometric function showing detection of a 4 kHz tone in 150 Hz SAM noise (squares) overlapped with that obtained in 40 Hz modulated SAM noise (circles), and 10 Hz modulated noise (diamonds), which was very different from trends observed in NH animals (see Figure 1A). The lack of threshold change across masker modulation frequency, typically seen in controls (Figure 1), suggests a deficit in the ability to take advantage of the temporal cues afforded by amplitude modulation, even at slow temporal fluctuations.
FIGURE 4 –

MMR in noise-exposed macaques (Color available online). A. Exemplar psychometric functions showing probability correct as a function of tone level for Monkey L, detecting 4 kHz tones embedded in noise, amplitude modulated at 10 (◊), 40 (○) or 150 Hz (□). B. Examples of the lack of MMR at any noise modulation frequency at frequencies showing pronounced cochlear damage in monkey E (○) and monkey L (□), where MMR threshold was taken to be 10 Hz, the lowest modulation frequency tested, and MMR amplitude was zero. C. MMR threshold in noise exposed macaques, compared to a group of non-noise-exposed monkeys (◊). D. MMR amplitude in noise-exposed macaques, compared to unexposed monkeys. MMR previously published in Dylla et al. (2013), estimated by threshold shift in 10 Hz AM noise relative to unmodulated noise shown inset, in grey. Conventions follow legend in part C. The format is similar to Figure 1.
The detection thresholds for monkey L as a function of modulation frequency for the 4 kHz tone are shown in Figure 4B. In contrast to the large (~10 dB) masking release shown in Figure 1B, there was little masking release, even through the noise did mask the tone. However, it was possible that there was not sufficient masking by the 30 dB SPL spectrum level masker (76 dB overall level), making the lack of MMR simply an issue of audibility. To rule this out as a potential explanation, we also tested monkey E’s MMR in 40 dB spectrum level masker at 1, 2.828, 8, and 16 kHz. Exemplary data from the 2.828 and 4 kHz condition are shown in Figure 4B (red squares). Even though the 40 dB SPL spectrum level masker caused increased thresholds relative to the 30 dB SPL spectrum level masker (suggesting that the noise was indeed audible and effective as a masker), the thresholds in unmodulated noise were similar to the thresholds obtained in 10 Hz and 20 Hz modulated noise, suggesting that there indeed was no MMR. In cases such as these, the MMR threshold frequency was taken to be 10 Hz, the lowest modulation frequency tested, and the MMR amplitude was 0 dB. For other tone frequencies (e.g. 1 kHz) the MMR thresholds were closer to those of NH macaques.
Figure 4C shows MMR thresholds as a function of the tone frequency for noise-exposed monkeys G (triangles), L (boxes), E (circles and x-hairs represent detection in 76 and 86 dB SPL maskers, respectively) and the control monkeys (diamonds). Note that MMR thresholds for the noise-exposed monkeys show a very different trend relative to controls. The MMR thresholds in the noise-exposed macaques were close to normal at frequencies outside the frequency range that showed large audiometric shifts, and decreased at frequencies near and above that of the noise exposure (2 kHz). The MMR thresholds were almost equal to that of the control group at 8 and 16 kHz for Monkey L, but remained at 10 Hz (indicating a lack of MMR) at all frequencies above 2 kHz for monkeys G and E. The differences in MMR threshold between NH and noise-exposed groups was significant, as indicated by linear mixed-effects model analysis (t = −7.5, p = 3.3*10−10, df = 59).
MMR amplitude was drastically reduced in a frequency specific manner in the noise-exposed monkeys, as can be seen in Figure 4D. At certain frequencies (e.g. 1 kHz in all three monkeys) MMR amplitude was sufficient (> 6dB) to qualify as significant masking release (see Methods), but at most frequencies tested, MMR amplitude was zero. The differences in MMR amplitude between each control monkey and each noise-exposed monkey was significant, (t = −4.19, p = 9.5*10−5, df = 59). The noise level (76 dB SPL) may have been so much higher than threshold in the normal hearing monkeys that the comparison between the two groups (NH and HL) did not account for the masker sensation level. A lower noise level for the control group could, theoretically, evoke less MMR, and reduce the contrast between the two groups. However, this is not the case. MMR with such a lower level masker (44 dB SPL) was published in Dylla et al., (2013) and the threshold shift values (typically the MMR amplitude) were similar to those reported here (10–15 dB). The average MMR from Dylla et al. (2013), measured as threshold shift, are shown inset, in grey, in Figure 4D, and as can be seen were not different from NH subjects, but very different from the HI animals.
3.5. SRM in noise-exposed macaques
Figure 5 shows the effect of NIHL on SRM in monkeys E and L. The psychometric functions obtained with a 2 kHz tone are shown in Figure 5A, using the same format as Figure 2A. The dynamic ranges for the cases when the noise and the tone were spatially separated (diamonds and triangles) were not shifted to lower levels in these subjects, in contrast to the NH macaques (Figure 2). Thus, the SRM found in the NH subjects was absent in the noise-exposed animals at every tone frequency tested, and confirmed by mixed model analysis (t = −3.01, p = 2.9*10−5, df = 43). These observations are expanded in Figures 5B and 5C, which plot SRM as a function of tone frequency when masker azimuth was at 45° (Figure 5B), and 90° (Figure 5C). These data show that rather than a masking release, there was additional masking at some of the frequencies, indicated by SRM being positive.
FIGURE 5 –

Spatial release of masking in noise-exposed macaques (Color available online.) A. Exemplar psychometric functions showing lack of SRM when the noise masker was at 45° (◊) or 90° (∆) and 0° (○) along the azimuthal plane. B, C. SRM at 45° and 90° for each monkey at each tone frequency measured, compared to unexposed monkeys (◊).
Similarly to MMR, the noise level in these experiments may have been sufficiently above threshold for the normal hearing monkeys that the comparison between the NH and HL groups was not fair. A lower noise level for the NH group could evoke less SRM, and reduce the contrast between the two groups. However, this was not observed. SRM with such a lower level masker (56 dB SPL) was published in Rocchi et al. (2017) and the threshold shift values were similar to those reported here.
3.6. Correlation of MMR and SRM with audiometric shift
To examine the relationship between the audiometric consequences of noise exposure and the more complex consequences that may be related to hearing in noisy, realistic environments, correlations between MMR and SRM performance metrics with audiometric shift are shown in Figure 6. Monkeys L and E’s MMR and SRM data were correlated with the initial audiometric shift, while Monkey G’s data were correlated with the secondary audiometric shift (see section 3.3 for explanation). Since pre-exposure data was not available for all noise-exposed macaques, control MMR thresholds were averaged to provide normative values. The deficit (Δ MMR threshold) was calculated as the difference between these normative values and the MMR threshold for each noise-exposed monkey. Figure 6A shows that ΔMMR threshold increased exponentially with increases in audiometric threshold (R = 0.7635, p = 0.005). The second measure of temporal processing used in this study, MMR amplitude also correlated with audiometric shift, decreasing exponentially as the audiometric shift increased (Figure 6B; non-linear regression, R = 0.7346, p = 0.0006). ΔMMR amplitude (the change in MMR amplitude, calculated as the difference between the mean amplitude of the control group and the MMR amplitude for each of the HI subjects) also correlated with audiometric shift (R = 0.76, p = 0.0095; not shown).
FIGURE 6 –

Correlation of MMR and SRM with audiometric shift. A. Between group difference in MMR threshold as a function of change in audiometric threshold for the noise exposed monkeys G (∆), E (○), and L (□). The dashed line represents the best fitting exponential function, with significance determined by non-linear regression. B. Modulation masking release amplitude as a function of audiometric shift. Symbols and lines follow the conventions in panel A. C. Maximum spatial release from masking as a function of audiometric shift. The dashed line represents the best fitting line. Symbols follow conventions in A.
Figure 6C shows the relationship between the SRM and the change in audiometric thresholds. While the goal was to acquire the best estimate of change in spatial sensitivity as a result of noise exposure, the difference between control and noise-exposed monkeys did not seem suitable for this analysis, because the trend in Δ SRM is almost completely driven by the NH data. This is illustrated in figure 4C. The noise-exposed subjects show a flat trend, while NH subjects’ SRM increased with tone frequency, making any correlation we attempted to establish using Δ SRM, in reality, a correlation with the NH data. To avoid these issues, we used SRM at 90° to correlate spatial-processing with audiometric change, and histological changes. Figure 6C shows a scatter between the SRM at 90° and the audiometric change for each tone frequency for macaques E and L. The lack of correlation between the two quantities was confirmed by a Pearson correlation coefficient value of −0.4824 (p = 0.081).
3.7. Histological consequences of noise exposure
After the behavioral and physiological characterization reported here, by Burton et al. (2020) and by Hauser et al. (2018), cochlear histology was performed to directly assess the effects of noise exposure on inner hair cell (IHC), outer hair cell (OHC) and ribbon synapse (SYN) survival. Figure 7A shows mean (averaged across left and right ear) inner hair cell survival for each monkey as a function of frequency place in the cochlea. Similarly, Figures 7B and 7C show these trends for OHC and SYN survival, respectively. The rationale for using mean survival are discussed below. Histopathological changes were observed at cochlear frequency places at and above the frequency of the noise exposure (2 kHz, illustrated by the grey box), consistent with results from Valero et al. (2017).
FIGURE 7 –

Histopathological effects of noise exposure (Color available online). A. Inner hair cell survival as a function of frequency place in the cochlea for monkeys L (□), E (○) and G (∆). The grey box represents the frequency band of the noise exposure. B and C are similar to panel A, but for outer hair cells (B) and cochlear ribbon synapses (C).
3.8. Correlation of MMR and SRM with cochlear histopathology
One goal of this project was to assess the relationship between temporal and spatial processing deficits and cochlear histopathology. Figures 8 and 9 show these correlations for MMR and SRM deficits, respectively. Δ MMR thresholds (Figure 8A) were lower where more OHCs survived and higher where fewer OHCs survived (Pearson’s correlation coefficient, R = −0.6205, p=0.0179). Δ MMR threshold was also significantly correlated with survival of IHC synapses (Figure 8B, R = −0.295, p = 0.00013). MMR amplitudes (Figure 8C, D) were correlated with OHC survival (Figure 8C; non-linear regression, R = 0.601 p=0.00405) and with IHC synapse survival (Figure 8D; non-linear regression, R = 0.3937, p=0.0214). Δ MMR amplitude between groups also correlated with OHC loss and IHC synapse survival (OHC: non-linear regression, R = 0.489, p = 0.00039; SYN: R = 0.489, p = 0.00095). IHC survival did not correlate with Δ MMR threshold (R = 0.0498, p = 0.9), MMR amplitude (R = 0.0728, p = 0.057), or Δ MMR amplitude (R = 0.0507, p = 0.9). SRM did not correlate with OHC survival (Figure 9A; Pearson’s correlation coefficient: R = −0.139, p=0.63), with IHC synapse survival (Figure 9B; R = −0.39, p=0.16), or with IHC survival (data not shown; R = −0.41, p = 0.148).
FIGURE 8 –
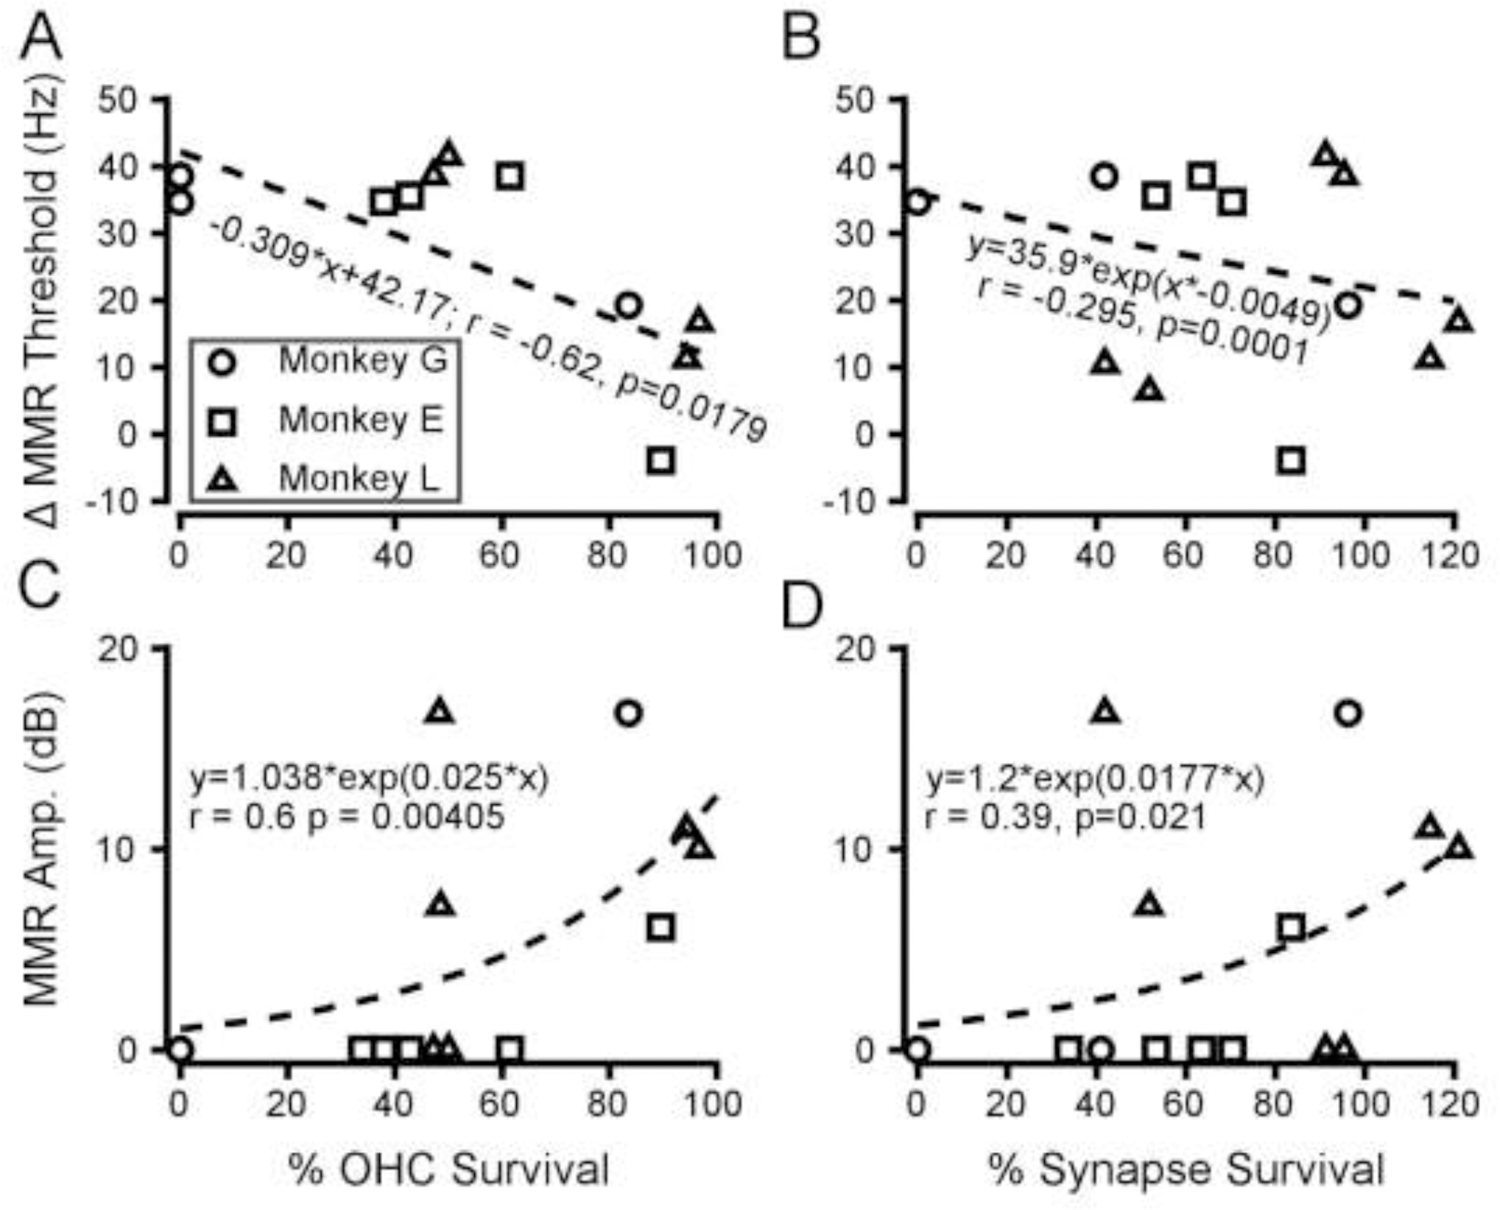
Correlation of modulation masking release with histological changes. (Color available online). A. Between group differences in MMR threshold as a function of outer hair cell survival. B. Between group differences in MMR threshold as a function of ribbons synapse survival. C. MMR amplitude as a function of OHC survival. D. MMR amplitude as a function of ribbon synapse survival. The dashed lines represent the best fitting line as assessed by linear or non-linear regression. Symbols follow conventions in Figure 7. The percentage survival exceeded 100 in some cases due to variability in the mean numbers of ribbon synapses per inner hair cell in control animals.
FIGURE 9 –

Correlation of spatial release of masking with histological changes. (Color available online). A. Maximal SRM (90°) as a function of outer hair cell survival for the three noise-exposed monkeys. B. Maximal SRM as a function of ribbon synapse survival. Symbols and lines follow conventions in Figures 7 and 8.
Although the correlations with MMR suggest a relationship between temporal processing and loss of OHCs and IHC synapses, these histopathological metrics are also correlated. To address this, a mixed effects model was constructed with frequency, IHC, OHC, and synapse survival (SYN) as predictor variables, and each behavioral measure (ΔMMR threshold, MMR amplitude, or SRM) as the dependent variable. In stepwise fashion, interactions that were not statistically significant were removed until only significant ones remained (See Methods section 2.6.5). For the SRM data, all predictors were removed from the model, as none of the histological data, or interactions between them, accounted for variability in SRM. For Δ MMR threshold, the final model contained only OHC and IHC survival: Δ MMR threshold ~ IHC + OHC (R = 0.7893, p = 0.005), but this model’s BIC value was higher than the simple linear regression against OHC loss shown in Figure 8A (109.48 vs. 106.01). The final model for MMR amplitude included quadratic terms (see Methods 2.6.5), interactions between frequency and synapse survival, IHC and OHC survival, OHC and synapse survival, and main effects of IHC and synapse survival: MMR amplitude ~ 1 + Freq*IHC + Freq*SYN + OHC*IHC + OHC*SYN + Freq2 + IHC2 + SYN2 (R = 0.999, p = 0.0006). This model had a much lower BIC value thanthe exponential models in Figure 8C and 8D. The details of the comparisons made between these models can be seen in Table I.
Table I –
Comparing model statistics for non-linear regressions and the multivariate model
| Model | R | p-value | BIC |
|---|---|---|---|
| MMR amp ~ 1 + Freq*IHC + Freq*SYN + OHC*IHC + OHC*SYN + freq2 + IHC2 + SYN2 | 0.999 | 0.0006 | −4.23 |
| Non-linear regression with OHCs | 0.601 | 0.004 | 88 |
| Non-linear regression with SYNs | 0.3774 | 0.02 | 91 |
constructed to account for MMR amplitude.
The histopathological metrics above are all means from the two ears of each monkey. Although there were principled reasons for binaural averaging (see Discussion), it was also of interest to see whether the behavioral results were driven by the better or the worse ear. Thus, for each analysis in Figures 8 and 9, we evaluated two models: one for the lower survival at each frequency in each animal, and a separate model for the better survival. We found no significant correlations between behavioral measures and unilateral histological damage, except for Δ MMR threshold, which correlated with OHC survival in the worse ear (linear regression; R = −0.56, p = 0.043), a notably weaker relationship than with average OHC survival across the two ears (R = −0.6205, p = 0.0179).
4. Discussion
4.1. Comparison with previous studies of MMR
The general finding of MMR (reduced detection thresholds in the presence of an amplitude modulated masker relative to an unmodulated masker) has been replicated in a number of studies and species (humans: Arlinger & Gustaffson, 1991; Bacon et al., 1998; Vestergaard et al., 2011; macaques: Dylla et al., 2013, Hauser et al., 2018; treefrogs: Vélez and Bee, 2011; starlings: Langemann and Klump, 2001; gerbils: Ihlefeld et al., 2016). An important difference between the present experimental design and others, with a few exceptions, was the use of a wide range of masker modulation frequencies (10–150 Hz). Most other studies have used a single modulation frequency, or interruption rate. Using a range of modulation frequencies that captures the full range of masking release gives a measure of temporal sensitivity, both MMR threshold and MMR amplitude. Average MMR threshold in NH macaques (mean: 44.5 Hz, SD: 3.4) suggests a limit to temporal processing of 22.5 ms (44.5 Hz). Interestingly, this resembles data in humans that suggest similar limits in sensitivity to amplitude modulation, and temporal integration (Figure 5, Festen & Plomp, 1981; Experiment 3, Green & Nguyen, 1988; Figure 8E, O’Connor et al., 1999).
The current results are also consistent with reductions of MMR in hearing-impaired human subjects (Festen and Plomp 1990; Bacon et al. 1998; Dubno, Horwitz, and Ahlstrom 2002; Lorenzi et al. 2006). Festen and Plomp (1990) found a reduction of MMR in hearing-impaired subjects, while the hearing-impaired group in Bacon et al. (1998) showed a bimodal distribution with respect to MMR. Some subjects had a noticeably reduced MMR relative to controls, while others were almost equal to that of the control group. But, on average, there was still a notable decrease in MMR. One explanation for the differences in performance could be the differences in audiometric threshold, consistent with the finding in the current study that MMR threshold was correlated with the audiometric threshold shift (Figure 6A); alternatively, these could be attributed to differences in cochlear histopathology, which can be variable among subjects with similar audiograms (Wang et al., 2002; Valero et al., 2017; Chung et al., 1983; Landegger et al., 2016). However, an additional difference was the stimulus used: the MMR measured by Bacon et al., and the majority of these studies, was for speech recognition, in contrast with tone detection in the current study. The spectral and temporal complexities in speech sounds could make a correlation with the audiogram less precise than in the present case, where pure tones were used for characterization of changes in both the audiogram and MMR. Another difference in the present study and the studies of hearing-impaired humans is the method of inducing hearing loss. The present study used a single anesthetized noise-exposure procedure at high sound-pressure level, which obviously differs from the means by which subjects in the aforementioned human studies acquired hearing loss. This difference should be noted when comparing these two types of studies. However, similar results have been achieved using awake noise exposures in macaques (Moody et al., 1978). Despite these caveats, the noise exposure presented here is advantageous in that it facilitates comparison with other mechanistic animal studies that have used noise exposures only a few hours long. Other studies, such as those using long-term noise exposures, cannot be directly compared to the present study. The mechanisms underlying the hearing loss induced by these various types of noise exposure may be different in the two cases.
Stimuli used to assess modulation masking release differ across studies as well. Though many studies used a single masker modulation frequency, there were a few exceptions. Arlinger and Gustaffson (1991) found greatly reduced MMR in the hearing-impaired with masker modulation frequencies of 2–20 Hz. The present results are consistent with this finding; however, MMR thresholds for NH subjects were in the 40–50 Hz range (Figure 1C), suggesting that testing modulation frequencies higher than 20 Hz would be needed to measure the full range of MMR. Another exception is found in Füllgrabe et al. (2006), who tested a wide range of modulation frequencies (2–256 Hz) in a speech identification paradigm and found that 8 Hz provided the largest MMR. The current results are consistent with their results, as correct identification decreased as masker modulation frequency increased beyond 8 Hz. Festen and Plomp (1981) also used a range of masker modulation frequencies, and their reports of MMR resembles the trends reported in the current study.
The anatomical-behavioral correlates presented here are, to the best of the authors’ knowledge, the first in an animal model that correlate with behavioral measures of hearing in complex environments, and contribute to the literature on the relationship between noise-induced cochlear histopathology and behavior (Moody et al., 1978, Ward & Duvall III, 1971, Eldredge & Miller, 1969; Landegger et al., 2016). The current findings also extend these findings by testing the relative explanatory power of multiple statistical models that incorporate interactions between IHC, OHC and synapse loss. The lower BIC value of the multivariate model (Table I) indicates additional explanatory power from interactions among the individual components of the cochlear damage, and unsurprisingly suggests that, despite the two being correlated with MMR amplitude, this perceptual deficit is not a simple product of OHC or IHC synapse loss alone. The finding that mean, but not individual ears’ OHC or synapse survival provided the strongest correlate of behavioral measures of temporal processing provides further evidence for the notion that performance is the product of binaural summation, as others have noted (Heil, 2014). A similar finding was also obtained for the visual system, where two eyes with equal sensitivities produce enhanced performance, and in the case where monocular deficits are present, performance is worse than would be expected if the system could make the best use of the less/undamaged eye (Gilchrist & McIver, 1985; Pardhan et al., 1990).
The correlation between histological and behavioral measures is presented with the caveat that there were substantial differences in survival times following noise-exposure. Despite this variability, and the behavioral evidence (Figure 3) that cochlear degeneration continued following the initial stabilization of the permanent threshold shift (such degenerations would degrade any correlations between behavioral and histological measures), strong histological-behavioral correlations were observed. The strength of this relationship may in fact be underestimated, given the delay between the collection of behavioral and histological data. This suggests that the present results provide meaningful insight into the relationship between perception and cochlear function.
A further question of interest are the mechanisms that underly the frequency-specific correlation between temporal processing and cochlear histopathology reported here. Although this study was not designed to identify those mechanisms, the data are consistent with models of stochastic under-sampling following NIHL (Lopez-Poveda, 2014). This model specifically addresses speech-in-noise perception, but could also be applied to the modulation-masking release data presented here. Namely, under-sampling of the noise waveform at frequency-places exhibiting severe hair cell and synapse loss could result in reduced, or even abolished, MMR. However, at other frequency places where there is virtually no damage (e.g. 1 kHz), MMR would be preserved.
4.2. Comparison with previous studies of SRM
The release of masking observed when signal and masker are spatially separated has been replicated in a number of studies. Freyman et al. (1999) used narrow-band noise as the target signal and found up to 13.8 dB masking release for certain narrowband noises when 60° separation was used. Although 60° separation was not tested in the present study, this value falls nicely between the maximal release reported here, at 45° and 90° (Figure 2C). The masking release also increased as a function of narrowband noise center frequency, consistent with the present results in NH monkeys (Figure 2C). Arbogast et al. (2002) found up to 18.4 dB masking release at 90° separation, which is consistent with the maximal SRM shown here (Figure 2C). However, the stimuli in their study were designed primarily to dissociate the effects of energetic and informational masking. The maximal masking release in that study was found when the target sentence was masked by noise generated by summing six bands of a masker sentence, whose spectrum was outside that of the target sentence. Thus, the masking release in that condition was mainly informational. In the energetic masking condition, more comparable to the results presented here, SRM was only ~7 dB. However, this difference could partially be attributed to the use of a lower level masker (60 dB SPL in the earlier study, compared to the 76 dB SPL used here). Additional differences that could explain the differences in SRM magnitude include the differences in target stimuli (speech vs. pure tones). Bronkhorst and Plomp (1992) also measured SRM for speech and found that the maximum SRM for the NH group was 8 dB. Once again, differences in stimuli complicate the comparison with current results. For example, the masker was 65 dBA noise, modulated to match the envelope fluctuations of the target speech signal. As mentioned in Discussion section 4.1, comparisons with hearing-impaired human subjects are limited by our noise exposure approach, which differs from the long-term exposures in humans with acquired hearing loss. Another concern in synthesizing the present data with the existing literature is the possibility that the spatial hearing deficits observed here were due to asymmetrical thresholds in each ear. As all behavioral data presented here were acquired in free-field, this question can be addressed using ABR threshold. Monkey G and L’s ABR thresholds for each ear were published in Hauser et al., (2018), and displayed < 5 dB asymmetry at and above 2 kHz. However, these data were collected after the initial threshold shift, but before the secondary shift shown here in Figure 3. This secondary shift was presumably caused by progressive degeneration in the cochlea, some of which was asymmetric between the ears. The histological data for each ear are shown in Burton et al. (2020), and the asymmetries are discussed. A legitimate concern is whether the secondary shift and asymmetric cochlear damage undermine the correlations (and lack thereof) with behavior presented here. However, given that the deficits in SRM were not frequency specific, and the deficits in MMR were, changes in the magnitude or asymmetry of the cochlear histopathology (which was presumably always frequency-specific, Figure 7) would not be expected to change the histological-behavioral correlation presented here. Moreover, the SRM deficits were observed before the secondary threshold shift, when the damage to the ears was presumably symmetric (see ABR thresholds in Hauser et al., 2018).
Although few studies of SRM in non-human animals have been conducted, the findings complement available data. Studies in treefrogs have measured SRM using orientation to conspecific vocalizations (Bee, 2008; Nityananda and Bee, 2012). Maximum SRM with 1.3 and 2.6 kHz signals was 3 dB at 90° separation. SRM in pinnipeds better approximated the magnitude we report here (Figure 2C), with a group reporting 19 dB at 90° separation (Holt 2007). Other species have been used to investigate SRM (e.g., zebra finches: Dent et al. 2009; harbor seal: Turnbull, 1994; Guinea pig: Greene et al., 2018), but to the authors’ knowledge, none have measured SRM after experimentally induced cochlear insult.
Despite the methodological differences between studies, these results demonstrate the existence of SRM. And the human literature provides a strong basis for the claim that hearing loss degrades the auditory system’s ability to use spatial cues to segregate auditory objects. The findings here appear to be the first to bridge the gap between human and non-human work.
These results also highlight that the audiogram is not sufficient for predicting performance in realistic environments that provide spatial cues. The lack of correlation between SRM and audiometric threshold changes (Figure 6C) contrasts with other work suggesting that SRM is inversely related to audiometric shift (Marrone et al., 2008, Besser et al., 2015). SRM also did not correlate with measures of cochlear histopathology, which may be because this task requires perceptual segregation of a broadband noise – requiring combination of information across frequency channels in the cochlea. The lack of correlation suggests that NIHL-related changes in spatial processing may be correlated with altered processing in more central structures, though future studies exploring a gradient of noise exposure levels would be needed to fully demonstrate this conclusion. These NIHL-related central changes, such as central gain, have been well-documented in other species (e.g., chinchillas: Brozoski et al., 2002; cats: Seki & Eggermont, 2003; mice: Willot & Lu, 1982), though not in all cases (Shaheen & Liberman, 2018). And, both age-related, as well as pharmacologically induced hearing loss cause central changes, and have been described in macaques (Juarez-Salinas et al., 2010; Schwaber et al., 1993). The reduction in inhibition that central gain reflects could result in deficits in encoding temporal and spatial sound features, as a balance of excitation and inhibition is necessary for encoding amplitude modulation and sound localization cues (Asokan et al., 2018; Shaheen et al., 2015; Shaheen & Liberman, 2018; Caspary et al., 2002; Davis et al., 1999). But significantly less is known about the central changes caused by noise-induced hearing loss in macaques. Studies of potential central correlates of temporary threshold shifts have used basic processing measures, such as audiometric threshold (Lonsbury-Martin & Martin, 1981; Lonsbury-Martin et al., 1987). To our knowledge, the central correlates of NIHL-related deficits in hearing in noisy backgrounds have not been investigated in non-human primates. The finding presented here suggest that further investigation of the central consequences of noise-exposure are warranted, because parsing out which stations of the auditory pathway contribute to perception, and deficits in perception, may prove useful where current clinical diagnostics are lacking.
5. Conclusions
These data demonstrate disruptions of spatial release from masking and modulation masking release due to noise exposure. These novel findings expand what is currently understood about how noise exposure affects hearing in complex environments by the use of multiple masker modulation frequencies, and masker locations. This approach lays the groundwork for future studies investigating the effect of hearing loss on the anatomical, physiological and behavioral mechanisms that may underlie communication sound processing deficits in naturalistic environments. The non-human primate model of NIHL allows precise correlations among anatomy, physiology and behavior (Burton et al., 2018; Burton et al., 2019; Hauser et al., 2018; Valero et al., 2017). The results here serve to extend these findings to spatial and temporal processing, and to establish the corresponding anatomical-behavioral correlations. These correlations appear to be the first to be established for MMR and SRM, and the correlation of MMR with synapse survival suggests it could be a promising behavioral biomarker for other kinds of cochlear histopathology, namely synaptopathy in the absence of hair cell loss.
Highlights.
Temporal and spatial processing measures were compared between non-exposed and noise-exposed macaques
Noise exposures caused permanent threshold shifts and variable cochlear histological changes
Temporal processing deficits were correlated with audiometric and histological changes
Spatial processing deficits were not correlated with audiometric or histological changes
First anatomical-behavioral correlates of measures of temporal and spatial processing
6. ACKNOWLEDGMENTS
The authors would like to thank Mary Feurtado for assistance with all procedures involving anesthesia, as well as Bruce Williams and Roger Williams for fabrication of materials essential to behavioral experiments. The authors would like to thank Dr. Samantha Hauser, Maureen Virts, Namrata Temghare, Rachel Snyder, Amy Stahl, Evan Mercer and Alejandro Tarabillo for assistance with data collection. The authors would like to thank Dr. Allison Leich-Hilbun for exceptional advice on statistical analyses. Many thanks to the Center for Integrative and Cognitive Neuroscience for supporting Chase Mackey. The authors would also like to acknowledge the National Institute on Deafness and Other Communication Disorders and the National Institutes of Mental Health of the National Institutes of Health for funding this research through the following grant support: R01 DC 015988 (MPI: R. Ramachandran and B. Shinn-Cunningham), R01 DC 011092 (PI: Ramnarayan Ramachandran), and T32 MH 064913-17 (PI: Danny Winder). This study was also partly supported by the Vanderbilt Hobbs Discovery Grant to Ramnarayan Ramachandran.
Footnotes
Publisher's Disclaimer: This is a PDF file of an unedited manuscript that has been accepted for publication. As a service to our customers we are providing this early version of the manuscript. The manuscript will undergo copyediting, typesetting, and review of the resulting proof before it is published in its final form. Please note that during the production process errors may be discovered which could affect the content, and all legal disclaimers that apply to the journal pertain.
Author declaration:
The authors hereby declare that they have no conflicts of interest.
REFERENCES
- Arbogast TL, Mason CR, & Kidd G Jr (2002). The effect of spatial separation on informational and energetic masking of speech. The Journal of the Acoustical Society of America, 112(5), 2086–2098. [DOI] [PubMed] [Google Scholar]
- Arlinger S, & Gustafsson HÅ (1991). Masking of speech by amplitude-modulated noise. Journal of sound and vibration, 151(3), 441–445. [DOI] [PubMed] [Google Scholar]
- Bacon SP, Opie JM, & Montoya DY (1998). The effects of hearing loss and noise masking on the masking release for speech in temporally complex backgrounds. Journal of Speech, Language, and Hearing Research, 41(3), 549–563. [DOI] [PubMed] [Google Scholar]
- Bee MA (2008). Finding a mate at a cocktail party: spatial release from masking improves acoustic mate recognition in grey treefrogs. Animal Behaviour, 75(5), 1781–1791. [DOI] [PMC free article] [PubMed] [Google Scholar]
- Besser J, Festen JM, Goverts ST, Kramer SE, & Pichora-Fuller MK (2015). Speech-in-speech listening on the LiSN-S test by older adults with good audiograms depends on cognition and hearing acuity at high frequencies. Ear and hearing, 36(1), 24–41. [DOI] [PubMed] [Google Scholar]
- Best V, Mason CR, & Kidd G Jr (2011). Spatial release from masking in normally hearing and hearing-impaired listeners as a function of the temporal overlap of competing talkers. The Journal of the Acoustical Society of America, 129(3), 1616–1625. [DOI] [PMC free article] [PubMed] [Google Scholar]
- Bohlen P, Dylla M, Timms C, & Ramachandran R (2014). Detection of modulated tones in modulated noise by non-human primates. Journal of the Association for Research in Otolaryngology, 15(5), 801–821. [DOI] [PMC free article] [PubMed] [Google Scholar]
- Bregman AS (1994). Auditory scene analysis: The perceptual organization of sound. MIT press. [Google Scholar]
- Bressler S, Goldberg H, & Shinn-Cunningham B (2017). Sensory coding and cognitive processing of sound in Veterans with blast exposure. Hearing research, 349, 98–110. [DOI] [PMC free article] [PubMed] [Google Scholar]
- Bronkhorst AW, & Plomp R (1992). Effect of multiple speechlike maskers on binaural speech recognition in normal and impaired hearing. The Journal of the Acoustical Society of America, 92(6), 3132–3139. [DOI] [PubMed] [Google Scholar]
- Brozoski TJ, Bauer CA, & Caspary DM (2002). Elevated fusiform cell activity in the dorsal cochlear nucleus of chinchillas with psychophysical evidence of tinnitus. Journal of Neuroscience, 22(6), 2383–2390. [DOI] [PMC free article] [PubMed] [Google Scholar]
- Burton JA, Dylla ME, & Ramachandran R (2018). Frequency selectivity in macaque monkeys measured using a notched-noise method. Hearing research, 357, 73–80. [DOI] [PMC free article] [PubMed] [Google Scholar]
- Burton JA, Valero MD, Hackett TA, & Ramachandran R (2019). The use of nonhuman primates in studies of noise injury and treatment. Journal of the Acoustical Society of America, 146(5): 3770–3789. [DOI] [PMC free article] [PubMed] [Google Scholar]
- Burton JA, Mackey CA, MacDonald KS, Hackett TA, & Ramachandran R (2020). Changes in audiometric threshold and frequency selectivity correlate with cochlear histopathology in macaque monkeys with permanent noise-induced hearing loss. Hearing research. PMCID in progress. [DOI] [PMC free article] [PubMed]
- Carhart R, Tillman TW, & Johnson KR (1968). Effects of interaural time delays on masking by two competing signals. The Journal of the Acoustical Society of America, 43(6), 1223–1230. [DOI] [PubMed] [Google Scholar]
- Caspary DM, Palombi PS, & Hughes LF (2002). GABAergic inputs shape responses to amplitude modulated stimuli in the inferior colliculus. Hearing research, 168(1–2), 163–173. [DOI] [PubMed] [Google Scholar]
- Cherry C (1953). The cocktail party effect. The Journal of the Acoustical Society of America, 25(5), 975–979. [Google Scholar]
- Chung DY, Willson GN, & Gannon RP (1983). Lateral differences in susceptibility to noise damage. Audiology, 22(2), 199–205. [DOI] [PubMed] [Google Scholar]
- Dai L, & Shinn-Cunningham BG (2016). Contributions of sensory coding and attentional control to individual differences in performance in spatial auditory selective attention tasks. Frontiers in Human Neuroscience, 10, 530. [DOI] [PMC free article] [PubMed] [Google Scholar]
- Dai L, Best V, & Shinn-Cunningham BG (2018). Sensorineural hearing loss degrades behavioral and physiological measures of human spatial selective auditory attention. Proceedings of the National Academy of Sciences, 115(14), E3286–E3295. [DOI] [PMC free article] [PubMed] [Google Scholar]
- De Laat JAPM, & Plomp R (1983). The reception threshold of interrupted speech for hearing-impaired listeners. Hearing—Physiological bases and psychophysics (pp. 359–363). Springer, Berlin, Heidelberg. [Google Scholar]
- Dent ML, McClaine EM, Best V, Ozmeral E, Narayan R, Gallun FJ, Kamal Sen, & Shinn-Cunningham BG (2009). Spatial unmasking of birdsong in zebra finches (Taeniopygia guttata) and budgerigars (Melopsittacus undulatus). Journal of Comparative Psychology, 123(4), 357. [DOI] [PMC free article] [PubMed] [Google Scholar]
- Dubno JR, Horwitz AR, & Ahlstrom JB (2002). Benefit of modulated maskers for speech recognition by younger and older adults with normal-hearing. The Journal of the Acoustical Society of America, 111(6), 2897–2907. [DOI] [PubMed] [Google Scholar]
- Dylla M, Hrnicek A, Rice C, & Ramachandran R (2013). Detection of tones and their modification by noise in nonhuman primates. Journal of the Association for Research in Otolaryngology, 14(4), 547–560. [DOI] [PMC free article] [PubMed] [Google Scholar]
- Eldredge DH, Miller JD, (1969). Acceptable noise exposures - damage risk criteria. Noise as a Public Health Hazard. ASHA Reports No.4, 1969, 110–120. [Google Scholar]
- Fernandez KA, Jeffers PW, Lall K, Liberman MC, & Kujawa SG (2015). Aging after noise exposure: acceleration of cochlear synaptopathy in “recovered” ears. J Neurosci, 35(19), 7509–7520. [DOI] [PMC free article] [PubMed] [Google Scholar]
- Festen JM, & Plomp R (1983). Relations between auditory functions in impaired hearing. The Journal of the Acoustical Society of America, 73(2), 652–662. [DOI] [PubMed] [Google Scholar]
- Festen JM, & Plomp R (1990). Effects of fluctuating noise and interfering speech on the speech-reception threshold for impaired and normal-hearing. The Journal of the Acoustical Society of America, 88(4), 1725–1736. [DOI] [PubMed] [Google Scholar]
- Freyman RL, Helfer KS, McCall DD, & Clifton RK (1999). The role of perceived spatial separation in the unmasking of speech. The Journal of the Acoustical Society of America, 106(6), 3578–3588. [DOI] [PubMed] [Google Scholar]
- Freyman RL, Balakrishnan U, & Helfer KS (2001). Spatial release from informational masking in speech recognition. The Journal of the Acoustical Society of America, 109(5), 2112–2122. [DOI] [PubMed] [Google Scholar]
- Füllgrabe C, Berthommier F, & Lorenzi C (2006). Masking release for consonant features in temporally fluctuating background noise. Hearing Research, 211(1–2), 74–84. [DOI] [PubMed] [Google Scholar]
- Gallun FJ, Diedesch AC, Kubli LR, Walden TC, Folmer RL, Lewis MS, McDermott DJ, Fausti SA, Leek MR, 2012. Performance on tests of central auditory processing by individuals exposed to high-intensity blasts. Journal of Rehabilitation Research & Development. 49, 1005–1025. [DOI] [PubMed] [Google Scholar]
- Gates GA, Schmid P, Kujawa SG, Nam BH, & D’Agostino R (2000). Longitudinal threshold changes in older men with audiometric notches. Hear Res, 141(1–2), 220–228. [DOI] [PubMed] [Google Scholar]
- Gelfand SA, Ross L, & Miller S (1988). Sentence reception in noise from one versus two sources: Effects of aging and hearing loss. The Journal of the Acoustical Society of America, 83(1), 248–256. [DOI] [PubMed] [Google Scholar]
- George EL, Festen JM, & Houtgast T (2006). Factors affecting masking release for speech in modulated noise for normal-hearing and hearing-impaired listeners. The Journal of the Acoustical Society of America, 120(4), 2295–2311. [DOI] [PubMed] [Google Scholar]
- Gifford GW, & Cohen YE (2005). Spatial and non-spatial auditory processing in the lateral intraparietal area. Experimental brain research, 162(4), 509–512. [DOI] [PubMed] [Google Scholar]
- Gilchrist J, & McIver C (1985). Fechner’s paradox in binocular contrast sensitivity. Vision research, 25(4), 609–613. [DOI] [PubMed] [Google Scholar]
- Green DM, & Nguyen QT (1988). Profile analysis: Detecting dynamic spectral changes. Hearing Research, 32(2–3), 147–163. [DOI] [PubMed] [Google Scholar]
- Greene NT, Anbuhl KL, Ferber AT, DeGuzman M, Allen PD, & Tollin DJ (2018). Spatial hearing ability of the pigmented Guinea pig (Cavia porcellus): Minimum audible angle and spatial release from masking in azimuth. Hearing research, 365, 62–76. [DOI] [PMC free article] [PubMed] [Google Scholar]
- Greenwood DD 1990A cochlear frequency-position function for several species – 29 years later. The Journal of the Acoustical Society of America, 87, 2591–2605. [DOI] [PubMed] [Google Scholar]
- Pages DS, Ross DA, Puñal VM, Agashe S, Dweck I, Mueller J, Grill WM, Wilson BS, & Groh JM (2016). Effects of electrical stimulation in the inferior colliculus on frequency discrimination by rhesus monkeys and implications for the auditory midbrain implant. Journal of Neuroscience, 36(18), 5071–5083. [DOI] [PMC free article] [PubMed] [Google Scholar]
- Hauser SN, Burton JA, Mercer ET, & Ramachandran R (2018). Effects of noise overexposure on tone detection in noise in nonhuman primates. Hearing research, 357, 33–45. [DOI] [PMC free article] [PubMed] [Google Scholar]
- Heil P (2014). Towards a unifying basis of auditory thresholds: Binaural summation. Journal of the Association for Research in Otolaryngology, 15(2), 219–234. [DOI] [PMC free article] [PubMed] [Google Scholar]
- Hirsh IJ (1950). The relation between localization and intelligibility. The Journal of the Acoustical Society of America, 22(2), 196–200. [Google Scholar]
- Ihlefeld A, Chen YW, & Sanes DH (2016). Developmental conductive hearing loss reduces modulation masking release. Trends in hearing, 20, 1–14. [DOI] [PMC free article] [PubMed] [Google Scholar]
- Landegger LD, Psaltis D, & Stankovic KM (2016). Human audiometric thresholds do not predict specific cellular damage in the inner ear. Hearing Research, 335, 83–93. [DOI] [PMC free article] [PubMed] [Google Scholar]
- Langemann U, & Klump GM (2001). Signal detection in amplitude-modulated maskers. I. Behavioural auditory thresholds in a songbird. European Journal of Neuroscience, 13(5), 1025–1032. [DOI] [PubMed] [Google Scholar]
- Lorenzi C, Gilbert G, Carn H, Garnier S, & Moore BC (2006). Speech perception problems of the hearing-impaired reflect inability to use temporal fine structure. Proceedings of the National Academy of Sciences, 103(49), 18866–18869. [DOI] [PMC free article] [PubMed] [Google Scholar]
- Holt MM, & Schusterman RJ (2007). Spatial release from masking of aerial tones in pinnipeds. The Journal of the Acoustical Society of America, 121(2), 1219–1225. [DOI] [PubMed] [Google Scholar]
- Humes LE (2005). Hearing Loss in the Military: A Report from the National Academies of Science. The Newsletter of the Council for Accreditation in Occupational Hearing Conservation, 17(3). [Google Scholar]
- Krueger C, & Tian L (2004). A comparison of the general linear mixed model and repeated measures ANOVA using a dataset with multiple missing data points. Biological Research for Nursing, 6(2), 151–157. [DOI] [PubMed] [Google Scholar]
- Le Prell CG, Dell S, Hensley B, Hall JW III, Campbell KC, Antonelli PJ, Green GE, Miller JM & Guire K (2012). Digital music exposure reliably induces temporary threshold shift (TTS) in normal-hearing human subjects. Ear and hearing, 33(6), 44. [DOI] [PMC free article] [PubMed] [Google Scholar]
- Lew HL, Poole JH, Vanderploeg RD, Goodrich GL, Dekelboum S, Guillory SB, Sigford BS & Cifu DX (2007). Program development and defining characteristics of returning military in a VA Polytrauma Network Site. Journal of Rehabilitation Research & Development, 44(7). [PubMed] [Google Scholar]
- Lonsbury-Martin BL, & Martin GK (1981). Effects of moderately intense sound on auditory sensitivity in rhesus monkeys: behavioral and neural observations. Journal of Neurophysiology, 46(3), 563–586. 10.1152/jn.1981.46.3.563 [DOI] [PubMed] [Google Scholar]
- Lonsbury-Martin BL, Martin GK, & Bohne BA (1987). Repeated TTS exposures in monkeys: Alterations in hearing, cochlear structure, and single-unit thresholds. The Journal of the Acoustical Society of America, 81(5), 1507–1518. [DOI] [PubMed] [Google Scholar]
- Marrone N, Mason CR, & Kidd G Jr (2008). The effects of hearing loss and age on the benefit of spatial separation between multiple talkers in reverberant rooms. The Journal of the Acoustical Society of America, 124(5), 3064–3075. [DOI] [PMC free article] [PubMed] [Google Scholar]
- Moody DB, Stebbins WC, Hawkins JE, & Johnsson LG (1978). Hearing loss and cochlear pathology in the monkey (Macaca) following exposure to high levels of noise. Archives of Oto-Rhino-Laryngology, 220(1–2), 47–72. [DOI] [PubMed] [Google Scholar]
- Ng CW, Navarro X, Engle JR, & Recanzone GH (2015). Age-related changes of auditory brainstem responses in nonhuman primates. Journal of neurophysiology, 114(1), 455–467. [DOI] [PMC free article] [PubMed] [Google Scholar]
- Niwa M, Johnson JS, O’Connor KN, & Sutter ML (2012). Activity related to perceptual judgment and action in primary auditory cortex. Journal of Neuroscience, 32(9), 3193–3210. [DOI] [PMC free article] [PubMed] [Google Scholar]
- Nelken I, Rotman Y, & Yosef OB (1999). Responses of auditory-cortex neurons to structural features of natural sounds. Nature, 397(6715), 154. [DOI] [PubMed] [Google Scholar]
- O’Connor KN, Barruel P, Hajalilou R, & Sutter ML (1999). Auditory temporal integration in the rhesus macaque (Macaca mulatta). The Journal of the Acoustical Society of America, 106(2), 954–965. [DOI] [PubMed] [Google Scholar]
- Pardhan S, Gilchrist J, Douthwaite W, & Yap M, (1990). Binocular inhibition: psychophysical and electrophysiological evidence. Optometry and vision science: official publication of the American Academy of Optometry, 67(9), 688–691. [DOI] [PubMed] [Google Scholar]
- Rocchi F, Dylla ME, Bohlen PA, & Ramachandran R (2017). Spatial and temporal disparity in signals and maskers affects signal detection in non-human primates. Hearing research, 344, 1–12. [DOI] [PMC free article] [PubMed] [Google Scholar]
- Saberi K, Dostal L, Sadralodabai T, Bull V, & Perrott DR (1991). Free-field release from masking. The Journal of the Acoustical Society of America, 90(3), 1355–1370. [DOI] [PubMed] [Google Scholar]
- Schink T, Kreutz G, Busch V, Pigeot I, & Ahrens W (2014). Incidence and relative risk of hearing disorders in professional musicians. Occup Environ Med, 71(7), 472–476. [DOI] [PMC free article] [PubMed] [Google Scholar]
- Schwaber MK, Garraghty PE, & Kaas JH (1993). Neuroplasticity of the adult primate auditory cortex following cochlear hearing loss. AMERICAN JOURNAL OF OTOLOGY, 14, 252-252. [PubMed] [Google Scholar]
- Seixas NS, Neitzel R, Stover B, Sheppard L, Feeney P, Mills D, & Kujawa S (2012). 10-Year prospective study of noise exposure and hearing damage among construction workers. Occup Environ Med, 69(9), 643–650. [DOI] [PMC free article] [PubMed] [Google Scholar]
- Seki S, & Eggermont JJ (2003). Changes in spontaneous firing rate and neural synchrony in cat primary auditory cortex after localized tone-induced hearing loss. Hearing research, 180(1–2), 28–38. [DOI] [PubMed] [Google Scholar]
- Shaheen LA, & Liberman MC (2018). Cochlear synaptopathy changes sound-evoked activity without changing spontaneous discharge in the mouse inferior colliculus. Frontiers in systems neuroscience, 12. [DOI] [PMC free article] [PubMed] [Google Scholar]
- Stebbins WC (1982). Concerning the need for more sophisticated animal models in sensory behavioral toxicology. Environmental health perspectives, 44, 77–85. [DOI] [PMC free article] [PubMed] [Google Scholar]
- Richards DG, & Wiley RH (1980). Reverberations and amplitude fluctuations in the propagation of sound in a forest: implications for animal communication. The American Naturalist, 115(3), 381–399. [Google Scholar]
- Turnbull SD (1994). Changes in masked thresholds of a harbour seal (Phoca vitulina) associated with angular separation of signal and noise sources. Canadian Journal of Zoology, 72(11), 1863–1866. [Google Scholar]
- Valero MD, Burton JA, Hauser SN, Hackett TA, Ramachandran R, & Liberman MC (2017). Noise-induced cochlear synaptopathy in rhesus monkeys (Macaca mulatta). Hearing research, 353, 213–223. [DOI] [PMC free article] [PubMed] [Google Scholar]
- Vélez A, & Bee MA (2011). Dip listening and the cocktail party problem in grey treefrogs: signal recognition in temporally fluctuating noise. Animal Behaviour, 82(6), 1319–1327. [DOI] [PMC free article] [PubMed] [Google Scholar]
- Vélez A, Höbel G, Gordon NM, & Bee MA (2012). Dip listening or modulation masking? Call recognition by green treefrogs (Hyla cinerea) in temporally fluctuating noise. Journal of Comparative Physiology, 198(12), 891–904. [DOI] [PMC free article] [PubMed] [Google Scholar]
- Vestergaard MD, Fyson NR, & Patterson RD (2011). The mutual roles of temporal glimpsing and vocal characteristics in cocktail-party listening. The Journal of the Acoustical Society of America, 130(1), 429–439. [DOI] [PubMed] [Google Scholar]
- Nityananda V, & Bee MA (2012). Spatial release from masking in a free-field source identification task by gray treefrogs. Hearing research, 285(1–2), 86–97. [DOI] [PMC free article] [PubMed] [Google Scholar]
- Ward WD, & Duvall AJ III (1971). Behavioral and ultrastructural correlates of acoustic trauma. Annals of Otology, Rhinology & Laryngology, 80(6), 881–896. [DOI] [PubMed] [Google Scholar]
- Wang Y, Hirose K, & Liberman MC (2002). Dynamics of noise-induced cellular injury and repair in the mouse cochlea. Journal of the Association for Research in Otolaryngology, 3(3), 248–268. [DOI] [PMC free article] [PubMed] [Google Scholar]
- Willott JF, & Lu SM (1982). Noise-induced hearing loss can alter neural coding and increase excitability in the central nervous system. Science, 216(4552), 1331–1334. [DOI] [PubMed] [Google Scholar]
- Yost WA (1991). Auditory image perception and analysis: The basis for hearing. Hearing research, 56(1–2), 8–18. [DOI] [PubMed] [Google Scholar]