

Abstract
Summary
Electronic health records (EHRs) linked with a DNA biobank provide unprecedented opportunities for biomedical research in precision medicine. The Phenome-wide association study (PheWAS) is a widely used technique for the evaluation of relationships between genetic variants and a large collection of clinical phenotypes recorded in EHRs. PheWAS analyses are typically presented as static tables and charts of summary statistics obtained from statistical tests of association between a genetic variant and individual phenotypes. Comorbidities are common and typically lead to complex, multivariate gene–disease association signals that are challenging to interpret. Discovering and interrogating multimorbidity patterns and their influence in PheWAS is difficult and time-consuming. We present PheWAS-ME: an interactive dashboard to visualize individual-level genotype and phenotype data side-by-side with PheWAS analysis results, allowing researchers to explore multimorbidity patterns and their associations with a genetic variant of interest. We expect this application to enrich PheWAS analyses by illuminating clinical multimorbidity patterns present in the data.
Availability and implementation
A demo PheWAS-ME application is publicly available at https://prod.tbilab.org/phewas_me/. Sample datasets are provided for exploration with the option to upload custom PheWAS results and corresponding individual-level data. Online versions of the appendices are available at https://prod.tbilab.org/phewas_me_info/. The source code is available as an R package on GitHub (https://github.com/tbilab/multimorbidity_explorer).
Supplementary information
Supplementary data are available at Bioinformatics online.
1 Introduction
Large-scale biobanks combined with electronic health records (EHRs) are increasingly available for clinical and translational research around the world (Chen et al., 2011; Cho et al., 2012; Gaziano et al., 2016; McCarty et al., 2011; Sudlow et al., 2015; The All of Us Research Program Investigators, 2019). These data platforms typically provide subject-level information on a wide range of biomarkers along with detailed phenotype data and provide a highly anticipated paradigm shift for clinical and translational research in the era of precision medicine. The Phenome Wide Association Study is a statistical method to find associations across phenomes in the EHR with a given biomarker (e.g. SNPs). Phenome-wide association study (PheWAS) quantifies associations between single SNP–phenotype pairs, which are blind to complex correlation structures present in phenotypes. When multiple phenotypes show a strong association with a genetic variant, researchers rely on domain expertise and more extensive interrogation of the data to determine potential causes. These include driver phenotypes (e.g. patients with a common disease taking a drug and then experiencing a common drug side effect), phenotype hierarchy, related diseases with an overlapping set of patients, or merely people with multiple diseases. Here we present PheWAS Multimorbidity Explorer (PheWAS-ME), a web application built using the programing language R and the Shiny library (Chang et al., 2018). PheWAS-ME allows researchers to interact with PheWAS results alongside the individual-level phenotype and genotype data that generated them. By visualizing individual-level data along with statistical results, the application provides a rich and explorable view into the patterns and relationships between phenotypes and the genotype being investigated. The interactive nature of the tool lets users enhance their interrogation of comorbidity patterns by delving into areas of interest on the phenome, such as a disease category, with custom visualizations. See Supplementary Appendix SB for a demonstration of the use of PheWAS-ME to parse the results of a PheWAS analysis to find novel phenotype associations.
2 Implementation
Data needed to run PheWAS-ME are a standard PheWAS result table and the corresponding individual-level data. These results can be supplied to the app via a data loading screen or pre-loaded (see Supplementary Appendix SC for full requirements). If desired, multiple comparisons correction can be performed on loaded data using either the Bonferroni (Dunn, 1961) or Benjamini-Hochberg (Benjamini and Hochberg, 1995) methods.
After data are loaded, the app directs to the main visualization and analysis interface—an interactive dashboard including four views: SNP information, an interactive PheWAS Manhattan plot, multimorbidity UpSet plot and a subject-phenotype bipartite network plot.
2.1 Application state
PheWAS-ME works by filtering down to a list of ‘selected’ phenotypes. When a set of phenotypes is selected, the individual-level data are subset to just subjects who had one or more of the selected phenotypes in their records. This allows users to easily discard uninteresting or noisy phenotypes and focus in on potentially meaningful patterns using criteria like strength of the statistical association or phenotype category.
2.2 SNP information panel
To provide context to the currently investigated SNP, the application provides a panel containing summary information (Fig. 1A). Minor allele frequency in the provided subject population and the currently selected subset are shown as a bar chart. If the SNP of interest is present in an internal SNP annotation table sourced from dbSNP (Sherry et al., 2001) and VEP (McLaren et al., 2016), then additional information such as the minor allele, chromosome and gene are provided.
Fig. 1.
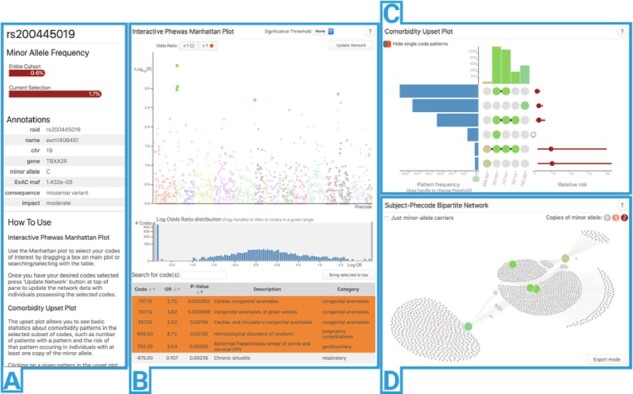
Screenshot of PheWAS-ME running on SNP rs200445019
2.3 Interactive PheWAS Manhattan plot
A Manhattan plot (Fig. 1B) is provided for the results of the PheWAS analysis (Denny et al., 2010). The x and y axis of this plot are phenotype diagnosis and statistical significance, respectively. Additional metadata from the supplied results table—such as name, description and statistical results for a phenotype—are accessible by hovering over a phenotype’s point in the plot. Phenotypes can be selected for individual-level-data inspection by any combination of clicking, dragging a selection box and searching in a table view below the plot. A histogram of the log-odds ratios for all phenotypes is provided and can be used to filter codes by ranges of association strength and direction.
2.4 Multimorbidity UpSet plot
Figure 1C is an UpSet plot (Lex et al., 2014). This plot shows the unique multimorbidity patterns seen in the individual-level data for the currently selected phenotypes as a matrix with columns as phenotypes and patterns (represented by filled phenotype columns) as rows. On the left side of the plot is a bar chart displaying how many subjects had a multimorbidity pattern. To the right is a point estimate and 95% confidence interval of each pattern’s relative risk of occurring given that the subject has the given genetic variant of interest [calculated using Fisher’s exact test (Fisher, 1992)]. When a pattern is selected, the subjects who have the pattern are highlighted in the network plot (Fig. 1D). Hovering over a phenotype’s column displays its name and description, supporting the quick examination of multimorbidity pattern membership. For more details on the upset plot, we refer the reader to the original UpSet publication (Lex et al., 2014).
2.5 Subject–phenotype bipartite network
Individual-level data are visualized directly as a bipartite network. Phenotypes are represented as larger nodes (colored to match their point in the Manhattan and upset plots) and subjects are represented as smaller nodes (colored by their number of copies of the SNP minor allele). A link is drawn between subjects and phenotypes if a subject was diagnosed with a phenotype. A physics-based layout simulation (Bostock et al., 2011) is run in real-time as the data are filtered to position nodes with similar connection patterns close to each other. As the user investigates the network structure, phenotype nodes can be selected and isolated or removed from within the plot. An optional filtering mode limits the network to only subjects with one or more copies of the SNP’s minor allele, allowing investigation of genetics-driven patterns. An ‘export mode’ button lets the user download a high-resolution copy of the plot with optional phenotype labels for use in publications. Greater detail of each section of PheWAS-ME is available via in-app help pages and the meToolkit package usage manual (see Supplementary Appendix SC).
3 Conclusion
In this article, we have provided a brief introduction to the application PheWAS Multimorbidity Explorer. This application takes PheWAS results and individual-level data, and enables researchers interactively explore complex multimorbidity patterns in PheWAS analyses.
Funding
This work was supported by funding from National Institutes of Health’s National Center for Advancing Translational Sciences [TR002243] and the Vanderbilt University Department of Biostatistics Development Award.
Conflict of Interest: none declared.
Supplementary Material
Contributor Information
Nick Strayer, Department of Biostatistics, Vanderbilt University, Nashville, TN 37203, USA.
Jana K Shirey-Rice, Department of Medical Administration, Vanderbilt University School of Medicine, Nashville, TN 37232, USA.
Yu Shyr, Department of Biostatistics, Vanderbilt University, Nashville, TN 37203, USA.
Joshua C Denny, Department of Biomedical Informatics, Vanderbilt University, Nashville, TN 37203, USA; Department of Medicine, Vanderbilt University School of Medicine, Nashville, TN 37232, USA.
Jill M Pulley, Department of Medical Administration, Vanderbilt University School of Medicine, Nashville, TN 37232, USA; Department of Medicine, Office of Research, Vanderbilt University School of Medicine, Nashville, TN 37232, USA.
Yaomin Xu, Department of Biostatistics, Vanderbilt University, Nashville, TN 37203, USA; Department of Biomedical Informatics, Vanderbilt University, Nashville, TN 37203, USA.
References
- Benjamini Y., Hochberg Y. (1995) Controlling the false discovery rate: a practical and powerful approach to multiple testing. J. R. Stat. Soc. Ser. B, 57, 289–300. [Google Scholar]
- Bostock M. et al. (2011) D$^3$data-driven documents. IEEE Trans. Vis. Comput. Graph., 17, 2301–2309. [DOI] [PubMed] [Google Scholar]
- Chang, W; Cheng J; Allaire J; Xie Y; McPherson, J; and Others. 2017. Shiny: Web Application Framework for R. R Package Version 1 (5).1 (5). [Google Scholar]
- Chen Z. et al. ; on behalf of the China Kadoorie Biobank (CKB) Orative Group. (2011) China Kadoorie Biobank of 0.5 million people: survey methods, baseline characteristics and long-term follow-up. Int. J. Epidemiol., 40, 1652–1666. [DOI] [PMC free article] [PubMed] [Google Scholar]
- Cho S.Y. et al. (2012) Opening of the national biobank of Korea as the infrastructure of future biomedical science in Korea. Osong Public Health Res. Perspect., 3, 177–184. [DOI] [PMC free article] [PubMed] [Google Scholar]
- Denny J.C. et al. (2010) PheWAS: demonstrating the feasibility of a phenome-wide scan to discover gene–disease associations. Bioinformatics, 26, 1205–1210. [DOI] [PMC free article] [PubMed] [Google Scholar]
- Dunn O.J. (1961) Multiple comparisons among means. J. Am. Stat. Assoc., 56, 52–64. [Google Scholar]
- Fisher, R.A. (1992) Statistical Methods for Research Workers. In Breakthroughs in Statistics: Methodology and Distribution, edited by Samuel Kotz and Norman L. Johnson, 66–70. New York, NY: Springer.
- Gaziano J.M. et al. (2016) Million Veteran Program: a mega-biobank to study genetic influences on health and disease. J. Clin. Epidemiol., 70, 214–223. [DOI] [PubMed] [Google Scholar]
- Lex A. et al. (2014) UpSet: visualization of intersecting sets. IEEE Trans. Vis. Comput. Graph., 20, 1983–1992. [DOI] [PMC free article] [PubMed] [Google Scholar]
- McCarty C.A. et al. ; The eMERGE Team. (2011) The eMERGE Network: a consortium of biorepositories linked to electronic medical records data for conducting genomic studies. BMC Med. Genomics, 4, 13. [DOI] [PMC free article] [PubMed] [Google Scholar]
- McLaren W. et al. (2016) The ensembl variant effect predictor. Genome Biol., 17, 122. [DOI] [PMC free article] [PubMed] [Google Scholar]
- Sherry S.T. et al. (2001) DbSNP: the NCBI database of genetic variation. Nucleic Acids Res., 29, 308–311. [DOI] [PMC free article] [PubMed] [Google Scholar]
- Sudlow C. et al. (2015) UK biobank: an open access resource for identifying the causes of a wide range of complex diseases of middle and old age. PLoS Med., 12, e1001779. [DOI] [PMC free article] [PubMed] [Google Scholar]
- The All of Us Research Program Investigators. (2019) The ‘All of Us’ research program. N. Engl. J. Med., 381, 668–676. [DOI] [PMC free article] [PubMed] [Google Scholar]
Associated Data
This section collects any data citations, data availability statements, or supplementary materials included in this article.