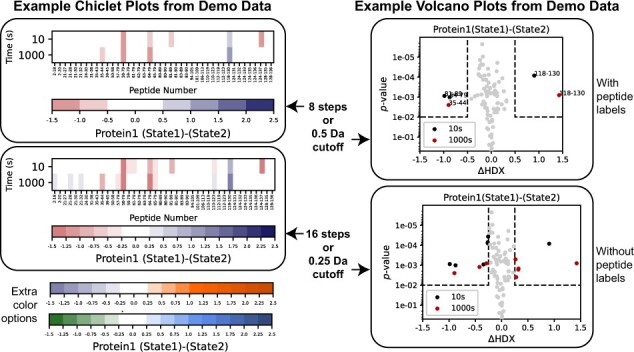
Fig. 1.

Example chiclet and volcano plots generated with demo data on HD-eXplosion. The top plots have equivalent statistical filters; P-value < 0.01 and a difference in deuterium uptake greater than |0.5|Da. The bottom plots also have equivalent statistical filters; P-value < 0.01 and a difference in deuterium uptake great than |0.25|Da. Some customization options are demonstrated. For example, alternative color schemes for the chiclet plot and peptide labels for the volcano plot. The demo data can be downloaded from the website
