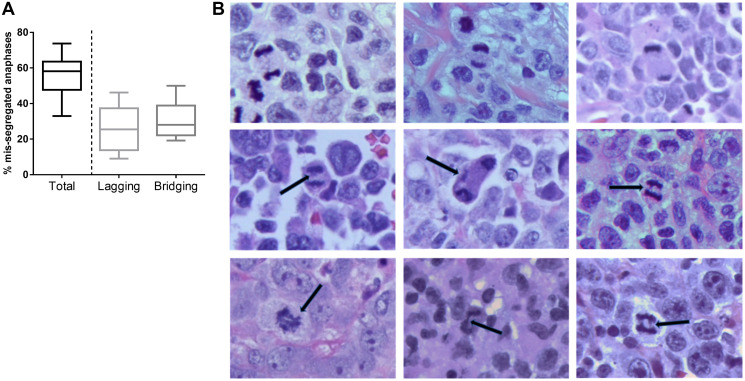
Figure 1. Chromosomal instability in PTCL.
(A) A box-and-whiskers graph showing frequency of cells which exhibit mis-segregated chromosomes during anaphase (median, 25th/75th quartiles, min/max). (B) Images of H&E–stained T-cell lymphoma tissues showing anaphase. Representative examples of normal anaphase (top row), anaphase with lagging chromosomes (middle row), and chromatin bridges (bottom row) are shown. Scale bar, 5 μm.

