

Abstract
Background
Cisplatin‐based chemotherapy is a therapeutic strategy against non‐small cell lung cancer (NSCLC). However, cancers relapse after chemotherapy due to a dormant state of residual cancer cells. Extracellular vesicles and particles (EVPs) are active carriers of proteins and nucleic acid. Here, we aimed to study the molecular alterations and proteomic characteristics of EPV in dormant and reactivated cancer cells induced by cisplatin.
Methods
We used a short‐term single dose of cisplatin to induce the dormant and reactivated cell status. We examined the gene expressional profiling and proteomic profiling of EVPs from dormant and reactivated cancer cells by RNA‐sequencing and LC–MS/MS.
Results
We found substantial changes in gene expression and protein level in EVP. The genes with higher expression in dormant cancer cells were lipid transporter‐ and lipid metabolic‐related genes. A total of 111 EVP proteins were upregulated in dormant cancer cells compared to those in control cells. Fifty differential expressed proteins (DEPs) were identified in EVPs from reactivated cancer cells compared to those in dormant cancer cells. Among the DEPs, we found that apolipoproteins such as APOA1 and APOE were significantly increased in dormant cancer cell‐derived EVPs. Integration of EVP proteomes with transcriptional profiles of cancer cells revealed that the proteomic profiling of EVP derived from cancer cells can reflect the cellular status of cancer cells, which showed an activated lipid metabolism in dormant state.
Conclusion
Lipoproteins enriched in EVPs reflect the activated lipid metabolism in dormant cancer cells and may provide potential biomarkers or therapeutic targets for cisplatin‐based therapy.
Keywords: biomarker, cancer, extracellular vesicles, non small cell lung cancer, proteomic
Integration of EVP proteomes with transcriptional profiles revealed that the proteomic profiling of EVP derived from cancer cells can reflect the cellular status of cancer cells, which showed an activated lipid metabolism in dormant state induced by chemotherapy. It may provide potential biomarkers or therapeutic targets for cisplatin‐based therapy.

INTRODUCTION
Lung cancer is the leading cause of cancer‐related death worldwide. Cisplatin‐based chemotherapy is a first‐line agent for non‐small cell lung cancer (NSCLC) patients. Cisplatin kills most cancer cells; however, the residual cells enter into a dormant state and develop drug resistance. The surviving cancer cells transform into a highly mobile and metastatic dormant phenotype. The dormant cancer cells can be reactivated and reinitiate cell proliferation under specific circumstances.1 Chemotherapy‐induced dormant cancer cells are the sources of relapse and long distant metastasis. During the dormant state, cancer cells remain quiescent and are not easily detected. Proteomic profiling of the dormant cancer cells has been proven to be a convenient and efficient way to identify predictive biomarker and therapeutic targets.2
Cancer cell‐secreted molecules can not only remodel the local microenvironment, but also manipulate distant tissues to facilitate future metastasis.3 Extracellular vesicles and particles (EVPs) are considered to be active carriers of biomarkers and mediators of intercellular communication.4 Exosomes are a kind of extracellular vehicle (EV) of a small size that are released by all cells into the extracellular space.5 Exosomes carry various type of molecules including DNA, mRNA, non‐coding RNA, lipid and proteins and mediate cell‐to‐cell communication. Exosomal proteins possess unique features over traditional serological markers because of higher sensitivity, specificity and stability.6 Cancer cells generally produce more exosome than normal cells.7 Tumor‐derived exosomes are enriched in specific molecules that discriminate from nonmalignant cells.8 Extracellular particles (EPs) are small protein‐nucleic‐acid complexes that are membrane‐bound.4 Lipoproteins such as HDL, LDL, VLDL are lipid particles which are also regarded as DNA and protein carriers.9 EVs and lipoproteins overlap in size distributions and are always coisolated from serum.10, 11 EVP proteins can distinguish tumors from normal tissues with significant sensitivity and specificity. The molecular profiles of EVPs represent partly, but not completely, that of the parental cells.12 Some studies suggest that there is a substantial difference between EVP profiles and that of parental cells.13, 14 Further studies are required to investigate to what extent that EVP molecular profiles represent cancer cell status.
In this study, we compared the proteomic profiles of dormant or reactivated lung cancer cell‐derived EVPs and transcriptomic profiles of cancer cells. We found that the core regulatory pathway in cancer cells affected the protein profiles of EVPs. The highly expressed lipoproteins in EVPs reflected the activated lipid metabolism in dormant cancer cells. The positive regulation of cell proliferation were enriched in the reactivated cancer cells. The activated lipid metabolism may provide the building blocks necessary for the following cancer cell proliferation in activated state. It is therefore suggested that cancer cell‐derived EVPs may be used as biomarkers for drug‐induced dormancy and reactivation.
METHODS
Extraction of EVPs
The exosome‐free serum was prepared according to the procedure previously described in the literature.15 The serum were ultracentrifuged at 1 × 10⁵ g (Beckman Coulter Avanti J‐30I) at 4°C for 16 h to remove the exosome in the serum, followed by filtering through 0.22 μm filters (Millipore). A549 cells were cultured in RPMI1640 (SH30809.01B, Hyclone) complete medium (including 10% serum) (04–001‐1ACS, BI). When cells grew at about 80% confluence, the medium was changed to RPMI1640 with exosome‐free serum. After replacing the medium, A549 cells were cultured for an additional 48 h and the medium was collected for exosome isolation. For the dormant cancer cells, A549 cells were treated with 7 μg/ml. Two days after treatment, the cells were at about 40%–50% confluence. The medium with cisplatin was changed and the remaining cells were cultured for an additional 14 days. The medium was replaced by medium with exosome‐free serum. Two days after treatment, the medium was then collected for EVP isolation. For the reactivated cancer cells, the survival dormant cancer cells were cultured for an additional 16 days and the cells reinitiated to proliferate. When the cells were at 80% confluence, the medium was replaced by medium with exosome‐free serum. Two days after treatment, the medium was then collected for EVP purification .
The medium was separated by differential centrifugation of 300 g for 10 min, 2000 g for 15 min, and 12 000 g for 30 min to remove floating cells and cellular debris. The medium was then centrifuged at 4000 g for 1 h and concentrated to 0.5 ml at 4°C after passing through a filter of 0.22 μm. Finally, the EXO Quick‐TC exosome isolation reagent (EXOTC50A‐1, System Biosciences) was added to the concentrated solution at a ratio of 1:5. After mixing well, the product was then left standstill at 4°C for 12 h, followed by centrifugation at 1500 g for 30 min at 4°C. The supernatant was discarded and the precipitation was resuspended with 20–100 μl PBS.
Transmission electron microscopy (TEM)
Extracted EVPs were fixed in 1% dialdehyde for 10 min and washed with deionized water. Then, 10 μl of exosome suspension was placed on formvar carbon‐coated 300 mesh copper electron microscopy grids (Agar Scientific Ltd.) and incubated at room temperature for 5 min. The EVPs were negatively stained with 2% uranyl oxalate for 1 min at room temperature and then washed three times with PBS before being dried at room temperature. Images were obtained by microscopy TEM (JEM‐2100).
Size of the EVP analysis
EVPs were resuspended in 1 ml PBS and analyzed using NANO ZS 90 (Zetasizer Nano ZS90 instruments) according to the manufacturerʼs instructions. All samples were measured with parameters of 44.5 mm and 0.64 V voltage using NP100 membranes. Data was analyzed by Zetasizer software (Malvern Instruments) which was optimized to identify and track each particle on a frame‐by‐frame basis.
Western blot analysis
The protein lysate used for western blotting was extracted using mRIPA buffer (Biotime) containing protease inhibitors (Roche). Proteins were quantified using the BCA protein assay kit (Pierce). A western blot system was set up using a Bio‐Rad Bis‐Tris Gel system, according to the manufacturer's instructions (Bio‐Rad, CA). The cell protein lysates were separated on 10% SDS‐polyacrylamide gels and electrophoretically transferred to polyvinylidenedifluoride membranes (Millipore). The primary antibody solution was prepared in 5% blocking buffer. Primary antibodies against CD63, HSP90 (Cell Signaling Technology) were incubated with the membrane at 4°C overnight, followed by a brief wash and incubation with secondary antibody for 1 h at room temperature. Finally, a 40:1 solution of peroxide and luminol was added to cover the blot surface for 5 min at room temperature. The chemiluminescent signals were captured, and the intensity of the bands was quantified using a Bio‐Rad ChemiDoc XRS system (Bio‐Rad).
Trypsin digestion
For digestion, the protein solution was reduced with 5 mM dithiothreitol for 30 min at 56°C and alkylated with 11 mM iodoacetamide for 15 min at room temperature in darkness. The protein sample was then diluted by adding 100 mM TEAB to urea concentration less than 2 M. Filter aided sample preparation (FASP) was used to remove any impurities such as urea. Finally, trypsin was added at 1:50 trypsin‐to‐protein mass ratio for 12 h.
TMT labeling
Tryptic peptides were dissolved in 0.5 M TEAB. Each channel of peptide was labeled with their respective TMT reagent (according to the manufacturer's protocol; ThermoFisher Scientific), and incubated for 2 h at room temperature. Then, 5 μl of each sample were pooled, desalted and analyzed by MS to check labeling efficiency. Samples were then quenched by adding 5% hydroxylamine. The pooled samples were desalted with Strata X C18 SPE column (Phenomenex) and dried using vacuum centrifugation. The labeling information is shown in Table 1.
TABLE 1.
Labeling information
| Sample groups | Labeling information |
|---|---|
| A1 | 126 |
| A2 | 127C |
| A3 | 128N |
| B1 | 128C |
| B2 | 129N |
| B3 | 129C |
| C1 | 130N |
| C2 | 130C |
| C3 | 131 |
Note: Medians of TMT ratios for mixing equal amounts of TMT labeled peptides.
HPLC fractionation
Using high pH reverse‐phase HPLC with Agilent 300Extend C18 column (5 μm particles, 4.6 mm ID, 250 mm length), 200 μg of the above labeled sample was fractionated. The wavelength was set to 214 nm and column oven temperature was set to 35°C. Then, 95% buffer A (2% ACN, pH 9.0 adjusted by ammonia) and 5% buffer B (98% ACN, pH 9.0 adjusted by ammonia) were used to equilibrate the column for at least 30 min. Then, 1 ml of buffer A was added to the peptide sample which was vortexed in order to dissolve it. It was then centrifuged at 12 000 g for 5 min and transferred to a new tube followed by further centrifugation with supernatant added. The sample was then loaded to the HPLC, the method selected to separate the sample and automatic fraction collector started. The samples were collected at 1 min/tube intervals and from the 11th to the 64th tubes with a total of 54 tubes. Finally, the peptides were combined into 10 fractions and dried using a vacuum centrifuge.
LC–MS/MS analysis
The tryptic peptides were dissolved in 0.1% formic acid (solvent A), and directly loaded onto a home‐made reversed‐phase analytical column (15‐cm length, 75 μm i.d.). The gradient was comprised of an increase from 6% to 23% solvent B (0.1% formic acid in 98% acetonitrile) over 26 min, 23% to 35% in 8 min and climbing to 80% in 3 min then holding at 80% for the last 3 min, all at a constant flow rate of 400 nl/min on an EASY‐nLC 1000 UPLC system.
The peptides were subjected to NSI source followed by tandem mass spectrometry (MS/MS) in Q ExactiveTM Plus (Thermo) coupled online to the UPLC. The electrospray voltage applied was 2.0 kV. The m/z scan range was 350 to 1800 for full scan, and intact peptides were detected in the Orbitrap at a resolution of 70 000. Peptides were then selected for MS/MS using NCE setting as 28 and the fragments were detected in the Orbitrap at a resolution of 17 500. A data‐dependent procedure alternated between one MS scan followed by 20 MS/MS scans with 15.0 s dynamic exclusion. Automatic gain control (AGC) was set at 5E4. Fixed first mass was set as 100 m/z. The raw data was analyzed using MaxQuant 1.5.2.8 against Human SwissProt databases.
RNA sequencing
RNA sequencing analysis was performed using BGISEQ‐500 platform (BGI). Total RNA was isolated and a cDNA library was constructed. High‐quality clean reads were aligned to the human reference genome using Bowtie2. The expression levels for each of the genes were normalized as fragments per kilobase of exon model per million mapped reads (FPKM) by expectation maximization (RSEM).
Protein–protein interaction (PPI) network analysis
The protein–protein interaction (PPI) network was analyzed using STRING and R. The differentially expressed genes were input into the STRING database. STRING defines a metric called “confidence score” to define interaction confidence. All interactions were identified with a confidence score ≥ 0.7 (high confidence). The interaction network formed in STRING was visualized in Cytoscape (http://www.cytoscape.org/, v.3.1).
Bioinformatic methods
Gene ontology (GO) proteome annotation was performed using the UniProt‐GOA database.
(www. http://www.ebi.ac.uk/GOA/).The proteins were then classified by GO annotation based on three categories: biological process, cellular component and molecular function. For each category, a two‐tailed Fisher's exact test was employed to test the enrichment of the differentially expressed protein against all identified proteins. GO with a corrected p‐value <0.05 was considered statistically significant.
The Kyoto Encyclopedia of Genes and Genomes (KEGG) (http://www.genome.jp/kegg/) database was used to identify enriched pathways by a two‐tailed Fisher's exact test to test the enrichment of the differentially expressed protein against all identified proteins. The pathway with a corrected p‐value <0.05 was considered significant. These pathways were classified into hierarchical categories according to the KEGG website.
We then performed hierarchical clustering based on differentially expressed protein functional classification (such as: GO, Pathway). We first collected all the categories obtained after enrichment along with their p‐values, and then filtered for those categories which were at least enriched in one of the clusters with a p‐value <0.05. This filtered p‐value matrix was transformed by the function x = −log10 (p‐value). Finally, these x values were z‐transformed for each functional category. These z scores were then clustered by one‐way hierarchical clustering (Euclidean distance, average linkage clustering) in Genesis. Cluster membership was visualized by a heat map.
RESULTS
Evaluation of EPVs from cisplatin‐induced dormant and reactivated lung cancer cells
To investigate the differential proteomic profiling of EVPs from lung cancer cells, we collected EVPs from A549 cells of different status after treatment of cisplatin. We set up a cell model according to a previous study.16 We first treated A549 cells with 7 μg/ml of cisplatin. Two days after treatment, most A549 cells died. The medium was changed and the remaining cells were cultured for 2 days. The residual cancer cells were cultured for an additional 16 days and the cells maintained their nonproliferative status. The cells then gradually regrew. The media from three groups of cancer cells was then collected for EVP purification (Figure 1a). The cancer cells which survived showed dispersed mesenchymal‐like shape and cells were arrested in G0/G1, indicating that the cells were in dormant status (Figure 1b). The cancer cells which survived were cultured for an additional 16 days and the cells reinitiated to proliferate. Flow cytometry analysis revealed that after cisplatin treatment the cells re‐entered the S phase (Figure 1c,d). Thirty‐two days after initial treatment with cisplatin, the medium was again collected for EVP purification. The EVPs collected from untreated A549 cell medium were smaller than those from dormant and reactivated cancer cells, with average diameters of 50, 90 and 100 nm, respectively (Figure 1e). The EVPs were positive for exosomal proteins CD63 and HSP70 (Figure 1f). As the EVPs and some EPs overlapped in size distribution, we considered that the purified products included exosomes and EPs with a diameter between 20–150 nm. The EVPs were observed by transmission electron microscopy (Figure 1g).
FIGURE 1.
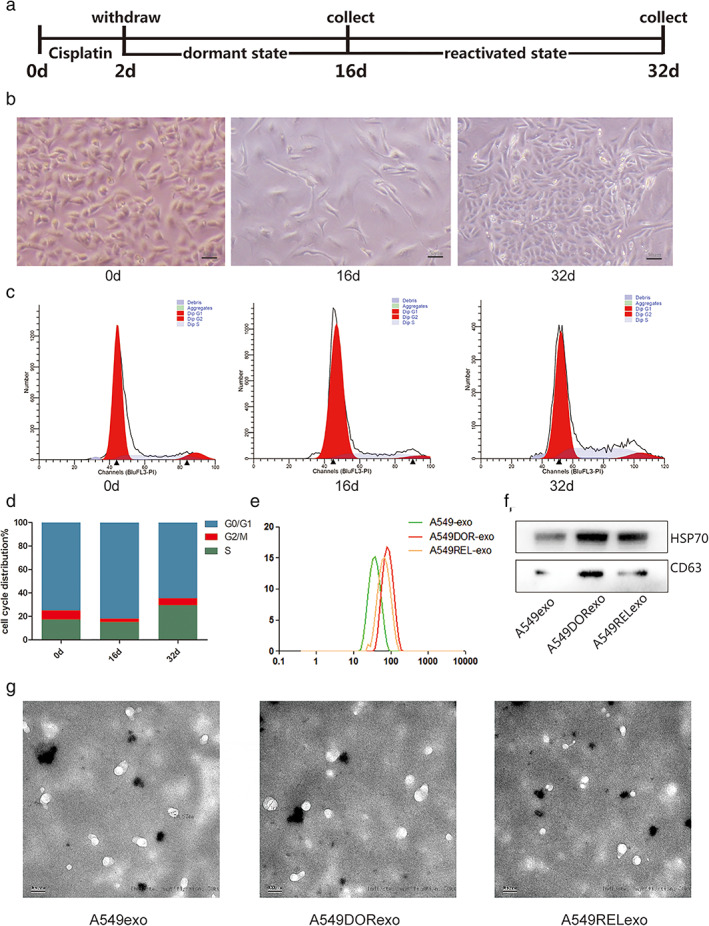
Evaluation of EVPs from cisplatin‐induced dormant and reactivated lung cancer cells. (a) Schematic diagram of the cisplatin treatment experiment. A549 cells were treated with cisplatin for 2 days. After treatment, the remaining cells were cultured for an additional 16 days. Thirty‐two days after treatment, the remaining cells had regrown. EVPs were isolated from the cisplatin‐induced dormant and reactivated A549 cells. (b) Representative microscopy images of A549 cells after treatment of cisplatin. Scale bars: 50 μm. (c) Flow cytometry analysis of cisplatin‐treated A549 cells. (d) The ratio of cells with different cell cycle was represented in histogram graph. (e) Size distribution analysis of purified EVPs. (f) Exosomal markers (CD63 and HSP70) were analyzed by western blot. (g) Transmission electron microscopy images of EVPs isolated from cancer cells. Scale bars: 100 nm; magnification: ×50 000
Quantitative protein identification of EVPs derived from dormant and reactivated cancer cells
To evaluate the potential of EVP proteins as therapeutic biomarkers, we measured the differential proteome in dormant ‐ and reactivated cancer cell‐derived EVPs by using TMT labeling, HPLC fractionation and LC–MS/MS analysis. Three biological replicates of each group were used for analysis. A total of 1183 proteins were identified. The minimum and average number of peptides for protein were 1 and 4.34, respectively. Among the 1183 proteins, several conventional exosomal markers and newly identified EVP biomarkers were detected including HSPA8, HSP90b1, HSP90AA1, HSPA4, FN1, LGALS3BP, A2M, HBB, GSN, MSN, PRDX2, RAP1B and FLNA.12 A fold change greater than 1.5 was considered to be upregulated. A total of 111 EVP proteins were upregulated in dormant cancer cells compared to those in control cells. Comparison of EVP proteins identified 50 differential expressed proteins (DEPs) in EVPs from reactivated cancer cells compared to those in dormant cancer cells. Among the highly expressed proteins, we identified that apolipoproteins such as APOA1, APOE, APOM were significantly increased on EVPs in dormant cancer cells. The differential proteins identified are listed in Table S1. The upregulated proteins were classified according to the gene ontology annotation in cellular component (CC), molecular function (MF), biological process (BP) and KEGG pathway. EVP from dormant lung cancer cells was shown to be enriched in lipoprotein particle, protein‐lipid complex, plasma lipoprotein particle, high‐density and very low density lipoprotein particle (Figure 2a,b,d). The most enriched annotation in reactivated cancer cells was regulation of cell proliferation (Figure 2c). The differential proteins identified are listed in Table S2. The results suggest that after the dormant period, cancer cells acquire the building blocks necessary for proliferation.
FIGURE 2.

Quantitative protein identification of EVPs derived from dormant and reactivated cancer cells. (a) The differentially expressed proteins between dormant cancer cells and control cancer cells were enriched in the GO functional classification of cholesterol metabolism represented by a bubble chart. (b) Hierarchical clustering heatmap of proteins expressed on EVPs. The heatmap horizontally represented the enrichment test results of different groups, and the vertical direction was the description of differential expression enrichment related functions. Red indicated upregulation, and blue indicated downregulation. (c) The differentially expressed proteins between reactivated cancer cells and dormant cancer cells were enriched in the GO functional classification of “positive regulation of cell proliferation” represented by a bubble chart. (d) Schematic diagram of the KEGG pathway where differentially expressed proteins were significantly enriched. The red box indicates upregulated proteins, and the green box indicates downregulated proteins
Protein–protein interaction (PPI) network
To gain better insight of interaction between DEPs and identify crucial modules, we constructed a protein–protein interaction (PPI) network using STRING and R. As shown in Figures 3a,b, the DEPs revealed 137 interaction edges and 111 protein nodes in dormant status; 106 edges and 50 nodes in reactivated status. APOA1, APOE, APOH, F5, APOA4, APOAC2, APOC3 and APOM were identified as the hub proteins (Figure 3c). The key DEPs in the reactivated phase were APP, C3, FN1, T1MP1 which were identified as the hub proteins. The number of edges which mean the interactions between proteins is shown in Figure 3d. Further analysis of the proteins with high interaction edges using Cytoscape yielded APOA1‐ and APOE‐ centered critical protein interaction networks (Figure 3e). APOA1 is closely related to APOC2, APOC3, APOE, APOH, APOM and other apolipoprotein families. The interoperability network in reactivated cancer cells is 19 proteins centered in APP and C3 (Figure 3f).
FIGURE 3.

Protein–protein interaction (PPI) network. (a) The PPI network analysis of differentially expressed proteins between dormant cancer cells and control cells using the STRING database. (b) The PPI network analysis of differentially expressed proteins between reactivated cancer cells and dormant cancer cells using the STRING database. (c) The number of edges which mean the interactions between proteins in dormant lung cancer cells was analyzed by R. The abscissa represented the degree value, and the number represented the connections between the proteins in the interaction network. The higher the degree value, the closer the relationship between the proteins. (d) The number of edges which mean the interactions between proteins in reactivated lung cancer cells and dormant cancer cells was analyzed by R. (e) The PPI network analysis of the proteins with high interaction edges in dormant cancer cells using Cytoscape. Circles represent nodes. The larger the circle, the more connection with other proteins. (f) The PPI network analysis of the proteins with high interaction edges in reactivated cancer cells using Cytoscape
Differential gene expression affected EVP protein profiles in dormant cancer cells
To explore the extent to which DEPs in EVPs are derived from cancer cells, gene expression profiling was performed on cisplatin‐induced dormant and relapse lung cancer cells. Principal component analysis showed that the three groups of cells had globally different gene expression profiles (Figure 4a). Compared to intact A549, dormant cancer cells had 1910 upregulated and 1924 downregulated genes. mRNA profiling demonstrated that the genes with higher expression in dormant cancer cells were lipid transporter‐ and lipid metabolic‐related genes, including ALDH2, ASAH1, ACAA1, BDH2, MVP, LYPLA2, PLPP1 (Figure 4b,d, Table S1). Compared with the dormancy, cancer cells in the reactivated period had 579 increased gene expression and 235 decreased gene expression. The KEGG rich analysis revealed that the differential genes were mainly enriched in cell cycle regulation and cell proliferation regulation in reactivated status, including MCM2, MCM5, MCM7, CDC6, CDC45, ORC6, etc (Figure 4c,e, Table S2). We further found the correlation between lipid‐associated gene expression and EVP lipoprotein level (Figure 4f). It suggested that lipoproteins enriched in EVPs reflect the activated lipid metabolism in dormant cancer cells.
FIGURE 4.

Differential gene expression in dormant and relapse cancer cells after chemotherapy.(a) Principal component analysis (PCA) showed that the three groups of cells had globally different gene expression profiles. (b) KEGG pathway enrichment analysis in dormant cancer cells. The x‐axis is the number of genes annotated to a certain KEGG pathway category, and the y‐axis is the KEGG pathway category. (c) KEGG pathway enrichment analysis in reactivated cancer cells represented in a bulb graph. The x‐axis is the enrichment ratio, and the y‐axis is the KEGG pathway category. (d) Clustering heatmap of differential gene expression between dormant cancer cells and control cells. (e) Clustering heatmap of differential gene expression between reactivated cancer cells and dormant cancer cells. (f) Spearman's correlation between lipid‐associated gene expression with EVP lipoprotein level. The heatmap shows Spearman's correlation coefficients
DISCUSSION
In this study, we compared the protein expression profiles of EVPs from cisplatin‐responsive cancer cells and their gene transcriptional profiles. We found that the differentially expressed EVP proteins was attributed to the disturbed transcriptional regulation in parental cancer cells. In dormant stage, cancer cells showed activated lipid metabolic process and highly expressed lipid metabolism related molecules. The differentially expressed lipoproteins on EVPs can affect the transcriptomic profiles of parental cancer cells. The activated lipid synthesis may contribute to the advantages of cell proliferation in the following reactivated state. Our study suggested that EVP proteins may be potential biomarkers or therapeutic targets for cisplatin‐based therapy.
Cellular metabolism changes radically in cancer cells and alterations in glucose, lipid metabolism or nucleotide synthesis are prominent features of solid tumors. Lipid‐dependent metabolism supports cancer cell growth in some kind of cancers such as prostate cancer and lymphoma.17 Lipid metabolic reprogramming in cancer cells involves lipogenesis and the catabolic pathway. Endogenously produced lipid molecules may contribute to the therapy‐induced tumor progression. Chemotherapy or irradiation stimulates the release of lipid mediators such as S1P, C1P from cancer cells.18 FASN levels in cisplatin‐resistant cells are significantly higher than sensitive cells.19 Inhibition of FASN has shown a combined effect with cisplatin and sensitizes cisplatin‐resistant cancer cells.20, 21 Apart from the endogenous de novo lipogenesis from carbohydrates, cancer cells acquire exogenous fatty acid through fatty acid translocase CD36. The detection of lipoproteins on the EVPs in this study suggests that lipoproteins can be transferred from cells to cells. The activated de novo lipogenesis and exogenous lipoprotein transfer may provide the fatty acid to sustain cell proliferation. In this study, we found that lipid associated molecules such as ALDH2, ACAA1, ASAH1 etc were highly expressed in dormant cancer cells induced by cisplatin, indicating that de novo lipogenesis was activated after treatment with cisplatin. Proteins secreted by cancer cells, also referred to as “the cancer cell secretome,” is a promising source for biomarker discovery.22 Exosomes are widely found in blood and tissue fluids, which are important substances for the exchange of information between cells and cells, and are involved in various biological processes such as tumor cell proliferation, metastasis and drug resistance. Lipids are the main components of exosome membrane, which are enriched in raft‐lipids such as cholesterol, sphingolipids, ceramide et al.23 Lipoproteins are also carriers of molecules. High‐density lipoproteins (HDL) participate in the transport and delivery of miRNAs.9 HDL play important roles in the intercellular communications. The current protocol remains a technical challenge due to the “contamination” of lipoproteins and some soluble serum proteins.24 Lipoproteins are sometimes considered to be contaminated in isolated exosomes, as lipoproteins may copurify with exosomes because of a similarity in size to exosomes. In this study, exosomes were removed from the cell culture medium. The exosomes that were isolated from the cell culture system were considered to be excreted from the cancer cells. As the exosomes and EPs overlapped in size distribution, we considered that the purified products included exosomes and EPs with a diameter between 20–150 nm.
In conclusion, we found that lipoproteins enriched in EVPs reflect the activated lipid synthesis in dormant cancer cells. The results of this study will provide predictive biomarkers or therapeutic targets for cisplatin‐induced dormant cancer cells.
CONFLICT OF INTEREST
The authors declare no conflict of interest.
Supporting information
Table S1. The upregulated EVP proteins (Dormancy vs.NC)
Table S2. The upregulated EVP proteins (Reactivation vs. Dormancy)
ACKNOWLEDGMENTS
This work was supported by National Natural Science Foundation, China (grant number 81972198, 81773147, 81472695); Strategic Priority Research Program of Central South University (ZLXD2017004); Key Research and Development Program of Hunan (2019SK2253).
Xu J, Wang L, Yin N, Chen A, Yi J, Tang J, et al. Proteomic profiling of extracellular vesicles and particles reveals the cellular response to cisplatin in NSCLC . Thorac Cancer. 2021;12:2601–2610. 10.1111/1759-7714.14147
Funding information Key Research and Development Program of Hunan, Grant/Award Number: 2019SK2253; Strategic Priority Research Program of Central South University, Grant/Award Number: ZLXD2017004; National Natural Science Foundation, China, Grant/Award Numbers: 81472695, 81773147, 81972198
REFERENCES
- 1.Park SY, Nam JS. The force awakens: metastatic dormant cancer cells. Exp Mol Med. 2020;52(4):569–81. [DOI] [PMC free article] [PubMed] [Google Scholar]
- 2.Hsiao YC, Chu LJ, Chen JT, Yeh TS, Yu JS. Proteomic profiling of the cancer cell secretome: informing clinical research. Expert Rev Proteomics. 2017;14(9):737–56. [DOI] [PubMed] [Google Scholar]
- 3.Jin L, Zhang Y, Li H, Yao L, Fu D, Yao X, et al. Differential secretome analysis reveals CST6 as a suppressor of breast cancer bone metastasis. Cell Res. 2012;22(9):1356–73. [DOI] [PMC free article] [PubMed] [Google Scholar]
- 4.Malkin EZ, Bratman SV. Bioactive DNA from extracellular vesicles and particles. Cell Death Dis. 2020;11(7):584. [DOI] [PMC free article] [PubMed] [Google Scholar]
- 5.Raposo G, Stoorvogel W. Extracellular vesicles: exosomes, microvesicles, and friends. J Cell Biol. 2013;200(4):373–83. [DOI] [PMC free article] [PubMed] [Google Scholar]
- 6.Li A, Zhang T, Zheng M, Liu Y, Chen Z. Exosomal proteins as potential markers of tumor diagnosis. J Hematol Oncol. 2017;10(1):175. [DOI] [PMC free article] [PubMed] [Google Scholar]
- 7.Zhang L, Yu D. Exosomes in cancer development, metastasis, and immunity. Biochim Biophys Acta Rev Cancer. 2019;1871(2):455–68. [DOI] [PMC free article] [PubMed] [Google Scholar]
- 8.Wieckowski E, Whiteside TL. Human tumor‐derived vs dendritic cell‐derived exosomes have distinct biologic roles and molecular profiles. Immunol Res. 2006;36(1–3):247–54. [DOI] [PubMed] [Google Scholar]
- 9.Vickers KC, Palmisano BT, Shoucri BM, Shamburek RD, Remaley AT. MicroRNAs are transported in plasma and delivered to recipient cells by high‐density lipoproteins. Nat Cell Biol. 2011;13(4):423–33. [DOI] [PMC free article] [PubMed] [Google Scholar]
- 10.Yuana Y, Levels J, Grootemaat A, Sturk A, Nieuwland R. Co‐isolation of extracellular vesicles and high‐density lipoproteins using density gradient ultracentrifugation. J Extracell Vesicles. 2014;3. 10.3402/jev.v3.23262 [DOI] [PMC free article] [PubMed] [Google Scholar]
- 11.Wu M, Chen C, Wang Z, Bachman H, Ouyang Y, Huang PH, et al. Separating extracellular vesicles and lipoproteins via acoustofluidics. Lab Chip. 2019;19(7):1174–82. [DOI] [PMC free article] [PubMed] [Google Scholar]
- 12.Hoshino A, Kim HS, Bojmar L, Gyan KE, Cioffi M, Hernandez J, et al. Extracellular vesicle and particle biomarkers define multiple human cancers. Cell. 2020;182(4):1044–1061.e18. [DOI] [PMC free article] [PubMed] [Google Scholar]
- 13.Whiteside TL. Tumor‐derived exosomes and their role in cancer progression. Adv Clin Chem. 2016;74:103–41. [DOI] [PMC free article] [PubMed] [Google Scholar]
- 14.Keustermans GC, Hoeks SB, Meerding JM, Prakken BJ, de Jager W. Cytokine assays: an assessment of the preparation and treatment of blood and tissue samples. Methods. 2013;61(1):10–7. [DOI] [PubMed] [Google Scholar]
- 15.Zhang X, Sai B, Wang F, Wang L, Wang Y, Zheng L, et al. Hypoxic BMSC‐derived exosomal miRNAs promote metastasis of lung cancer cells via STAT3‐induced EMT. Mol Cancer. 2019;18(1):40. [DOI] [PMC free article] [PubMed] [Google Scholar]
- 16.Li S, Kennedy M, Payne S, Kennedy K, Seewaldt VL, Pizzo SV, et al. Model of tumor dormancy/recurrence after short‐term chemotherapy. PLoS One. 2014;9(5):e98021. [DOI] [PMC free article] [PubMed] [Google Scholar]
- 17.Cao Y. Adipocyte and lipid metabolism in cancer drug resistance. J Clin Invest. 2019;129(8):3006–17. [DOI] [PMC free article] [PubMed] [Google Scholar]
- 18.Papaevangelou E, Almeida GS, Box C, DeSouza NM, Chung YL. The effect of FASN inhibition on the growth and metabolism of a cisplatin‐resistant ovarian carcinoma model. Int J Cancer. 2018;143(4):992–1002. [DOI] [PMC free article] [PubMed] [Google Scholar]
- 19.Bensaad K, Favaro E, Lewis CA, Peck B, Lord S, Collins JM, et al. Fatty acid uptake and lipid storage induced by HIF‐1α contribute to cell growth and survival after hypoxia‐reoxygenation. Cell Rep. 2014;9(1):349–65. [DOI] [PubMed] [Google Scholar]
- 20.Gartung A, Yang J, Sukhatme VP, Bielenberg DR, Fernandes D, Chang J, et al. Suppression of chemotherapy‐induced cytokine/lipid mediator surge and ovarian cancer by a dual COX‐2/sEH inhibitor. Proc Natl Acad Sci U S A. 2019;116(5):1698–703. [DOI] [PMC free article] [PubMed] [Google Scholar]
- 21.Al‐Bahlani S, Al‐Lawati H, Al‐Adawi M, Al‐Abri N, Al‐Dhahli B, Al‐Adawi K. Fatty acid synthase regulates the chemosensitivity of breast cancer cells to cisplatin‐induced apoptosis. Apoptosis. 2017;22(6):865–76. [DOI] [PubMed] [Google Scholar]
- 22.Pavlou MP, Diamandis EP. The cancer cell secretome: a good source for discovering biomarkers? J Proteomics. 2010;73(10):1896–906. [DOI] [PubMed] [Google Scholar]
- 23.Simons M, Raposo G. Exosomes—vesicular carriers for intercellular communication. Curr Opin Cell Biol. 2009;21(4):575–81. [DOI] [PubMed] [Google Scholar]
- 24.Brennan K, Martin K, FitzGerald SP, OʼSullivan J, Wu Y, Blanco A, et al. A comparison of methods for the isolation and separation of extracellular vesicles from protein and lipid particles in human serum. Sci Rep. 2020;10(1):1039. [DOI] [PMC free article] [PubMed] [Google Scholar]
Associated Data
This section collects any data citations, data availability statements, or supplementary materials included in this article.
Supplementary Materials
Table S1. The upregulated EVP proteins (Dormancy vs.NC)
Table S2. The upregulated EVP proteins (Reactivation vs. Dormancy)