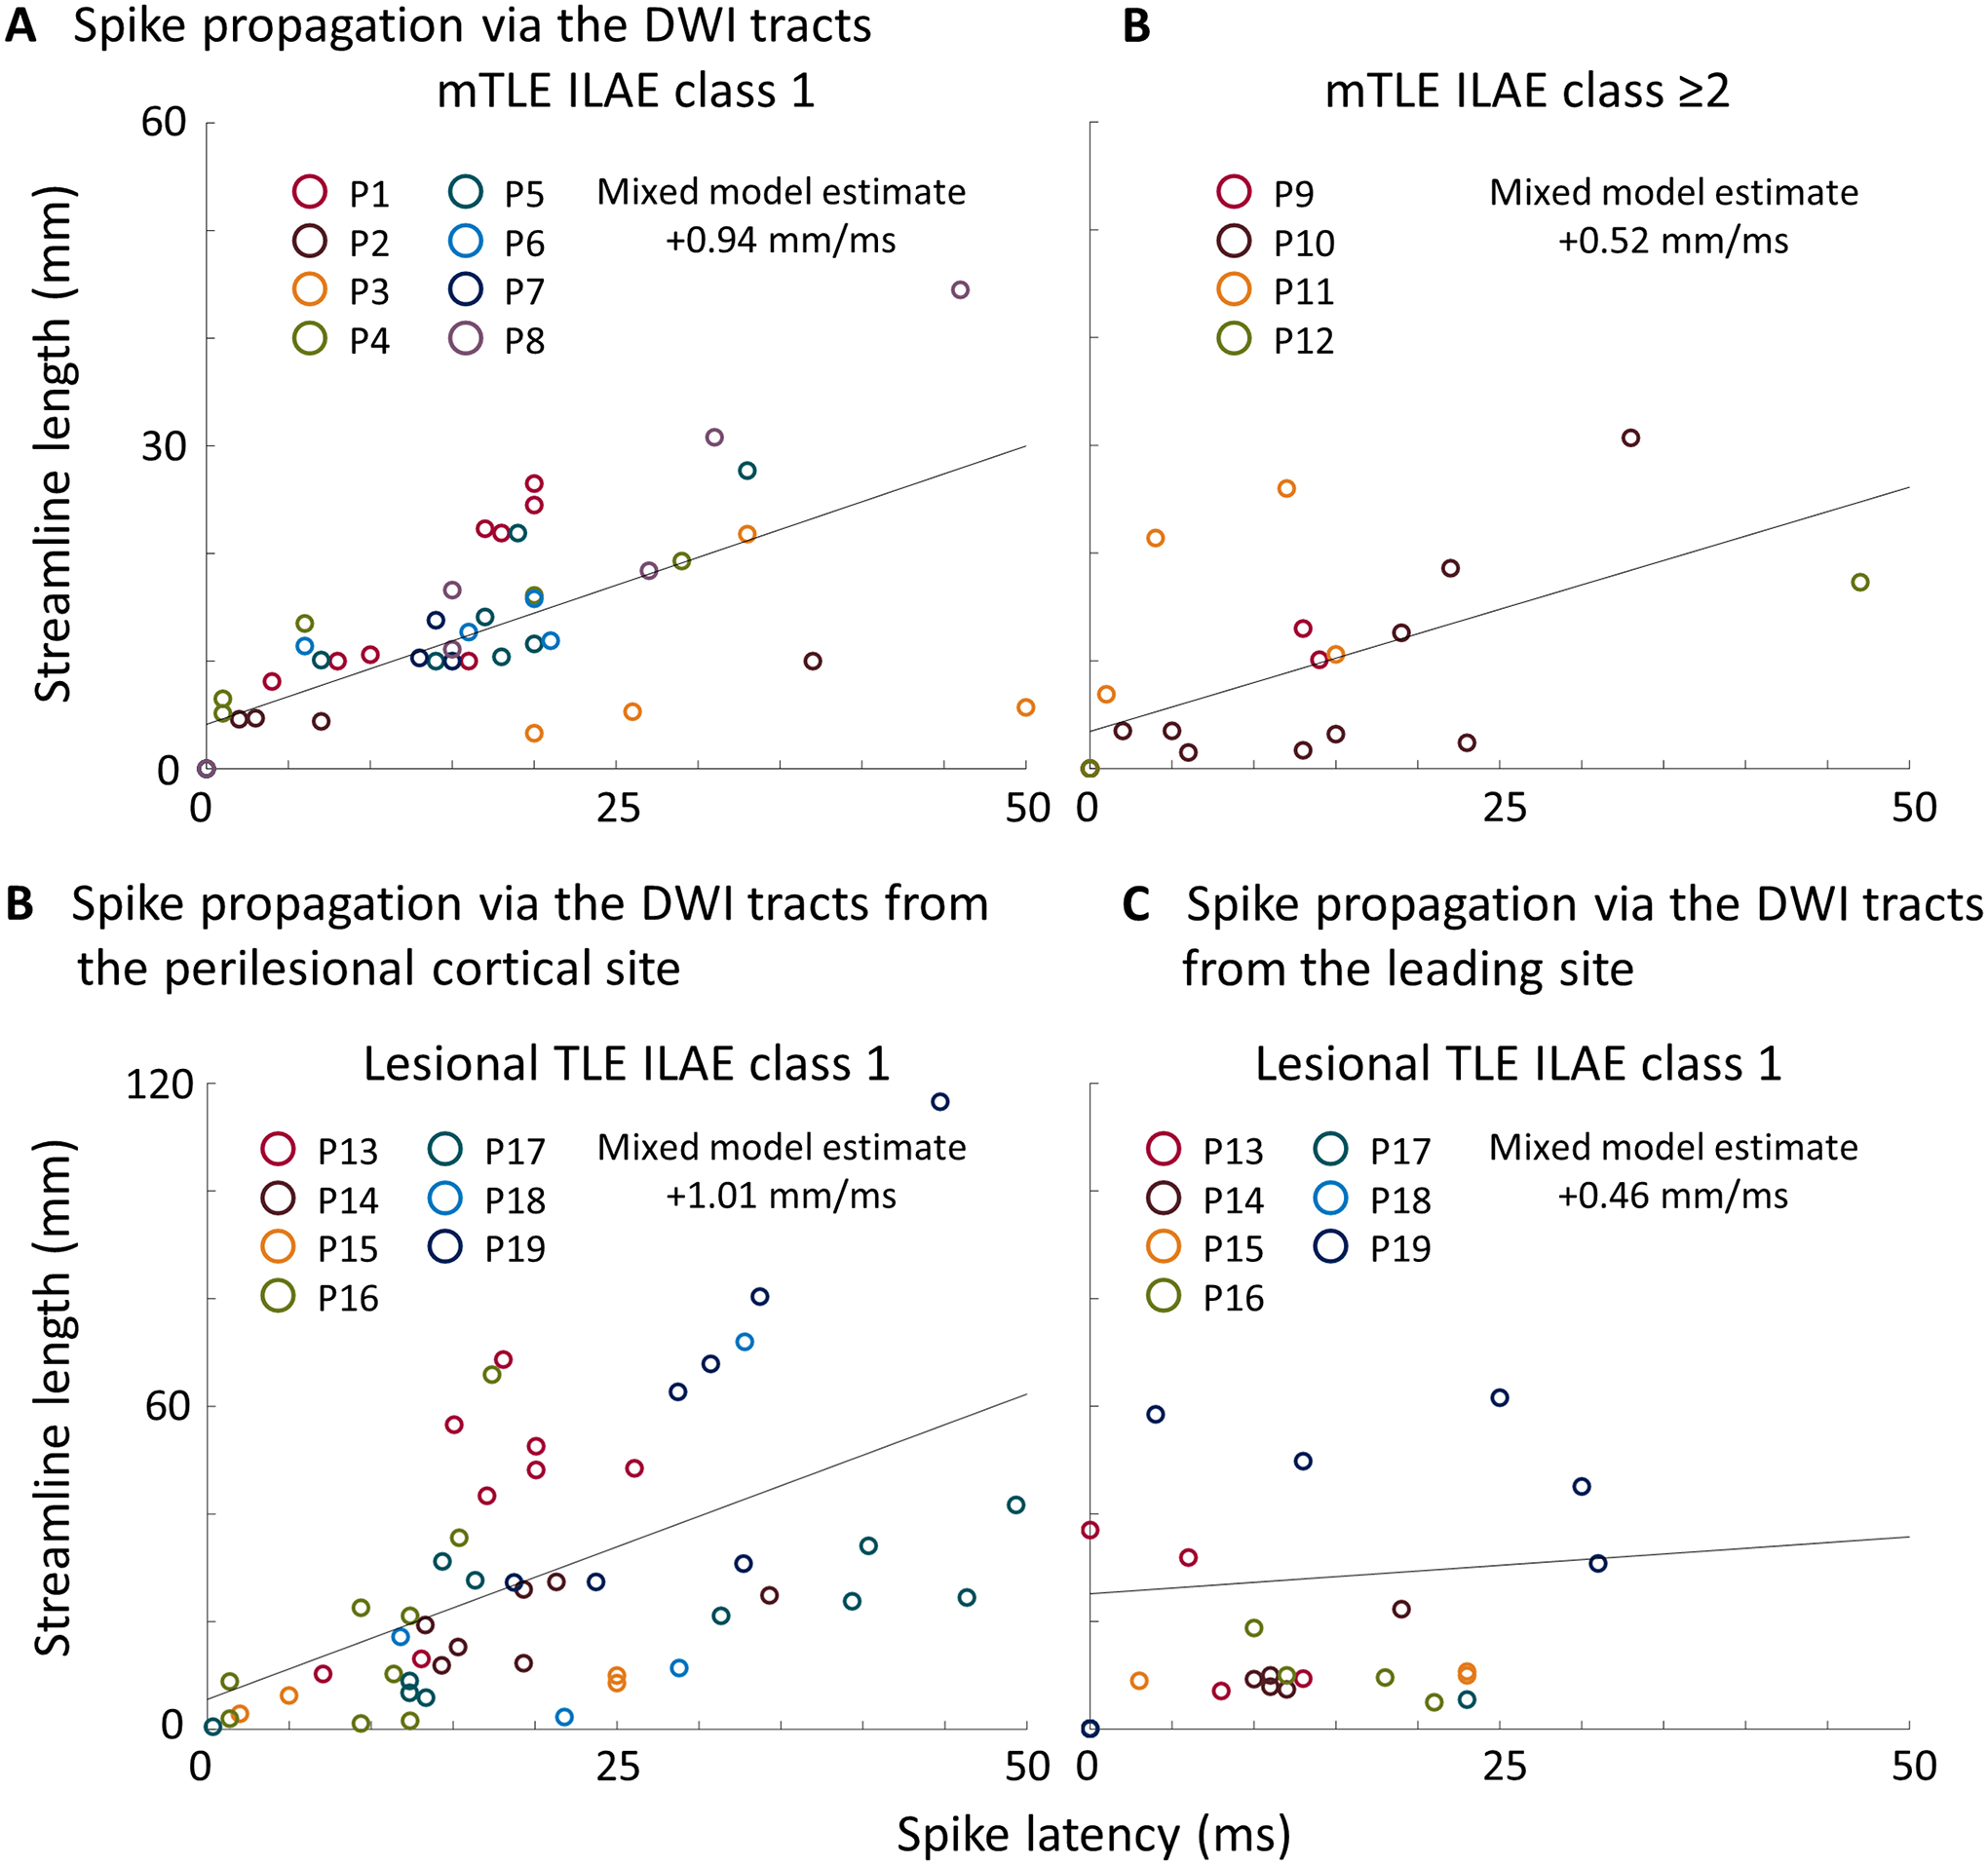
Figure 3. Association between the spike latency and tractography-based streamline length.

(A-B) The scatter plots derived from mesial temporal lobe epilepsy (mTLE) patients. Each circle reflects the relationship between the spike latency and streamline length from the leading site in mTLE patients with (A) ILAE class 1 and (B) class ≥2, respectively. (C-D) The scatter plots derived from lesional TLE patients. Each circle reflects the relationship between the spike latency and streamline length (C) from the perilesional cortical site and (D) from the leading site, respectively. Circle color reflects a given patient. Solid line: regression line.
