

Abstract
The Sorbin and SH3 domain-containing protein 2 (Sorbs2) is an important component of cardiomyocyte sarcomere. It has been recently reported that loss of Sorbs2 is causally associated with arrhythmogenic cardiomyopathy in human. However, the ionic mechanisms leading to cardiac arrhythmogenesis by Sorbs2 deficiency are unknown. In this study, we hypothesized that Sorbs2 plays an important role in regulating cardiac ion channel expression and function. Using electrophysiological and molecular biological approaches, we found that the Sorbs2 knockout (KO) mice progressively developed cardiac structural and electrical remodeling as early as 1 to 2 months of age and died prematurely at 5 to 7 months of age. Electrocardiographic recordings showed that Sorbs2 KO mice had conduction delays, spontaneous ventricular extrasystoles and polymorphic ventricular tachyarrhythmia. Intracellular recordings revealed abnormal action potentials with depolarized resting potential, reduced upstroke velocity, prolonged repolarization, and effective refractory period in the ventricular preparations of Sorbs2 KO mice. Patch clamp experiments demonstrated that Sorbs2 KO mice displayed distinct abnormalities in the expression and function of cardiac ion channels, including those of the voltage-gated Na+ channels, L-type Ca2+ channels, the voltage-gated K+ channels and the inward-rectifier K+ channels. Moreover, Sorbs2 physically interacted with the RNAs and/or proteins of important cardiac ion channels and directly regulated their expression in vitro. Our results indicate that Sorbs2 plays a pivotal role in the regulation of cardiac channel physiology. Loss of Sorbs2 promotes cardiac ion channelopathies and life-threatening arrhythmias.
Keywords: Sorbs2, myocardium, ion channelopathy, electrical remodeling, arrhythmia
1. Introduction
Cardiovascular diseases are the major cause of morbidity and mortality worldwide, accounting for 1.7 million deaths every year [1]. It is estimated that at least 50% of all cardiovascular deaths are attributed to sudden cardiac death and about 80% of these are due to ventricular tachyarrhythmias [2]. Cardiac ion channel malfunction is a fundamental mechanism of arrhythmogenesis in patients with cardiovascular diseases [3]. However, our understanding of the molecular basis on cardiac ion channelopathy is incomplete.
The Sorbin and SH3 domain-containing protein 2 (Sorbs2), containing one Sorbin homology (SoHo) domain in the N-terminus and three Src homology 3 (SH3) domains in the C-terminus, is a cytoskeletal protein abundantly expressed in the heart [4]. Sorbs2 interacts with many cytoskeletal proteins in the myocardium, including cadherin, α-actinin, actin stress fibers, and desmosomal proteins [5, 6], and plays an important role in the regulation of cytoskeletal organization and signal transduction [7]. Knockdown of Sorbs2 gene in neonatal rat cardiomyocytes induced hypertrophy [8]. Genetic deletion of Sorbs2 led to the development of cardiomyopathy and premature death in mice [6]. The clinical importance of Sorbs2 is demonstrated by the finding that the SORBS2 gene is linked to congenital heart diseases in human [9, 10]. It has been found that an increase of Sorbs2 expression is present in patients with the left ventricular noncompaction cardiomyopathy [11], while loss-of-function splicing variants of SORBS2 gene are present in patients with arrhythmogenic cardiomyopathy [6]. These findings underscored the pathophysiological impact of Sorbs2 in cardiovascular diseases. However, our knowledge regarding cardiac arrhythmogenic remodeling by Sorbs2 is primitive. In this study, we provide the first evidence that Sorbs2 not only regulates the mRNA and protein expressions, but also modifies the biophysical properties of cardiac ion channels. Sorbs2 binds to the mRNAs and/or proteins of the cardiac voltage-gated Na+ (Nav1.5) channels, L-type Ca2+ (Cav1.2) channels, voltage-gated K+ (Kv) channels, and the inward rectifier K+ (Kir) channels. Loss of Sorbs2 causes cardiac ion channelopathies and life-threatening arrhythmias in mice.
2. Materials and Methods
2.1. Animals
Sorbs2 KO mice (B6N(Cg)-Sorbs2tm1.1(KOMP)Mbp/J), with deletion of 1903 bp encompassing part of intron 7, the whole exon 8, and part of intron 8 of the Sorbs2 gene (NM_001205219), and their wild type (WT) control mice (C57BL/6J ) were obtained from The Jackson Laboratory, Ltd. (Bar Harbor, ME, USA), and bred at the Animal Center of Mayo Clinic in Rochester (MN, USA). Male mice at 4–5 months of age were anesthetized with intraperitoneal injection of ketamine (100 mg/kg) and xylazine (10 mg/kg). After anesthesia, hearts were rapidly excised and used for molecular biological and electrophysiological experiments. All experimental protocols were approved by the Mayo Clinic Institutional Animal Care and Use Committee (IACUC: #A00002149) and followed the guidelines of the National Institutes of Health Guide for the Care and Use of Laboratory Animals.
2.2. Electrocardiogram (ECG) and tail blood pressure measurement
Mice were anesthetized with 1.5% isoflurane in 95% O2 and 5% CO2 through a vaporizer (Midmark, Corp., Miamisburg, OH, USA), and then placed on a heated ECG-board with the 4 paws on individual electrodes. ECG signals were recorded for 2 min using Indus Rodent Surgical Monitor System (Indus Instrumentation, Inc., London, ON, Canada) equipped with an AD Instruments Data Acquisition System (PowerLab, Inc., Terrell, TX, USA) and analyzed using Chart 5 software (PowerLab, Inc.). Tail blood pressure in awake mice was measured using a CODA Non-Invasive Blood Pressure System (Kent Scientific, Corp., Torrington, CT, USA) as previously reported [6, 12].
2.3. Cardiac action potential (AP) recordings
Intracellular action potentials were recorded from the endocardial surface of freshly isolated right ventricular (RV) preparations using standard microelectrode techniques as described previously [13]. After 30 min of equilibration with the Tyrode’s solution containing (in mM) NaCl 129, KCl 4, NaH2PO4 0.9, NaHCO3 20, CaCl2 1.8, MgSO4 0.5, and glucose 5.5 equilibrated with 95% O2-5%CO2 (pH=7.4) at 3 ml/min at 37 °C, the tissues were paced at a cycle length of 200 ms and APs were recorded using a Duo 773 amplifier (World Precision Instruments, LLC., Sarasota, FL, USA). The resting potentials, the action potential amplitudes (APA) and the maximal upstroke velocities (Vmax) of AP, and the action potential durations at 90% repolarization (APD90) were measured. Induction of tachycardia and measurements of effective refectory period (ERP) were performed using a train of stimuli (14 S1) at a fixed cycle length of 200 ms coupled with an extra-stimulus (S2) that was 10-ms shorter than the train and repeated at 10-ms decrements until refractoriness was reached [13].
2.4. Isolation of single ventricular myocytes and whole-cell patch clamp recordings
Single ventricular myocytes were enzymatically isolated from WT and Sorbs2 KO mice as previously described [14]. Whole-cell ion channel currents were recorded in freshly isolated ventricular myocytes using an Axopatch 200B integrating amplifier and Clampex 10.4 software (Molecular Device, LLC., San Jose, CA, USA) as previously reported [14–16]. The composition of bath and pipette solutions, experimental protocols and kinetic analyses for individual channels are described as follows:
2.4.1. Voltage-gated Na+ (Nav1.5) channels
Whole-cell Nav1.5 channel currents (INa) were recorded from a holding potential of −120 mV to test voltages from −80 mV to +30 mV in 5-mV increments in the freshly isolated ventricular cardiac myocytes as previously reported [16]. The bath solution contained (in mM): CsCl 125.0, NaCl 10.0, TEA-Cl 5.4, MgCl2 1.0, CaCl2 1.0, CoCl 2.0, glucose 5.5, HEPES 10.0, adjusted to pH 7.4 with CsOH. The pipette solution contained (in mM): CsCl 120.0, NaCl 5.0, MgCl2 1.0, CaCl2 0.2, HEPES 10.0, MgATP 5.0, EGTA 10.0, adjusted to pH 7.4 with CsOH. Since the value of capacitance is approximately 1 × 10⁶ pF/cm2 in all biological cell membrane [17], the Nav1.5 channel conductance can be obtained by the fitting of current-voltage relationship (I-V curve) using following equations as we have described [16]:
where, G is the channel conductance, Gmax is the maximum channel conductance, Vm is the membrane potential, V0.5 is the membrane potential at half-maximal conductance, Vrev is the reversal potential, F is the Faraday constant, R is the universal gas constant, T is the absolute temperature, and z is the apparent gating charge.
For steady-state inactivation of Na+ channels, a standard two-pulse protocol, composed of a 500-ms preconditioning pulse from −160 mV to 0 mV in 10-mV increments, followed by a test potential of −40 mV, was employed. The fraction of I/Imax was fitted using the Boltzmann equation:
where, I is the current density, Imax is the maximum current density, Vm is the membrane potential, V0.5 is the membrane potential at half-maximal conductance, F is the Faraday constant, R is the universal gas constant, T is the absolute temperature, and z is the apparent gating charge.
Recovery from inactivation was determined using a two-pulse paradigm. A 500-ms preconditioning pulse from a holding potential of −120 mV to −30 mV was followed by a recovery period of durations from 1 ms to 300 ms in 5-ms increments, followed by a 20-ms test pulse from −100 mV to −30 mV. Time course of the recovery curve was analyzed using a two-exponential equation:
where, A1 and A2 represent the relative area under the two-exponential fit (A1+A2=1), and τ1 and τ2 are the fast and slow time constants respectively.
2.4.2. L-type Ca2+ (Cav1.2) channels
Cav1.2 channel currents (ICaL) were elicited from a holding potential of −50 mV to test voltages from −50 mV to +60 mV in 10-ms increments. Channel steady-state inactivation was measured using a 3-s preconditioning pulse with various potentials ranging from −80 mV to +40 mV in 10-mV increments followed by a 200-ms test pulse of 0 mV. The membrane potential at half-maximal activation (Vm-0.5) and inactivation (Vh-0.5) of Cav1.2 channels, as well as the Vrev were obtained as described above. Recovery from inactivation was determined using a two-pulse protocol composed of two 200-ms pulses from a holding potential of −50 mV to 0 mV with interpulse intervals from 1 ms to 2 s in 10-ms increments. The recovery time constant was obtained by a mono-exponential fit:
where, A is the area, and τ is the time constant of channel recovery as we descripted [15].
The bath solution of Cav1.2 recordings contained (in mM): tetraethyl-ammonium Cl 140.0, MgCl2 2.0, CaCl2 1.8, glucose 10, HEPES 10.0, adjusted to pH 7.4 with tetraethyl-ammonium OH. The pipette solution contained (in mM): CsCl 135.0, MgCl2 1.0, MgATP 5.0, HEPES 10.0, EGTA 10.0, adjusted to pH 7.4 with CsOH.
2.4.3. Voltage-gated K+ (Kv) channels
Total K+ currents were elicited from a holding potential of −80 mV to different test potentials increasing from −60 mV to +60 mV in 10 mV steps. A 30-ms pre-pulse from a holding potential of −80 mV to −40 mV was applied preceding the voltage protocol to inactivate Nav1.5 channels. The bath solution contained (in mM): NaCl 138, KCl 4.5, MgCl2 0.5, CaCl2 1.8, Na2HPO4 0.33, glucose 5.5, HEPES 10, CdCl2 0.3, adjusted to pH 7.4 with NaOH. The pipette solution contained (in mM): K-glutamate 120.0, KCl 10.0, MgCl2 2.0, MgATP 2.0, HEPES 10.0, EGTA 5.0, adjusted to pH 7.4 with KOH. After equilibrations when the currents had become stable, cells were superfused with buffer containing 1 mM 4-aminopyridine (4-AP), a non-specific Kv channel blocker. The 4-AP-sensitive K+ currents were obtained by digital subtracting the 4-AP-resistant K+ currents from total K+ currents [18]. The I-V curve was fitted using the equations previously described by Standen & Stanfield [19]:
where, G is the channel conductance, Vm is the membrane potential, Vk is the K+ equilibrium potential, Gmax is the maximal channel conductance, Kk is the K+ dissociation constant, [K+]R represents the concentration of K+ bound to the channel and [K+]R = [K]o exp(−δVk F/RT), [K]o is the extracellular K+ concentration, δ is the electrical distance measured from the inner surface of the membrane, F is the Faraday constant, R is the universal gas constant and T is the absolute temperature.
Steady-state inactivation of Kv channels was determined using a two-pulse protocol with a 400-ms preconditioning pulse from a holding potential of −80 mV to +60 mV in 10-mV increments followed by a 200-ms test voltage at +60 mV. Recovery from the steady-state inactivation was determined using two 200-ms pulses from −80 mV to +60 mV with interpulse recovery intervals from 1 ms to 1200 ms in 20-ms increments. Time course of the recovery curve was analyzed using a two-exponential equation as described above.
2.4.4. Strong inward rectifier K+ (Kir) channels
Kir channel currents were recorded at testing potentials ranged from −120 mV to +30 mV in 10-mV increments from a holding potential of 0 mV [14]. The bath solution and the pipette solution of Kir channel recordings were the same as those used for Kv channels. The I-V curves of Kir channels were fitted using the equations described previously [19]:
where, Vm is the membrane voltage, Vk is the K+ equilibrium potential, Gmax is the maximal conductance, y is the fraction of channels that are open in the presence of cytoplasmic Mg2+, [Mg2+]i is the intracellular Mg2+ concentration (2 mM in the pipette solution), δ is the electrical distance measured from the inner surface of the membrane, F is the Faraday constant, R is the universal gas constant and T is the absolute temperature, Km is the Mg2+ dissociation constant, Kk is the K+ dissociation constant, [K+]R represents the concentration of K+ bound to the channel and [K+]R = [K+]o exp(−δVk F/RT), [K+]o is the extracellular K+ concentration.
Curve fitting was performed using Igor 6.37 software (WaveMetrics, Inc., Lake Oswego, OR, USA). All patch clamp experiments were performed at room temperature (24 °C).
2.5. Cell culture, adenoviral delivery of mouse Sorbs2 gene and Sorbs2-shRNA in HL-1 cardiac cells
HL-1 cardiac cells were maintained in modified Claycomb medium (Sigma-Aldrich, Inc., St. Louis, MO, USA) as previously reported [13]. Adenoviruses carrying the mouse Sorbs2 gene (Ad-Sorbs2) and Sorbs2-shRNA (Ad-shRNA) were purchased from Vector Biolobs, Inc. (Parkway Malvern, PA, USA), and were transduced into HL-1 cells at 50 multiplicity of infection (MOI). Transduction with adenovirus containing CMV promoter (Ad-CMV) or scramble-RNAi (Ad-scramble-RNAi) at 50 MOI served as controls. After a 48-h transduction, the protein expression of Sorbs2 and ion channels was examined using Western blot analysis.
2.6. Sorbs2 mutagenesis, heterologous expression, and cell surface protein biotinylation
Mouse Sorbs2 WT cDNA (amino acids:1–1258) (accession no. KR610443.1) in pEGFP-C2 was purchased from Addgene, Inc. (Watertown, MA, USA, #74514). The SH3 domain deletion mutant of Sorbs2 (Sorbs2ΔSH3, amino acids: 1–214) was created by introducing a stop codon using the QuikChange site-directed mutagenesis kit (Stratagene, Corp., La Jolla, CA, USA) as previously reported [20]. The orientation and correctness of Sorbs2ΔSH3 was verified by DNA sequencing and its protein expression was confirmed by western blot analysis (Supplemental Fig. I).
Mouse Sorbs2 WT cNDA (0.5 μg) or Sorbs2ΔSH3 cDNA (0.5 μg) was transiently co-transfected with human Nav1.5/pcDNA3.1 (0.5 μg ) (Addgene, Inc., #145374), Cav1.2/pcDNA6 (0.5 μg) (Addgene, Inc., #16572), Kv1.4/pSP64 (0.5 μg) [21], Kir2.1/pcDNA 3.1 (0.5 μg ) and Kir6.2/pcDNA3.1 (0.5 μg) [22] into HEK293 cells respectively, using Effectene transfection reagent kit (Qiagen, Corp., Venlo, Netherlands). After a 48-h transfection, the cell surface expression of Nav1.5, Cav1.2, Kv1.4, Kir2.1 or Kir6.2 was determined using surface protein biotinylation assay and isolation kit (Pierce Thermo Fisher Inc., Rockford, IL, USA) as previously reported [23]. In brief, the cells were washed twice with ice-cold PBS containing CaCl2 (1 mM) and MaCl2 (5 mM), incubated with PBS containing Sulfo-NHS-SS-Biotin (0.25 mg/ml) for 30 min at 4 °C, and then exposed to a quenching solution (100 mM glycine) to remove unreacted and biotinylation reagent, followed by two washes with ice-cold Tris-buffered saline (TBS). Biotinylated cells were lysed with a buffer contained (in mM): NaCl 150, EDTA 1.0, Tris 20, Nonidet p-40 0.5% (v/v) and protease inhibitor tablet (1:25 dilution, Roche Diagnostics, Corp., Indianapolis, IN, USA), and the homogenates were centrifuged at 10,000 g for 10 min at 4 °C. Biotinylated proteins were incubated with 50 μl of immobilized streptavidinagarose beads for 1 h at room temperature, and then the bead-bound proteins were eluted by boiling in 40 μl Laemmli buffer for immunoblot analysis.
2.7. Immunoblot analysis
Western blot analysis was performed as previously described [12]. Mouse hearts and cultured HL-1 cardiac cells were homogenized in lysis buffer. Proteins were separated by polyacrylamide gel electrophoresis, transferred to nitrocellulose membrane, and then immunoblotted against primary antibodies. Optical density of bands was analyzed using ImageJ software (JACop, NIH, USA). Protein expression was expressed as relative abundance normalized to GAPDH. Antibodies used for this study are listed as follows: anti-Sorbs2 (Sigma-Aldrich, Inc., St. Louis, MO, USA, #SAB4200183), anti-Nav1.5α (Proteintech Group, Inc., Richmond, CA, USA, #23016-1-AP), anti-Navβ1 (Sigma-Aldrich, Inc., # AV35028), anti-Navβ4 (Sigma-Aldrich, Inc., #HPA01293), anti-Cav1.2α (Abcam, Inc., Cambridge, MA, USA, #ab58552), anti-Cavβ2 (Santa Cruz Biotechnology, Inc., Dallas , TX, USA, #sc-81890), anti-Cavα2δ1 (Sigma-Aldrich, Inc. #SAB2107922), anti-Cavα2δ3 (Invitrogen Thermo Fisher Scientific, Inc., Carlsbad, CA, USA, #PA5-26743), anti-Kv1.4 (Cruz Biotechnology, Inc., #sc-16179), anti-Kv1.5 (Santa Cruz Biotechnology, Inc., #sc-377110), anti-Kv4.2 (Millipore Sigma, Corp., Burlington, MA, USA, #AB5360), anti-Kv4.3 (Alomone Labs, Ltd., Jerusalem, Israel, #APC-017), anti-Kir2.1 (R&D Systems, Inc., Minneapolis, MN, USA, #MAB9548), anti-Kir6.2, (custom made) [14], anti-Cx43 (Cell Signaling Technology, Inc., Danvers, MA, USA, #3512), and anti-GAPDH (Proteintech Group, Inc., #10494-1-AP).
Original images of western blots and antibody validations can be found in Online Supplementary Materials.
2.8. Quantitative real-time PCR (qRT-PCR)
Quantitative expression of mRNA was determined by qRT-PCR as the average of triplicates per gene, per cDNA sample, using the iCycler iQ Real Time Detection System (Bio-Rad Laboratories, Inc., Hercules, CA, USA) [12]. The 2−ΔΔCt method was used to determine the relative fold change in mRNA expression after transduction with Sorbs2-shRNA or scramble-RNAi, where 2−ΔΔCt = [(Ct gene of interest − Ct internal control)shRNA − (Ct gene of interest − Ct internal control)scramble-RNAi]. The reaction underwent a 40-cycle amplification with the following conditions: denaturalization for 15 s at 94 °C, annealing for 20 s at 58 °C and extension for 20 s at 70 °C. Primer sequences for specific amplification are listed below:
| Sorbs2: | 5’-CCGTGTCCTATGTCGAGG TT-3’ (forward) |
| 5’-TCCAGCTCATCTTCGTTCCT-3 (reverse) | |
| Nav1.5: | 5’-ACCTTCACCGCCATCTACAC-3’ (forward) |
| 5’-TGCGTAAGGCTGAGACATTG-3’ (reverse) | |
| Cav1.2α: | 5’-CACTATGGCCAGAGCTGCCTC-3’ (forward) |
| 5’-GGACTTGATGAAGGTCCACAGC-3’ (reverse) | |
| Cava2δ1: | 5’-TATCCCAAAGAGGCCGGAGA-3’ (forward) |
| 5’-CATACGCACCAGGTCCACTT-3’ (reverse) | |
| Kv1.4: | 5’-CTGGCTGACCCATTCTTCAT-3’ (forward) |
| 5’-GATCACCCTGAGGATGGCTA-3’ (reverse) | |
| Kir2.1: | 5’-GGAATGGCAAGAGTAAAGTCCA-3’ (forward) |
| 5’-AGGGCTATCAACCAAAACACA-3’ (reverse) | |
| Kir6.2: | 5’-CGTCACAAGCATCCACTCCT-3’ (forward) |
| 5’-TCAGCCCGACGATATTCTGC-3’ (reverse) | |
| Cx43: | 5’-ACAAGGTCCAAGCCTACTCCA-3’ (forward) |
| 5’-CCCCAGGAGCAGGATTCTGA-3’ (reverse) | |
| GAPDH: | 5’-TGCCAAGGCTGTGGGCAAGG-3’ (forward) |
| 5’-TGGGCCCTCAGATGCCTGCT-3’ (reverse) |
The PCR products were confirmed by electrophoresis in 3% agarose gels to ensure amplification and visualized with ethidium bromide using a Fotodyne UV Transilluminator/Digital Camera system (Fotodyne, Inc., Appleton, WI, USA).
2.9. RNA immunoprecipitation (RIP), next-generation RNA-sequencing (RNA-seq) and bioinformatics analysis
RIP was conducted using Magna RNA-binding protein immunoprecipitation kit (Millipore Sigma, Corp.). Mouse anti-Sorbs2 antibodies (2 ug, Sigma-Aldrich, Inc.) and magnetic beads (50 ul) were added in the cell lysates, and then incubated overnight at 4°C with gentle rotation. Protein A/G beads (40 μl) were added and incubated at 4°C with gentle rotation for additional 1 hr. After centrifugation at 2,500 rpm for 30 sec, pellet beads were re-suspended in 0.5 mL RIP lysis buffer and washed three times with RIP lysis buffer. Co-precipitated RNAs were eluted with nuclease-free water.
Extracted RNAs from the ribonucleoprotein complexes (0.2 μg) of anti-Sorbs2 antibodies were collected for the next-generation RNA-seq followed by bioinformatics analysis at the Molecular Biology Core Facility of Mayo Clinic in Rochester. rRNAs were removed using Ribo-Zero™ rRNA Removal Kit (Illumina, Inc., San Diego, CA, USA). RNA libraries were constructed using rRNA-depleted RNAs with TruSeq Stranded Total RNA Library Prep Kit (Illumina, Inc.) and converted into cDNA and sequenced using a HiSeq 2500 Next Generation DNA Sequencers (Illumina, Inc.). Generated datasets were collected using the MAP-RSeq version 3.0.1 and an integrated RNA-Seq bioinformatics pipeline for comprehensive analysis of raw RNA sequencing paired-end reads. STAR-Fusion, a module for detection of fusions in STAR was used to identify and report expressed gene fusions in the samples. Likewise, expressed single nucleotide variants and small insertions-deletions were detected using a combination of tools such as GATK, HaplotypeCaller and RVBoost [24, 25]. Finally, comprehensive quality control modules from the RSeQC package were run on aligned reads to assess the quality of the sequenced libraries [26]. R bioinformatics package edgeR was used for differential gene expression analysis [27]. Gene expression is expressed by Reads Per Kilobase of transcript, per Million mapped reads (RPKM). The RPKM value of 10.0 was used as the cutoff value for differential gene expression analysis.
2.10. In situ proximity ligation assay (PLA)
In situ PLA was performed in HL-1 cardiac cells using Duolink PLA kit (Sigma-Aldrich, Inc.) as previously reported [28]. Briefly, after a 48-h transduction with Ad-Sorbs2 shRNA or with Ad-scramble RNAi at 50 MOI, cells were incubated with a pair of primary antibodies: mouse anti-Sorbs2 antibodies with rabbit anti-Nav1.5, anti-Cav1.2α, anti-Kv1.4, anti-Kv4.2, anti-Kir2.1 or anti-Kir6.2 antibodies respectively for 24 h, followed by adding a pair of oligonucleotide-labeled secondary antibodies (PLA probes) at 37 °C for 1 h. When the PLA probes were ligated, PLA signals were generated by labeled complementary oligonucleotide probes after a 100 min-amplification reaction at 37 °C, and then detected by fluorescent microscopy in the cells. The nuclei (blue) were counterstained with 4’,6-diamidino-2-phenylindole (DAPI). The PLA signals were visualized at 40x magnification under a Zeiss 510 Meta Confocal Laser Scanning Microscope equipped with DAPI/Texas Red filters.
2.11. H&E staining
Unstained, formalin-fixed, paraffin-embedded heart sections (5 μm) of WT and Sorbs2 KO mice were stained with hematoxylin and eosin (H&E) by using Hematoxylin & Eosin stain kit (Vector Laboratories, Inc., Burlingame, CA, USA). H&E stained sections were imaged using an EVOS microscope at the Microscopy and Cell Analysis Core Facility of Mayo Clinic in Rochester campus.
2.12. Chemicals
Unless otherwise mentioned, all chemicals were purchased from Sigma-Aldrich, Inc.
2.13. Statistical analysis
Data are expressed as mean± S.E.M. To compare the means between two groups, Student’s t test was used for data normally distributed; otherwise, the Mann-Whitney Rank Sum Test was employed. A paired t test was used to compare the means before and after treatment. Two-way analysis of variance (ANOVA) followed by Holm-Sidak post-hoc test was used to compare the results from multiple groups. The Fisher’s exact test was performed to compare categorical variable between two groups. Statistically significant difference was defined as p<0.05.
3. Results
3.1. Abnormal cardiac function in Sorbs2 KO mice
Male Sorbs2 KO mice at 4–5 months of age had significant lower body weights (22.97±0.60 g, n=30), systolic/diastolic blood pressures (BP) (112.9±4.2/83.7±4.5 mmHg, n=11) and the mean arterial pressure (MAP) (93.1±4.3 mmHg, n=11) compared to those of age-matched WT controls (body weights: 25.68±0.68 g, n=30, p<0.05, systolic/diastolic BPs: 131.9±4.5/99.2±4.6 mmHg, n=10, p<0.05, and MAP: 109.8±4.6 mmHg, n=10, p<0.05). Details in the changes of cardiac function indexes via magnetic resonance imaging in Sorbs2 KO mice at 4 months of age were characterized in our recent publication [6].
3.2. Abnormal cardiac electrophysiology in Sorbs2 KO mice
Sorbs2 KO mice progressively developed cardiac chamber enlargements and ECG changes as early as 1–2 months of age with rapid worsening over 4 months (Fig. 1A and 1B). Typical ECG manifestations in Sorbs2 KO mice demonstrated intra-atrial and intra-ventricular conduction delays, right bundle branch block (RBBB), and spontaneous ventricular arrythmias including ventricular extrasystoles and spontaneous polymorphic ventricular tachycardia (VT) (Fig. 1C). Such spontaneous ventricular arrhythmias were detected in 18 out of 30 mice. No spontaneous ventricular arrhythmias were found in WT mice (0/30 mice, χ2, p<0.05). Our results indicate that cardiac structural and electrical remodeling occurs spontaneously and simultaneously in Sorbs2 KO mice. The changes of ECG parameters in Sorbs2 KO mice are summarized in Table 1.
Figure 1: Development of chamber enlargement and electrical abnormalities in Sorbs2 KO mouse hearts.

A: H&E staining of cross-sections of hearts from WT and Sorbs2 KO mice at 1 month and 4 months of age. Chamber enlargements occurred in Sorbs2 KO mice as early as 1–2 months of age. B: Representative surface ECG was recorded from the same WT (upper panel) and Sorbs2 KO mice (lower panel) from 1 month to 5 months of age. The Sorbs2 KO mouse progressively developed bifid P wave and RBBB. C: Surface ECGs were recorded from a 4-month old Sorbs2 KO mouse with sinus rhythm (upper panel) and spontaneous polymorphic VT (lower panel). D: APs were elicited from right ventricular free walls from WT and Sorbs2 KO mice at 4 months of age by electrical stimuli via bipolar electrodes at 200-ms pacing cycle length. Sorbs2 KO mice had delayed excitation to electrical impulse, depolarized resting potentials, reduced APAs and upstroke velocities (dV/dt) at phase 0, and prolonged APD90 and ERP (upper panel), n=10 mice. Sustained VT was induced by programmed electrical stimulation (S1-S1=200 ms, S1-S2=70 ms) in Sorbs2 KO ventricles (lower panel), but not in WT control preparations (S1-S1=200 ms, S1-S2=30 ms). E: Abnormal cardiac APs in Sorbs2 KO mouse ventricles were reproduced in WT controls by superfusion with 0.5 μM TTX and 100 μM 4-AP to partially block Nav1.5 and Kv channels respectively (upper panel), n=7 mice. Sustained VT was induced by programmed electrical stimulation (S1-S1=200 ms, S1-S2=70 ms) in WT mice during superfusion with TTX and 4-AP (lower panel). *: p<0.05.
Table 1:
ECG parameter changes with age in Sorbs2 KO mice and WT mice
| WT mice (n=6~9) | Sorbs2 KO mice (n=8~12) | |||||||
|---|---|---|---|---|---|---|---|---|
| <2 months | 2–3 months | 3–4 months | 4–5 months | <2 months | 2–3 months | 3–4 months | 4–5 months | |
| Heart rate (beats/min) | 507.1±14.0 | 560.0±11.5 | 553.7±14.7 | 511.2± 17.8 | 519.8±27.7 | 562.2±15.1 | 542.7±9.8 | 527.9±20.7 |
| P wave duration (ms) | 12.5±0.6 | 10.0±0.7 | 10.9±0.8 | 12.0±0.6† | 13.5±0.9 | 17.0±2.1* | 22.0±2.7*# | 25.1±2.2*‡ |
| P-R interval (ms) | 38.2±1.9 | 37.8±1.2 | 37.0±1.1 | 38.4±0.9 | 39.3±1.2 | 38.6±1.6 | 39.8±1.9 | 47.0±1.5*‡ |
| QRS duration (ms) | 29.0±1.0 | 20.5±6.4 | 20.6±1.1 | 18.8±1.5 | 36.4±4.7 | 24.9±3.3 | 47.4±8.5* | 43.1±1.8* |
| R+S amplitude (mV) | 5.1±0.2 | 3.6±0.2 | 4.4±0.4 | 3.9±0.3 | 4.8±0.7 | 3.4±0.4 | 4.9±0.7 | 3.4±0.2 |
Data are presented as mean±S.E.M. Two-way ANOVA followed by Holm-Sidak post-hoc test was employed.
Between WT and Sorbs2 KO mice groups: * p<0.05, Sorbs2 KO mice vs age-mated WT mice.
Within WT mice groups: † p<0.05, WT mice at 4–5 months of age vs WT mice at <2 months, 2–3 months, or 3–4 months of age.
Within Sorbs2 KO mice groups: # p<0.05, Sorbs2 KO mice at 3–4 months of age vs Sorbs2 KO mice at < 2 months or 2–3 months of age;
p<0.05, Sorbs2 KO mice at 4–5 months of age vs Sorbs2 KO mice at < 2 months or 2–3 months of age.
APs recorded from RV endocardial free walls of Sorbs2 KO mice showed delayed excitation to electrical impulse, depolarized resting potential, reduced upstroke velocity at phase 0, prolongation of APD90 and ERP, and inducible VTs (Fig. 1D). Moreover, the changes observed in Sorbs2 KO mice were partially mimicked by application of 0.5 μM tetrodotoxin (TTX, a specific voltage-gated Na+ channel blocker) and 100 μM 4-aminopyridine (4-AP, a selective Kv channel blocker) to the cardiac tissues of WT mice, which was accompanied by a 41.7 % of VT induction (5/12 mice) (Fig. 1E). Moreover, VTs were uninducible in control preparations treated with vehicle (0/12, χ2, p<0.05). These findings strongly suggest that Sorbs2 KO mouse heart is susceptible to develop VTs and the partial suppression of Nav1.5 and Kv channel activities is sufficient to mimic the electropathophysiology of Sorbs2 KO mice.
3.3. Impaired cardiac ion channel function in the ventricular myocytes of Sorbs2 KO mice
We examined cardiac ion channel activities in the freshly isolated right ventricular myocytes from WT and Sorbs2 KO mice. The average membrane capacitance of myocytes was 133.0±7.2pF in WT mice (n=60 cells/from 20 mice) and 170.3±10.5 pF in Sorbs2 KO mice (n=50 cells/from 26 mice, p<0.05). Fig. 2A and 2B illustrate the representative recordings of whole-cell INa elicited from freshly isolated ventricular myocytes of WT and Sorbs2 KO mice at 4 months of age. Sorbs2 KO mice had a 58.8% reduction in the peak INa at −35 mV (−30.67±2.26 pA/pF in WT vs −12.64±2.58 pA/pF in KO, n=12–14 cells/from 6 mice, p<0.05). The Nav1.5 channel maximal conductance (Gmax-Nav1.5) and the reversal potential (Vrev) of Nav1.5 channels were obtained by I-V curve fitting with a 56.3% decrease of the Gmax-Nav1.5 (801.1 pS/cm2 in WT and 352.8 pS/cm2 in KO) and no change in the Vrev: (8.0±3.3 mV in WT vs 6.1±2.3 mV in KO, n=12–14 cells/from 6 mice, p=N.S.) in Sorbs2 KO mice, compared to WT mice (Fig. 2C). Voltage-dependent Nav1.5 channel activation process and associated apparent gating charge (zm) were unchanged between WT and Sorbs2 KO mice (Fig. 2D). The channel steady-state inactivation curve was leftward shifted in Sorbs2 KO mice with no change in associated apparent gating charge (zh) during inactivation. Recovery from inactivation was best described by a two-exponential fit. Sorbs2 KO mice had prolonged fast (τf) and slow (τs) components of recovery time constants (τ) compared with WT mice. The Nav1.5 channel kinetic parameters of WT and Sorbs2 KO mice are listed in Table 2.
Figure 2: Nav1.5 channel activities in the ventricular myocytes of WT and Sorbs2 KO mice.

Representative whole-cell INa elicited from freshly isolated ventricular myocytes from WT (A) and Sorbs2 KO mice (B). C: The I-V curves demonstrating a significant reduction in INa densities in Sorbs2 KO mice. D: No change in the voltage-dependent activation curve of Nav1.5 channels between WT and Sorbs2 KO mice. E: Leftward shift in Nav1.5 channel steady-state inactivation curve of Sorbs2 KO mice. F: Slowed recovery from inactivation in Sorbs2 KO mice. Data are expressed as mean± S.E.M., n=12–14 cells/6 mice for each group.
Table 2:
Kinetic parameters of Nav1.5, Cav1.2, 4-AP-sensitive Kv channels in ventricular cardiomyocytes of WT and Sorbs2 KO mice
| WT mice | Sorbs2 KO mice | |||||
|---|---|---|---|---|---|---|
| Nav1.5 | Cav1.2 | Kv | Nav1.5 | Cav1.2 | Kv | |
| Gmax (pS/cm2) | 801.1 (n=14) | 132.6 (n=14) | 188.2 (n=19) | 352.8 (n=12) | 88.6 (n=12) | 106.2 (n=18) |
| Vm-0.5 (mV) | −47.1±2.0 (n=14) | −10.1±1.6 (n=14) | 23.7 ±1.5 (n=19) | −46.7±2.7 (n=12) | 4.4±3.7* (n=12) | 26.2±1.5 (n=18) |
| Vh-0.5 (mV) | −76.2±1.6 (14) | −30.7±1.3 (n=14) | −24.3±1.3 (n=19) | −88.6±3.5* (n=12) | −28.6±1.2 (n=12) | −31.7±3.1* (n=15) |
| Zm (e0) | 11.0±1.7 (n=14) | 4.1±0.2 (n=14) | 1.6±0.1 (n=19) | 12.7±1.9 (n=12) | 2.8±0.2* (n=12) | 1.7±0.1 (n=18) |
| Zh (e0) | 4.2±0.3 (n=14) | 5.1±0.2 (n=14) | 4.1±0.2 (n=19) | 3.9±0.3 (n=12) | 5.4±0.3 (n=12) | 3.9±0.2 (n=15) |
| τf (ms) | 10.5±0.36 (n=13) | 156.4±14.9 (n=14) | 23.6±1.0 (n=12) | 27.5±2.3* (n=10) | 250.0±19.6* (n=12) | 28.6±1.9* (n=12) |
| τs (ms) | 42.8±6.8 (n=13) | 428.4±44.1 (n=12) | 232.8±65.5* (n=10) | 566.6±55.1 (n=12) | ||
Data are presented as mean±S.E.M. The numbers in parentheses are the number of cells studied. Vm-0.5: the membrane potential at half-maximal activation; Vh-0.5: the membrane potential at half-maximal inactivation; Zm: the apparent gating charge during channel activation; Zh: the apparent gating charge during channel inactivation; τf and τs represent the fast and slow time constants of recovery from inactivation, respectively.
p<0.05 vs WT mice (Student’s t-test).
Fig. 3A and 3B represent the raw tracings of whole-cell ICaL recorded from WT and Sorbs2 KO mouse ventricular myocytes. The I-V curve showed a 10-mV rightward shift in the voltage at peak ICaL with a 53.4% reduction of peak ICaL in Sorbs2 KO mice (3.0±0.6 pA/pF at +10 mV in KO, n=14 cells/6 mice), compared to those of WT mice (5.7±0.8 pA/pF at 0 mV in WT, n=12 cells/from 6 mice, p<0.05) (Fig. 3C). The maximal conductance of Cav1.2 (Gmax-Cav1.2) was decreased from 132.6 pS/cm2 in WT mice to 88.6 pS/cm2 in KO mice without change in the Vrev (53.6±2.9 in WT vs 50.5±3.7 in KO, n=12–14 cells/from 6 mice, p=N.S.). The Cav1.2 activation curve was rightward shifted in Sorbs2 KO mice with a decreased zm (Fig. 3D), while the steady-state inactivation curve and zh remained unchanged (Fig. 3E). Recovery from inactivation was best fitted by a single exponential equation and τ was prolonged in Sorbs2 KO mice (Table 2).
Figure 3: Cav1.2 channel activity in the ventricular myocytes of WT and Sorbs2 KO mice.
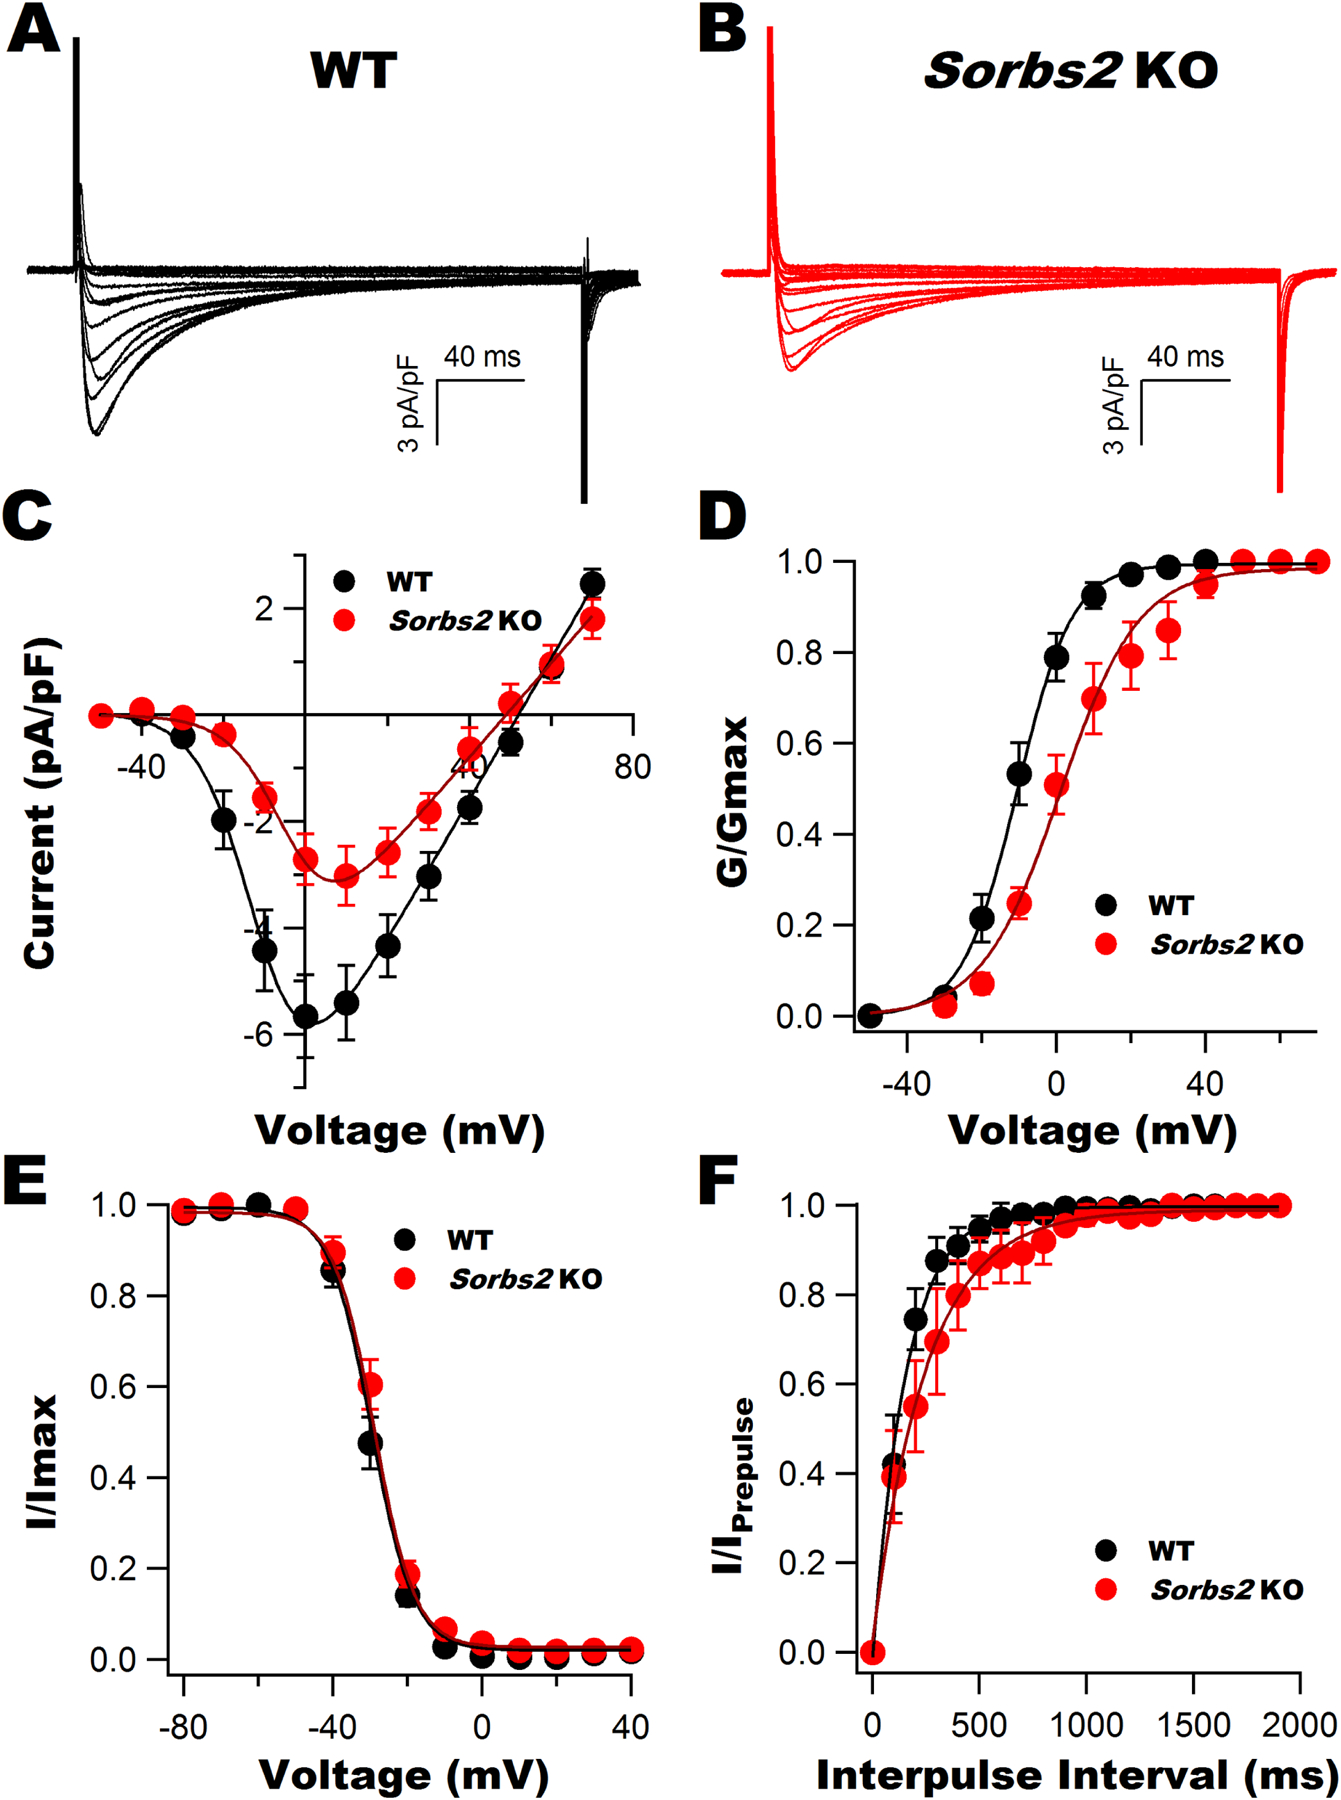
Representative whole-cell ICaL elicited from freshly isolated ventricular myocytes from WT (A) and Sorbs2 KO mice (B). C: I-V curves showing a significant reduction in ICaL densities and a 10-mV rightward shift in the voltage of peak currents in Sorbs2 KO mice. D: A rightward shift in the activation curve of Cav1.2 channels in Sorbs2 KO mice. E: The steady-state inactivation curves of Cav1.2 channels were similar between WT and Sorbs2 KO mice. F: Slowed recovery from inactivation was present in Sorbs2 KO mice. Data are expressed as mean± S.E.M., n=12–14 cells/6 mice for each group.
Fig. 4A illustrates the representative tracings of total whole-cell K+ currents (IK-total) from WT and Sorbs2 KO mouse ventricular myocytes before and after exposure to 1 mM 4-AP, as well as the 4-AP-sensitive K+ currents (IK-4-AP) obtained by digitally subtracting the remnant currents from IK-total in the presence of 1 mM 4-AP. The IK-total density was significantly reduced in Sorbs2 KO mice compared to WT mice (21.8±1.9 pA/pF in KO vs 44.2±5.0 pA/pF in WT at +60 mV, n=18–19 cells/from 6–8 mice, p<0.05) (Fig. 4B). Moreover, there was a substantial downregulation of IK-4-AP peak currents (10.2±1.5 pA/pF in KO vs 30.6±4.2 pA/pF in WT at +60 mV, n=18–19 cells/from 6–8 mie, p<0.05) and IK-4-AP late currents (3.5±0.8 pA/pF in KO vs 9.3±1.1 pA/pF in WT at +60 mV, n=18–19 cells/from 6–8 mice, p<0.05), accompanied by reduced maximal conductance Gmax-Kv-4-AP (106.2 pS/cm2 in KO vs 188.2 pS/cm2 in WT) in Sorbs2 KO mice, compared to WT controls (Fig. 4B). The 4-AP-resistent K+ current components were identical between WT and Sorbs2 KO mice. Additionally, the activation curve of IK-4-AP was unchanged in Sorbs2 KO mice. However, the steady-state inactivation curve was leftward shifted without changing the associated zh. The 4-AP-sensitive Kv channel recovery from inactivation was best fitted by a two-exponential equation (Fig. 4C) with a slower τf and normal τs in Sorbs2 KO mice (Table 2).
Figure 4: Kv channel activity in the ventricular myocytes of WT and Sorbs2 KO mice.

A: Representative total K+ channel currents recorded from freshly isolated ventricular myocytes of WT (upper panel) and Sorbs2 KO mice (lower panel) before and after bath application of 1 mM 4-AP. The 4-AP-sensitive K+ current components (defined as Kv currents) were obtained by digitally subtracting the remnant currents from total K+ currents in the presence of 1 mM 4-AP. B: The I-V curves show that the total K+ current density was reduced in Sorbs2 KO mice, while that of 4-AP resistant K+ components were unchanged. There was a significant reduction in the peak currents and the late currents of Kv channels in Sorbs2 KO mice, compared to those of WT mice. C: Kv channel activation curve was not different (left panel), but the steady-state inactivation curve was leftward shifted (middle panel) in Sorbs2 KO mice. Recovery curve from inactivation was slower in Sorbs2 KO mice (right panel). Data are expressed as mean± S.E.M., n=18–19 cells /6–8 mice for each group.
We further examined the background K+ channel currents (IK1) in ventricular myocytes in the presence of 2 mM ATP and zero GTP in the pipette solution. As shown in Fig. 5A, the IK1 showed strong inward rectifier property and its density was reduced by 36.1% in the ventricular myocytes of Sorbs2 KO mice (−15.4±1.7 pA/pF at −120 mV, n=16 cells/from 6 mice), compared to WT controls (−24.1±3.5 pA/pF at −120 mV, n=15 cells/from 6 mice, p<0.05). Assuming that intracellular Mg2+ competes for the K+-binding site of Kir2.x channels during depolarization to cause inward rectification, the I-V curves (Fig. 5B) can be fitted using the equations described in Methods. Results of curve fitting showed that the Gmax-Kir was reduced by 36.2% in Sorbs2 KO mice (462.8 pS/cm2 in WT vs 294.9 pS/cm2 in KO), but the K+ equilibrium potential was not changed (Vk: −69.1±0.7 mV in WT mice vs −70.7±0.8 mV in KO, p=N.S.). Furthermore, normalized I-V curves revealed that the outward currents of Kir2.x were 57.0% larger in Sorbs2 KO mice (0.079±0.012 pA/pF at −40 mV, n=16 cells/from 6 mice) than WT mice (0.034±0.008 pA/pF at −40, n=15 cells/from 6 mice, p<0.05), suggesting weakened inward rectifying properties of IK1 in Sorbs2 KO mice.
Figure 5: Kir2.x channel activity in the ventricular myocytes of WT and Sorbs2 KO mice.

A: Representative whole-cell IK1 recorded from freshly isolated ventricular myocytes from WT and Sorbs2 KO mice. B: The I-V curves (left) and normalized I-V curves (right) illustrating reduced IK1 densities with decreased negative slope conductance in Sorbs2 KO mice, compared to WT mice. Data are expressed as mean± S.E.M., n=15–16 cells /6 mice for each group. *: p<0.05 (Student’s t-test).
3.4. Altered ion channel gene and protein expressions related to INa, ICaL, Ito and IK1 in the ventricular myocytes of Sorbs2 KO mice
To better understand the molecular basis underlying the density and kinetics changes in INa, ICaL, Ito and IK1 in Sorbs2 KO mice, we compared their protein expressions in the ventricles between WT and Sorbs2 KO mice. As demonstrated in the Fig. 6A, the protein levels of Nav1.5 α-subunits (Nav1.5α), Cav1.2 α-subunits (Cav1.2α), Cav1.2 β2-subunits (Cavβ2), Kv1.4, Kv1.5, Kv4.2, Kv4.3, Kir2.1 and Kir6.2 were significantly downregulated, while those of Nav1.5 β1-subunit (Navβ1) and Cav1.2 α2δ1-subunits (Cavα2δ1) were upregulated with no changes in those of Nav1.5 β4-subunit (Navβ4) and Cav1.2 α2δ3-subunits (Cavα2δ3) in Sorbs2 KO mice, compared to those of WT controls.
Figure 6: Cardiac ion channel expression in WT and Sorbs2 KO mice.

A: Immunoblots showing ion channel protein levels in the ventricles of WT and Sorbs2 KO mice at 4 months of age. There was significant downregulation of Nav1.5, Navβ1, Cav1.2α, Cavβ2, Kv1.4, Kv1.5, Kv4.2, Kv4.3, Kir2.1, and Kir.6.2 protein levels, but upregulation of Cavα2δ1 protein levels and those of Navβ4 and Cavα2δ3 were unchanged in Sorbs2 KO mice, n=7–8 mice for each group. *: p<0.05. B: Scatter dot plots illustrate the relative levels of mRNA expression of cardiac ion channels normalized to the mean expression level of each gene in WT mice. The gene expressions of Scn5a, Cacna1c, Kcnd1, Kcnd3, and Kcnj2 were significantly downregulated, while those of Kcna4, Kcna5, and Kcnj11 were unchanged in Sorbs2 KO Mice, compared to those of WT controls. The gene symbols used are based on the Mouse Genome Informatics database. n=4 mice for each group, *: p<0.05 (Student’s t-test or Mann-Whitney Rank Sum test).
We further compared the expression levels of the genes encoding Nav1.5, Cav1.2, Kv1.4, Kv1.5, Kv4.2, Kv4.3, Kir2.1 and Kir6.2 in the ventricles between Sorbs2 KO mice and WT control mice. We found that the mRNA levels of Scn5a (encoding Nav1.5), Cacna1c (encoding Cav1.2α), Kcnd2 (encoding Kv4.2), Kcnd3 (encoding Kv4.3) and Kcnj2 (encoding Kir2.1) were significantly reduced, while those of Kcna4 (encoding Kv1.4), Kcna5 (encoding Kv1.5) and Kcnj11 (encoding Kir6.2) were unchanged in Sorbs2 KO mouse ventricles (Fig. 6B). These results suggest that Sorbs2 regulates the expression of Nav1.5, Cav1.2α, Kv4.2, Kv4.3 and Kir2.1 at mRNA levels, while that of of Kv1.4, Kv1.5 and Kir6.2 at posttranslational levels.
3.5. Interaction between Sorbs2 proteins and ion channel RNAs in the ventricular myocytes of mice
We performed RNA-seq analysis in the ribonucleoproteins pulled down by anti-Sorbs2 antibodies from the ventricular myocyte lysates of WT mice. Fifteen genes encoding cardiac ion channels were detected: Scn5a, Cacna1c, Cacna2d1 (encoding Cavα2δ1), Kcnj11, Kcnk3 (encoding K2P3.1), Kcnq1 (encoding Kv7.1), Kcnh2 (encoding Kv11.1), Kcnj3 (encoding Kir3.1), Kcnj5 (encoding Kir3.4), Cacnb2 (encoding Cavβ2), Kcnma1 (encoding KCa.1.1), Kcnn2 (encoding KCa2.2), Kcnj2, Kcnj12 (encoding Kir2.2), and Gja1 (encoding Cx43). To examine whether the downregulation of Sorbs2 expression directly regulates cardiac ion channel mRNA expression in vitro, we measured the mRNA expression levels of ion channels in HL-1 cardiac cells 48 h after transduction with Ad-Sorbs2-sh-RNA (50 MOI). A 134.0-fold knockdown of Sorbs2 mRNA expression reduced the mRNA levels of Nav1.5 by 2.55-fold, Cav1.2α by 1.51-fold, Kv1.4 by 20.7-fold, Kv4.2 by 2.91-fold, Kir2.1 by 20.2-fold, and Cx43 by 3.61-fold, while that of Kir6.2 was unchanged (n=6). These results indicate that Sorbs2 protein directly binds to the mRNA of Nav1.5, Cav1.2α, Kv1.4, Kv4.2, Kir2.1 and Cx43, reducing their expression and availability.
3.6. Regulation of Nav1.5, Cav1.2α, Kv1.4, Kv1.5, Kv4.2, Kv4.3, Kir2.1, Kir6.2, and Cx43 protein expression by Sorbs2 in HL-1 cardiac cells
We examined whether genetic delivery of Sorbs2 regulates the expression of Nav1.5, Cav1.2α, Kv1.4, Kv1.5, Kv4.2, Kv4.3, Kir2.1, Kir6.2 and Cx43 in HL-1 cardiac cells. A 48-h transduction with Ad-Sorbs2 (50 MOI) produced a 1.45-fold augmentation of Sorbs2 expression and it was accompanied by increased protein levels of Nav1.5 by 1.43-fold, Cav1.2α by 3.14-fold, Kv1.4 by 1.87-fold, Kv1.5 by 1.40-fold, Kv4.2 by 1.49-fold, Kv4.3 by 1.78-fold, Kir2.1 by 1.42-fold, and Cx43 by 1.86-fold, but that of Kir6.2 was unchanged (Fig. 7). These results indicate that increased Sorbs2 expression upregulates the protein levels of Nav1.5, Cav1.2α, Kv1.4, Kv1.5, Kv4.2, Kv4.3, Kir2.1, Cx43 in vitro. However, Sorbs2 has no effects on Kir6.2 expression.
Figure 7: Regulation of Nav1.5, Cav1.2α, Kv1.4, Kv1.5, Kv4.2, Kv4.3, Kir2.1 and Kir6.2 protein expression by Sorbs2 in HL-1 cardiac cells.

A: Immunoblots illustrate the protein expressions of ion channels in HL-1 cardiac cells 48 h after transduction with Ad-Sorbs2 or with Ad-CMV as controls. Augmentation of Sorbs2 expression by Ad-Sorbs2 resulted in a significant increase in Nav1.5, Cav1.2α, Kv1.4, Kv1.5, Kv4.2, Kv4.3, Kir2.1 and Cx43 expression and no change in Kir6.2 protein levels in HL-1 cells, compared to cells with Ad-CMV transduction. n=3–4 for each group. *: p<0.05 (Student’s t-test).
3.7. Protein interaction between Sorbs2 and Nav1.5, Cav1.2α, Kv1.4, Kv4.2, Kir2.1, Kir6.2 in HL-1 cardiac cells
We determined the protein interaction between Sorbs2 and Nav1.5, Cav1.2α, Kv1.4, Kv4.2, Kir2.1, Kir 6.2 in HL-1 cardiac cells using in situ PLA, a powerful technology that permits detection of protein-protein interactions in situ with a distance < 40 nm at endogenous cellular levels. As illustrated in Fig. 8, the fluorescence signals (red dots) were detected by PLA probes after amplification reaction at 37 °C in HL-1 cells incubated with a pair of primary antibodies of mouse anti-Sorbs2 antibody with rabbit anti-Nav1.5, anti-Cav1.2α, anti-Kv1.4, anti-Kir2.1, or anti-Kir6.2 antibodies, but not in cells incubated with mouse anti-Sorbs2 and rabbit anti-Kv4.2 antibodies, suggesting a proximity interaction of Sorbs2 proteins with Nav1.5, Cav1.2α, Kv1.4, Kir2.1 and Kir6.2 proteins, but not with Kv4.2 proteins. Such protein interactions between Sorbs2 and these ion channels were markedly suppressed by silencing of Sorbs2 in HL-1 cells.
Figure 8: Protein interaction between Sorbs2 WT and Nav1.5, Cav1.2α, Kv1.4, Kv4.2, Kir2.1, Kir6.2 in HL-1 cardiac cells.

In situ PLA was performed in HL-1 cardiac cells 48 h after transduction with Ad-Sorbs2 shRNA or Ad-scramble RNAi. The fluorescent PLA signals (red dots) were generated by labeled complementary oligonucleotide probes (PLA probes) after a 100 min-amplification reaction at 37 °C only when a pair of primary mouse anti-Sorbs2 antibodies with rabbit anti-Nav1.5 (A), anti-Cav1.2α (B), anti-Kv1.4 (C), anti-Kv4.2 (D), anti-Kir2.1 (E) or anti-Kir6.2 antibodies (F) were ligated. The nuclei (blue) were counterstained with DAPI. The PLA signals were visualized at 40 x magnification under a Zeiss 510 Meta Confocal Laser Scanning Microscope equipped with DAPI/Texas Red filters. Sorbs2 protein physically interacted with that of Nav1.5, Cav1.2α, Kv1.4, Kir2.1 and Kir6.2, but not with Kv4.2. These fluorescent signals were abolished in the cells after silencing of Sorbs2 using shRNA, compared to controls with scramble RNAi. Average fluorescent puncta per cell and statistical difference are illustrated in the bar graphs. n=15 cells for each group. *: p<0.05 (Student’s t-test).
Sorbs2 is known to interact with target proteins through its N-terminal SoHo domain and C-terminal SH3 domains [29]. To Further determine the role of Sorbs2 SH3 domains in protein interaction between Sorbs2 and Nav1.5, Cav1.2α, Kv1.4, Kir2.1, Kir6.2, we performed in situ PLA in HEK293 cells 48 h after co-transfection of EGFP-Sorbs2 WT or EGFP-Sorbs2ΔSH3 deletion cDNAs with Nav1.5, Cav1.2α, Kv1.4, Kir2.1, and Kir6.2 WT cDNAs respectively, using mouse anti-EGFP antibody paired with rabbit anti-Nav1.5, anti-Cav1.2α, anti-Kv1.4, anti-Kir2.1 and anti-Kir6.2 antibodies. As shown in Fig. 9, the proximity interaction between Sorbs2ΔSH3 and Nav1.5, Cav1.2α, and Kv1.4 proteins was abrogated, but its interaction with Kir2.1 and Kir6.2 was retained. Moreover, the membrane expression of Nav1.5, Cav1.2α, and Kv1.4 was remarkably downregulated, but that of Kir2.1 and Kir6.2 remained unchanged in the cells with Sorbs2ΔSH3 expression, compared with Sorbs2 WT controls. These results indicate that the SH3 domains of Sorbs2 are critical for protein interaction with and the surface expression of Nav1.5, Cav1.2α, and Kv1.4. Whereas the SH3 domain does not involve the Sorbs2 interaction with Kir2.1 and Kir6.2, nor does it regulate their membrane expression.
Figure 9: Effects of Sorbs2 SH3 domains on the regulation of Nav1.5, Cav1.2α, Kv1.4, Kir2.1 and Kir6.2 channel membrane expression in HEK293 cells.

EGFP-tagged Sorbs2 WT and the SH3 domain deletion (EGFP-Sorbs2ΔSH3) cDNAs were transiently co-transfected with Nav1.5, Cav1.2α, Kv1.4, Kir2.1, or Kir6.2 cDNAs into HEK293 cells respectively. After a 48-h transfection, in situ PLA was performed using a mouse anti-EGFP antibody, paired with rabbit anti-Nav1.5, anti-Cav1.2α, anti-Kv1.4, anti-Kir2.1 or anti-Kir6.2 antibodies. The fluorescent PLA signals (red dots) are undetected in the cells co-expressing EGFP-Sorbs2ΔSH3 with Nav1.5 (A), Cav1.2α (B), or Kv1.4 (C), but they are still observed in the cells co-expressing Sorbs2ΔSH3 with Kir2.1 (D) and Kir6.2 (E), compared to EGFP-Sorbs2 WT controls. Average fluorescent puncta per cell are illustrated in the bar graphs. n=12–20 cells for each group. *: p<0.05 (Student’s t-test). The immunoblots show the cytoplasmic and surface expressions of Nav1.5 (A), Cav1.2α (B), Kv1.4 (C), Kir2.1 (D), and Kir6.2 (E) proteins in the same conditions. The relative ratio of surface and cytoplasmic expressions of proteins normalized to GAPDH (as a load control) is illustrated in the bar graphs. Expression of Sorbs2ΔSH3 markedly downregulates the ratio of surface and cytoplasmic expressions in Nav1.5, Cav1.2α, and Kv1.4, but not in Kir2.1 and Kir6.2 in comparison to Sorbs2 WT expression.
4. Discussion
In this study, we systematically examined the roles of Sorbs2 on cardiac ion channel expression and function using Sorbs2 KO mice. We have made several important findings. First, Sorbs2 KO mice simultaneously develop cardiac structural and electrical remodeling as early as 1 to 2 months of age. These animals have spontaneous life-threatening arrhythmias and die prematurely. Second, electrophysiological studies reveal abnormal APs and inducible VTs in Sorbs2 KO mouse ventricles, as well as abnormal current densities and altered gating kinetics in Nav1.5, Cav1.2, Kv and Kir channels in freshly isolated cardiomyocytes from Sorbs2 KO mice. Third, Sorbs2 physically interacts with the RNAs and proteins of ion channels in cardiomyocytes and directly regulates channel expressions in vitro. Hence, Sorbs2 is critical for cardiac ion channel physiology and electrical remodeling.
Nav1.5 channels are responsible for the rate of depolarization in cardiac AP phase 0, and Navβ subunits modulate Nav1.5 channel activity, either by affecting the channel intrinsic properties or by regulating the process of trafficking to the cell surface [30]. Patch clamp experiments unraveled that Sorbs2 KO mice have reduced INa and Gmax-Nav1.5 with unchanged voltage-dependent activation, but impaired steady-state inactivation and recovery from inactivation. According to allosteric models of Nav1.5 channels [31], this kinetics profile proves that Sorbs2 deficiency-induced Nav1.5 dysregulation is mainly attributed to an acceleration of transition from closed/open states to inactivated state or a reduction of transition from inactivated states to closed states, resulting in a decrease of Nav1.5 channel available for opening in the cardiomyocytes. It is supported by a significant downregulation of Nav1.5 mRNA and protein levels in the cardiomyocytes of Sorbs2 KO mice. However, a leftward shift in Nav1.5 steady-state inactivation curve in Sorbs2 KO mice could be due to attenuated channel protein tyrosine phosphorylation, since inhibition of tyrosine kinesis would shift the voltage for Nav1.5 channel steady-state inactivation to more hyperpolarized potentials [32]. Although Navβ1 expression was increased in Sorbs2 KO mice, it was insufficient to compensate the steady-state inactivation of Nav1.5 channel shifted toward hyperpolarization. In addition, Cx43 is abundantly expressed in myocardia, particularly concentrated at the intercalated discs, and is a key determinant of electrical impulse conduction velocity and impulse propagation in the heart [6]. A decrease of Cx43 expression in cardiomyocytes suppressed Nav1.5 expression and INa density, resulting in conduction delay and development of VTs in cardiac-specific Gja1 KO mice [33, 34]. We have reported that the mRNA and protein expressions of Cx43 were markedly decreased in the myocardia of Sorbs2 KO mice [6]. Hence, downregulated Cx43 expression together with Nav1.5 channel malfunction would greatly impair electrical conduction and impulse propagation in Sorbs2 KO mouse hearts. These are the underlying mechanisms of ECG abnormalities in Sorbs2 KO mice, including P wave abnormalities, RBBB, and development of spontaneous and inducible VTs.
ICaL and Gmax-Cav1.2 were markedly reduced in Sorbs2 KO mice. Unlike Nav1.5, the Cav1.2 channel activation curve was rightward shifted by 10 mV with a significant decrease in zm during channel activation, indicating that the transitions from channel multiple closed states to the open state were reduced in Sorbs2 KO mice. Moreover, Sorbs2 KO mice had a slower recovery from inactivation without changing Cav1.2 steady-state inactivation kinetics, which suggests the transition between inactivated states and closed states of Cav1.2 channels in Sorbs2 KO mice is complex and it must be accompanied by increased transitions from the open state to several closed states to stabilize the fraction of Cav1.2 channel available for opening [35]. Previous studies have shown that co-expression of Cavβ2 not only increased ICaL density, but also produced a leftward shift of channel I-V relationship [36]. We found that both mRNA and protein expression of Cav1.2α and Cavβ2 were significantly downregulated in Sorbs2 KO mice, which explains the reduced ICaL and rightward shifted I-V curves. In addition, Cavα2δ1 and Cavα2δ3 are densely expressed in mouse ventricular myocytes and their presence would lead to accelerated Cav1.2 channel inactivation [37]. However, we did not find a significant difference in the Cav1.2 channel inactivation kinetics in Sorbs2 KO, and this could be due to compensatory effects caused by the discordance between increased Cavα2δ1 expression and decreased Cavα2δ3 expression in Sorbs2 KO mice.
Kv channels play a pivotal role in myocardial repolarization. Based on the kinetics and electrophysiological properties, two type Kv channel currents have been identified: the transient outward K+ currents (Ito) and the delayed rectifier K+ currents (IK) in myocardia [38]. Kv4.2 and Kv4.3 channels contribute to the fast component of Ito (Ito,f) and Kv1.4 to the slow component of Ito (Ito,s), while Kv11.1 and Kv7.1 are the major determinants of the rapidly (IKr) and slowly (IKs) activating components of IK (IKr and IKs) [38]. In mouse ventricular myocytes, two additional components of IK, namely IK, slow1 and IK, slow2 mediated by Kv1.5 and Kv2.1 respectively, have been identified [39, 40]. Among these channels, Ito,f, Ito,s and IK,slow1 are 4-AP sensitive [38]. Hence, the results that show decrease in the 4-AP-sensitive (1 mM) K+ current density and kinetics can be attributed to the downregulation of Kv1.4, Kv1.5, Kv4.2 and Kv4.3 expression and function in the ventricular myocytes from Sorbs2 KO mice.
The Kir channels are characterized as “strong” and “weak” inward rectifiers, and they control the resting membrane potentials and APDs in cardiomyocytes [41]. There are two types of strong inward rectifier Kir channels in cardiomyocytes: Kir2.x contributes to the constitutively active IK1 and is more prominent in ventricular tissue, while Kir3.x corresponds to IKAch that is gated by G-proteins and ligands, and is more prominent in atrial tissue [41]. Kir6.2 is a weak inward rectifier and affects the ADP90 in ventricular myocardia [42]. In this study, we determined IK1 in the presence of 2 mM ATP and absence of GTP, so Kir3.x and Kir6.x currents would not be elicited. We found that the Gmax-Kir and inwardly rectification of Kir2.x channels were reduced, mainly due to the downregulation Kir2.x protein expression in Sorbs2 KO mice. Resulted in a 13-mV depolarization in the resting potentials of cardiomyocytes would virtually affect the gating kinetics on all cardiac voltage-dependent ion channels in Sorbs2 KO mice.
Interestingly, Sorbs2 exhibits a direct regulatory effect on the expression of some cardiac ion channels, independent of cardiac structure remodeling. It is known that RNA binding proteins interact with the coding and noncoding RNAs to ensure the coordination of RNA editing, location, stability and translation in mammalian cells [43]. Recently, Sorbs2 has been identified as an RNA-binding protein that interacts with many genes encoding ion channels (CACNA1G and SCN1B) in human ovarian cancer cell lines [44], and gap junction proteins (Gja1) in mouse cardiomyocytes [6]. In this study, we identified 14 mRNAs of genes encoding sarcolemmal ion channels pulled down by anti-Sorbs2 antibodies in mouse cardiomyocytes. Furthermore, silencing of Sorbs2 markedly downregulates the mRNA levels of the ion channels that we examined (Nav1.5, Cav1.2α, Kv1.4, Kv4.2, Kir2.1, Cx43, except Kir6.2). Hence, Sorbs2 is an important regulator of mRNA expression of cardiac ion channels. It is also known that cytoskeletal and scaffold proteins are central platforms for targeting and clustering of ion channels at membrane sites, linking ion channels, receptors and downstream signaling pathways together to form channel-receptor-enzyme microdomain complexes, thereby provide structural stability and functional regulation of ion channels in the cell membrane [45–47]. Sorbs2 is a cytoskeletal protein, known to bind to target proteins containing the SH3 domain-binding motif (xPxxPx, where P represents proline and x denotes any amino acid) [29]. Interestingly, many cardiac ion channels have at least one SH3 domain-binding motifs. Using PLA technology, we demonstrated that Sorbs2 interacts with Nav1.5, Cav1.2α, Kv1.4, Kir2.1 and Kir6.2, but not that of Kv4.2, in HL-1 cardiac cells. Such interactions between Sorbs2 and Nav1.5, Cav1.2α, and Kv1.4 proteins were abrogated by deleting the SH3 domains of Sorbs2, indicating that the SH3 domains are essential for the protein interaction between Sorbs2 and these ion channels. Since the Sorbs2ΔSH3 deletion did not interrupt the Sorbs2 interaction with Kir2.1 and Kir6.2, it is possible that the SoHo domain of Sorbs2 may participate in such interaction. The physiological relevance of SH3 domains in Sorbs2 for the regulation of cardiac ion channel membrane expression is supported by the results that lack of the SH3 domains reduced the cell surface expression of Nav1.5, Cav1.2α, and Kv1.4. Because both mRNA and protein surface expressions of Nav1.5 and Cav1.2 are modulated by Sorbs2, we believe that Sorbs2 may function as an RNA-binding protein and as a scaffold protein in controlling Nav1.5 and Cav1.2α channel expression and function in cardiac myocytes. In comparison, Sorbs2 binds to the mRNAs but not to the proteins of Kv4.2 and Kir2.1, the RNA-binding protein mechanism of Sorbs2 may play a major role in regulating Kv4.2 and Kir2.1 expression. In contrast, Kv1.4 mRNA was absent in the ribonucleoprotein pulled down by anti-Sorbs2 antibodies. The stabilization of Kv1.4 cell surface expression is most likely ascribed to the Sorbs2-scaffolding mechanism. Since Sorbs2 neither binds to Kir6.2 mRNA and protein nor regulates their expression in vitro, a decrease of Kir6.2 protein levels in Sorbs2 KO mouse hearts is caused by other mechanisms.
Our study has several potential limitations. Frist, there are broad changes of cardiac electrophysiology in Sorbs2 KO mice, howbeit we only selected some important ion channels to study. Second, the molecular mechanisms regarding the regulation of cardiac ion channel expression are complex. Although the RNA-binding protein and the scaffold protein regulatory mechanisms of Sorbs2 were explored, it is possible that Sorbs2 may regulate cardiac ion channels through other mechanisms. Third, the precise molecular insights into the modulation of cardiac ion channel expression via the Sorbs2 RNA-binding protein and scaffold protein regulatory pathways warrant further investigations.
5. Conclusion
We have provided compelling evidence that Sorbs2 directly modulates important ion channels in cardiac myocytes, both in their levels of expression and in their biophysical properties. Sorbs2 deficiency promotes cardiac ion channelopathies, leading to cardiac electrical remodeling and the development of life-threatening arrhythmias.
Supplementary Material
Highlights.
Sorbs2 is abundantly expressed in the heart and is associated with cardiac arrhythmogenesis. However, the underlying ionic mechanism is poorly understood.
Sorbs2 KO mice develop cardiac chamber enlargement and conduction delay, causing spontaneous polymorphic ventricular tachycardia.
Sorbs2 KO mice display abnormal cardiac action potentials, which is intimately related to altered cardiac ion channel function and expression.
Sorbs2 physically interacts with the RNAs and/or proteins of cardiac ion channels, directly regulating their expressions and function in vitro.
Loss of Sorbs2 leads to cardiac electrical remodeling and the development of life-threatening arrhythmias.
Acknowledgement
We would like to thank Dr. Mrunal K. Dehankar, The Department of Biomedical Statistics and Informatics of Mayo Clinic, for performing the gene expression analysis.
Funding
This work was supported by grants from the National Institute of Health (R01-HL074180, R01-HL107304, R01-HL081753), the American Diabetes Association (JFA-07-39, 1-12-BS-119, 1-16-IBS-195, 1-18-IBS-210), and the Prospective Research Award from the Department of Cardiovascular Medicine of Mayo Clinic and from the Mayo Foundation.
Abbreviations
- 4-AP
4-aminopyridine
- Ad
adenovirus
- AP
action potential
- APA
action potential amplitude
- APD90
action potential duration at 90% repolarization
- BP
blood pressure
- Cav1.2
L-type Ca2+ channel
- Cav1.2α1C
L-type Ca2+ channel α1C-subunit
- Cavβ
L-type Ca2+ channel β-subunit
- Cavα2δ
L-type Ca2+ channel α2δ-subunit
- ECG
electrocardiogram
- ERP
effective refectory period
- Gmax
the maximal conductance
- IK1
background strong inward-rectifier K+ current
- IK-total
total K+ current
- Ito
transient outward K+ current
- Kv
voltage-gated K+ channels
- Kir
inward rectifier K+ channels
- MAP
mean arterial pressure
- Nav1.5
voltage-gated Na+ channel
- Nav1.5α
voltage-gated Na+ channel α-subunit
- Navβ
voltage-gated Na+ channel β-subunit
- PLA
proximity ligation assay
- RBBB
right bundle branch block
- RNA-seq
RNA sequencing
- RPKM
Reads Per Kilobase of transcript per Million mapped reads
- RV
right ventricle
- Sorbs2
the Sorbin and SH3 domain-containing protein 2
- Vk
K+ equilibrium potential
- Vh-0.5
voltage at half-maximal inactivation
- Vm-0.5
voltage at half-maximal activation
- Vmax
the maximal velocity
- Vrev
reversal potential
- VT
ventricular tachycardia
- TTX
tetrodotoxin
- zm
apparent gating charge movement during channel activation
- zh
apparent gating charge movement during channel inactivation
Footnotes
Publisher's Disclaimer: This is a PDF file of an unedited manuscript that has been accepted for publication. As a service to our customers we are providing this early version of the manuscript. The manuscript will undergo copyediting, typesetting, and review of the resulting proof before it is published in its final form. Please note that during the production process errors may be discovered which could affect the content, and all legal disclaimers that apply to the journal pertain.
Conflict of interest
None declared.
Declaration of interests
The authors declare that they have no known competing financial interests or personal relationships that could have appeared to influence the work reported in this paper.
References
- [1].Srinivasan NT, Schilling RJ, Sudden Cardiac Death and Arrhythmias, Arrhythm Electrophysiol Rev, 7 (2018) 111–117. [DOI] [PMC free article] [PubMed] [Google Scholar]
- [2].Mehra R, Global public health problem of sudden cardiac death, J Electrocardiol, 40 (2007) S118–122. [DOI] [PubMed] [Google Scholar]
- [3].Fernandez-Falgueras A, Sarquella-Brugada G, Brugada J, Brugada R, Campuzano O, Cardiac Channelopathies and Sudden Death: Recent Clinical and Genetic Advances, Biology (Basel), 6 (2017). [DOI] [PMC free article] [PubMed] [Google Scholar]
- [4].Sanger JM, Wang J, Gleason LM, Chowrashi P, Dube DK, Mittal B, Zhukareva V, Sanger JW, Arg/Abl-binding protein, a Z-body and Z-band protein, binds sarcomeric, costameric, and signaling molecules, Cytoskeleton (Hoboken), 67 (2010) 808–823. [DOI] [PMC free article] [PubMed] [Google Scholar]
- [5].Anekal PV, Yong J, Manser E, Arg kinase-binding protein 2 (ArgBP2) interaction with alpha-actinin and actin stress fibers inhibits cell migration, J Biol Chem, 290 (2015) 2112–2125. [DOI] [PMC free article] [PubMed] [Google Scholar]
- [6].Ding Y, Yang J, Chen P, Lu T, Jiao K, Tester DJ, Giudicessi JR, Jiang K, Ackerman MJ, Li Y, Wang DW, Lee HC, Xu X, Knockout of SORBS2 Protein Disrupts the Structural Integrity of Intercalated Disc and Manifests Features of Arrhythmogenic Cardiomyopathy, J Am Heart Assoc, (2020) e017055. [DOI] [PMC free article] [PubMed] [Google Scholar]
- [7].Kioka N, Ueda K, Amachi T, Vinexin CAP /ponsin, ArgBP2: a novel adaptor protein family regulating cytoskeletal organization and signal transduction, Cell Struct Funct, 27 (2002) 1–7. [DOI] [PubMed] [Google Scholar]
- [8].Bang C, Batkai S, Dangwal S, Gupta SK, Foinquinos A, Holzmann A, Just A, Remke J, Zimmer K, Zeug A, Ponimaskin E, Schmiedl A, Yin X, Mayr M, Halder R, Fischer A, Engelhardt S, Wei Y, Schober A, Fiedler J, Thum T, Cardiac fibroblast-derived microRNA passenger strand-enriched exosomes mediate cardiomyocyte hypertrophy, J Clin Invest, 124 (2014) 2136–2146. [DOI] [PMC free article] [PubMed] [Google Scholar]
- [9].Geng J, Picker J, Zheng Z, Zhang X, Wang J, Hisama F, Brown DW, Mullen MP, Harris D, Stoler J, Seman A, Miller DT, Fu Q, Roberts AE, Shen Y, Chromosome microarray testing for patients with congenital heart defects reveals novel disease causing loci and high diagnostic yield, BMC Genomics, 15 (2014) 1127. [DOI] [PMC free article] [PubMed] [Google Scholar]
- [10].Molck MC, Simioni M, Paiva Vieira T, Sgardioli IC, Paoli Monteiro F, Souza J, Fett-Conte AC, Felix TM, Lopes Monlleo I, Gil-da-Silva-Lopes VL, Genomic imbalances in syndromic congenital heart disease, J Pediatr (Rio J), 93 (2017) 497–507. [DOI] [PubMed] [Google Scholar]
- [11].Li C, Liu F, Liu S, Pan H, Du H, Huang J, Xie Y, Li Y, Zhao R, Wei Y, Elevated myocardial SORBS2 and the underlying implications in left ventricular noncompaction cardiomyopathy, EBioMedicine, 53 (2020) 102695. [DOI] [PMC free article] [PubMed] [Google Scholar]
- [12].Sun X, Qian LL, Li Y, Pfiefer TM, Wang XL, Lee HC, Lu T, Regulation of KCNMA1 transcription by Nrf2 in coronary arterial smooth muscle cells, J Mol Cell Cardiol, 140 (2020) 68–76. [DOI] [PMC free article] [PubMed] [Google Scholar]
- [13].Yi F, Ling TY, Lu T, Wang XL, Li J, Claycomb WC, Shen WK, Lee HC, Down-regulation of the small conductance calcium-activated potassium channels in diabetic mouse atria, J Biol Chem, 290 (2015) 7016–7026. [DOI] [PMC free article] [PubMed] [Google Scholar]
- [14].Lu T, Ye D, Wang X, Seubert JM, Graves JP, Bradbury JA, Zeldin DC, Lee HC, Cardiac and vascular KATP channels in rats are activated by endogenous epoxyeicosatrienoic acids through different mechanisms, J Physiol, 575 (2006) 627–644. [DOI] [PMC free article] [PubMed] [Google Scholar]
- [15].Anderson ME, Braun AP, Wu Y, Lu T, Schulman H, Sung RJ, KN-93, an inhibitor of multifunctional Ca++/calmodulin-dependent protein kinase, decreases early afterdepolarizations in rabbit heart, J Pharmacol Exp Ther, 287 (1998) 996–1006. [PubMed] [Google Scholar]
- [16].Lu T, Lee HC, Kabat JA, Shibata EF, Modulation of rat cardiac sodium channel by the stimulatory G protein alpha subunit, J Physiol, 518 ( Pt 2) (1999) 371–384. [DOI] [PMC free article] [PubMed] [Google Scholar]
- [17].Hille B, Ion channels of excitable membranes, 3rd ed., Sinauer, Sunderland, Mass., 2001. [Google Scholar]
- [18].Tamargo J, Caballero R, Gomez R, Valenzuela C, Delpon E, Pharmacology of cardiac potassium channels, Cardiovasc Res, 62 (2004) 9–33. [DOI] [PubMed] [Google Scholar]
- [19].Standen NB, Stanfield PR, Inward rectification in skeletal muscle: a blocking particle model, Pflugers Arch, 378 (1978) 173–176. [DOI] [PubMed] [Google Scholar]
- [20].Roignot J, Bonacci T, Ghigo E, Iovanna JL, Soubeyran P, Oligomerization and phosphorylation dependent regulation of ArgBP2 adaptive capabilities and associated functions, PLoS One, 9 (2014) e87130. [DOI] [PMC free article] [PubMed] [Google Scholar]
- [21].Padanilam BJ, Lu T, Hoshi T, Padanilam BA, Shibata EF, Lee HC, Molecular determinants of intracellular pH modulation of human Kv1.4 N-type inactivation, Mol Pharmacol, 62 (2002) 127–134. [DOI] [PubMed] [Google Scholar]
- [22].Lu T, Hong MP, Lee HC, Molecular determinants of cardiac K(ATP) channel activation by epoxyeicosatrienoic acids, J Biol Chem, 280 (2005) 19097–19104. [DOI] [PubMed] [Google Scholar]
- [23].Wang XL, Lu T, Sun X, Lee HC, Membrane trafficking of large conductance Ca(2+)- and voltage-activated K(+) (BK) channels is regulated by Rab4 GTPase, Biochim Biophys Acta Mol Cell Res, 1867 (2020) 118646. [DOI] [PubMed] [Google Scholar]
- [24].McKenna A, Hanna M, Banks E, Sivachenko A, Cibulskis K, Kernytsky A, Garimella K, Altshuler D, Gabriel S, Daly M, DePristo MA, The Genome Analysis Toolkit: a MapReduce framework for analyzing next-generation DNA sequencing data, Genome Res, 20 (2010) 1297–1303. [DOI] [PMC free article] [PubMed] [Google Scholar]
- [25].Wang C, Davila JI, Baheti S, Bhagwate AV, Wang X, Kocher JP, Slager SL, Feldman AL, Novak AJ, Cerhan JR, Thompson EA, Asmann YW, RVboost: RNA-seq variants prioritization using a boosting method, Bioinformatics, 30 (2014) 3414–3416. [DOI] [PMC free article] [PubMed] [Google Scholar]
- [26].Wang L, Wang S, Li W, RSeQC: quality control of RNA-seq experiments, Bioinformatics, 28 (2012) 2184–2185. [DOI] [PubMed] [Google Scholar]
- [27].Robinson MD, McCarthy DJ, Smyth GK, edgeR: a Bioconductor package for differential expression analysis of digital gene expression data, Bioinformatics, 26 (2010) 139–140. [DOI] [PMC free article] [PubMed] [Google Scholar]
- [28].Lu T, Wang XL, Chai Q, Sun X, Sieck GC, Katusic ZS, Lee HC, Role of the endothelial caveolae microdomain in shear stress-mediated coronary vasorelaxation, J Biol Chem, 292 (2017) 19013–19023. [DOI] [PMC free article] [PubMed] [Google Scholar]
- [29].Kurochkina N, Guha U, SH3 domains: modules of protein-protein interactions, Biophys Rev, 5 (2013) 29–39. [DOI] [PMC free article] [PubMed] [Google Scholar]
- [30].Abriel H, Cardiac sodium channel Na(v)1.5 and interacting proteins: Physiology and pathophysiology, J Mol Cell Cardiol, 48 (2010) 2–11. [DOI] [PubMed] [Google Scholar]
- [31].Zhang Z, Zhao Z, Liu Y, Wang W, Wu Y, Ding J, Kinetic model of Nav1.5 channel provides a subtle insight into slow inactivation associated excitability in cardiac cells, PLoS One, 8 (2013) e64286. [DOI] [PMC free article] [PubMed] [Google Scholar]
- [32].Wang Y, Wagner MB, Kumar R, Cheng J, Joyner RW, Inhibition of fast sodium current in rabbit ventricular myocytes by protein tyrosine kinase inhibitors, Pflugers Arch, 446 (2003) 485–491. [DOI] [PubMed] [Google Scholar]
- [33].van Rijen HV, Eckardt D, Degen J, Theis M, Ott T, Willecke K, Jongsma HJ, Opthof T, de Bakker JM, Slow conduction and enhanced anisotropy increase the propensity for ventricular tachyarrhythmias in adult mice with induced deletion of connexin43, Circulation, 109 (2004) 1048–1055. [DOI] [PubMed] [Google Scholar]
- [34].Jansen JA, Noorman M, Musa H, Stein M, de Jong S, van der Nagel R, Hund TJ, Mohler PJ, Vos MA, van Veen TA, de Bakker JM, Delmar M, van Rijen HV, Reduced heterogeneous expression of Cx43 results in decreased Nav1.5 expression and reduced sodium current that accounts for arrhythmia vulnerability in conditional Cx43 knockout mice, Heart Rhythm, 9 (2012) 600–607. [DOI] [PMC free article] [PubMed] [Google Scholar]
- [35].Beyl S, Depil K, Hohaus A, Stary-Weinzinger A, Timin E, Shabbir W, Kudrnac M, Hering S, Physicochemical properties of pore residues predict activation gating of Ca V1.2: a correlation mutation analysis, Pflugers Arch, 461 (2011) 53–63. [DOI] [PMC free article] [PubMed] [Google Scholar]
- [36].Bodi I, Mikala G, Koch SE, Akhter SA, Schwartz A, The L-type calcium channel in the heart: the beat goes on, J Clin Invest, 115 (2005) 3306–3317. [DOI] [PMC free article] [PubMed] [Google Scholar]
- [37].Klugbauer N, Lacinova L, Marais E, Hobom M, Hofmann F, Molecular diversity of the calcium channel alpha2delta subunit, J Neurosci, 19 (1999) 684–691. [DOI] [PMC free article] [PubMed] [Google Scholar]
- [38].Nerbonne JM, Molecular Basis of Functional Myocardial Potassium Channel Diversity, Card Electrophysiol Clin, 8 (2016) 257–273. [DOI] [PMC free article] [PubMed] [Google Scholar]
- [39].Guo W, Xu H, London B, Nerbonne JM, Molecular basis of transient outward K+ current diversity in mouse ventricular myocytes, J Physiol, 521Pt 3 (1999) 587–599. [DOI] [PMC free article] [PubMed] [Google Scholar]
- [40].Xu H, Barry DM, Li H, Brunet S, Guo W, Nerbonne JM, Attenuation of the slow component of delayed rectification, action potential prolongation, and triggered activity in mice expressing a dominant-negative Kv2 alpha subunit, Circ Res, 85 (1999) 623–633. [DOI] [PubMed] [Google Scholar]
- [41].Anumonwo JM, Lopatin AN, Cardiac strong inward rectifier potassium channels, J Mol Cell Cardiol, 48 (2010) 45–54. [DOI] [PMC free article] [PubMed] [Google Scholar]
- [42].Lu T, Hoshi T, Weintraub NL, Spector AA, Lee HC, Activation of ATP-sensitive K(+) channels by epoxyeicosatrienoic acids in rat cardiac ventricular myocytes, J Physiol, 537 (2001) 811–827. [DOI] [PMC free article] [PubMed] [Google Scholar]
- [43].Hentze MW, Castello A, Schwarzl T, Preiss T, A brave new world of RNA-binding proteins, Nat Rev Mol Cell Biol, 19 (2018) 327–341. [DOI] [PubMed] [Google Scholar]
- [44].Zhao L, Wang W, Huang S, Yang Z, Xu L, Yang Q, Zhou X, Wang J, Shen Q, Wang C, Le X, Feng M, Zhou N, Lau WB, Lau B, Yao S, Yi T, Wang X, Zhao X, Wei Y, Zhou S, The RNA binding protein SORBS2 suppresses metastatic colonization of ovarian cancer by stabilizing tumor-suppressive immunomodulatory transcripts, Genome Biol, 19 (2018) 35. [DOI] [PMC free article] [PubMed] [Google Scholar]
- [45].Lu T, Zhang DM, Wang XL, He T, Wang RX, Chai Q, Katusic ZS, Lee HC, Regulation of coronary arterial BK channels by caveolae-mediated angiotensin II signaling in diabetes mellitus, Circulation research, 106 (2010) 1164–1173. [DOI] [PMC free article] [PubMed] [Google Scholar]
- [46].Good MC, Zalatan JG, Lim WA, Scaffold proteins: hubs for controlling the flow of cellular information, Science, 332 (2011) 680–686. [DOI] [PMC free article] [PubMed] [Google Scholar]
- [47].Abriel H, Rougier JS, Jalife J, Ion channel macromolecular complexes in cardiomyocytes: roles in sudden cardiac death, Circ Res, 116 (2015) 1971–1988. [DOI] [PMC free article] [PubMed] [Google Scholar]
Associated Data
This section collects any data citations, data availability statements, or supplementary materials included in this article.