Abstract
Sarco/endoplasmic reticulum Ca2+‐ATPase (SERCA) 2b is a ubiquitous SERCA family member that conducts Ca2+ uptake from the cytosol to the ER. Herein, we present a 3.3 Å resolution cryo‐electron microscopy (cryo‐EM) structure of human SERCA2b in the E1·2Ca2+ state, revealing a new conformation for Ca2+‐bound SERCA2b with a much closer arrangement of cytosolic domains than in the previously reported crystal structure of Ca2+‐bound SERCA1a. Multiple conformations generated by 3D classification of cryo‐EM maps reflect the intrinsically dynamic nature of the cytosolic domains in this state. Notably, ATP binding residues of SERCA2b in the E1·2Ca2+ state are located at similar positions to those in the E1·2Ca2+‐ATP state; hence, the cryo‐EM structure likely represents a preformed state immediately prior to ATP binding. Consistently, a SERCA2b mutant with an interdomain disulfide bridge that locks the closed cytosolic domain arrangement displayed significant autophosphorylation activity in the presence of Ca2+. We propose a novel mechanism of ATP binding to SERCA2b.
Keywords: ATP binding, cryo‐EM structure, SERCA2b, single‐particle analysis
Subject Categories: Membranes & Trafficking, Structural Biology
Structural analysis shows human SERCA2b ATPase to adopt an unexpectedly compact functional state prior to ATP binding, suggesting a new mechanism of ATP binding to SERCA family members.

Introduction
Sarco/endoplasmic reticulum Ca2+ ATPase (SERCA) proteins are members of the P‐type ATPase superfamily that are involved in transporting various cations including protons, calcium, potassium, and sodium ions across cell membranes (Bublitz et al, 2010), and other physiological processes such as lipid flipping (Axelsen & Palmgren, 1998). In terms of structures and mechanisms of action, SERCAs are the best studied members of the superfamily (Møller et al, 2005; Michelangeli & East, 2011). About 20 years ago, the first crystal structure of SERCA1a, an isoform expressed specifically in fast‐twitch skeletal‐muscle fibers (Zhang et al, 1995), was reported in the E1·2Ca2+ state (Toyoshima et al, 2000). Crystal structures of SERCA1a in different intermediate states have since been determined, providing deep insights into the underlying mechanism of Ca2+ transport by the Ca2+ ATPase (Fig 1A), as well as the general structural and mechanistic features of the P‐type ATPase superfamily (Toyoshima, 2009; Bublitz et al, 2013; Dyla et al, 2019b).
Figure 1. Cryo‐EM structure of SERCA2b WT in the E1∙2Ca2+ state.
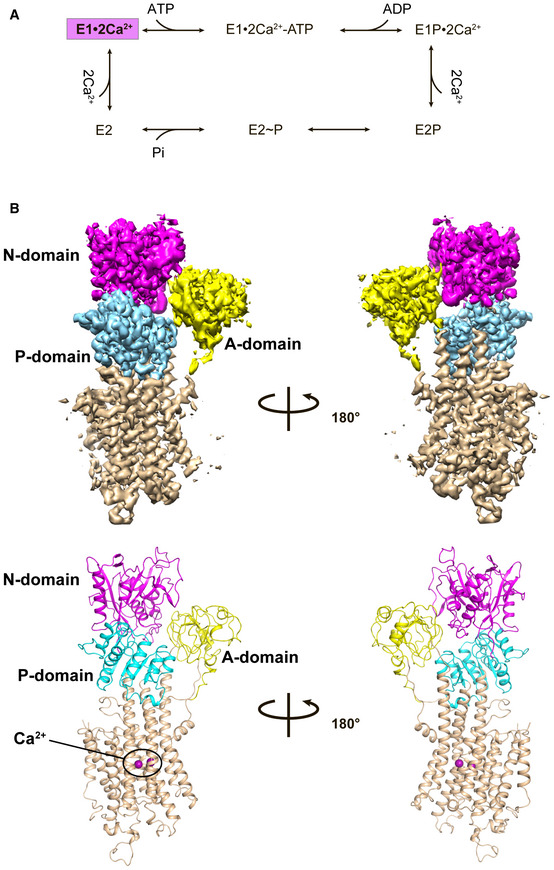
- Catalytic cycle for SERCA to transport Ca2+ from the cytosol to the ER lumen through ATP hydrolysis. The intermediate state of which cryo‐EM structures have been determined in this work is colored magenta.
- Cryo‐EM map of SERCA2b WT in the E1∙2Ca2+ state (upper) and its cartoon representation (lower). The A, N, and P domains and transmembrane helices (TM1−TM11) are colored yellow, magenta, cyan, and wheat, respectively.
Despite remarkable progress in structural and mechanistic studies on SERCA isoforms, their catalytic mechanisms remain contentious. While it is believed that the Ca2+ transport cycle of SERCA is initiated by the coordinated binding of two Ca2+ ions and one ATP molecule to the transmembrane (TM) and nucleotide‐binding (N) domains, respectively (Mueller et al, 2004; Inesi et al, 2006; Toyoshima, 2009; Møller et al, 2010), one of the most discussed issues is the functional significance of the widely opened cytosolic domain arrangement observed in the crystal structure of SERCA1a in the E1·2Ca2+ state (Liu & Barth, 2003; Dyla et al, 2019b). Thus, it is still under debate as to whether such a gate opening accompanied by large domain movements actually takes place when the ATP molecule enters the ATP‐binding pocket (Ravishankar et al, 2020). Based on the highly mobile nature of the actuator (A) and N domains in this state, and the possible bias caused by crystal packing, the crystal structure may represent only one structural aspect of the calcium‐bound but ATP‐unbound state. In this context, scientists have been seeking genuine and as‐yet‐unidentified SERCA intermediates, and visualizing their structures by employing various spectroscopic and computational methods, including fluorescence resonance energy transfer (FRET) (Dyla et al, 2017; Raguimova et al, 2018), molecular dynamics (MD) simulation (Mueller et al, 2004; Huang et al, 2009; Kekenes‐Huskey et al, 2012; Das et al, 2014), and time‐resolved X‐ray solution scattering (TR‐XSS) (Ravishankar et al, 2020). Recent TR‐XSS analysis combined with MD simulations identified three transient states of SERCA1a during the transition to the ATP‐bound state, named the pre‐pulse (i.e., pre‐ATP‐bound), intermediate, and late states, with respect to the cytosolic domain arrangements (Ravishankar et al, 2020), although this approach did not provide high‐resolution structures due to its inherent technical limitations.
In the present work, we employed cryo‐EM single‐particle analysis and thereby determined a new intermediate structure of human SERCA2b in the E1·2Ca2+ state at a resolution of 3.3 Å. We revealed that a significant portion of SERCA2b in this state adopts a much more closed cytosolic domain arrangement than observed in previous crystal structures of SERCA1a (Toyoshima et al, 2000). Interestingly, the cryo‐EM structure is highly similar to our previously reported cryo‐EM structure of SERCA2b in the E1·2Ca2+‐AMPPCP state (Zhang et al, 2020), in terms of both the TM helix arrangement and the location and orientation of ATP‐binding residues. In this conformation, SERCA2b in the E1·2Ca2+ state possesses a compact headpiece cluster of the cytosolic domains, forming a cavity that appears primed for ATP binding. In line with these structural findings, a SERCA2b mutant with an interdomain disulfide bridge that locks the relative positions of the A and N domains in the closed form displayed significant autophosphorylation activity, suggesting that the newly identified structure represents a preformed state immediately prior to ATP binding. Based on these results, we propose a new mechanism of ATP binding to Ca2+‐bound SERCA2b and discuss the ligand‐induced conformational transitions in SERCA during its catalytic cycle.
Results
SERCA2b displays multiple conformations in the E1·2Ca2+ state
We expressed and purified SERCA2b essentially as described previously (Inoue et al, 2019; Zhang et al, 2020). The cryo‐EM structure of SERCA2b in the E1·2Ca2+ state was determined at a resolution of 3.3 Å (Fig 1 and Table EV1). In the first round of 3D classification based on selected 2D classification images, cryo‐EM maps of Ca2+‐bound SERCA2b were classified into four different classes (Fig EV1A). The additional round of 3D classification generated two major classes of conformations named “closed form” and “possible open form” in significant abundance (˜20.7 and 37.7%, respectively; Fig EV1A). The “possible‐open‐form” cryo‐EM maps roughly superpose with the crystal structure of SERCA1a in the E1·2Ca2+ state (PDB ID: 1SU4 and 2C9M) (Toyoshima et al, 2000; Jensen et al, 2006) (Fig EV1C), suggesting that SERCA2b actually adopts the previously reported “open form” in the presence of Ca2+. However, the resolution of the “possible‐open‐form” cryo‐EM map was low (˜12 Å resolution), and not improved by additional 3D classifications, probably due to the highly mobile cytosolic domains or the ensemble of their heterogeneous arrangements in this state. Alternatively, it is possible that such low‐resolution cryo‐EM maps may be ascribed to particle damage during grid preparation and/or data collection, resulting in inaccurate averaged particle densities.
Figure EV1. Workflow of data processing for cryo‐EM single‐particle analysis and local resolution analysis of SERCA2b in the E1∙2Ca2+ state.
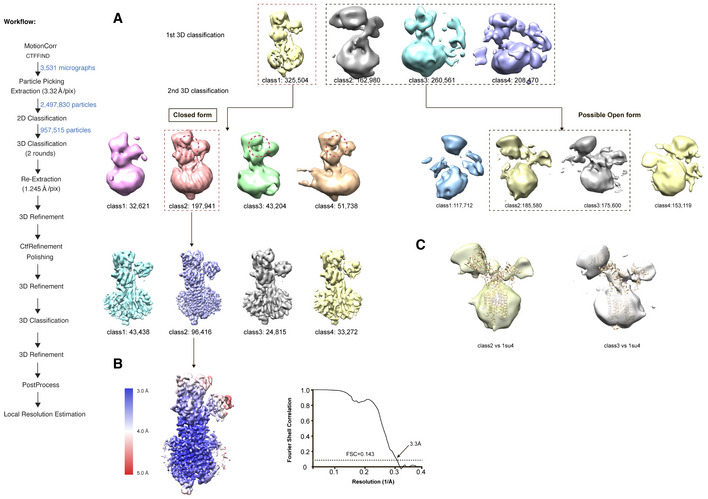
- Multiple classes of density map were generated after the first round of 3D classification, which were divided into two classes during the second round of 3D classification. A workflow of data processing for the cryo‐EM single‐particle analysis is shown on the left.
- Local resolution estimation of the “closed‐form” cryo‐EM map of SERCA2b in the E1∙2Ca2+ state. The panel on the right shows the FSC curve for post‐processing of SERCA2b WT in the E1∙2Ca2+ state.
- Superposition of the crystal structure of SERCA1a in the E1∙2Ca2+ state (PDB ID: 1SU4) onto the present “possible‐open‐form” class 2 and class 3 cryo‐EM maps.
Importantly, the closed form identified by the present cryo‐EM analysis places three cytosolic domains in much closer proximity than the open form (Figs 1B and 2). The presence of four similar cryo‐EM maps (Fig EV1A) suggests that the closed form is less diverse in cytosolic domain arrangement or fluctuates to a lesser extent than the open form. In this context, a pre‐ATP‐bound form had been identified by unrestrained MD simulations from the “open‐form” crystal structure of SERCA1a (Ravishankar et al, 2020), during which the A and N domains were calculated to approach each other, with the distance of 45 Å between Thr171 (A domain) and Lys515 (N domain) decreasing to 29 Å. Eventually, these domains were settled at the intermediate positions between those in the present “closed‐form” cryo‐EM structure of SERCA2b and those in the “open‐form” crystal structure of SERCA1a.
Figure 2. Comparison between a “closed‐form” cryo‐EM structure of SERCA2b and an “open‐form” crystal structure of SERCA1a in the E1∙2Ca2+ state.
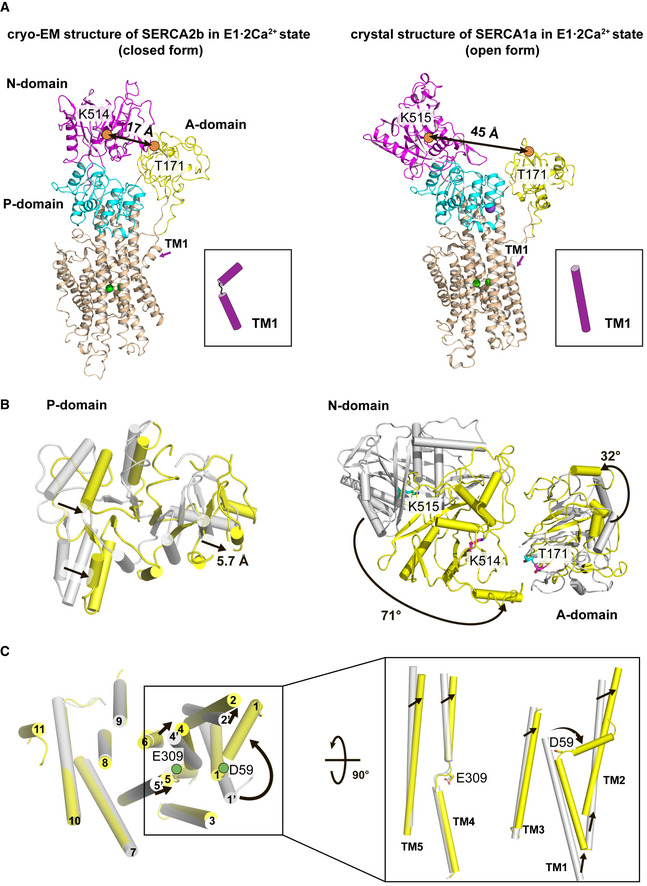
- Cryo‐EM structure of SERCA2b WT in the E1∙2Ca2+ state (left) and the crystal structure of SERCA1a (PDB ID: 1SU4) in the E1∙2Ca2+ state (right). The A, N, and P domains are colored yellow, magenta, and cyan, respectively. TM helices are colored wheat. TM1 in these two structures is highlighted by cartoons on the right of ribbon diagrams. Calcium ions are represented as green spheres. Orange circles indicate Thr171 and Lys514 (Lys515 in SERCA1a), and the double‐headed arrows in black represent the distance between these two residues.
- Top view of the P domain (left), the N and A domains (right) in the cryo‐EM structure of SERCA2b (yellow), and the crystal structure of SERCA1a in the E1∙2Ca2+ state (gray). The rearrangements of these cytosolic domains are indicated by black arrows.
- Top view of the TM helix domain (left) in the cryo‐EM structure of SERCA2b (yellow) and the crystal structure of SERCA1a (gray) in the E1∙2Ca2+ state. The right inset highlights the rearrangements of TM1−TM5 between these two structures. Structures are superimposed such that the RMSD of Cα atoms in TM7 to TM10 is minimized. The green circles represent Asp59 and Glu309 located at the kink sites of TM1 and TM4, respectively.
Overall cryo‐EM structure of the closed form in the E1·2Ca2+ state
In the present “closed‐form” cryo‐EM map of SERCA2b in the E1·2Ca2+ state, all cytosolic domains and TM helices, including TM11 and the luminal extension tail (LE), can be clearly seen (Figs 1B, EV2A and EV5). Similar to E1·2Ca2+‐AMPPCP and E2‐BeF3 − states (Zhang et al, 2020), the LE in the E1·2Ca2+ state is located near the luminal ends of TM10 and TM7, and approaches the short α‐helix (Phe866−Ser870) in L7/8 (Fig EV2A, bottom inset). The P domain displayed stronger density and higher resolution than the A and N domains (Fig EV1B), suggesting that it is relatively static in this state. By contrast, the A domain and the upper part of the N domain were not well‐defined and yielded fragmented density, resulting in a lower resolution (˜4.5 Å) than other domains (Fig EV1B). The density of two Ca2+ ions bound in the pocket formed by TM4, 5, 6, and 8 is present at almost the same position as in the crystal structure of SERCA1a in the E1·2Ca2+ state (Fig EV2B and D) and the cryo‐EM structure of SERCA2b in the E1·2Ca2+‐AMPPCP state (Fig EV2C) (Zhang et al, 2020).
Figure EV2. Close‐up views of the C‐terminal part, Ca2+‐binding sites, and ATP‐binding pocket of SERCA2b.
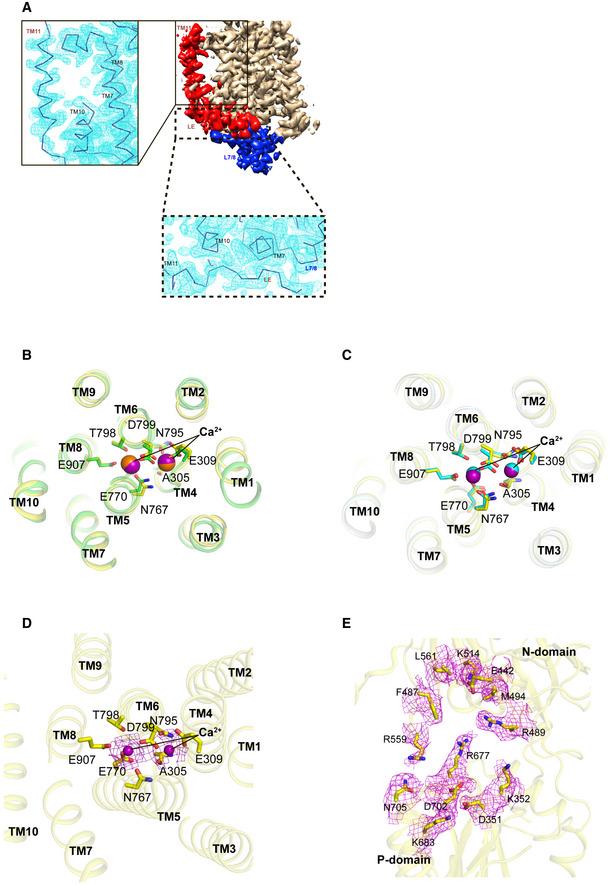
- TM11 and the LE of SERCA2b are highlighted in red, while TM1‐TM10 are colored wheat. L7/8 is colored blue. The backbone model of TM11 in SERCA2b in the E1∙2Ca2+ state was placed based on the cryo‐EM map (left inset). Density is shown at a contour level of 3.5 RMSD. The backbone model of the LE in SERCA2b in the E1∙2Ca2+ state was placed based on the cryo‐EM map (bottom inset). Density is shown at a contour level of 2.7 RMSD.
- Close‐up view of the Ca2+‐binding sites of SERCA2b (yellow) and SERCA1a (green) in the E1∙2Ca2+ state, in which bound Ca2+ ions are depicted as spheres. Ca2+ binding residues are shown as sticks. Note that the mode of Ca2+ binding is almost identical between these two states.
- Close‐up view of the Ca2+‐binding sites of SERCA2b in E1∙2Ca2+ (yellow) and E1∙2Ca2+‐AMPPCP (cyan) states, in which bound Ca2+ ions are depicted as spheres. Ca2+ binding residues are shown as sticks. Note that the mode of Ca2+ binding is almost identical between these two states.
- Close‐up view of the Ca2+‐binding sites in the E1∙2Ca2+ state, in which bound Ca2+ ions and their density are represented by purple spheres and violet meshes, respectively. Neighboring residues are shown as sticks. Density is shown at a contour level of 5.0 α.
- Density maps of the residues that constitute the ATP‐binding pocket of SERCA2b in the E1∙2Ca2+ state, shown at a contour level of 5.0 α. The residues are shown as sticks.
Figure EV5. Representative densities and Cross‐validation FSC curves for map‐to‐model.
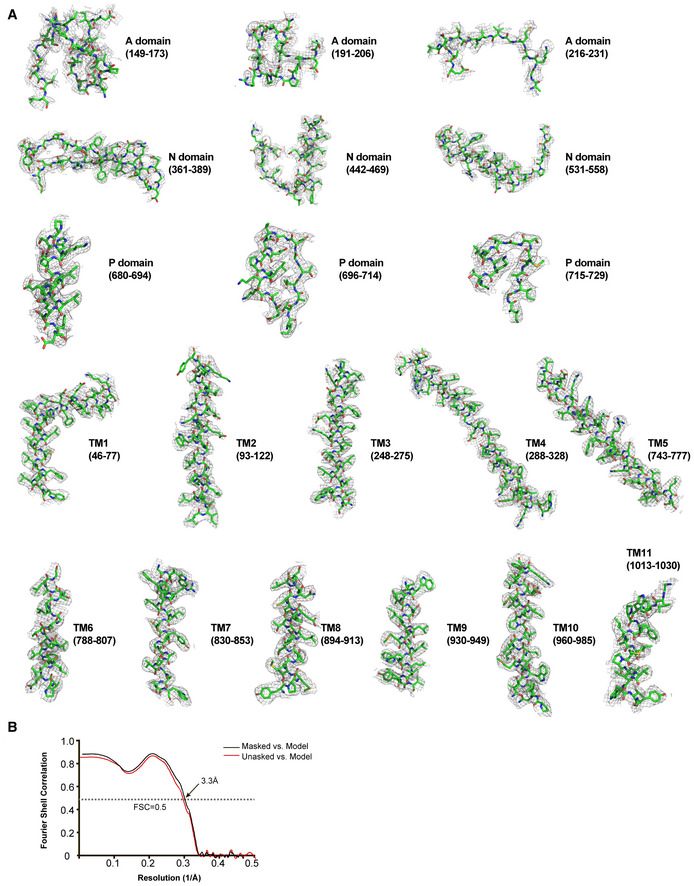
- Representative densities of the A, N, and P cytosolic domains and TM helices in the present cryo‐EM map of SERCA2b in the E1∙2Ca2+ state. Segments are indicated by the residue number in parentheses. All densities are shown at a contour level of 5.0 σ.
- Cross‐validation FSC curves for map‐to‐model fitting of SERCA2b WT in the E1∙2Ca2+ state.
Structural comparison between the closed and open forms in the E1·2Ca2+ state
The overall domain arrangement in the “closed‐form” cryo‐EM structure of SERCA2b differs significantly from that in the “open‐form” crystal structure of SERCA1a (Toyoshima et al, 2000), with a root mean square deviation (RMSD) value of 5.9 Å for all Cα atoms (Fig 2A). Meanwhile, the TM helices undergo small positional shifts between the open and closed forms, with an RMSD value of 0.83 Å for TM1−TM10. Thus, the positions and orientations of TM helices seem to be stabilized by bound Ca2+. However, among all TM helices, TM1 and TM2 undergo a remarkable movement (Fig 2A and C). TM2 moves upward and shifts away from TM3 (Fig 2C). Similarly, TM1 moves toward the cytosolic side. Notably, the cytosolic part of TM1 is kinked largely at Asp59 in the closed form, so that it becomes nearly parallel to the membrane surface (Fig 2A and C). The kink of TM1 is believed to function as a “sliding door” allowing Ca2+ entry and thereby facilitating Ca2+ binding in SERCA proteins (Winther et al, 2013). Such a kink in the N‐terminal TM helix is commonly seen in P‐type ATPases of known structure (Dyla et al, 2017; Focht et al, 2017), including P4‐type ATPase (Hiraizumi et al, 2019; Timcenko et al, 2019), and Na+/K+‐ATPase (Morth et al, 2007; Nyblom et al, 2013). Concomitant with the movements of TM1 and TM2, the A domain undergoes a significant positional shift (8.8 Å) and rotation (32°) (Fig 2B, right).
Compared with TM1 and TM2, TM4 and TM5 seem to undergo smaller positional shifts between the open and closed forms (Fig 2C). However, their cytosolic halves, which are located distant from the Ca2+‐binding sites and directly linked to the P domain, are bent toward TM2 by 20.7° and 6.9°, respectively, in the closed form (Fig 2C, inset). Concomitantly, the P domain rotates by 12° and approaches the A domain by 5.7 Å relative to that in the open form (Fig 2B, left). As a result, the side chain of Asn213 in the A domain is hydrogen bonded to the side chain of Thr723 in the P domain (Fig 4A, left inset), stabilizing the closed form in the E1·2Ca2+ state.
Figure 4. Interface between the A and N domains in E1∙2Ca2+ and E1∙2Ca2+‐AMPPCP states.
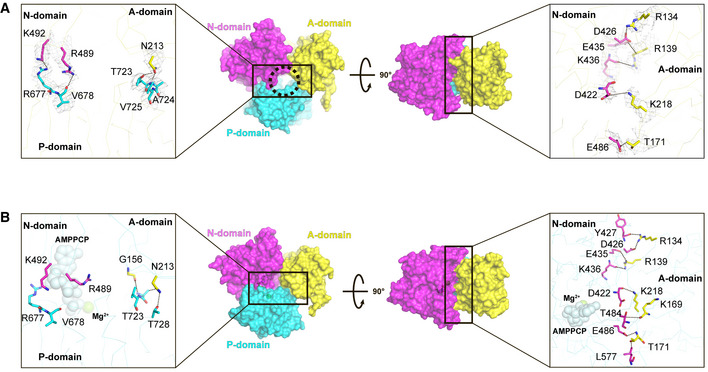
- Side (left) and top (right) views of the A, N, and P domains in the cryo‐EM structure of SERCA2b in the E1∙2Ca2+ state represented as a surface model. Residues critical for the domain interactions in the E1∙2Ca2+ state are represented by sticks in the left and right insets. Gray mesh in the inset indicates the density of the resides shown at a contour level of 5.0 σ. The circle in the left panel indicates a cavity that may serve as an ATP entry gate in the “closed‐form” SERCA2b.
- Side (left) and top (right) views of the A, N, and P domains in the cryo‐EM structure of SERCA2b in the E1∙2Ca2+‐AMPPCP state shown in surface model representation. Residues critical for the domain interactions in the E1∙2Ca2+‐AMPPCP state are represented by sticks in the left and right insets. Dotted lines in the right inset indicate hydrogen bonds and salt bridges formed between the residues at the domain interface.
Of note, the position of the N domain in the closed form is largely different from that in the “open‐form” crystal structure of SERCA1a (Figs 2A and B, right); the distance between Cα atoms of Lys515 (N domain) and Thr171 (A domain) is 17 Å in the former, but 45 Å in the latter. In the closed form, the close proximity of the N domain to the A domain seems to be ensured by five side‐chain interactions between these two domains: Arg134 (A domain)−Asp426 (N domain), Arg139 (A domain)−Glu435 (N domain), Arg139 (A domain)−Lys436 (N domain), Thr171 (A domain)−Glu486 (N domain), and Lys218 (A domain)−Asp422 (N domain) (Fig 4A, right inset). Thus, although the N domain was previously shown to undergo a large movement upon ATP binding to hold the nucleotide tightly (Toyoshima & Mizutani, 2004), the present cryo‐EM analysis suggests that such an extensive domain movement can occur within the E1·2Ca2+ state even without ATP binding, hence the closed form accounts for a significant proportion of the population in this state.
Structural comparison between the closed form of the E1·2Ca2+ state and the E1·2Ca2+‐AMPPCP state
We next compared the “closed‐form” cryo‐EM structure of SERCA2b in the E1·2Ca2+ state with that of SERCA2b in the E1·2Ca2+‐AMPPCP state, in which the cytosolic domains are in even closer contact with each other due to bound AMPPCP (Fig 3) (Zhang et al, 2020). Although both structures possess a closed headpiece cluster of the cytosolic domains, they show significant differences, especially in the position of the cytosolic domains, with an RMSD value of 3.6 Å for all Cα atoms (Fig 3B). By contrast, structural alignment based on TM7−TM10 demonstrated that all TM helices including the Ca2+‐binding sites are highly superimposable with each other between E1·2Ca2+ and E1·2Ca2+‐AMPPCP states, with an RMSD value of 0.197 Å (Fig 3B, bottom inset). Thus, TM helices barely move during the transition from the “closed‐form” SERCA2b in the E1·2Ca2+ state to the E1·2Ca2+‐ATP state.
Figure 3. Conformational transition from the closed form of the E1∙2Ca2+ state to the E1∙2Ca2+‐ATP state.
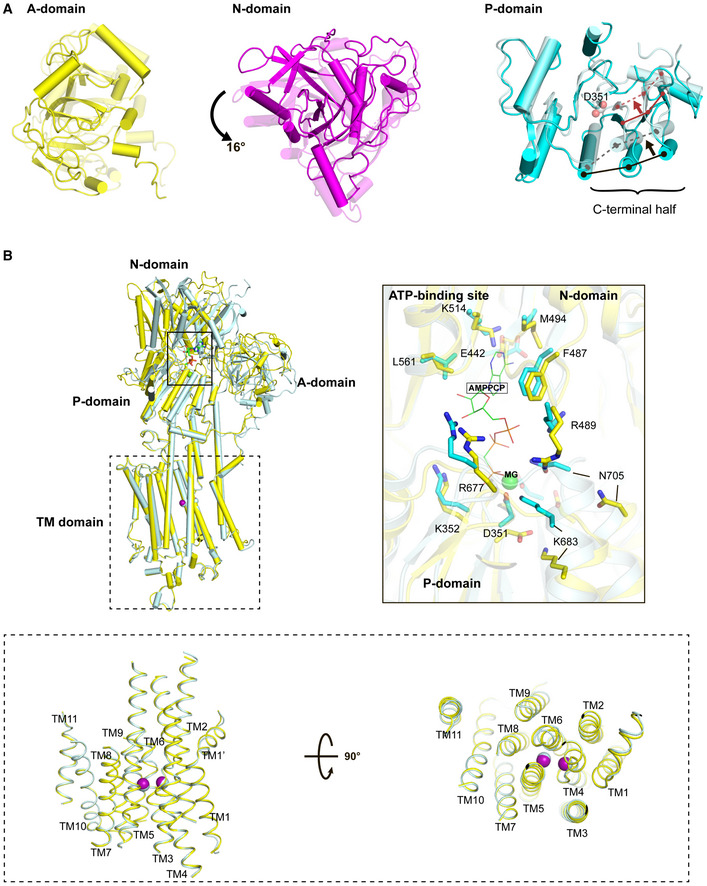
- Top view of the superposition of the A, N, and P domains between E1∙2Ca2+ and E1 ∙2Ca2+‐ATP states, in which all domains and TM helices are shown with transparency 0 (i.e., dense) for the E1∙2Ca2+ state and 0.5 (i.e., faint) for the E1∙2Ca2+‐ATP state. Cryo‐EM structures of SERCA2b in E1∙2Ca2+ and E1∙2Ca2+‐ATP states are superimposed with each other such that the RMSD of all Cα atoms are minimized. The black and red arrows indicate ATP‐induced movements of three β‐strands and three α‐helices contained in the C‐terminal half of the P domain, respectively. The solid and dashed lines indicate the positions of these secondary structure elements before and after ATP binding, respectively. D351 indicated by spheres is a phosphorylation site.
- Superimposition of cryo‐EM structures of SERCA2b in E1∙2Ca2+ (yellow) and E1∙2Ca2+‐ATP (cyan) states, in which TM7−TM10 are aligned with each other. The right inset shows a close‐up view of the ATP‐binding sites of SERCA2b in E1∙2Ca2+ (yellow) and E1∙2Ca2+‐AMPPCP (cyan) states, in which the two structures are superimposed such that the RMSD of their Cα atoms in the N domain is minimized. A Mg2+ ion close to AMPPCP is depicted as a green sphere. The lower inset highlights the side (left) and top (right) views of TM1−TM11 in E1∙2Ca2+ (yellow) and E1∙2Ca2+‐AMPPCP (cyan) states. The purple and cyan spheres indicate two bound Ca2+ ions in the E1∙2Ca2+ and E1∙2Ca2+‐ATP states, respectively.
Among the three cytosolic domains, the N domain moves most prominently during the transition from E1·2Ca2+ to E1·2Ca2+‐ATP states, with rotation of 16° (Fig 3A, middle). Consequently, the N domain approaches the P domain, leading to tight ATP binding. Concomitant with the N domain movement, the P domain undergoes ATP‐induced conformational changes; the C‐terminal half of the P domain, including three β‐strands and three α‐helices, inclines toward the phosphorylation site (Asp351) upon ATP binding (Fig. 3A, right), forming an even more compact globular fold, as was also seen in crystal structure of SERCA2a in the E2‐AMPPCP state (Kabashima et al, 2020). Thus, the P domain folds loosely in the closed form of the E1·2Ca2+ state, which may serve to facilitate the delivery of the γ‐phosphate group of ATP into the appropriate site in the P domain. The A domain also undergoes positional shifts upon ATP binding, with rotation of 14° (Fig 3A, left), leading to tighter interactions with the N and P domains, as described in the following paragraph.
In brief, the cytosolic headpiece cluster of SERCA2b becomes even more compact upon ATP binding. In support of this, multiple salt bridges and hydrogen bonds are formed at the cytosolic domain interfaces in the E1·2Ca2+‐ATP state, including those between the A and N domains: Arg134 (A domain)−Asp426 (N domain), Arg134 (A domain)−Tyr427 (N domain), Arg139 (A domain)−Lys436 (N domain), Thr171 (A domain)−Glu486 (N domain), Lys218 (A domain)−Asp422 (N domain), Thr171 (A domain)−Leu577 (N domain), Arg139 (A domain)−Glu435 (N domain), and Lys169 (A domain)−Thr484 (N domain) (Fig 4B, right inset), and those between the A and P domains: Gly156 (A domain)−Thr723 (P domain), Asn213 (A domain)−Thr728 (P domain), and Asn213 (A domain)−Thr723 (P domain) (Fig 4B, left inset).
Notably, many of the above interactions are already formed prior to ATP binding, between the A and N domains and between the A and P domains (Fig 4A, left and right insets). Additionally, hydrogen bonds are newly identified between the side chain of Arg489 (N domain) and the main‐chain carbonyl group of Val678 (P domain) and between the side chains of Lys492 (N domain) and Arg677 (P domain) in the E1·2Ca2+ state (Fig 4A, left inset). As a consequence of these interdomain interactions, the ATP binding residues, namely, Asp351, Met494, Glu442, Phe482, Arg489, Lys514, Arg559, Lys683, Arg677, Asp702, and Asn705, in the E1·2Ca2+ state are located at similar positions to those in the E1·2Ca2+‐ATP state, and the cavity constituted by these residues appears to shrink upon ATP binding (Fig 3B, right inset, and Fig EV2E). In this regard, the “closed‐form” E1·2Ca2+ state newly identified in this study can be interpreted as a preformed state of SERCA immediately prior to ATP binding.
ATP enters and phosphorylates the closed form of SERCA2b
To examine whether the “closed‐form” SERCA2b in the E1·2Ca2+ state does allow ATP to enter the cavity, we carried out biochemical experiments. With the purpose of locking the relative positions of the A and N domains in the closed form (Lopez‐Redondo et al, 2018), we focused upon the interface between the A and N domains and found several amino acid pairs that have potential to form an interdomain disulfide bridge. We thus prepared six kinds of SERCA2b mutants by site‐directed mutagenesis: Q138C/D426C, V137C/D426C, A154C/G438C, V155C/G438C, T171C/E486C, and T171C/L577C (Fig EV3A). Among them, T171C/L577C showed a slight but significant upward band shift relative to WT after oxidative treatment with potassium ferricyanide (K3Fe(CN)6) (Fig EV3B). Consistently, a Cβ‐Cβ distance between T171 and L577 is 4.1 Å in the cryo‐EM structure of SERCA2b in the E1·2Ca2+ state (Fig 5A). Additionally, it is predicted that two sulfur atoms of the introduced cysteines are located apart by a distance of 2.0 Å, and that a torsion angle of the Cβ–S–S–Cβ is +110° (Fig 5A, inset). These conditions are likely to meet the criteria for forming a disulfide bond between these two sites (Dombkowski et al, 2014).
Figure EV3. Cytosolic domain interface in the “closed‐form” of SERCA2b and critical residues for the cytosolic domain interactions in the E1∙2Ca2+ state.
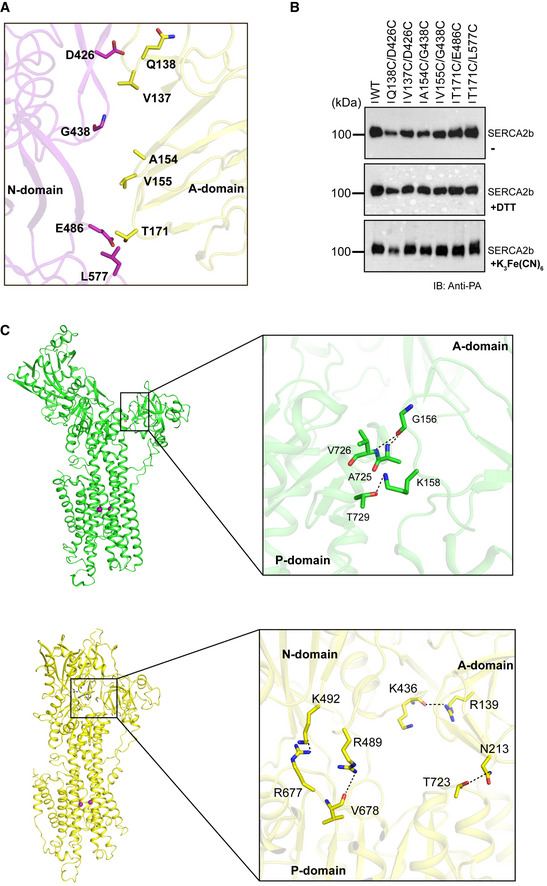
- Closed‐up view of the interface between the A and N domains in the “closed‐form” cryo‐EM structure of SERCA2b. The amino acid pairs in which Cα atoms are located within a distance of 8.5 Å are represented by sticks, and their cysteine mutants were prepared in this study.
- Six kinds of SERCA2b mutants including Q138C/D426C, V137C/D426C, A154C/G438C, V155C/G438C, T171C/E486C, or T171C/L577C were treated with no reagent (upper), DTT (middle) or K3Fe(CN)6 (lower). Among them, T171C/L577C showed a significant upward band shift relative to WT after oxidative treatment with K3Fe(CN)6.
- Close‐up views of the interface between the A and P domains in the “open‐form” crystal structure of SERCA1a in the E1∙2Ca2+ state (upper) (PDB ID: 1SU4), and the interfaces between the cytosolic A, P, and N domains in the “closed‐form” cryo‐EM structure of SERCA2b in the E1∙2Ca2+ state (lower). Critical residues for the cytosolic domain interactions are represented by sticks. Dotted lines indicate hydrogen bonds or salt bridges formed between those residues. Magenta spheres represent two bound Ca2+ ions.
Figure 5. Functional characterization of the “closed‐form” SERCA2b.
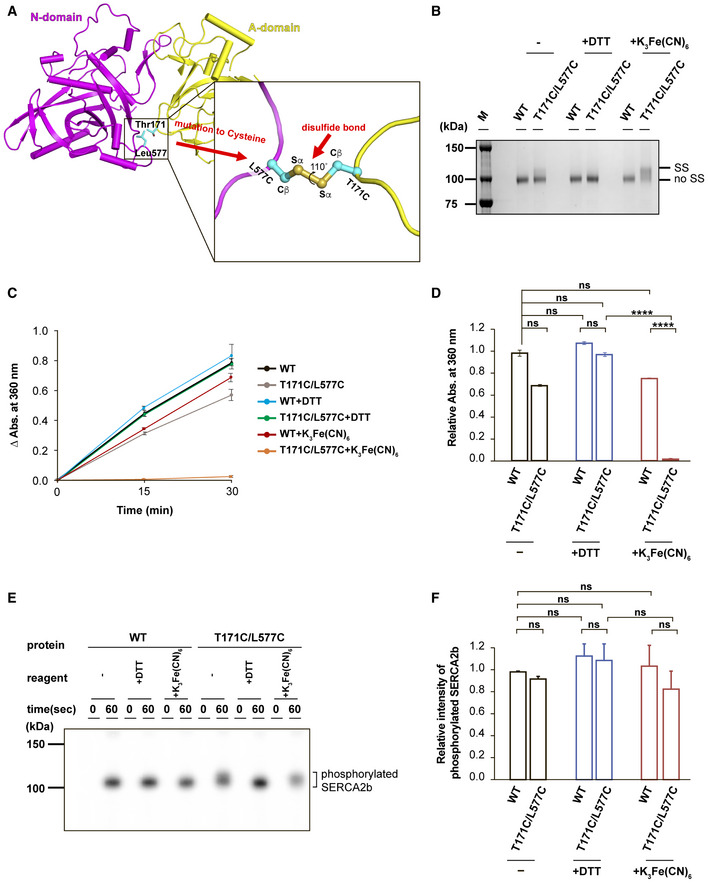
- Close‐up view of the interface between the A and N domains. The engineered site in the T171C/L577C mutant is highlighted in the inset.
- SDS–PAGE analysis of purified SERCA2b WT and T171C/L577C (0.5 µg each) after treatment with no reagent (−), 10 mM DTT, or 5 mM K3Fe(CN)6 at pH 7.0. Protein bands were visualized by staining with Coomassie Brilliant Blue. Note that T171C/L577C displayed a slower electrophoretic mobility than WT but displayed similar migration in the presence of DTT. “SS” and “no SS” indicate disulfide‐bonded and non‐disulfide‐bonded SERCA2b species, respectively.
- ATPase activity of SERCA2b WT and T171C/L577C without reagents (−), or in the presence of DTT or K3Fe(CN)6. Results are means ± SD of three independent experiments.
- Bar graphs showing the relative ATPase activity of SERCA2b WT and T171C/L577C under the indicated conditions. Results are means ± standard deviation (SD) of three independent experiments. Relative absorbance at 360 nm is normalized with the absorbance of WT without reagents (−), and statistical significance is calculated by one‐way ANOVA followed by Tukey's test. (ns, not significant; ****P < 0.0001).
- Autophosphorylation assays of SERCA2b WT and T171C/L577C without reagents (−), or in the presence of 10 mM DTT (+DTT) or 5 mM K3Fe(CN)6 (+K3Fe(CN)6). Protein bands were visualized by detecting 32Pi with a Phosphorimager.
- Bar graphs showing the relative band intensity of 32Pi‐conjugated SERCA2b WT and T171C/L577C under the indicated conditions. Results are means ± SD of three independent experiments. Relative band intensity is normalized with the intensity of phosphorylated SERCA2b WT without reagents (−), and statistical significance is calculated by one‐way ANOVA followed by Tukey's test (ns, not significant).
Expectedly, purified T171C/L577C showed a significant upward band shift upon oxidation with K3Fe(CN)6, as compared to WT (Fig 5B). After treatment with dithiothreitol (DTT), T171C/L577C migrated at the same rate as WT (Fig 5B), suggesting the formation of a disulfide bond between the introduced cysteine residues in the A and N domains. Such an upward band shift caused by an interdomain disulfide bridge was previously observed for ERdj5, a protein disulfide isomerase (PDI) family member with an N‐terminal J domain and six subsequent thioredoxin (Trx)‐like domains (Maegawa et al, 2017).
Previous studies demonstrated that ATP can appropriately bind SERCA in the absence of Ca2+ to form E2‐ATP state (Jensen et al, 2006; Kabashima et al, 2020). In this context, while the Cβ‐Cβ distance between T171 and L577 is 9.9 Å in the crystal structure of SERCA1a in the E2 state (Toyoshima et al, 2013), it is reduced to 4.3 Å in the crystal structure of SERCA2a in the E2‐AMPPCP state (Kabashima et al, 2020) (Fig EV4A). Using the same biochemical assay as above, we thus investigated if the closed headpiece cluster of the cytosolic domains can be formed without Ca2+. T171C/L577C was treated with 10 mM EGTA to generate the Ca2+‐free E2 state. Upon treatment with K3Fe(CN)6, the upper band (i.e., disulfide‐bonded species) was slightly increased in intensity, but to a much lesser extent than in the presence of Ca2+ (i.e., without EGTA treatment) (Fig EV4B), suggesting that the A and N domains are located more separately from each other or fluctuate more largely in the Ca2+‐free E2 state. This observation seems consistent with the previous MD simulation starting from the “open‐form” crystal structure of SERCA1a in the E1·2Ca2+ state, as this computational work demonstrated that the average simulated distance between the A and N domains in the final state is larger by 4.0 Å in the E2 state than in the E1 state, while the open‐to‐closed transition occurs more rapidly in the absence of Ca2+ (Espinoza‐Fonseca & Thomas, 2011). We also added 1.5 mM AMPPCP (comparable to the physiological concentration of ATP) to T171C/L577C in order to examine the effect of ATP binding on the cytosolic domain arrangement. Unexpectedly, the disulfide‐bonded species was not significantly increased by addition of AMPPCP in either the presence or absence of Ca2+ (Fig EV4B). Collectively, the results suggest that Ca2+ binding has greater effect on tight interaction between the A and N domains in SERCA than ATP binding. In agreement with this, the MD simulation showed that Ca2+ binding reshapes the free energy landscape of SERCA to create a path between the open and closed conformations (Espinoza‐Fonseca & Thomas, 2011).
Figure EV4. Effects of Ca2+ and ATP on formation of the closed headpiece cluster of the cytosolic domains, and autophosphorylation assay with BSA.
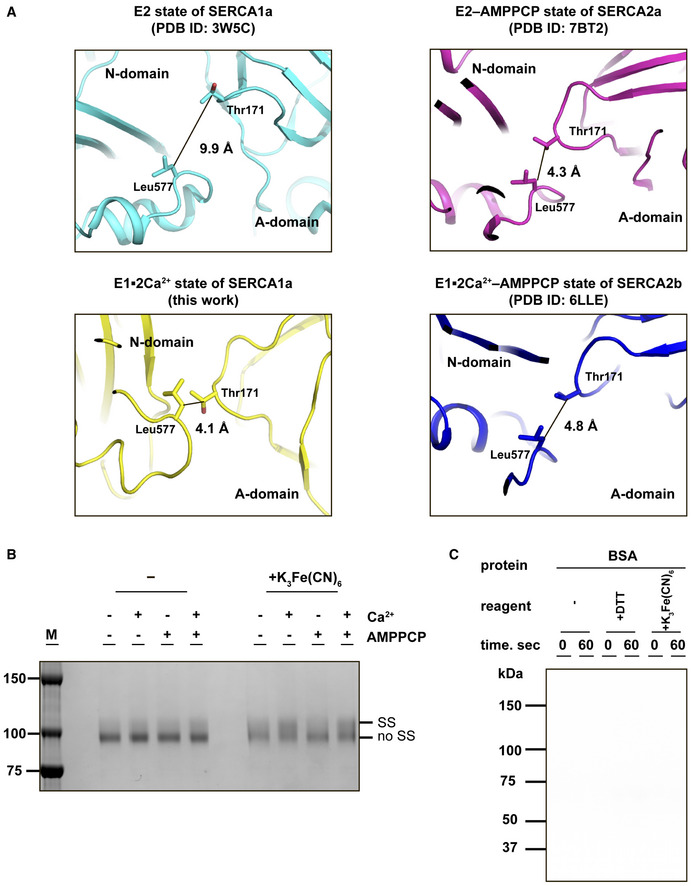
- Closed‐up view of the interface between the A and N domains in SERCA. The Cβ‐Cβ distance between Thr171 (A domain) and Leu577 (N domain) in the E2 state of SERCA1a (left upper), the E2‐AMPPCP state of SERCA2a (right upper), the E1∙2Ca2+ state of SERCA2b (left lower), or E1∙2Ca2+‐AMPPCP state of SERCA2b (right lower) is shown in each panel.
- SDS–PAGE analysis of purified SERCA2b T171C/L577C (0.5 µg) in the presence or absence of 1 mM Ca2+ and 1.5 mM AMPPCP. Protein bands were visualized by staining with Coomassie Brilliant Blue. “SS” and “no SS” indicate disulfide‐bonded and non‐disulfide‐bonded SERCA2b species, respectively. Note that after oxidative treatment with 5 mM K3Fe(CN)6 for 1hr at pH6.8, the “SS” spices significantly increased in the presence of Ca2+, whereas AMPPCP gave marginal effect on the “SS” spices formation regardless of the presence or absence of Ca2+.
- BSA (40 µg) was used as a negative control in the autophosphorylation assay, and no phosphorylation was observed with this protein. Experimental conditions were the same as those conducted with SERCA2b WT and T171C/L577C.
To explore the functional effect of the interdomain disulfide bond, we measured the ATPase activity of purified SERCA2b WT and T171C/L577C. The activity of T171C/L577C was almost abolished after treatment with K3Fe(CN)6, presumably because the interdomain disulfide bridge considerably constrained the cytosolic domain movements during the catalytic cycle (Fig 5C and D). In agreement with this, T171C/L577C largely restored the ATPase activity in the presence of DTT, up to the level comparable to WT. Unlike T171C/L577C, there was no substantial change in ATPase activity for WT following DTT or K3Fe(CN)6 treatment (Fig 5C and D). The different redox‐reagent sensitivities of WT and T171C/L577C also support the formation of a disulfide bond between the A and N domains in T171C/L577C.
Using this mutant, we next performed an autophosphorylation assay with [γ‐32P] ATP to investigate whether the “closed‐form” Ca2+‐bound SERCA2b could bind ATP at the appropriate site (Clausen et al, 2013; Chen et al, 2019). We first employed bovine serum albumin (BSA) as a negative control and confirmed no phosphorylation with this control (Fig EV4C). By contrast, SERCA2b WT displayed significant phosphorylation regardless of treatment with DTT and K3Fe(CN)6 (Fig 5E and F), indicating that these chemicals did not cause gross functional and structural changes to SERCA2b. Notably, T171C/L577C displayed significant phosphorylation even after treatment with K3Fe(CN)6, and its phosphorylated species displayed slower migration than those phosphorylated by WT (Fig 5E and F). After DTT treatment, the phosphorylated T171C/L577C species displayed the same electrophoretic mobility as WT (Fig 5E). Thus, the disulfide‐bonded T171C/L577C mutant still retained autophosphorylation activity. Altogether, we conclude that an ATP molecule can enter the ATP‐binding cavity formed in “closed‐form” SERCA2b in the E1·2Ca2+ state, even without large cytosolic domain movements, and locate in a catalytically competent manner at the nucleotide‐binding site to allow ATP hydrolysis.
Discussion
In the present cryo‐EM single‐particle analysis, multiple classes of conformations with different cytosolic domain arrangements were generated for SERCA2b in the E1·2Ca2+ state. The multiple conformations could roughly be divided into “closed” and “possible open” forms (Fig EV1), consistent with the notion that the crystal structure of SERCA1a in the E1·2Ca2+ state represents only one structural aspect of the intermediate state (Liu & Barth, 2003). In line with this, open cytosolic domain conformations are not dominant among the population of P‐type ATPases (Dyla et al, 2019a), and several structures of the Ca2+‐free E1 intermediates of SERCA1a, including the crystal structure of SERCA1a in the E1·Mg2+ state that is free from Ca2+ and ATP but binds a Mg2+ ion in the TM domain (Toyoshima, Iwasawa et al, 2013), have a more compact cytosolic domain arrangement than the “open‐form” crystal structure of Ca2+‐bound SERCA1a (Akin et al, 2013; Toyoshima et al, 2013; Winther et al, 2013).
In the “open‐form” crystal structure, several hydrogen bonds are formed between the A and P domains, contributing to stabilization of this domain arrangement (Fig EV3C, upper panel), while no interactions are made between the A and N domains (Fig EV3C, upper panel). The “closed‐form” SERCA2b displays a completely different interdomain interaction pattern from the open form: The A domain makes contact with both the N and P domains via hydrogen bonds between different amino acid pairs (Fig EV3C, lower panel). Thus, modes of interaction among the A, N, and P domains are switched during the transition between open and closed forms, likely allowing multiple cytosolic domain arrangements in the E1·2Ca2+ state. In this context, previous computational and biophysical works demonstrated that the open cytosolic domain conformation is not predominant in either Ca2+‐bound or unbound state, but significantly more stabilized in the presence of Ca2+ (Winters et al, 2008; Espinoza‐Fonseca & Thomas, 2011). The coexistence of the open and closed cytosolic domain arrangements in SERCA is reminiscent of different functional states of P‐type ATPase Arabidopsis thaliana isoform 2 (AHA2) revealed by the single‐molecule observation using total internal reflection fluorescence (TIRF) microscopy (Veshaguri et al, 2016). Proton pumping by AHA2 is stochastically interrupted by long‐lived inactive or leaky states, and the active and inactive states together define the bulk activity. In this analogy, the open conformation in the E1·2Ca2+ state of SERCA may serve as a regulatory state that can pause the proper ATP binding and the subsequent hydrolysis in the catalytic cycle.
In this connection, it was previously proposed that an ATP molecule binds the open form and subsequently induces the large movement of the N domain, causing it to contact the A and P domains to form a compact cytosolic headpiece cluster (Toyoshima & Mizutani, 2004). Notably, detailed inspection between the ATP binding residues in the “open form” and the “ATP‐bound form” provide mechanistic insight into ATP binding to SERCA (Fig 6A). Superimposition of the P or N domain between these two forms demonstrates that while the region responsible for contact with the adenosine moiety or the phosphate groups is individually preserved in the open form, simultaneous binding of these two parts of an ATP molecule seems impossible due to the far distant location of the P and N domains (Fig 6A). Therefore, even though the largely open cytosolic domain arrangement allows easy access of ATP to the well‐exposed ATP‐binding site, it will not ensure the tight or persistent ATP binding. By contrast, the “closed form” newly identified in this study places almost all ATP‐binding residues at similar positions to those in the “ATP‐bound form” (Fig 3B, right inset), suggesting that the ATP‐binding pocket is preliminarily formed prior to ATP binding. Moreover, the “closed form” of SERCA2b appears to form a cavity that may serve as an ATP entry gate (Fig 4A). In support of this, the T171C/L577C mutant that constitutively maintains the closed form could bind and hydrolyze ATP to a significant extent (Fig 5).
Figure 6. Proposed mechanism of ATP binding to SERCA.
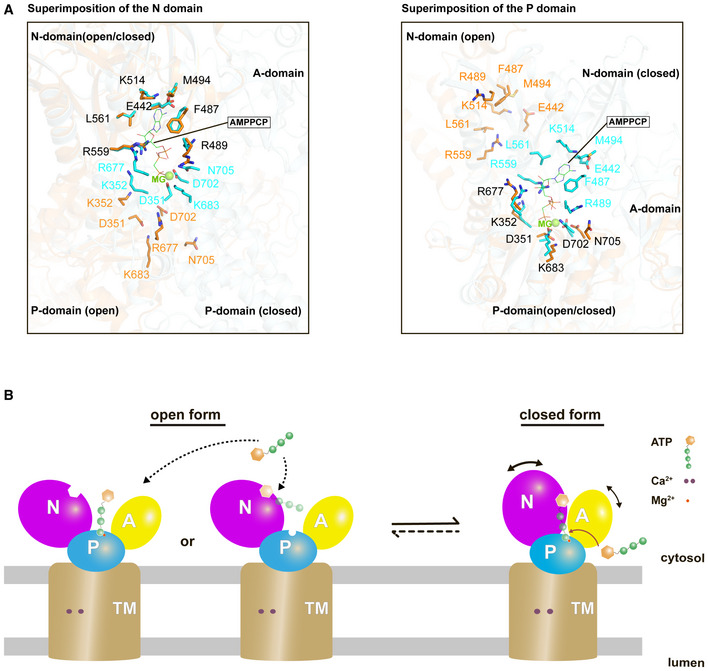
- Closed‐up views of the ATP binding residues when the N domain (left) or the P domain (right) is superimposed between the cryo‐EM structure of SERCA2b in the E1∙2Ca2+‐AMPPCP state (cyan; PDB ID: 6LLE) and the “open‐form” crystal structure of SERCA1a in the E1∙2Ca2+ state (orange; PDB ID: 1SU4). The ATP binding residues in the former and the latter are represented by cyan and orange sticks, respectively. A Mg2+ ion close to the AMPPCP molecule is depicted as a green sphere. Note that all residues are numbered according to the residue number in SERCA2b.
- The present cryo‐EM structure of SERCA2b in combination with the previous crystal structure of SERCA1a (PDB ID: 1SU4) reveals multiple conformations of SERCA in the E1∙2Ca2+ state due to the highly mobile cytosolic domains, which could be in equilibrium between closed and open forms. While the open form largely exposes the ATP‐binding site and therefore may readily receive and release ATP, the closed form appears to provide an ATP entry gate and serves as a preformed state immediately before ATP binding to SERCA.
Given the millimolar levels of intracellular ATP, seemingly high enough to saturate SERCA throughout the catalytic cycle, Ca2+ binding is likely coordinated to ATP binding. In other words, the E2‐ATP state could predominantly exist to efficiently incorporate Ca2+ under physiological conditions. Although both biochemical and computational works demonstrate that SERCA is incapable of hydrolyzing ATP without bound Ca2+ (Inesi et al, 2006; Das et al, 2017; Thirman et al, 2021), ATP molecule can be properly delivered to the binding pocket regardless of the availability of Ca2+ (Jensen et al, 2006; Kabashima et al, 2020). Nevertheless, the ATP‐unbound E1 state may possibly be generated in some particular local or transient environments where ADP and Ca2+ are highly abundant. SERCA2b has been reported to be enriched in the mitochondria‐associated ER‐membrane (MAM) and play an important role in Ca2+ signaling and homeostasis between the ER and the mitochondria (Lynes et al, 2013; Xiao et al, 2017). It is also known that IP3 receptor, a primary actor in Ca2+ efflux from the ER lumen, is situated at the ER–mitochondria interface to transport Ca2+ to the mitochondria in concert with GRp75, and VDAC1 (Szabadkai & Bianchi, 2006; Patergnani et al, 2011). In this regard, it will be interesting to investigate the precise concentrations of Ca2+ and ATP/ADP in the MAM compartment and their possible variations caused by the chemical crosstalk between these two organelles.
In conclusion, the closed form with less mobile cytosolic domains can allow an ATP molecule to appropriately enter the ATP‐binding cavity and drive ATP hydrolysis (Fig 6B, right). Although we cannot exclude a possibility that SERCA2b in the E1·2Ca2+ state is in equilibrium between the open and closed forms and that the open form binds ATP and subsequently adopts the E1·2Ca2+‐ATP state, the present study demonstrated that the closed form can do so even without returning to the open form via large cytosolic domain movements. Our findings provide a framework for further understanding the mechanism of ATP entry to SERCA Ca2+‐ATPase during its Ca2+ transport cycle.
Materials and Methods
Expression of human PA‐SERCA2b WT and T171C/L577C mutant
Expression of SERCA2b WT was carried out as described previously (Inoue et al, 2019; Zhang et al, 2020). In brief, a PiggyBac Cumate Switch‐Inducible Vector harboring an open reading frame encoding human SERCA2b WT was introduced into HEK293T cells along with a Super PiggyBac Transposase Expression Vector (System Bioscience, LLC, CA, USA), using polyethylenimine (Sigma‐Aldrich) to generate a stable cell line for overexpression of each protein. Cells were grown in Dulbecco’s modified Eagle’s medium with 4% inactivated fetal calf serum and incubated in a humidified incubator with 5% CO2 at 37°C. After 2 days of incubation, the expression of SERCA2b WT or T1032stop was induced with cumate (150 μg/ml) and phorbol 12‐myristate 13‐acetate (50 ng/ml). Cells were incubated at 37°C for another 48 h and then harvested by centrifugation at 1,000 g for 15 min.
The SERCA2b mutants were prepared by site‐directed mutagenesis using the plasmid pcDNA3.1/PA‐SERCA2b as a template, and primers 5′‐ggacagaaagagtgtgtgccggattaaagc‐3′, 5′‐gtctttagctttaatccggcacacactctttc‐3′, 5′‐ctttgtaatgactctgctttgtgctacaatgaggc‐3′, and 5′‐ccctttgcctcattgtagcacaaagcagagtc‐3′ for Q138C/D426C; primers 5′‐ ggacagaaagagttgccagcggattaaagc‐3′, 5′‐gtctttagctttaatccgctggcaactctttctg‐3′, 5′‐ctttgtaatgactctgctttgtgctacaatgaggc‐3′, and 5′‐ccctttgcctcattgtagcacaaagcagagtc‐3′ for V137C/D426C; primers 5′‐gaaatttgcgttggtgacaaagttcctgc‐3′, 5′‐caccaacgcaaatttctacaatatcaccagg‐3′, 5′‐gaaaaagtttgcgaagctacagagactgctc‐3′, and 5′‐gtagcttcgcaaactttttcatacacaccc‐3′ for A154C/G438C; primers 5′‐gaaattgcttgcggtgacaaagttcctgc‐3′, 5′‐caccgcaagcaatttctacaatatcaccagg‐3′, 5′‐gaaaaagtttgcgaagctacagagactgctc‐3′, and 5′‐gtagcttcgcaaactttttcatacacaccc‐3′ for V155C/G438C; and primers 5′‐ccatcaaatcttgcacactaagagttgacc‐3′, 5′‐ctcttagtgtgcaagatttgatggaagttaacc‐3′, 5′‐ggaattcactctatgcttttcacgtgacagaaag‐3′, and 5′‐cgtgaaaagcatagagtgaattcctttttcatc‐3′ for T171C/E486C; and primers 5′‐gaaattgcttgcggtgacaaagttcctgc‐3′, 5′‐caccgcaagcaatttctacaatatcaccagg‐3′, 5′‐gaaatgcactgcgaggactctgccaac‐3′, and 5′‐gtcctcgcagtgcatttcttctcttctcag‐3′ for T1171C/L577C. The mutant was expressed in the same way as SERCA2b WT.
Purification of SERCA2b WT and T171C/L577C mutant
The purification procedures were performed as described previously (Inoue et al, 2019; Zhang et al, 2020). Briefly, cells were lysed using a Dounce homogenizer and solubilized in buffer containing 50 mM HEPES‐NaOH (pH 7.0), 100 mM NaCl, 20% glycerol, 1 mM CaCl2, 1 mM MgCl2, 1 mM dithiothreitol (DTT), 1 mM phenylmethylsulfonyl fluoride, and 1/100 Protease Inhibitor Cocktail (Nacalai). After homogenization, 1% (w/v) n‐dodecyl‐β‐D‐maltoside (DDM) was added to solubilize the membrane fraction. The sample was centrifuged at 20,100 g for 1.5 h to remove insoluble material after gentle rotation. The supernatant was collected and incubated overnight with anti‐PA sepharose beads. Ten column volumes of buffer containing 50 mM HEPES‐NaOH (pH 7.0), 100 mM KCl, 20% glycerol, 1 mM CaCl2, 1 mM MgCl2, 1 mM DTT, and 0.05% (w/v) lauryl maltose neopentyl glycol (LMNG) were used to wash beads, followed by elution with the same buffer containing 0.2 mg/ml PA peptide. Eluted fractions were concentrated to 0.5 ml and further purified by size‐exclusion chromatography (SEC) on a Superose 6 10/300 GL column (GE Healthcare) with the same buffer. Peak fractions were concentrated to 10 mg/ml with an Amicon filter device equipped with a 100 kDa cutoff membrane.
For functional assays, SERCA2b WT and T171C/L577C were purified using the same protocols described in grid preparation for cryo‐EM measurement, except that no DTT was added to the buffer.
Autophosphorylation assay
Autophosphorylation of purified PA‐tagged SERCA2b WT and T171C/L577C was carried out using [γ‐32P] ATP essentially as described previously (Clausen et al, 2013; Chen et al, 2019). Briefly, the reaction mixture contained 0.5 μg of purified PA‐SERCA2b or 40 μg of BSA in buffer containing 100 mM KCl, 50 mM HEPES‐NaOH (pH 7.0), 20% glycerol, 1 mM CaCl2, 1 mM MgCl2, and 0.01% (w/v) LMNG, following treatment with 10 mM DTT or 5 mM K3Fe(CN)6. The reaction was initiated by addition of 0.074 MBq of [γ‐32P] ATP (PerkinElmer Life Sciences) at a final concentration of 5 μM. After a 60‐s reaction at 25°C, acid quenching of the phosphorylated enzyme was performed with 50 μl stop solution containing 10% trichloroacetic acid (TCA) and 50 mM phosphoric acid (H3PO4). For a 0‐s control reaction, the stop solution was first mixed with the radioisotope solution. Then, pre‐incubated SERCA2b WT or T171C/L577C mutant was added. The protein pellet was collected by centrifugation, washed with 100% acetone, and subjected to SDS–PAGE on a 7.5% polyacrylamide gel at pH 6.0 (Clausen et al, 2013; Chen et al, 2019). The radioactive bands were detected using a BAS IP MS 2040 E imaging plate (GE Healthcare) and an FLA‐2000 Phosphorimager (Fuji Film). The radioactive band was quantified by ImageJ.
ATPase activity assay
The ATPase activities of purified SERCA2b WT and T171C/L577C were measured as described previously (Ushioda et al, 2016; Inoue et al, 2019). Briefly, purified SERCA2b WT or T171C/L577C mutant in buffer containing 50 mM HEPES‐NaOH (pH 7.0), 100 mM KCl, 20% glycerol, 1 mM MgCl2, and 10 μM CaCl2 was treated with or without 10 mM DTT. ATP (1 mM) was then added and incubated at 37°C for 10 min to start the SERCA ATPase reaction cycle. The reaction was stopped using 5 mM EDTA, and the resultant solution was treated with an EnzCheck phosphate assay kit (Thermo Fisher Scientific). The mixture was incubated at 22°C for 30 min, and the absorbance at 360 nm was measured with a U‐3900 Spectrophotometer (Hitachi).
Grid preparation for cryo‐EM
To prepare the E1·2Ca2+ form, a second round of SEC was performed on the same column at 4°C with 50 mM HEPES‐NaOH (pH 7.0), 100 mM KCl, 0% glycerol, 1 mM CaCl2, 1 mM MgCl2, 1 mM DTT, and 0.01% (w/v) LMNG to remove glycerol and decrease the detergent concentration. The peak fractions were collected and concentrated to 4−8 mg/ml for cryo‐EM measurement. Grid preparation was the same as described previously. Briefly, purified samples (2−3 μl) were applied to a freshly glow‐discharged 300 mesh Quantifoil 1.2/1.3 carbon grid using Vitrobot (Thermo Fisher Scientific) with a blotting time of 3−4 s under 100% humidity at 4°C, and grids were plunge‐frozen in liquid ethane.
Cryo‐EM data collection and image processing
Prepared grids were transferred to a Titan Krios G3i microscope (Thermo Fisher Scientific), which was operated at 300 kV and equipped with a Gatan Quantum‐LS Energy Filter (GIF) with a slit width of 25 eV and a Gatan K3 Summit direct electron detector in the electron counting mode. Imaging was performed at a nominal magnification of ×105,000, corresponding to a calibrated pixel size of 0.83 Å per pixel (University of Tokyo, Japan). Each movie was recorded for 3 s and subdivided into 60 frames. The electron flux was set to 14 e−/pixel/s at the detector, resulting in an accumulated exposure of 60 e−/Å2 at the specimen. Data were automatically acquired by the image shift method using SerialEM software (Mastronarde, 2005), with a 3 × 3 beam‐image shift (BIS) pattern and a defocus range of −0.8 to −1.8 μm. In total, 3,555 movies were acquired for the grid, and the precise number of images is described in Table EV1. For the dataset, dose‐fractionated movies were subjected to beam‐induced motion correction using Relion‐3 (Zivanov et al, 2018), and contrast transfer function (CTF) parameters were estimated using CTFFIND4 (Rohou & Grigorieff, 2015).
Particles were extracted from motion‐corrected micrographs with down‐sampling to a pixel size of 3.32 Å per pixel. These particles were subjected to three rounds of 2D classification using the number of classes k = 100 and a tau‐fudge value of 2, followed by two rounds of 3D classification using the number of classes k = 4 and a tau‐fudge value of 4 by RELION 3.1 (Zivanov et al, 2018). Meanwhile, quick data assessment with 2D classification, ab initio reconstruction, heterogeneous refinement, and non‐uniform refinement by cryoSPARC v2.14 (Punjani et al, 2017) was performed to produce a 3D initial model, which was used as a reference for the 3D classification by RELION 3.1. The best particles were selected, re‐extracted with a pixel size of 1.245 Å per pixel, and subjected to auto‐3D refinement. The resulting 3D maps and particle sets were subjected to per‐particle defocus refinement, beam‐tilt refinement, Bayesian polishing, second per‐particle defocus refinement, and 3D refinement. An additional 3D classification was performed without masking for “closed‐form” SERCA2b. The global resolution of SERCA2b WT in the E1·2Ca2+ state was 3.3 Å. The resolution was calculated according to the Fourier Shell Correlation (FSC) = 0.143 criterion (Rosenthal & Henderson, 2003). The local resolution was estimated using RELION 3.1 (Zivanov et al, 2018). Detailed processing strategies are shown in Fig EV1.
Model building, refinement, and validation
The cryo‐EM structure of SERCA2b WT in the E1·2Ca2+ state was modeled using cryo‐EM structures of human SERCA2b WT in the AMPPCP state (PDB ID: 6LLE) as an initial model. After rigid‐body fitting of each cytosolic domain in PHENIX (Adam‐Vizi & Starkov, 2010; Afonine et al, 2018), a structure model was further refined manually and iteratively using Coot (Emsley & Cowtan, 2004), and then, several rounds of structure refinement were carried out using “phenix.real_space_refine” in PHENIX with secondary structure restraint. The geometry of the structure model was validated using MolProbity (Chen et al, 2010). All the structural figures were prepared in UCSF Chimera (Pettersen et al, 2004) and PyMOL (https://pymol.org/2/). The linker regions composed of residues 505−506, and 993–1,012, which were located at L1/2, the N domain, and L10/11, respectively, could not be modeled due to missing and disordered density in the cryo‐EM map. The statistics for 3D reconstitution and model refinement are summarized in Table EV1.
Statistical analysis
Results of gel images, ATPase activity, and autoradiography are shown as mean ± SD of three independent experiments. All statistical significance was calculated by one‐way ANOVA followed by Tukey's test and indicated by asterisks: *P < 0.05; **P < 0.005.
Author contributions
YZ performed almost all experiments, structure modeling, and structure refinement. AT and MK performed acquisition of cryo‐EM image data. SW assisted in structure modeling and refinement. HK assisted in autophosphorylation experiments with [γ‐32P] ATP. YZ and KI prepared figures and wrote the manuscript. All authors discussed the results, critically read the manuscript, and approved the manuscript for submission. KI supervised this work.
Conflict of interest
The authors declare that they have no conflict of interest.
Supporting information
Expanded View Figures PDF
Table EV1
Acknowledgements
This work was supported by Grants‐in‐Aid for Scientific Research on Innovative Areas from MEXT to K.I. (18H03978 and 21H04758) and Y.Z. (21K15036), and the Basis for Supporting Innovative Drug Discovery and Life Science Research (BINDS) from the Japan Agency for Medical Research and Development (AMED) under Grant Number JP19am0101115 (support number 1025).
The EMBO Journal (2021) 40: e108482.
Data availability
All data needed to evaluate the conclusions in the paper are included in the paper and/or the Supplementary Materials. Additional data supporting the findings of this manuscript are available from the corresponding authors upon reasonable request. Atomic coordinates of human SERCA2b in the E1·2Ca2+ state have been deposited in the Protein Data Bank (https://pdbj.org/) under accession codes 7E7S. The cryo‐EM density map has been deposited in the Electron Microscopy Data Bank (https://www.ebi.ac.uk/pdbe/emdb/) under accession codes EMD‐31003.
References
- Adam‐Vizi V, Starkov AA (2010) Calcium and mitochondrial reactive oxygen species generation: how to read the facts. J Alzheimers Dis 20: S413–S426 [DOI] [PMC free article] [PubMed] [Google Scholar]
- Afonine PV, Poon BK, Read RJ, Sobolev OV, Terwilliger TC, Urzhumtsev A, Adams PD (2018) Real‐space refinement in PHENIX for cryo‐EM and crystallography. Acta Crystallogr D Struct Biol 74: 531–544 [DOI] [PMC free article] [PubMed] [Google Scholar]
- Akin BL, Hurley TD, Chen Z, Jones LR (2013) The structural basis for phospholamban inhibition of the calcium pump in sarcoplasmic reticulum. J Biol Chem 288: 30181–30191 [DOI] [PMC free article] [PubMed] [Google Scholar]
- Axelsen KB, Palmgren MG (1998) Evolution of substrate specificities in the P‐type ATPase superfamily. J Mol Evol 46: 84–101 [DOI] [PubMed] [Google Scholar]
- Bublitz M, Musgaard M, Poulsen H, Thøgersen L, Olesen C, Schiøtt B, Morth JP, Møller JV, Nissen P (2013) Ion pathways in the sarcoplasmic reticulum Ca2+‐ATPase. J Biol Chem 288: 10759–10765 [DOI] [PMC free article] [PubMed] [Google Scholar]
- Bublitz M, Poulsen H, Morth JP, Nissen P (2010) In and out of the cation pumps: P‐type ATPase structure revisited. Curr Opin Struct Biol 20: 431–439 [DOI] [PubMed] [Google Scholar]
- Chen J, Smaardijk S, Mattelaer C‐A, Pamula F, Vandecaetsbeek I, Vanoevelen J, Wuytack F, Lescrinier E, Eggermont J, Vangheluwe P (2019) An N‐terminal Ca2+‐binding motif regulates the secretory pathway Ca2+/Mn2+‐transport ATPase SPCA1. J Biol Chem 294: 7878–7891 [DOI] [PMC free article] [PubMed] [Google Scholar]
- Chen VB, Arendall WB, Headd JJ, Keedy DA, Immormino RM, Kapral GJ, Murray LW, Richardson JS, Richardson DC (2010) MolProbity: all‐atom structure validation for macromolecular crystallography. Acta Crystallogr D Biol Crystallogr 66: 12–21 [DOI] [PMC free article] [PubMed] [Google Scholar]
- Clausen JD, Bublitz M, Arnou B, Montigny C, Jaxel C, Møller JV, Nissen P, Andersen JP, Le Maire M (2013) SERCA mutant E309Q binds two Ca2+ ions but adopts a catalytically incompetent conformation. EMBO J 32: 3231–3243 [DOI] [PMC free article] [PubMed] [Google Scholar]
- Das A, Gur M, Cheng MH, Jo S, Bahar I, Roux B (2014) Exploring the conformational transitions of biomolecular systems using a simple two‐state anisotropic network model. PLoS Comput Biol 10: e1003521 [DOI] [PMC free article] [PubMed] [Google Scholar]
- Das A, Rui H, Nakamoto R, Roux B (2017) Conformational transitions and alternating‐access mechanism in the sarcoplasmic reticulum calcium pump. J Mol Biol 429: 647–666 [DOI] [PMC free article] [PubMed] [Google Scholar]
- Dombkowski AA, Sultana KZ, Craig DB (2014) Protein disulfide engineering. FEBS Lett 588: 206–212 [DOI] [PubMed] [Google Scholar]
- Dyla M, Basse Hansen S, Nissen P, Kjaergaard M (2019a) Structural dynamics of P‐type ATPase ion pumps. Biochem Soc Trans 47: 1247–1257 [DOI] [PubMed] [Google Scholar]
- Dyla M, Kjærgaard M, Poulsen H, Nissen P (2019b) Structure and Mechanism of P‐Type ATPase Ion Pumps. Annu Rev Biochem 89: 583–603 [DOI] [PubMed] [Google Scholar]
- Dyla M, Terry DS, Kjaergaard M, Sørensen TL‐M, Andersen JL, Andersen JP, Knudsen CR, Altman RB, Nissen P, Blanchard SC (2017) Dynamics of P‐type ATPase transport revealed by single‐molecule FRET. Nature 551: 346–351 [DOI] [PMC free article] [PubMed] [Google Scholar]
- Emsley P, Cowtan K (2004) Coot: model‐building tools for molecular graphics. Acta Crystallogr D Biol Crystallogr 60: 2126–2132 [DOI] [PubMed] [Google Scholar]
- Espinoza‐Fonseca LM, Thomas DD (2011) Atomic‐level characterization of the activation mechanism of SERCA by calcium. PLoS One 6: e26936 [DOI] [PMC free article] [PubMed] [Google Scholar]
- Focht D, Croll TI, Pedersen BP, Nissen P (2017) Improved model of proton pump crystal structure obtained by interactive molecular dynamics flexible fitting expands the mechanistic model for proton translocation in P‐Type ATPases. Front Physiol 8: 202 [DOI] [PMC free article] [PubMed] [Google Scholar]
- Hiraizumi M, Yamashita K, Nishizawa T, Nureki O (2019) Cryo‐EM structures capture the transport cycle of the P4‐ATPase flippase. Science 365: 1149–1155 [DOI] [PubMed] [Google Scholar]
- Huang Y, Li H, Bu Y (2009) Molecular dynamics simulation exploration of cooperative migration mechanism of calcium ions in sarcoplasmic reticulum Ca2+‐ATPase. J Comput Chem 30: 2136–2145 [DOI] [PubMed] [Google Scholar]
- Inesi G, Lewis D, Ma H, Prasad A, Toyoshima C (2006) Concerted conformational effects of Ca2+ and ATP are required for activation of sequential reactions in the Ca2+ ATPase (SERCA) catalytic cycle. Biochemistry 45: 13769–13778 [DOI] [PMC free article] [PubMed] [Google Scholar]
- Inoue M, Sakuta N, Watanabe S, Zhang Y, Yoshikaie K, Tanaka Y, Ushioda R, Kato Y, Takagi J, Tsukazaki Tet al (2019) Structural basis of Sarco/endoplasmic reticulum Ca2+‐ATPase 2b regulation via transmembrane helix interplay. Cell Rep 27: 1221–1230.e3 [DOI] [PubMed] [Google Scholar]
- Jensen AML, Sørensen TLM, Olesen C, Møller JV, Nissen P (2006) Modulatory and catalytic modes of ATP binding by the calcium pump. EMBO J 25: 2305–2314 [DOI] [PMC free article] [PubMed] [Google Scholar]
- Kabashima Y, Ogawa H, Nakajima R, Toyoshima C (2020) What ATP binding does to the Ca2+ pump and how nonproductive phosphoryl transfer is prevented in the absence of Ca2+. Proc Natl Acad Sci USA 117: 18448–18458 [DOI] [PMC free article] [PubMed] [Google Scholar]
- Kekenes‐Huskey PM, Metzger VT, Grant BJ, Andrew McCammon J (2012) Calcium binding and allosteric signaling mechanisms for the sarcoplasmic reticulum Ca2+ ATPase. Protein Sci 21: 1429–1443 [DOI] [PMC free article] [PubMed] [Google Scholar]
- Liu M, Barth A (2003) Mapping interactions between the Ca2+‐ATPase and its substrate ATP with infrared spectroscopy. J Biol Chem 278: 10112–10118 [DOI] [PubMed] [Google Scholar]
- Lopez‐Redondo ML, Coudray N, Zhang Z, Alexopoulos J, Stokes DL (2018) Structural basis for the alternating access mechanism of the cation diffusion facilitator YiiP. Proc Natl Acad Sci USA 115: 3042–3047 [DOI] [PMC free article] [PubMed] [Google Scholar]
- Lynes EM, Raturi A, Shenkman M, Sandoval CO, Yap MC, Wu J, Janowicz A, Myhill N, Benson MD, Campbell RE (2013) Palmitoylation is the switch that assigns calnexin to quality control or ER Ca2+ signaling. J Cell Sci 126: 3893–3903 [DOI] [PubMed] [Google Scholar]
- Maegawa K‐I, Watanabe S, Noi K, Okumura M, Amagai Y, Inoue M, Ushioda R, Nagata K, Ogura T, Inaba K (2017) The highly dynamic nature of ERdj5 is key to efficient elimination of aberrant protein oligomers through ER‐associated degradation. Structure 25: 846–857.e4 [DOI] [PubMed] [Google Scholar]
- Mastronarde DN (2005) Automated electron microscope tomography using robust prediction of specimen movements. J Struct Biol 152: 36–51 [DOI] [PubMed] [Google Scholar]
- Michelangeli F, East JM (2011) A diversity of SERCA Ca2+ pump inhibitors. Biochem Soc Trans 39: 789–797 [DOI] [PubMed] [Google Scholar]
- Møller JV, Nissen P, Sørensen TL, le Maire M (2005) Transport mechanism of the sarcoplasmic reticulum Ca2+‐ATPase pump. Curr Opin Struct Biol 15: 387–393 [DOI] [PubMed] [Google Scholar]
- Møller JV, Olesen C, Winther A‐ML, Nissen P (2010) The sarcoplasmic Ca2+‐ATPase: design of a perfect chemi‐osmotic pump. Q Rev Biophys 43: 501 [DOI] [PubMed] [Google Scholar]
- Morth JP, Pedersen BP, Toustrup‐Jensen MS, Sørensen TL‐M, Petersen J, Andersen JP, Vilsen B, Nissen P (2007) Crystal structure of the sodium–potassium pump. Nature 450: 1043–1049 [DOI] [PubMed] [Google Scholar]
- Mueller B, Zhao M, Negrashov IV, Bennett R, Thomas DD (2004) SERCA structural dynamics induced by ATP and calcium. Biochemistry 43: 12846–12854 [DOI] [PubMed] [Google Scholar]
- Nyblom M, Poulsen H, Gourdon P, Reinhard L, Andersson M, Lindahl E, Fedosova N, Nissen P (2013) Crystal structure of Na+, K+‐ATPase in the Na+‐bound state. Science 342: 123–127 [DOI] [PubMed] [Google Scholar]
- Patergnani S, Suski JM, Agnoletto C, Bononi A, Bonora M, De Marchi E, Giorgi C, Marchi S, Missiroli S, Poletti Fet al (2011) Calcium signaling around mitochondria associated membranes (MAMs). Cell Commun Signal 9: 1–10 [DOI] [PMC free article] [PubMed] [Google Scholar]
- Pettersen EF, Goddard TD, Huang CC, Couch GS, Greenblatt DM, Meng EC, Ferrin TE (2004) UCSF Chimera—a visualization system for exploratory research and analysis. J Comput Chem 25: 1605–1612 [DOI] [PubMed] [Google Scholar]
- Punjani A, Rubinstein JL, Fleet DJ, Brubaker MA (2017) cryoSPARC: algorithms for rapid unsupervised cryo‐EM structure determination. Nat Methods 14: 290–296 [DOI] [PubMed] [Google Scholar]
- Raguimova ON, Smolin N, Bovo E, Bhayani S, Autry JM, Zima AV, Robia SL (2018) Redistribution of SERCA calcium pump conformers during intracellular calcium signaling. J Biol Chem 293: 10843–10856 [DOI] [PMC free article] [PubMed] [Google Scholar]
- Ravishankar H, Pedersen MN, Eklund M, Sitsel A, Li C, Duelli A, Levantino M, Wulff M, Barth A, Olesen C (2020) Tracking Ca2+ ATPase intermediates in real time by x‐ray solution scattering. Science. Advances 6: eaaz0981 [DOI] [PMC free article] [PubMed] [Google Scholar]
- Rohou A, Grigorieff N (2015) CTFFIND4: Fast and accurate defocus estimation from electron micrographs. J Struct Biol 192: 216–221 [DOI] [PMC free article] [PubMed] [Google Scholar]
- Rosenthal PB, Henderson R (2003) Optimal determination of particle orientation, absolute hand, and contrast loss in single‐particle electron cry microscopy. J Mol Biol 333: 721–745 [DOI] [PubMed] [Google Scholar]
- Szabadkai G, Bianchi K, Várnai P, Destefani D, Wieckowski MR, Cavagna D, Nagy AI, Balla T, Rizzuto R (2006) Chaperone‐mediated coupling of endoplasmic reticulum and mitochondrial Ca2+ channels. J Cell Biol 175: 901–911. [DOI] [PMC free article] [PubMed] [Google Scholar]
- Thirman J, Rui H, Roux B (2021) Elusive intermediate state key in the conversion of ATP hydrolysis into useful work driving the Ca2+ pump SERCA. J Phys Chem B 125: 2921–2928 [DOI] [PubMed] [Google Scholar]
- Timcenko M, Lyons JA, Januliene D, Ulstrup JJ, Dieudonné T, Montigny C, Ash M‐R, Karlsen JL, Boesen T, Kühlbrandt Wet al (2019) Structure and autoregulation of a P4‐ATPase lipid flippase. Nature 571: 366–370 [DOI] [PubMed] [Google Scholar]
- Toyoshima C (2009) How Ca2+‐ATPase pumps ions across the sarcoplasmic reticulum membrane. Biochim Biophys Acta Mol Cell Res 1793: 941–946 [DOI] [PubMed] [Google Scholar]
- Toyoshima C, Iwasawa S, Ogawa H, Hirata A, Tsueda J, Inesi G (2013) Crystal structures of the calcium pump and sarcolipin in the Mg 2+‐bound E1 state. Nature 495: 260–264 [DOI] [PubMed] [Google Scholar]
- Toyoshima C, Mizutani T (2004) Crystal structure of the calcium pump with a bound ATP analogue. Nature 430: 529–535 [DOI] [PubMed] [Google Scholar]
- Toyoshima C, Nakasako M, Nomura H, Ogawa H (2000) Crystal structure of the calcium pump of sarcoplasmic reticulum at 2.6 Å resolution. Nature 405: 647–655 [DOI] [PubMed] [Google Scholar]
- Ushioda R, Miyamoto A, Inoue M, Watanabe S, Okumura M, Maegawa K‐I, Uegaki K, Fujii S, Fukuda Y, Umitsu M (2016) Redox‐assisted regulation of Ca2+ homeostasis in the endoplasmic reticulum by disulfide reductase ERdj5. Proc Natl Acad Sci USA 113: E6055–E6063 [DOI] [PMC free article] [PubMed] [Google Scholar]
- Veshaguri S, Christensen SM, Kemmer GC, Ghale G, Moller MP, Lohr C, Christensen AL, Justesen BH, Jorgensen IL, Schiller Jet al (2016) Direct observation of proton pumping by a eukaryotic P‐type ATPase. Science 351: 1469–1473 [DOI] [PMC free article] [PubMed] [Google Scholar]
- Winters DL, Autry JM, Svensson B, Thomas DD (2008) Interdomain fluorescence resonance energy transfer in SERCA probed by cyan‐fluorescent protein fused to the actuator domain. Biochemistry 47: 4246–4256 [DOI] [PMC free article] [PubMed] [Google Scholar]
- Winther A‐ML, Bublitz M, Karlsen JL, Møller JV, Hansen JB, Nissen P, Buch‐Pedersen MJ (2013) The sarcolipin‐bound calcium pump stabilizes calcium sites exposed to the cytoplasm. Nature 495: 265–269 [DOI] [PubMed] [Google Scholar]
- Xiao F, Zhang J, Zhang C, An W (2017) Hepatic stimulator substance inhibits calcium overflow through the mitochondria‐associated membrane compartment during nonalcoholic steatohepatitis. Lab Invest 97: 289–301 [DOI] [PubMed] [Google Scholar]
- Zhang Y, Fujii J, Phillips MS, Chen H‐S, Karpati G, Yee W‐C, Schrank B, Cornblath DR, Boylan KB, MacLennan DH (1995) Characterization of cDNA and genomic DNA encoding SERCA1, the Ca2+‐ATPase of human fast‐twitch skeletal muscle sarcoplasmic reticulum, and its elimination as a candidate gene for Brody disease. Genomics 30: 415–424 [DOI] [PubMed] [Google Scholar]
- Zhang Y, Inoue M, Tsutsumi A, Watanabe S, Nishizawa T, Nagata K, Kikkawa M, Inaba K (2020) Cryo‐EM structures of SERCA2b reveal the mechanism of regulation by the luminal extension tail. Sci Adv 6: eabb0147 [DOI] [PMC free article] [PubMed] [Google Scholar]
- Zivanov J, Nakane T, Forsberg BO, Kimanius D, Hagen WJ, Lindahl E, Scheres SH (2018) New tools for automated high‐resolution cryo‐EM structure determination in RELION‐3. Elife 7: e42166 [DOI] [PMC free article] [PubMed] [Google Scholar]


