

Abstract
The ability of stem cells to switch between quiescence and proliferation is crucial for tissue homeostasis and regeneration. Drosophila quiescent neural stem cells (NSCs) extend a primary cellular protrusion from the cell body prior to their reactivation. However, the structure and function of this protrusion are not well established. Here, we show that in the protrusion of quiescent NSCs, microtubules are predominantly acentrosomal and oriented plus‐end‐out toward the tip of the primary protrusion. We have identified Mini Spindles (Msps)/XMAP215 as a key microtubule regulator in quiescent NSCs that governs NSC reactivation via regulating acentrosomal microtubule growth and orientation. We show that quiescent NSCs form membrane contact with the neuropil and E‐cadherin, a cell adhesion molecule, localizes to these NSC‐neuropil junctions. Msps and a plus‐end directed motor protein Kinesin‐2 promote NSC cell cycle re‐entry and target E‐cadherin to NSC‐neuropil contact during NSC reactivation. Together, this work establishes acentrosomal microtubule organization in the primary protrusion of quiescent NSCs and the Msps‐Kinesin‐2 pathway that governs NSC reactivation, in part, by targeting E‐cad to NSC‐neuropil contact sites.
Keywords: acentrosomal microtubules, Drosophila, neural stem cells, quiescence, reactivation
Subject Categories: Development, Neuroscience
The microtubule regulator Mini Spindles (Msps)/XMAP215 promotes Drosophila neural stem cell activation, by targeting adhesion molecule E‐cadherin via Kinesin‐2 motors to neural stem cell‐neuropil contact sites.
Introduction
The ability of stem cells to switch between quiescence and proliferation is crucial for tissue homeostasis and regeneration. Most neural stem cells (NSCs) that reside in mammalian adult brains are in a mitotically dormant, quiescent state (Morshead et al, 1994; Doetsch et al, 1999). In response to physiological stimuli such as the presence of nutrition and physical exercise, quiescent NSCs (qNSCs) can exit from quiescence and become reactivated to generate new neurons (Fabel & Kempermann, 2008; Otsuki & Brand, 2017, 2020; Ding et al, 2020). Conversely, stress, anxiety, and old age reduce the proliferation capability of NSCs (Lucassen et al, 2010). Dysregulation of quiescence or reactivation in the nervous system can result in depletion of the NSC population or too few differentiated neurons (Cheung & Rando, 2013).
Recently, Drosophila NSCs, also known as neuroblasts, have emerged as a powerful model to study the mechanisms underlying NSC quiescence and reactivation in vivo. Drosophila neural stem cells in the central brain (CB) and thoracic ventral nerve cord (VNC) enter into quiescence at the end of embryogenesis and subsequently exit quiescence (also termed reactivation) largely within 24 h in response to the presence of dietary amino acids (Truman & Bate, 1988; Tsuji et al, 2008; Lai & Doe, 2014). Their reactivation depends on an evolutionarily conserved insulin/IGF signaling pathway (Chell & Brand, 2010; Sousa‐Nunes et al, 2011). Insulin/IGF‐like peptides Dilp2 and Dilp6 are secreted by the blood–brain barrier (BBB) glia and activate the insulin/IGF/Akt pathway in the underlying NSCs (Chell & Brand, 2010; Sousa‐Nunes et al, 2011). Gap junctions in the BBB glia couple metabolic signals with synchronized calcium pulses and insulin secretion, leading to a relatively synchronized reactivation of NSCs (Spéder & Brand, 2014). Mammalian insulin‐like growth factor‐1 (IGF‐1) and IGF‐2 also promote NSC proliferation (Aberg et al, 2003; Ye et al, 2004; Yan et al, 2006; Mairet‐Coello et al, 2009). Interestingly, human IGF1R mutations are associated with microcephaly, a neurodevelopmental disorder (Juanes et al, 2015). In the absence of nutrition, the Hippo pathway inactivates Yorkie to maintain the quiescence of NSCs (Ding et al, 2016; Poon et al, 2016). The Hippo pathway is inactivated in response to dietary amino acids and is downregulated by the CRL4‐Mahjong E3 ligase complex (Ly et al, 2019). NSC reactivation also requires intrinsic mechanisms involving the transcription factor Prospero, spindle matrix proteins, Hsp83/Hsp90, and striatin‐interacting phosphatase and kinase (STRIPAK) family proteins (Lai & Doe, 2014; Li et al, 2017; Huang & Wang, 2018; Gil‐Ranedo et al, 2019).
A hallmark of qNSCs in Drosophila is the cellular extension(s) attached to the cell body. qNSCs in Drosophila extend a primary cellular protrusion toward the neuropil and occasionally extend a second but a much shorter protrusion at the opposite side of the cell body (Truman & Bate, 1988; Chell & Brand, 2010). The cellular protrusions of qNSCs are removed presumably via retraction prior to cell cycle re‐entry (Chell & Brand, 2010). Recently, we reported that the primary cellular extension of qNSCs is a microtubule‐enriched structure (Li et al, 2017). Microtubules are polar filaments with a fast‐growing plus‐end and a slow‐growing minus‐end. Microtubules have distinct orientations in axons and dendrites of Drosophila neurons, with plus ends distal to the cell body (plus‐end‐out orientation) in axons and opposite orientation in dendrites (Stone et al, 2008). These distinct microtubule orientations are associated with different structures and functional properties of axons and dendrites. However, microtubule orientation in the cellular protrusion of qNSCs is unknown, and key microtubule regulators during NSC reactivation have not been identified.
Mini spindles (Msps), an XMAP215/ch‐TOG/Msps family protein, is a key regulator of microtubule growth in dividing cells (Lee et al, 2001; Chen et al, 2016). Msps functions as a microtubule polymerase by binding to microtubule plus ends (Lee et al, 2001). However, very little is known about their function in nondividing cells. In this study, we demonstrate that microtubules in the primary protrusion of qNSCs are predominantly acentrosomal and oriented plus‐end‐out, distal to the cell body. We have identified Msps as a key regulator of NSC reactivation, microtubule dynamics, and orientation. We also demonstrate a direct membrane contact between quiescent NSCs and the neuropil where E‐cadherin (E‐cad) is localized at these contact sites. E‐cad is also intrinsically required for NSC reactivation. E‐cad localization at the NSC‐neuropil contact site depends on Msps and a microtubule plus‐end‐directed motor protein Kinesin‐2 complex. Our study, for the first time, has discovered a microtubule plus‐end‐out orientation in the primary protrusion of qNSCs and a novel mechanism by which Msps‐dependent acentrosomal microtubule assembly and Kinesin‐2 target E‐cad to NSC‐niche contacts to promote NSC reactivation.
Results
The centrosomes in quiescent NSCs are predominantly located at the apical region, away from the primary protrusion
We previously reported that microtubules marked by α‐tubulin are present in the cellular extension of quiescent NSCs (qNSCs) (Li et al, 2017). How microtubules in qNSCs are nucleated is unknown. The centrosomes are a major microtubule‐organizing center (MTOC) in most dividing cells, including active NSCs, and are composed of a pair of centrioles surrounded by pericentriolar material (PCM) proteins. To investigate whether functional centrosomes are responsible for the assembly of microtubules in qNSCs, we examined the localization of centrosomal proteins in wild‐type qNSCs. Active NSCs in the central larval brain divide asymmetrically to generate differentiating daughter cells that eventually produce neurons toward the basal side, the inner layer of the larval central nervous system. Since the primary cellular extension of qNSCs in the CB is connected with neuropils from neurons (Truman & Bate, 1988; Chell & Brand, 2010), we referred to the tip of the primary cellular extension as the basal side of qNSCs, while the opposite side of the cell, which is distal to primary protrusion and faces the surface of the larval brain as the apical region. We referred to the site where the primary cellular extension is attached to the cell body as protrusion initiation segment (PIS; illustrated in Fig 1A). First, we examined the localization of Asterless (Mosimann et al, 2006), a constitutive centriolar protein at the centrosomes in dividing cells (Varmark et al, 2007). Remarkably, at 2 h ALH, Asl in qNSCs was observed mostly at the apical region distal to the cellular extension of qNSCs labeled by CD8‐GFP driven by grainy head (grh)‐Gal4 (Fig EV1A; 81.8%, n = 44, CB). Occasionally, Asl‐positive centrioles were observed at the lateral region of the cell body (Fig EV1A, 13.6%, n = 44) or at the PIS region (Fig EV1A, 4.5%, n = 44), where the primary protrusion was attached to the cell body in qNSCs. At 6 h ALH and 16 h ALH, we observed an almost identical localization pattern of Asl with the majority of Asl‐positive centrioles localized to the apical region (6 h ALH, 82.1%, n = 28, CB; 16 h ALH, 88.1%, n = 93, VNC), suggesting that the centrosomes in wild‐type qNSCs might be relatively stationary close to the apical surface in early larval stages. These data suggested that the centrosomes in qNSCs are positioned predominantly at the apical region, which is distal to the primary cellular extension. Moreover, we found that the majority of wild‐type qNSCs contained two Asl‐positive centrioles (Fig EV1A; 75%, n = 44), while the rest of 25% (n = 44) of qNSCs contained a single Asl‐positive centriole. As centrioles are duplicated in the S phase, qNSCs with two Asl‐positive centrioles are presumably arrested in the G2 phase, while qNSCs with a single Asl‐positive centriole are likely arrested in the G0 stage. This observation in the CB is very similar to a recent report on the ratio of G2‐ and G0‐arrested qNSCs in the VNC (Otsuki & Brand, 2018).
Figure 1. The centrosomes in quiescent NSCs are immature.
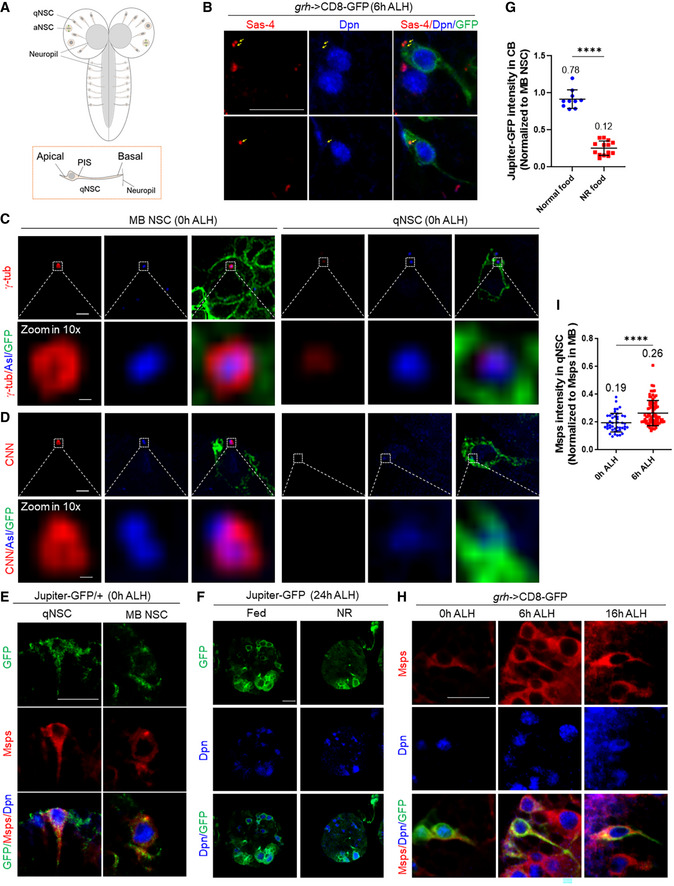
- An illustration of the larval brain at early larval stages and the alignment of the quiescent NSC along the apico‐basal axis.
- Larval brains at 6 h ALH from grh‐Gal4; UAS‐CD8‐GFP were labeled with Sas‐4, Dpn, and GFP.
- Larval brains at 0 h ALH from grh‐Gal4; UAS‐CD8‐GFP were labeled with γ‐tubulin (γ‐tub), Asl, and GFP and imaged under super‐resolution microscopy.
- Larval brains at 0 h ALH from grh‐Gal4; UAS‐CD8‐GFP were labeled with Centrosomin (CNN), Asl and GFP and imaged under spinning disk super‐resolution microscopy.
- Larval brains at 0 h ALH from Jupiter‐GFP (G147) were labeled with GFP, Msps, and Dpn.
- Larval brains at 24 h ALH from Jupiter‐GFP were raised on normal food (fed) and food depleted of amino acids (nutritional restriction/NR) and labeled with GFP and Dpn.
- Quantification graph showing Jupiter‐GFP protein levels in qNSCs by normalizing to that in MB NSCs in (F). n = 10 brain lobes (BL) for normal food condition; n = 14 BL for NR food condition. ****P < 0.0001.
- Larval brains at various time points from grh‐Gal4; UAS‐CD8‐GFP were labeled with Msps, Dpn, and GFP.
- Quantification graph of Msps intensity in qNSCs by normalizing against that in MB NSC at 0 h ALH (n = 45 NSCs) and 6 h ALH (n = 81 NSCs) in (H). ****P < 0.0001.
Data information: Quiescent NSCs in the central brain are shown (B–H). Arrows, centriole(s)/centrosomes (B). In (G, I), data are presented as mean ± SD. In (G, I), statistical significances were determined by two‐tailed Student's t‐test. Scale bars (B, E, F, H): 10 µm. Scale bars (C, D): upper panel 1 µm; lower panel 0.1 µm.
Figure EV1. The centrosomes in qNSCs are immature.
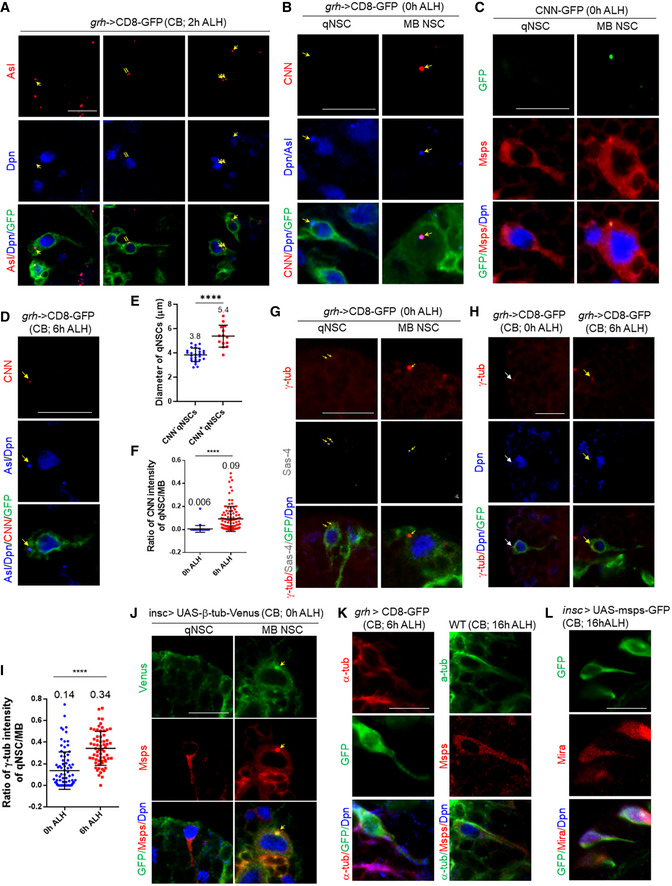
- Larval brains at 2 h after larval hatching (ALH) from grainy head (grh)‐Gal4; UAS‐CD8‐GFP were labeled with Asterless, Deadpan (Dpn) and GFP. Arrows indicate the centrosomes.
- Larval brains at 0 h ALH from grh‐Gal4; UAS‐CD8‐GFP were labeled with CNN, Asl, Deadpan (Dpn), and GFP. Arrows indicate the centrosomes.
- Wild‐type larval brains expressing CNN‐GFP (MiMIC line; BDSC#60266) at 0 h ALH were labeled with GFP, Dpn, and Msps. A representative qNSC and interphase Mushroom body (MB) NSC are shown.
- Wild‐type larval brains expressing grh>CD8‐GFP at 6 h ALH were labeled with CNN, Asl, Dpn, and GFP. Arrows indicate the centrosomes.
- Quantification of the cell diameter of CNN‐negative vs CNN‐positive qNSCs from wild‐type brains expressing grh>CD8‐GFP at 6 h ALH. n = 26 NSCs for CNN‐negative qNSCs; n = 14 NSCs for CNN‐positive qNSCs. ****P < 0.0001.
- Quantification graph of the ratio of CNN intensity between qNSCs and mushroom body (MB) NSCs from 0 h ALH and 6 h ALH larval brains in (B, D). n = 40 NSCs for 0 h ALH; n = 99 for 6 h ALH. ****P < 0.0001.
- Wild‐type larval brains expressing grh>CD8‐GFP at 0 h ALH were stained with γ‐tubulin, Dpn, and GFP. A representative qNSC and interphase Mushroom body (MB) NSC are shown. Arrows indicate the centrosome.
- Wild‐type larval brains expressing grh>CD8‐GFP at 0 h ALH and 6 h ALH were labeled with γ‐tubulin, Dpn, and GFP. Arrows indicate the centrosome.
- Quantification graph of the ratio of γ‐tub intensity between qNSCs and mushroom body (MB) NSCs from 0 h ALH and 6 h ALH larval brains in (H). n = 84 NSCs for 0 h ALH; n = 63 NSCs for 6 h ALH. ****P < 0.0001.
- Larval brains at 0 h ALH from insc‐Gal4; UAS‐β‐tubulin‐Venus were labeled with GFP, Msps and Dpn. Quiescent NSCs at the CB are shown. The arrow points at the centrosome.
- Wild‐type larval brains expressing grh>CD8‐GFP at 6 h ALH were labeled with α‐tubulin, Dpn and GFP, and wild‐type larval brains at 16 h ALH were labeled with α‐tubulin, Msps and Dpn.
- Larval brains expressing Msps‐GFP under the control of insc‐Gal4 at 16 h ALH were labeled with GFP, Dpn, and Mira.
Data information: In (E, F, I), data are presented as mean ± SD. In (E, F, I), statistical significances were determined by two‐tailed Student's t‐test. Scale bars: 10 µm.
Next, we examined another centriolar protein, Sas‐4, in qNSCs with a primary cellular protrusion labeled by CD8‐GFP driven by grh‐Gal4 at 6 h ALH (Fig 1B; 100%, n = 30). Very similar to Asl, the vast majority of Sas‐4 (Fig 1B; 83.3% n = 30) was located in the apical region and distal to the primary protrusion of wild‐type qNSCs, while 13.3% (n = 30) was observed in the lateral region of the cell body. Only 3.3% of qNSCs (n = 30) contained Sas‐4‐positive centriole(s) at the PIS region of the primary protrusion, suggesting that the centrosomes may be occasionally motile within the cell body. Similar to Asl, in wild‐type qNSCs, the majority of qNSCs contained two Sas‐4‐positive centrioles (73.3%, n = 30), while a minority of qNSCs contained only a single Sas‐4‐positive centriole. Taken together, we conclude that the centriolar proteins are predominantly localized to the apical region of wild‐type qNSCs, distal to their primary cellular extension.
The centrosomes are immature and devoid of PCM proteins in quiescent NSCs from newly hatched larvae
In dividing NSCs, the centrosomes are mature during the G2 phase and are responsible for the assembly of the interphase microtubule aster (Rebollo et al, 2007; Rusan & Peifer, 2007). Given that the majority of qNSCs are arrested in the G2 phase, we wondered whether the centrosomes in qNSCs were mature and had microtubule nucleation activity. To this end, we investigated whether PCM proteins were recruited to the centrosomes in qNSCs. The CDK5RAP2 homologue centrosomin (CNN) is an essential component of PCM and is required for centrosome assembly in dividing cells, including active NSCs (Conduit & Raff, 2010). To ensure that the NSCs we examined were definitely in quiescence but not in a transition to reactivation from slightly older larvae, we analyzed qNSCs from newly hatched larvae (at 0 h ALH). As overexpressed centrosomal proteins may result in the accumulation of these proteins in qNSCs and interfere with the analysis, we examined endogenous CNN in qNSCs using anti‐CNN antibodies. Surprisingly, CNN was completely absent in qNSCs at 0 h ALH larval brains (Fig EV1B left panels; 100%, n = 53). In contrast, at 0 h ALH in mushroom body (MB) NSCs that never enter quiescence, a strong CNN signal was readily observed at the centrosomes (Fig EV1B right panels; 100%, n = 50). Likewise, CNN‐GFP, in which endogenous CNN was tagged by GFP in a Minos‐mediated integration cassette (MiMIC) transposon insertion line (Venken et al, 2011), was also absent in qNSCs at 0 h ALH (100%, n = 29) but strongly expressed in MB NSCs at the same time point (Fig EV1C; 100%, n = 32). At 6 h, ALH CNN became weakly detectable in those qNSCs retaining primary cellular protrusion but with increased cell size (Fig EV1D and E; 35%, n = 40, average diameter 5.4 ± 0.2 μm), while the majority of qNSCs were still negative for CNN (65%, n = 40, average diameter 3.8 ± 2.0 μm). At 0 h ALH, CNN was barely detectable at the centrosomes, 0.006‐fold of that of MB NSCs (Fig EV1B, D and F; n = 40), and was significantly increased at 6 h ALH (Fig EV1B, D and F; 0.09‐fold, n = 99). These observations suggest that although subsequent recruitment of CNN to the centrosome is likely associated with the onset of NSC reactivation, the centrosomes in qNSCs at 0 h ALH are likely immature and lack microtubule nucleation activity.
γ‐tubulin (γ‐tub) is a major microtubule nucleator in dividing cells, such as cycling NSCs, and nondividing cells, such as neurons. In dividing cells, γ‐tub is a component of the γ‐tubulin ring complex (γ‐TURC) robustly localized at the centrosomes. We wondered whether γ‐tub was recruited to the centrosomes of qNSCs. We performed double labeling of γ‐tub and Sas‐4 and found that γ‐tub could barely be detected in 89.1% (n = 55) of qNSCs at 0 h ALH, seemingly colocalizing with Sas‐4 at the apical region, while γ‐tub was strongly localized to the centrosome in MB NSCs at the same time point (Fig EV1G). γ‐tub was undetectable in the remaining 10.9% (n = 55) of qNSCs. At 0 h ALH, the γ‐tub protein levels at the centrosomes in qNSCs were only 0.14‐fold of that in the dividing MB NSCs (Fig EV1H and I; n = 84). At 6 h ALH, the fluorescence intensity of γ‐tub at the centrosomes in qNSCs was increased to 0.34‐fold (Fig EV1H and I; n = 63). Therefore, γ‐tub signals were increased in intensity at the centrosome at 6 h ALH but remained at low levels.
As γ‐tub is also a component of the centrioles, we wondered whether the weak γ‐tub observed in quiescent NSCs at 0 h ALH was due to its localization to the centrioles or the PCM. To this end, we performed super‐resolution spinning disk confocal‐structured illumination microscopy (SDC‐SIM) to image the localization of endogenous γ‐tub in both qNSCs and mushroom body (MB) NSCs at 0 h ALH. We found that in cycling MB NSCs, robust γ‐tub was detected as a “doughnut”‐like pattern surrounding the centrioles labeled by Asl (Fig 1C; n = 20). By contrast, in qNSCs, weak γ‐tub was restricted to the central region, almost completely overlapping with Asl, suggesting that γ‐tub in qNSCs was localized to the centrioles, but not the PCM (Fig 1C; n = 35). In SDC‐SIM, CNN was also observed as a “doughnut”‐shape surrounding Asl in cycling MB NSCs (Fig 1D). By contrast, CNN was undetectable at the centrosomes of qNSCs (Fig 1D, n = 26). Taken together, these data strongly support the immature centrosomes in qNSCs.
No microtubule asters are formed in quiescent NSCs
To further investigate whether the centrosome is the major MTOC in qNSCs, we examined whether a microtubule aster could be detected in qNSCs. In dividing NSCs, an interphase microtubule aster is organized by the centrosome and can be detected by α‐tubulin or β‐tubulin. However, in qNSCs at 0 h ALH, β‐tubulin‐Venus could be detected, but without forming a microtubule aster at the apical region where the centrosome is located (Fig EV1J; 100%, n = 45 in CB). Similarly, at both 6 and 16 h ALH, no microtubule aster at the apical region could be observed by α‐tubulin (Fig EV1K; 100%, n = 37 in CB at 6 h ALH; 100%, n = 21 in CB at 16 h ALH). Next, we examined Jupiter‐GFP (G147), a protein trap line that labeled microtubules and MTOC in dividing NSCs and was expressed under the control of the endogenous jupiter promotor (Morin et al, 2001). At 0 h ALH, Jupiter‐GFP (G147) detected throughout the cytoplasm of qNSCs, including the primary cellular protrusion, did not form any microtubule aster (Fig 1E; 100%, n = 25 in CB). In contrast, a microtubule aster marked by Jupiter‐GFP was clearly observed in MB NSCs at 0 h ALH (Fig 1E; 100%, n = 40). Taken together, these observations indicate that the centrosomes in qNSCs from newly hatched larvae are immature and devoid of PCM proteins. Therefore, acentrosomal microtubule growth, rather than centrosomal microtubule growth, likely plays a major role in microtubule assembly in the cellular extension of qNSCs.
Next, we wondered whether microtubule polymerization in qNSCs is nutrition‐dependent. We used Jupiter‐GFP to label microtubules and raised the larvae at food depleted with amino acids (nutritional restriction/NR) for 24 h. Strikingly, Jupiter‐GFP signal intensity in the entire brain, including in all Dpn‐positive NSCs except for a few cells large in cell size that were presumably MB NSCs, was strongly reduced upon nutritional restriction compared with larval brains raised under fed conditions (Fig 1F; 100%, NR, n = 25 brain lobes [BL]; fed control, n = 28 BL). The overall intensity of Jupiter‐GFP in non‐Mushroom (MB) NSCs in CBs was normalized against that in presumptive MB NSCs where Jupiter‐GFP had the highest expression. The Jupiter‐GFP intensity ratio was 0.78‐fold in larval brains under the fed condition (Fig 1F and G; n = 10 BL) but dropped to 0.12‐fold upon nutritional restriction (Fig 1F and G; n = 14 BL). This observation suggested that the expression of Jupiter‐GFP in qNSCs is dependent on nutrition.
Msps is distributed in the cytoplasm including the primary protrusion in quiescent NSCs
Mini spindles (Msps) is an XMAP215/ch‐TOG family protein and a key microtubule polymerase that promotes microtubule growth in dividing NSCs (Lee et al, 2001; Chen et al, 2016). However, the function of Msps in regulating microtubule assembly is poorly understood in nondividing cells. To test whether Msps was expressed in qNSCs, we examined the localization of Msps in qNSCs at 0 h ALH. In qNSCs with the primary cellular protrusion labeled by CD8‐GFP under the control of grh‐Gal4, we detected the cytoplasmic distribution of Msps throughout the qNSCs, including the primary cellular protrusion (Fig 1H; 100%, n = 36). This Msps signal observed in the wild‐type qNSCs was specific, as Msps was undetectable in msps924 and mspsP18 mutants at 0 h ALH (Fig EV2D). The distribution pattern of Msps in qNSCs at 6 h ALH was similar to that at 0 h ALH but with overall higher levels (Fig 1H). Overall Msps intensity in qNSCs was 0.19‐fold of that in MB NSCs at 0 h ALH (Fig 1I; n = 45) and was increased to 0.26‐fold of that in MB NSCs at 6 h ALH (Fig 1I; n = 81). These observations suggest that Msps is expressed in qNSCs from newly hatched larvae.
Figure EV2. Msps, but not Arl2, is essential for NSC reactivation.
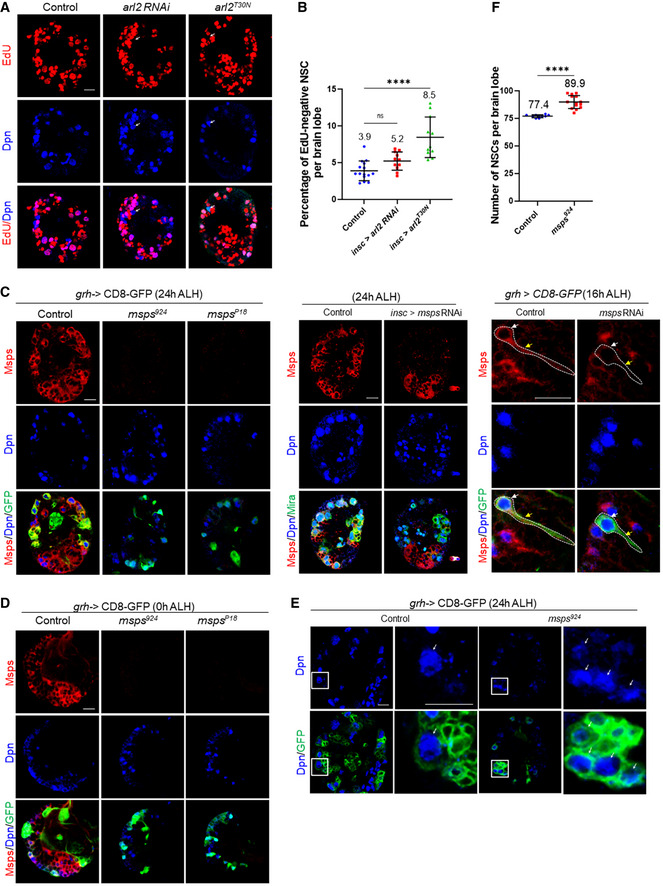
- Larval brains at 24 h ALH from control (insc‐Gal4; UAS‐dicer2 / UAS‐β‐Gal RNAi), arl2 RNAi (VDRC#110627); UAS‐dicer2 and UAS‐arl2T30N under the control of insc‐Gal4 were analyzed for EdU incorporation. NSCs were marked by Dpn and Mira. Arrows indicate EdU‐ negative NSCs.
- Quantification of EdU‐negative NSCs per brain lobe for genotypes in (A). n = 15 BL for control; n = 11 BL for arl2 RNAi; n = 11 BL for UAS‐arl2T30N . ****P < 0.0001; P = 0.1547 (ns).
- Larval brains from various genotypes were labeled with Msps, Dpn, and GFP at the indicated time points. Left panels, wild‐type, msps924 , and mspsP18 , all expressing CD8‐GFP under the control of grh‐Gal4. Middle panels, control (UAS‐β‐Gal RNAi) and msps RNAi expressing CD8‐GFP under the control of insc‐Gal4. Right panels, control (UAS‐β‐Gal RNAi) and msps RNAi under grh‐Gal4. Note that not all qNSCs were labeled by grh>CD8‐GFP at early larval stages. White arrows point at the cell body and yellow arrows indicate the primary protrusion of the qNSC.
- Larval brains at 0 h ALH from wild‐type, msps924 , and mspsP18 expressing grh>CD8‐GFP were labeled with Msps, Dpn, and GFP.
- Larval brains at 24 h ALH from control (grh>CD8‐GFP) and msps924 expressing grh>CD8‐GFP were labeled with Dpn and GFP. Single NSC lineage in the box was magnified in the panel on the right. Arrows indicate NSCs.
- Quantification of the total NSC number from genotypes in (E). n = 10 BL for control; n = 14 BL for msps924 . ****P < 0.0001.
Data information: in (B, E), data are presented as mean ± SD. In (B), statistical significance was determined by one‐way ANOVA with multiple comparisons. In (E), statistical significance was determined by two‐tailed Student's t‐test. Scale bars: 10 µm.
Microtubules in the primary protrusion of qNSCs are predominantly orientated plus‐end‐out
Vertebrate neurons extend neurites with distinct microtubule orientation: axons have a uniform arrangement of plus‐end‐out microtubules, and dendrites have equal numbers of plus‐ and minus‐end‐out microtubules. In Drosophila neurons, axons have a similar plus‐end‐out microtubule orientation, but microtubules in dendrites are primarily minus‐end‐out (Stone et al, 2008). We sought to investigate microtubule orientation in the primary protrusion of qNSCs. First, we took advantage of two well‐established microtubule polarity markers in Drosophila tissues including oocyte, epithelium, neurons, and muscle (Clark et al, 1997). Kin‐β‐Galactosidase (Kin‐β‐Gal) marks plus‐end microtubules, and Nod‐β‐Gal marks minus‐end microtubules by fusing the coiled‐coil domain of a plus‐end Kinesin 1 motor protein or the motor domain of a minus‐end kinesin‐like Nod to β‐gal (Clark et al, 1997). Since Kin‐β‐Gal was lethal when driven by insc‐Gal4, we used tubulin‐Gal80ts to control the expression of Kin‐β‐Gal, and Msps was used to label the primary protrusion of qNSCs. The embryos were kept at 18°C until larval hatching followed by a shift to 29°C for 16 h. In some qNSCs, Kin‐β‐Gal was undetectable (Fig 2A; 57%, n = 77), likely due to its low expression level. In the remaining Dpn‐positive qNSCs in which Kin‐β‐Gal could be observed, it was localized mostly at the tip (Fig 2A; 72.7%, n = 33) or in the middle of the primary cellular extension (27.3%, n = 33) of qNSCs in the VNC. However, Kin‐β‐Gal was never observed in the apical region of qNSCs. Although Kin‐β‐Gal was mostly absent in qNSCs at 0 h ALH, presumably due to a low level of expression, in qNSCs that it could be detected Kin‐β‐Gal was localized at the tip or in the medial region of the primary protrusion (Appendix Fig S1A; 90.6% within primary protrusion, 9.4% in the cell body, n = 32), suggesting that microtubule orientation remains plus‐end‐out in qNSCs at different time points.
Figure 2. Microtubules in the cellular extension of qNSCs are predominantly plus‐end‐out orientated.
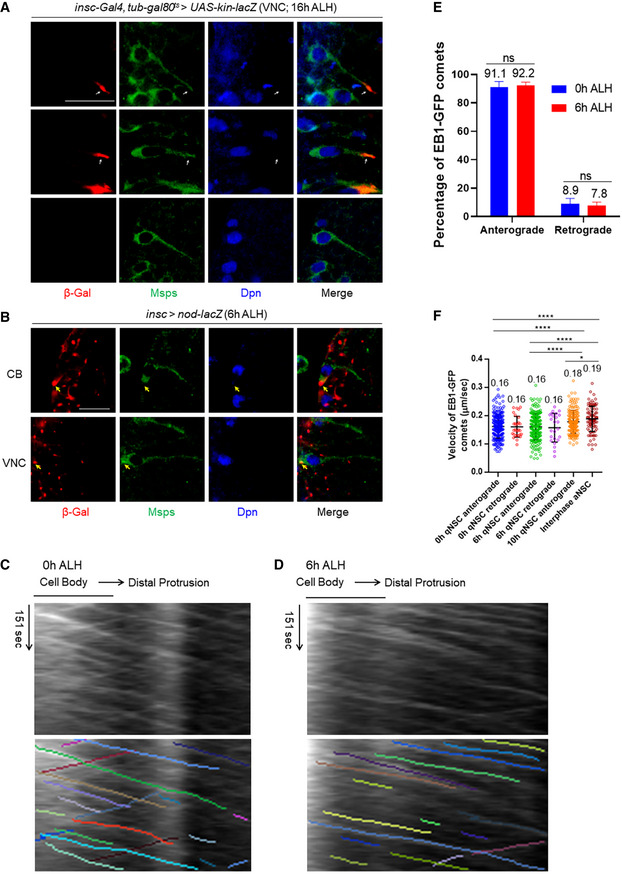
- Larval brains at 16 h ALH, in which kin‐lacZ was expressed under the control of insc‐Gal4, tub‐Gal80ts, were labeled with β‐Gal, Msps, and Dpn. The primary protrusion of qNSCs was marked by Msps. Quiescent NSCs at the ventral nerve cord (VNC) are shown. Arrows indicate the localization of Kin‐lacZ in qNSCs.
- Larval brains at 6 h ALH from insc‐Gal4; UAS‐nod‐lacZ were labeled with β‐Gal, Msps, and Dpn. Quiescent NSCs at both CB and VNC are shown. Arrows indicate the localization of Nod‐lacZ in qNSCs.
- Representative kymographs decorated with and without colored lines depicting movements of EB1‐GFP comets in the primary protrusion of qNSCs at 0 h ALH.
- Representative kymographs decorated with and without colored lines tracking movements of EB1‐GFP comets in the primary protrusion of qNSCs at 6 h ALH.
- Quantification graph of the percentage of anterograde and retrograde movements of EB1‐GFP comets in the primary protrusion of qNSCs at 0 h ALH and 6 h ALH. n = 28 at 0 h ALH; n = 64 at 6 h ALH. Three biological replicates per time point. P = 0.9096 (ns).
- Quantification graph of the velocity of EB1‐GFP comet movement in the protrusion of qNSCs at 0 h ALH, 6 h ALH and 10 h ALH, as well as in interphase NSCs (aNSCs) at 72 h ALH. n = 250 for 0 h qNSCs (anterograde); n = 30 for 0 h qNSCs (retrograde); n = 211 for 6 h qNSCs (anterograde); n = 24 for 6 h qNSCs (retrograde); n = 171 for 10 h qNSCs (anterograde); n = 103 for interphase NSCs (anterograde). ****P < 0.0001; *P = 0.0285.
Data information: In (C, D), the horizontal arrow indicates the anterograde movement direction from the cell body to the tip of the primary protrusion in qNSCs. In (E, F), data are presented as mean ± SD. In (E), statistical significance was determined by two‐way ANOVA with multiple comparisons. In (F), statistical significance was determined by one‐way ANOVA with multiple comparisons. Scale bars: 10 µm.
Next, we examined the microtubule minus‐end marker Nod‐β‐Gal in qNSCs with primary cellular extension marked by Msps. Remarkably, in both the CB and VNC at 6 h ALH (Fig 2B; CB: 100%, n = 42; VNC: 100%, n = 37), Nod‐β‐Gal was predominantly localized at the apical region of qNSCs, colocalizing with centrioles marked by Asl (Appendix Fig S1C; 100%, n = 28). At 0 h ALH, the localization of Nod‐β‐Gal was predominantly localized at the apical region of qNSCs in both the CB (Appendix Fig S1B; apical, 94.3%; PIS region, 5.7%, n = 35) and VNC (Appendix Fig S1B; apical, 100%, n = 25). Likewise, at 16 h ALH, Nod‐β‐Gal was predominantly observed at the apical region of qNSCs (Appendix Fig S1D, 100%, n = 24). Therefore, Kin‐β‐Gal is distributed at the basal side toward the tip of the primary protrusion, while Nod‐β‐Gal is at the apical side of qNSCs away from the primary protrusion, suggesting that microtubules in the cellular extension of qNSCs are mostly oriented with plus‐end‐out distal to the cell body but toward the tip of the cellular extension.
To confirm the plus‐end‐out microtubule orientation of cellular protrusion of qNSCs, we proceeded to analyze End binding 1 (EB1), a plus‐end tracking protein (+TIP) that binds to microtubule plus ends during microtubule growth (Vaughan, 2005). EB1‐GFP was expressed under the control of grh‐Gal4 to drive NSC‐specific expression at 6 h ALH, and dynamics of EB1‐GFP comets were captured by live imaging followed by the analysis of kymograph generated by ImageJ in KymoButler (Jakobs et al, 2019). We termed the movement of EB1‐GFP comets from the soma toward the basal side of qNSCs as anterograde movement and the opposite direction of movement as the retrograde movement. Remarkably, at 0 h ALH, 91.1% (n = 28) of EB1‐GFP comets in wild‐type qNSCs displayed anterograde movement, while the remaining 8.9% (n = 28) exhibited retrograde movement (Fig 2C and E, Movie EV1). The speed of anterograde and retrograde movements of EB1‐GFP comets was essentially the same (Fig 2F; average velocity both at 0.16 μm/s). These observations indicate that microtubules in the cellular extension of qNSCs are predominantly oriented plus‐end‐out distal to the cell body.
We wondered whether microtubule growth in the primary protrusion of qNSCs at a slightly later stage remained the same as that at 0 h ALH. At 6 h ALH, 92.2% (n = 64) of EB1‐GFP comets in wild‐type qNSCs displayed anterograde movement, while the remaining 7.8% (n = 64) exhibited retrograde movement (Fig 2D and E; Movie EV2). This suggested that the predominant microtubule orientation in the primary protrusion of qNSCs at 6 h ALH is still plus‐end‐out, similar to that of 0 h ALH. The speed between anterograde and retrograde movements of EB1‐GFP comets at 6 h ALH was indistinguishable (Fig 2F; Ave. velocity at both 0.16 μm/s). At 10 h ALH, the velocity of anterograde EB1‐GFP comets increased to 0.18 µm/s, even closer to that of dividing NSCs (Fig 2F; Movie EV3). The velocity of EB1‐GFP comets in the primary protrusion of qNSCs at both 0 h ALH and 6 h ALH was slightly slower but very close to that of actively dividing NSCs (Fig 2F; 0.19 µm/s in active NSCs; (Chen et al, 2016)). Taken together, microtubules in the primary protrusion of qNSCs are predominantly plus‐end‐out toward the tip of the protrusion, and microtubule assembly in the primary protrusion of qNSCs is robust.
Because axons at presynaptic terminals oriented their microtubules plus‐end‐out, we wondered whether the primary protrusion of qNSCs resembles the structure of axons and expresses synaptic markers. nc82 antibody (anti‐BRP) (Wagh et al, 2006), a widely used presynaptic marker, and Synaptotagmin (Syt), a synaptic vesicle‐specific integral membrane protein found at synaptic contact sites (Littleton et al, 1993), were both observed at the neuropil, but absent in the primary protrusion of qNSCs (Appendix Fig S1E; 100%, n = 27 and Appendix Fig S1F; 100%, n = 32). These observations suggest that despite similar plus‐end‐out microtubule orientation, the primary protrusion of qNSCs is functionally distinct from axons at the presynaptic terminals.
The centrosomes are nonessential for NSC reactivation
Given that microtubule growth is unexpectedly robust in the primary protrusion of qNSCs, we tested the potential function of known microtubule regulators of dividing NSCs. We first tested ADP ribosylation factor‐like 2 (Arl2), a master regulator of microtubule assembly in dividing NSCs (Chen et al, 2016). We fed the larvae with EdU‐containing food for 4 h so that all cycling NSCs were incorporated with EdU as described previously (Li et al, 2017). Surprisingly, at 24 h ALH, arl2 knockdown (VDRC110627) driven by insc‐Gal4 had no obvious defects in NSC reactivation (Fig EV2A and B; EdU‐negative NSCs in control, 3.9% of NSCs, n = 15 BL; in arl2 RNAi, 5.2%, n = 11 BL). Overexpression of arl2T30N , a dominant‐negative form of arl2, driven by insc‐Gal4, only caused a very mild increase in EdU‐negative NSCs from 3.9% (Fig EV2A and B, control, n = 15 BL) to 8.5% (arl2T30N , n = 11 BL). In addition, depletion of centrosomes by ana2 strong hypomorphic alleles (Wang et al, 2011) also had no obvious impact on NSC reactivation (wild‐type, 15.0% primary protrusion, n = 5 BL; ana2719 / 169, 15.2%, n = 5 BL). Therefore, Arl2 or Ana2 is nonessential for NSC reactivation. Most likely, Arl2‐ and Ana2‐dependent centrosomal microtubule growth is nonessential for NSC reactivation.
Next, we examined two independent RNAi lines targeting γ‐tub23C, a major centrosomal (PCM) protein that is required for microtubule nucleation and anchoring in dividing NSCs. Under the control of insc‐Gal4 at 24 h ALH, 5.3% of NSCs in γ‐tub23C RNAi I and 5.4% of NSCs in γ‐tub23C RNAi II did not incorporate EdU (Fig EV3J and K; n = 11 BL and n = 14 BL, respectively), which was indistinguishable from the wild‐type control (Fig EV3J and K; 4.9%, n = 12 BL). These two γ‐tub23C RNAi lines worked effectively, as in 75.6% of γ‐tub23C RNAi I NSCs and 62.5% of γ‐tub23C RNAi II NSCs, γ‐tub protein levels were lost or dramatically reduced at the centrosomes marked by Msps (Fig EV3L; n = 180 and n = 136, respectively), in contrast to a strong expression of γ‐tub at the centrosomes in the majority of the control NSCs (Fig EV3L; 96.4%, n = 139). Therefore, the centrosomes are nonessential for NSC reactivation.
Figure EV3. Microtubule assembly in the primary protrusion of qNSCs is centrosome‐independent.
-
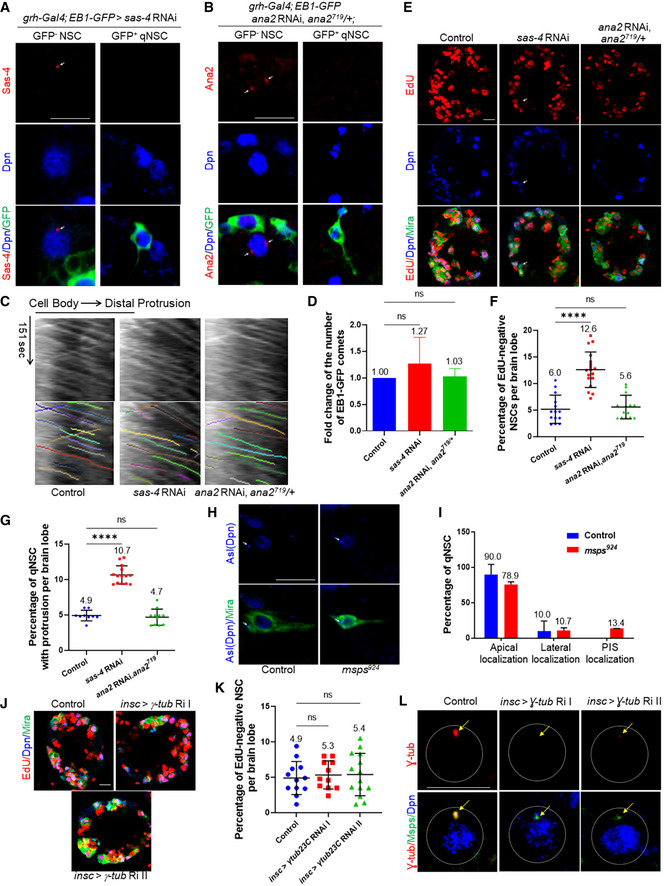
A, B(A) Larval brains at 6 h ALH from sas‐4 RNAi with grh‐Gal4; UAS‐EB1‐GFP were stained with Sas‐4, Dpn, and GFP. Primary protrusion of qNSCs was marked by GFP. (B) Larval brains at 6 h ALH ana2 RNAi ana2719 /+ with grh‐Gal4; UAS‐EB1‐GFP were stained with Ana2, Dpn, and GFP. Primary protrusion of qNSCs was marked by GFP. Efficient knockdown of sas4 or ana2 in GFP‐positive qNSCs with primary protrusion is shown in (A, B). Sas4 and Ana2 staining were present in some of the GFP‐negative NSCs, which were shown as positive controls in (A, B). Arrows indicate the centrosome.
-
CKymograph of EB‐GFP comet movement in the primary protrusion of qNSCs from control (UAS‐β‐Gal RNAi), sas‐4 RNAi (VDRC#106051), and ana2 RNAi; ana2719 /+ with grh‐Gal4; UAS‐EB1‐GFP at 6 h ALH. The horizontal arrow indicates anterograde movement direction from the cell body to the tip of the primary protrusion in qNSCs. Kymographs with and without colored lines were shown.
-
DQuantification graph of the fold change of the number of EB1‐GFP comets in the primary protrusion of qNSCs from genotypes in (C). n = 2 individual experiments per genotype. Control vs sas‐4 RNAi, P = 0.6174 (ns); control vs ana2 RNAi; ana2719 /+, P = 0.9941 (ns).
-
ELarval brains at 24 h ALH from control (grh‐Gal4; UAS‐dicer2/UAS‐β‐Gal RNAi) and sas‐4 RNAi (VDRC#106051) and ana2 RNAi; ana2719 /+ controlled under grh‐Gal4 were analyzed for EdU incorporation. NSCs were marked by Dpn and Mira. Arrows point at EdU‐negative NSCs.
-
FQuantification graph of EdU‐negative NSCs per brain lobe for genotypes in (E). ****P < 0.0001; P = 0.9106 (ns). Control, 6.0%, n = 14 BL; sas‐4 RNAi, 12.6%, n = 18 BL. ana2 RNAi, ana2719 /+, 5.6%, n = 14 BL.
-
GQuantification graph of the percentage of qNSCs with primary protrusion per brain lobe for genotypes in (E). Control, 4.9%, n = 9; sas‐4 RNAi, 10.7%, n = 14 BL; ana2 RNAi, ana2719 /+, 4.7%, n = 11 BL. ****P < 0.0001; P = 0.8681 (ns).
-
HLarval brains at 24 h ALH from control and msps924 expressing grh>CD8‐GFP were labeled with Asl, Dpn, and GFP. Arrows indicate the centrosome.
-
IQuantification graph of the percentage of qNSCs with Asl localized to apical, lateral, and PIS region of the qNSCs for the genotypes in (H). n = 10 NSCs for control; n = 10 NSCs for sas‐4 RNAi; n = 16 NSCs for ana2 RNAi, ana2719 /+.
-
JLarval brains at 24 h ALH from control (insc‐Gal4; UAS‐dicer2/UAS‐β‐Gal RNAi) and γ‐tub23C RNAi I (BDSC#42799) and γ‐tub23C RNAi II (BDSC#31204) controlled under insc‐Gal4 were analyzed for EdU incorporation. NSCs were marked by Dpn and Mira.
-
KQuantification graph of EdU‐negative NSCs per brain lobe for genotypes in (J). n = 12 BL for control; n = 11 BL for γ‐tub23C RNAi I; n = 14 BL for γ‐tub23C RNAi II. Control vs γ‐tub23C RNAi I, P = 0.8825 (ns); control vs γ‐tub23C RNAi II, P = 0.8379 (ns).
-
LLarval brains at 24 h ALH for genotypes in (J) were stained with γ‐tub, Msps, and Dpn. Arrows indicate the centrosome.
Data information: in (D, F, G, I, K), data are presented as mean ± SD. In (D, F, G, K), statistical significance was determined by one‐way ANOVA with multiple comparisons. In (I), statistical significance was determined by two‐way ANOVA with multiple comparisons. Scale bars: 10 µm.
XMAP215/Msps is critical for the reactivation of NSCs
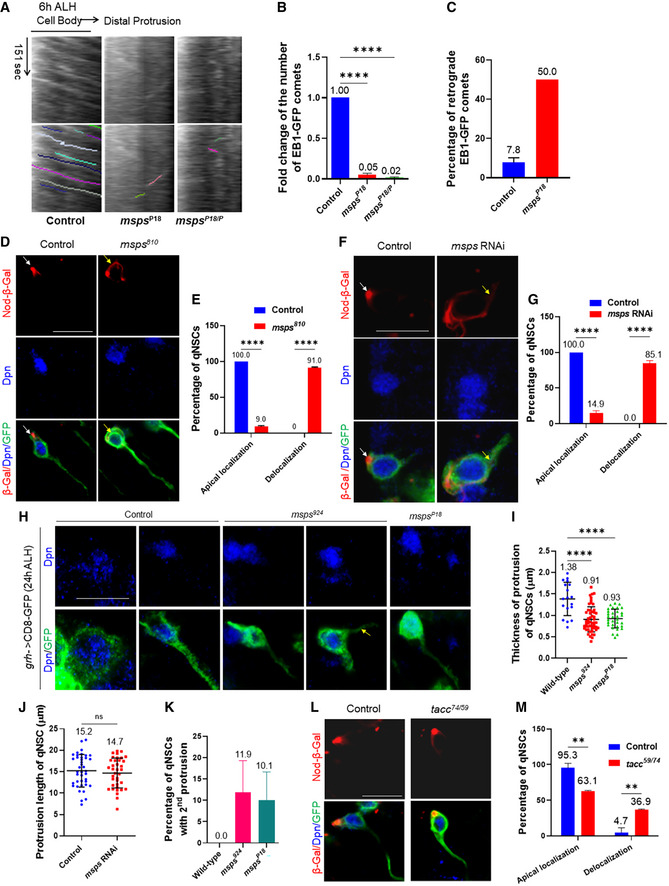
Because Msps is a microtubule polymerase that is expressed in qNSCs (Fig 1H), we investigated whether Msps is required for NSC reactivation. At 24 h ALH, the vast majority of wild‐type NSCs were reactivated and incorporated with EdU, while only 6.2% of NSCs were quiescent and negative for EdU (Fig 3A and B; n = 13 BL). In contrast, the percentage of qNSCs that were EdU‐negative was dramatically increased to 45.8% upon msps knockdown driven by insc‐Gal4 (Fig 3A and B; n = 13 BL), suggesting a significant delay of NSC reactivation. Next, we examined EdU incorporation of four loss‐of‐function alleles of msps, including a protein null allele msps810 , a strong hypomorphic allele msps924 (Fengwei Yu, unpublished data), and two previously reported hypomorphic msps alleles (Cullen et al, 1999; Chen et al, 2016). Remarkably, at 24 h ALH, 86.2% (Fig 3C and D; n = 13 BL) of NSCs in msps810 failed to incorporate EdU, compared with only 12.5% (Fig 3C and D; n = 13 BL) of NSCs without EdU incorporation in wild type. This observation suggested that most NSCs in msps810 failed to exit quiescence. Similarly, all three other alleles of msps also displayed a prominent NSC reactivation phenotype (Fig 3C and D; 59.2%, n = 17 BL in msps924 ; 46.9%, n = 14 BL in msps P18; and 64.7%, n = 6 BL in msps P). To confirm the reactivation defects, we measured the cell diameter at 24 h ALH, as qNSCs have a cell diameter of ∼ 4 μm, while reactivating NSCs undergo their first cell division when they reach the cell diameter of ∼ 7 μm (Chell & Brand, 2010). At 24 h ALH, the average cell diameters in msps924 NSCs and mspsP were 4.9 and 4.7 μm, respectively, significantly smaller than 7.6 μm in wild‐type NSCs (Fig 3C and E). Since Msps is required for Mira localization at the cortex in NSCs (Chen et al, 2016) and Mira in qNSCs with msps depletion was cytoplasmic and could no longer label the primary protrusion clearly, we used CD8‐GFP controlled by grh‐Gal4 to mark the primary protrusion in msps mutants. At 24 h ALH, there were more qNSCs with primary protrusion observed upon msps depletion (Fig 3F; msps924 : 24.5%, n = 6 BL; msps P18: 29.0%, n = 4 BL) compared with the control (4.3%, n = 5 BL). The NSC reactivation phenotype observed in msps924 mutants was unlikely primarily due to a failure in mitosis, as even at 24 h ALH, ectopic NSCs were observed in msps924 (Fig EV2E and F; 89.9 ± 5.9, n = 14 BL), compared with the control (Fig EV2E and F; 77.1 ± 1.3, n = 10 BL). This ectopic NSC phenotype was presumably due to symmetric division of msps924 , a phenotype described for mspsP18 at late larval stages (Chen et al, 2016), since 40.8% of msps924 could still be reactivated (Fig 3C and D). Msps was undetectable in msps924 and mspsP18 NSCs at 24 h ALH and strongly reduced upon msps RNAi knockdown (Fig EV2C), suggesting that Msps was sufficiently depleted under these conditions. Moreover, the EdU incorporation defects in msps810 were nearly fully restored by the expression of wild‐type genomic msps (Fig 3C and D; n = 12 BL). These observations indicate that Msps, but not Arl2, are essential for NSC reactivation and that Msps functions intrinsically in NSCs to promote their reactivation.
Figure 3. Msps is essential for NSC reactivation.
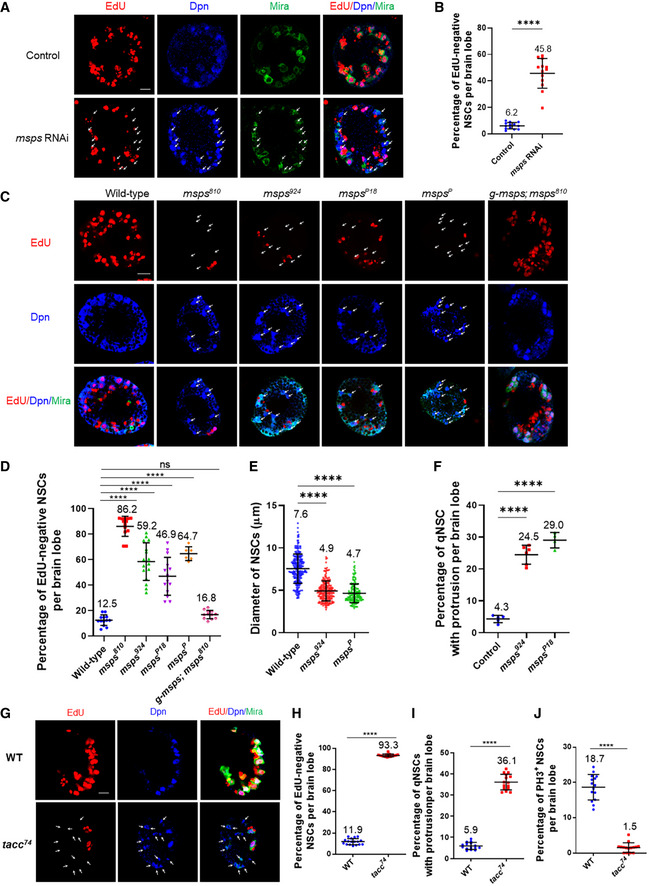
- Larval brains at 24 h ALH from control (insc‐Gal4; UAS‐dicer2/UAS‐β‐Gal RNAi) and msps RNAi (VDRC#21982) controlled under insc‐Gal4 were analyzed for EdU incorporation. NSCs were marked by Dpn and Mira.
- Quantification graph of EdU‐negative NSCs per brain lobe for genotypes in (A). n = 13 BL for both control and msps RNAi. ****P < 0.0001.
- Larval brains at 24 h ALH from wild‐type and various msps loss‐of‐function alleles and msps810 with a genomic rescue construct (g‐msps) were analyzed for EdU incorporation. NSCs were marked by Dpn and Mira.
- Quantification graph of EdU‐negative NSCs per brain lobe for genotypes in (C). n = 13 BL for control; n = 13 BL for msps810 ; n = 17 BL for msps924 ; n = 14 BL for mspsP18 ; n = 6 BL for mspsP ; n = 12 BL for g‐msps; msps924 . ****P < 0.0001; P = 0.7502 (ns).
- Quantification graph of the diameter of the cell body in NSCs at 24 h ALH from various genotypes. n = 238 NSCs for control; n = 219 NSC for msps924 ; n = 170 NSCs for mspsP . ****P < 0.0001.
- Quantification graph of the percentage of qNSCs with a primary protrusion in wild‐type, msps924 , and mspsP18 larval brains. The protrusion was labeled by grh>CD8‐GFP. n = 5 BL for control; n = 6 BL for msps924 ; n = 4 BL for mspsP . ****P < 0.0001.
- Larval brains at 24 h ALH from wild‐type and tacc loss‐of‐function tacc74 were examined for EdU incorporation. NSCs were marked by Dpn and Mira.
- Quantification graph of EdU‐negative NSCs per brain lobe for genotypes in (G). n = 17 BL for control; n = 15 BL for tacc74 . ****P < 0.0001.
- Quantification graph of qNSCs retaining primary protrusion per brain lobe for genotypes in (G). n = 15 BL for both control and tacc74 . ****P < 0.0001.
- Quantification graph of NSCs that are positive for mitotic marker PH3 per brain lobe for genotypes in (G). n = 15 BL for both control and tacc74 . ****P < 0.0001.
Data information: Arrows indicated EdU‐negative NSCs in A, C, and G. In (B, D–F, H–J), data are presented as mean ± SD. In (B, H–J), statistical significance was determined by two‐tailed Student's t‐test. In (D–F), statistical significance was determined by one‐way ANOVA with multiple comparisons. Scale bars: 10 µm.
To exclude the possibility that NSC reactivation defects in msps loss was due to embryonic defects, we took advantage of Gal80ts to temporarily knock down msps in larval stages. Briefly, we incubated eggs at 18°C for 44 h to turn off msps knockdown during embryonic stages and shifted newly hatched larvae to 29°C for 24 h to induce msps knockdown. We still detected strong NSC reactivation defects, as 32.4% of NSCs failed to incorporate EdU at 24 h ALH (Fig EV4K and L; n = 15 BL), which was dramatically higher than 9.0% in control (Fig EV4K and L; n = 13 BL). This result indicates that msps deletion during larval stages is sufficient to result in NSC reactivation defects.
Figure EV4. E‐cad delocalization in msps‐depleted qNSCs.
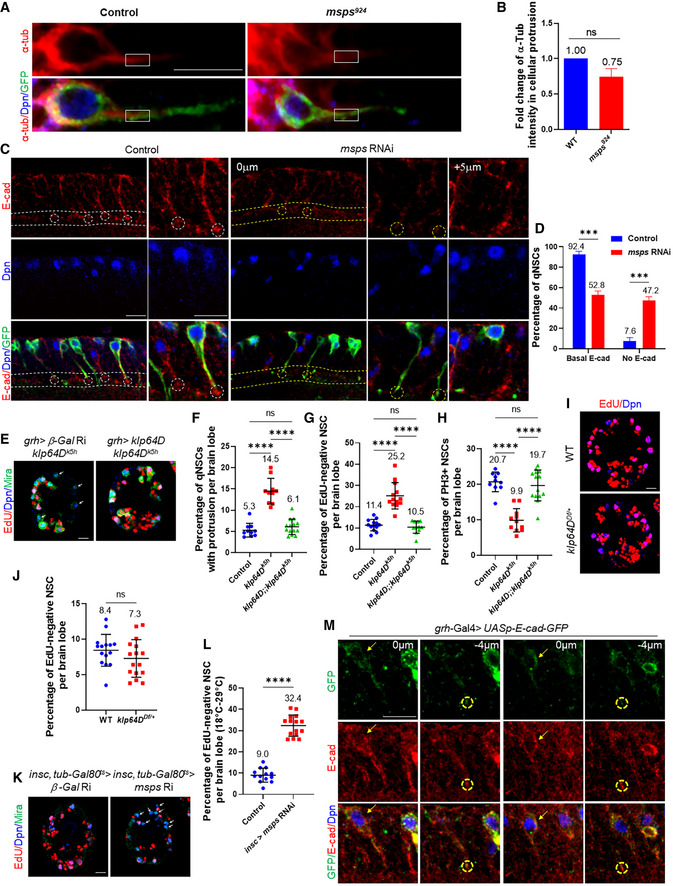
- Larval brains at 24 h ALH from control (grh>CD8‐GFP) and msps924 expressing grh>CD8‐GFP were analyzed for α‐tubulin (α‐tub), and NSCs were labeled with Dpn and GFP. Boxes indicate the area that α‐tub intensity was measured.
- Quantification graph of the α‐tub intensity for the genotypes in (A). n = 39 NSC for control; n = 37 NSC for msps924 . Two biological replicates per each genotype. P = 0.1000.
- Larval VNCs at 16 h ALH from the control (grh‐Gal4 UAS‐CD8‐GFP; UAS‐Dicer2 / UAS‐β‐Gal RNAi) and msps RNAi under the control of with grh‐Gal4 UAS‐CD8‐GFP; UAS‐Dicer2 were labeled with E‐cadherin, Dpn, and GFP. NSC‐neuropil contact was marked by dashed lines, and NSC‐neuropil contact points were circled.
- Quantification of E‐cadherin basal localization at NSC‐neuropil contact sites in qNSCs from genotypes in (C). “No E‐cad” means absent or strongly reduced E‐cad observed at the tip of the protrusion in qNSCs. n = 39 NSC for control; n = 44 NSC for msps RNAi. Two biological replicates per genotype. ***P = 0.0008.
- Larval brains at 24 h ALH from mutant control (grh‐Gal4; UAS‐β‐Gal RNAi; klp64Dk5h ) and rescued animals (grh‐Gal4; UAS‐klp64D; klp64Dk5h ) were analyzed for EdU incorporation. NSCs were labeled with EdU, Dpn, and Mira. The number of EdU‐negative NSCs was reduced to 10.5% in rescued animals (n = 11 BL), which was significantly lower than 25.2% in klp64Dk5h (n = 13 BL), and indistinguishable from the wild‐type control (11.4%, n = 13 BL). EdU‐negative NSCs are indicated by arrows.
- Quantification graph displaying NSCs remaining primary protrusion per brain lobe for genotypes in (E). ****P < 0.0001; P = 0.7542 (ns). Only 6.1% of (n = 14 BL) NSC remained cellular protrusion in the rescued animals, which was significantly reduced in contrast to 14.5% in klp64Dk5h (n = 10 BL), and similar to the wild‐type control (5.3%, n = 10 BL).
- Quantification graph showing NSCs negative for EdU incorporation for genotypes in (E). n = 13 BL for control; n = 13 BL for klp64Dk5h ; n = 11 BL for UAS‐klp64D; klp64Dk5h . ****P < 0.0001; P = 0.9346 (ns).
- Quantification graph depicting NSCs positive for PH3 for genotypes in (E). ****P < 0.0001; P = 0.8768 (ns). The number of PH3‐positive mitotic NSCs in rescued animals (19.7%, n = 14 BL) were increased compared with klp64Dk5h (9.9%, n = 11 BL). Wild‐type control, 20.7%, n = 10 BL.
- Larval brains at 24 h ALH from wild‐type and hemizygous animals klp64DDf /+ (Df(3L)BSC371; BDSC# 24395) were examined for EdU incorporation. NSCs were labeled with EdU and Dpn. Only 7.3% of (n = 16 BL) hemizygous klp64DDf /+ NSCs did not incorporate EdU, which was indistinguishable from 8.4% in wild‐type control (n = 15 BL).
- Quantification graph showing the percentage of EdU‐negative NSCs per brain lobe for genotypes in (I). n = 15 BL for control; n = 16 BL for klp64DDf /+. P = 0.2042 (ns).
- Larval brains at 24 h ALH from control (insc‐Gal4, tub‐Gal80ts/UAS‐β‐Gal RNAi;) and msps RNAi driven by insc‐Gal4, tub‐Gal80ts were analyzed for EdU incorporation. NSCs were labeled with EdU, Dpn, and Mira. EdU‐negative NSCs are indicated by arrows.
- Quantification graph displaying the percentage of NSCs that fail to incorporate EdU per brain lobe for genotypes in (K). n = 13 BL for control; n = 15 BL for msps RNAi. ****P < 0.0001.
- Larval brains at 16 h ALH from grh‐Gal4>UASp‐E‐cad‐GFP were analyzed for GFP and E‐cad. NSCs were labeled by Dpn. E‐cad at the protrusion tip is circled. The cell body of qNSCs are pointed by arrows.
Data information: in (B, D, F–H, J, L), data are presented as mean ± SD. In (B, D, J, L), statistical significance was determined by two‐tailed Student's t‐test. In (F–H), statistical significance was determined by one‐way ANOVA with multiple comparisons. Scale bars: 10 µm.
Since D‐TACC (transforming acidic coiled‐coil protein) interacts with Msps and is known to regulate microtubule growth in dividing cells (Lee et al, 2001), we analyzed the role of D‐TACC in regulating reactivation and microtubule orientation in qNSCs. d‐tacc loss‐of‐function allele displayed significant delay of NSC reactivation (Fig 3G–J). 93.3% (Fig 3G and H; n = 15 BL) of qNSCs in tacc74 , a null or strong hypomorphic tacc allele with most of the tacc coding region deleted via CRISPR/Cas9‐mediated gene editing (Tang et al, 2020), failed to incorporate EdU, compared with the control (Fig 3G and H; 11.9%, n = 17 BL). Further, significantly more qNSCs from d‐tacc74 (36.1%, n = 15 BL) retained the primary protrusion, compared with the control (Fig 3I; 5.9%, n = 15 BL). Moreover, mitotic index was also reduced upon d‐tacc depletion (1.5%, n = 15 BL in d‐tacc74 ), compared with the control (Fig 3J; 18.7%, n = 15 BL). These data indicate that D‐TACC, like Msps, is essential for NSC reactivation.
Msps is critical for acentrosomal microtubule assembly and orientation in the primary protrusion of qNSCs
We investigated whether Msps was important for microtubule growth and orientation in the primary protrusion of qNSCs. First, we analyzed microtubule growth by tracking the movement of EB1‐GFP comets in the primary protrusion of qNSCs upon msps depletion. At 6 h ALH, EB1‐GFP comets were almost completely lost in the primary protrusion of qNSCs from a hypomorphic allele mspsP18 and a trans‐heterozygous mutant mspsP18 / P (Fig 4A and B, Movies EV4 and EV5; mspsP18 , 0.05‐fold, n = 18; mspsP18 / P, 0.02‐fold, n = 21, compared with control, 1, n = 26). This result indicates that Msps is critical for microtubule polymerization in the primary protrusion of qNSCs. Next, we examined microtubule orientation in msps‐depleted qNSCs. We performed live imaging at 6 h ALH on 38 and 41 qNSCs from control and mspsP18 , respectively, and quantified the percentage of retrograde EB1‐GFP comets. Remarkably, 50% of EB1‐GFP comets were retrograde in mspsP18 qNSCs, compared with 7.8% in the control (Fig 4C), suggesting that plus‐end‐out microtubule orientation was disrupted in msps‐depleted qNSCs. In addition, we examined Nod‐β‐Gal localization in qNSCs in msps810 at 24 h ALH. In control qNSCs labeled with Dpn and grh‐Gal4 UAS‐CD8‐GFP, Nod‐β‐Gal was concentrated at the apical region of the primary protrusion (Fig 4D and E; n = 55). In contrast, in 91.0% of qNSCs in msps810 , Nod‐β‐Gal was delocalized from the apical region and distributed around the cell body (Fig 4D and E; n = 45). Asterless‐positive centrioles were still mostly localized at the apical region of msps924 qNSCs (Fig EV3H and I; 78.9%, n = 51), similar to the wild‐type control (Fig EV3H and I; 90.0%, n = 17), suggesting that the delocalization of nod‐ β‐Gal in msps924 mutant qNSCs was not due to mis‐positioning of the centrioles, but likely due to microtubule mis‐orientation. Moreover, in 85.1% of qNSCs upon msps RNAi knockdown, Nod‐β‐Gal was delocalized from the apical region and distributed around the cell body, even observed at the primary protrusion (Fig 4F and G; n = 68; 0% in control, n = 60). Likewise, Nod‐β‐Gal was significantly delocalized in qNSCs from d‐tacc59 / 74, a trans‐heterozygous mutant between d‐tacc74 and d‐tacc59 , two deletion mutants of tacc (Fig 4L and M; 36.9%, n = 65), suggesting that D‐TACC might also regulate microtubule orientation in qNSCs. Taken together, our data indicate that Msps, and likely D‐TACC, ensure plus‐end‐out microtubule orientation in qNSCs.
Figure 4. Msps regulates microtubule assembly in the primary protrusion of qNSCs.
- Kymograph of EB‐GFP comet movement in the primary protrusion of qNSCs from the control, mspsP18 and mspsP18 / P with EB1‐GFP expressed under grh‐Gal4 at 6 h ALH. The horizontal arrow indicates the anterograde movement direction from the cell body to the tip of the primary protrusion in qNSCs. Both raw kymograph and kymograph with colored lines were shown.
- Quantification graph of fold changes in the number of EB1‐GFP comets in the primary protrusion of qNSCs 6 h ALH from various genotypes compared with the control in (A). n = 26 NSCs for control; n = 18 NSCs for mspsP18 ; n = 21 NSCs for mspsP18 / P. ****P < 0.0001.
- Quantification graph of the percentage of retrograde EB1‐GFP comets in the primary protrusion of qNSCs from the control, mspsP18 with EB1‐GFP driven by grh‐Gal4 at 6 h ALH. As EB1‐GFP comets were almost lost in mspsP18 , we were unable to capture adequate EB1‐GFP comets for each individual brain to calculate the standard deviation. 38 and 41 qNSCs were analyzed in control and mspsP18 , respectively. In control qNSCs, among total 383 EB1‐GFP comets, 353 were anterograde and 30 were retrograde movements. In mspsP18 qNSCs, we only found 12 EB1‐GFP comets with six anterograde and six retrograde movements.
- Larval brains at 24 h ALH from control (grh‐Gal4 UAS‐CD8‐GFP + UAS‐nod‐lacZ) and msps810,UAS‐nod‐lacZ under the control of grh‐Gal4 UAS‐CD8‐GFP were labeled with β‐Gal, Dpn, and GFP. Quiescent NSCs in the central brain are shown. Arrows point at the localization of Nod‐lacZ in qNSCs.
- Quantification graph of Nod‐β‐Gal localization in qNSCs from genotypes in (D). n = 55 NSCs for control; n = 45 NSCs for msps810 . ****P < 0.0001.
- Larval brains at 16 h ALH from control (grh‐Gal4 UAS‐CD8‐GFP; UAS‐dicer2 + UAS‐nod‐lacZ) and msps RNAi, UAS‐nod‐lacZ (VDRC#21982) with grh‐Gal4 UAS‐CD8‐GFP; UAS‐dicer2 were labeled with β‐Gal, Dpn, and GFP. Quiescent NSCs in the central brain are shown. Arrows indicate the localization of Nod‐lacZ in qNSCs.
- Quantification graph of Nod‐β‐Gal localization in qNSCs from genotypes in (F). n = 60 NSCs for control; n = 68 NSCs for msps RNAi. ****P < 0.0001.
- Larval brains at 24 h ALH from control (grh‐Gal4>UAS‐CD8‐GFP), msps924 , and mspsP18 expressing grh>CD8‐GFP were labeled with Dpn and GFP. The arrow indicates the second protrusion in msps924 .
- Quantification graph of the thickness of the primary protrusion of qNSCs from wild‐type, msps924 , and mspsP18 expressing grh>CD8‐GFP. The thickness was measured at the middle point of the primary protrusion. n = 18 NSCs for control; n = 52 NSCs for msps924 ; n = 32 NSCs for mspsP18 . ****P < 0.0001.
- Quantification graph of the length of primary protrusion in qNSCs in control (β‐Gal RNAi) and msps RNAi (VDRC#21982) cells under the control of grh‐Gal4 with UAS‐CD8‐GFP UAS‐dicer2. n = 40 NSCs for control; n = 37 NSCs for msps RNAi. P = 0.5257 (ns).
- Quantification graph of qNSCs extending two major protrusions labeled grh>CD8‐GFP in wild‐type, msps924 , and mspsP18 larval brains. n = 18 NSCs for control; n = 65 NSCs for msps924 ; n = 71 NSCs for mspsP18 .
- Larval brains at 24 h ALH from control (grh‐Gal4 UAS‐CD8‐GFP + UAS‐nod‐lacZ) and tacc74,UAS‐nod‐lacZ under the control of grh‐Gal4 UAS‐CD8‐GFP; tacc59 were labeled with β‐Gal, Dpn, and GFP. Quiescent NSCs in the central brain are shown.
- Quantification graph of Nod‐β‐Gal localization in qNSCs from genotypes in (L). n = 51 NSCs for control; n = 65 NSCs for tacc59 / 74. **P = 0.0051.
Data information: in (B, C, E, G, I, J, K, M), data are presented as mean ± SD. In (B, I), statistical significances were determined by one‐way ANOVA with multiple comparisons. In (J), statistical significance was determined by two‐tailed Student's t‐test. In (E, G, M), statistical significance was determined by two‐way ANOVA with multiple comparisons. Scale bars: 10 µm.
Given that Msps is critically required for microtubule growth in the primary protrusion of qNSCs, we examined whether msps depletion resulted in morphological defects in the primary protrusion of qNSCs. The thickness of the primary protrusion was measured at the middle position of the primary protrusion marked by grh>CD8‐GFP. Loss of msps resulted in dramatic thinning of the primary protrusion in qNSCs (Fig 4H and I; control, 1.38 ± 0.39 μm, n = 18; msps924 , 0.91 ± 0.29 μm, n = 52; msps P18, 0.93 ± 0.22 μm, n = 32). However, the length of the primary protrusion in qNSCs (VNC) upon msps RNAi knockdown at 16 h ALH was not significantly different from that of the control (Fig 4J; Control, 15.2 ± 3.7 μm, n = 40; msps RNAi, 14.7 ± 3.4 μm, n = 37), which is likely due to the relatively constant distance between the cell body of qNSCs and neuropil. In wild type, qNSCs occasionally extend a second protrusion toward the apical side or lateral side of the cell body in the first a few hours after larval hatching, but this structure is not seen in qNSCs at 24 h ALH (Fig 4H and K; 0% secondary protrusion, n = 18). However, in msps mutant qNSCs, secondary protrusion was readily observed (Fig 4H and K; msps924 , 11.9 ± 7.4%, n = 65; msps P18, 10.1 ± 6.6%, n = 71). More frequent extension of secondary protrusion seemed to be associated with a weakened primary protrusion in msps924 NSCs.
To further exclude the possibility that centrosomes potentially contribute to microtubule assembly in the primary protrusion of qNSCs, we examined EB1‐GFP comets in qNSCs upon sas4 or ana2 depletion, which are known to result in defects in centrosome formation. Strikingly, loss of centriolar protein sas‐4 or ana2 did not apparently disrupt MT assembly in the primary protrusion of qNSCs. At 6 h ALH, the number of EB1‐GFP comets in the primary protrusion of qNSCs was similar among the control, sas4 RNAi and ana2 RNAi in the heterozygous ana2719 background (Fig EV3C and D, Movies EV6 and EV7; control, 1, n = 10; sas‐4 RNAi, 1.27‐fold, n = 10; ana2 RNAi ana2719 /+, 1.03‐fold, n = 16). Sas4 and Ana2 were mostly undetectable in qNSCs from sas4 RNAi (94.4%, n = 18) and ana2 RNAi ana2719 /+ (Fig EV3A and B, 86.3%, n = 22), suggesting efficient knockdown. However, depletion of sas4 or ana2 resulted in a very mild phenotype or no phenotype of NSC reactivation (Fig EV3, EV4, EV5). These observations indicate that the centrosomes are nonessential for microtubule assembly in the primary protrusion in qNSCs. Taken together, Msps is critical for acentrosomal microtubule growth in the primary protrusion of qNSCs.
Figure EV5. Msps, Kinesin‐2, and E‐cad function in the same pathway in NSC reactivation.
- Larval brains at 24 h ALH from control (grh‐Gal4; UAS‐dicer2/UAS‐β‐Gal RNAi), kap3 RNAi I (45400), kap3 RNAi II (103548), klp64D RNAi I (BDSC#40945), and klp64D RNAi II (103358) expressed under grh‐Gal4; UAS‐Dicer2 were analyzed for EdU incorporation. Arrows indicate EdU‐negative NSCs.
- Quantification graph of EdU‐negative NSCs per brain lobe for genotypes in (A). n = 15 BL for control; n = 11 BL for kap3 RNAi I; n = 17 BL for kap3 RNAi II; n = 10 BL for klp64D RNAi I; n = 11 BL for klp64D RNAi II. ****P < 0.0001.
- Quantification graph of the percentage of qNSCs with primary protrusion for genotypes in (A). The protrusion was labeled by Mira. n = 20 BL for control; n = 12 BL for kap3 RNAi I; n = 19 BL for kap3 RNAi II; n = 10 BL for klp64D RNAi I; n = 13 BL for klp64D RNAi II. ****P < 0.0001; ***P = 0.0004; **P = 0.0019.
- Larval brains at 24 h ALH from RNAi control (UAS‐β‐Gal RNAi; UAS‐β‐Gal RNAi), msps RNAi (UAS‐GFP; UAS‐msps RNAi (21982)), kap3 RNAi (UAS‐GFP + UAS‐kap3 RNAi (103548)), klp64D RNAi (UAS‐GFP + UAS‐Klp64 RNAi (103358)), msps klp64D double knockdown (klp64D RNAi + msps RNAi), and msps kap3 double knockdown (kap3 RNAi + msps RNAi) driven by grh‐Gal4 were examined for EdU incorporation, and larval brains were stained with EdU and Dpn. EdU‐negative NSCs are indicated by arrows.
- Quantification graph of the percentage of NSCs negative for EdU incorporation per brain lobe for genotypes in (D). n = 16 BL for control; n = 21 BL for msps RNAi; n = 11 BL for kap3 RNAi; n = 9 BL for klp64D RNAi; n = 14 BL for klp64D RNAi + msps RNAi; n = 17 BL for kap3 RNAi + msps RNAi. ****P < 0.0001.
- Quantification graph of NSC diameter for genotypes in (D). n = 192 NSCs for control; n = 201 NSC for msps RNAi; n = 162 NSCs for kap3 RNAi; n = 170 NSCs for klp64D RNAi; n = 130 NSCs for klp64D RNAi + msps RNAi; n = 247 NSCs for kap3 RNAi + msps RNAi. ****P < 0.0001.
- Larval brains at 24 h ALH from RNAi control (UAS‐β‐Gal RNAi; UAS‐β‐Gal RNAi), msps RNAi control (UAS‐GFP; UAS‐msps RNAi (21982)), E‐cad RNAi control (UAS‐GFP + UAS‐kap3 RNAi (BDSC#38207)), and double knockdown (E‐cad RNAi + msps RNAi) controlled by grh‐Gal4 were analyzed for EdU incorporation, and larval brains were stained with EdU and Dpn. EdU‐negative NSCs are indicated by arrows.
- Quantification graph of the percentage of EdU‐negative NSCs per brain lobe for genotypes in (G). n = 11 BL for control; n = 13 BL for msps RNAi; n = 12 BL for E‐cad RNAi; n = 12 BL for E‐cad RNAi + msps RNAi. ****P < 0.0001; ***P = 0.0001.
- Quantification graph of NSC diameter for genotypes in (G). n = 89 NSCs for control; n = 117 NSCs for msps RNAi; n = 103 NSCs for E‐cad RNAi; n = 216 NSCs for E‐cad RNAi + msps RNAi. ****P < 0.0001.
Data information: in (B, C, E, F, H, I), data are presented as mean ± SD. In (B, C, E, F, H, I), statistical significance was determined by one‐way ANOVA with multiple comparisons. Scale bars: 10 µm.
E‐cad localizes to NSC‐neuropil contact sites in the Msps‐dependent manner
Although the primary protrusion of qNSCs is known to reach the neuropil (Chell & Brand, 2010), proteins that localize to the NSC‐neuropil contact points have not been identified. We examined the localization of E‐cad/Shotgun in qNSCs, as E‐cad is a cell adhesion molecule that has homophilic interactions and often localizes to cell–cell contacts. The outlines of qNSCs could be clearly labeled by CD8‐GFP expressed under the control of grh‐Gal4, where their basal tips join at the bulk of CD8‐GFP‐positive neuropil (Fig 5A). We found that in wild‐type VNCs at 24 h ALH, E‐cad was observed at the plasma membrane of qNSCs including the protrusion and formed an endfeet‐like structure at the tip of the protrusion where qNSCs seem to meet the surface of the neuropil (Fig 5A; n = 32). E‐cad localization at NSC‐neuropil contact sites and within NSCs was dramatically reduced upon knocking down E‐cad in NSCs (Appendix Fig S2A, B and D), suggesting that these localizations in wild‐type qNSCs were specific for E‐cad.
Figure 5. Delocalization of E‐cadherin at NSC‐neuropil contact sites in qNSCs upon msps depletion.
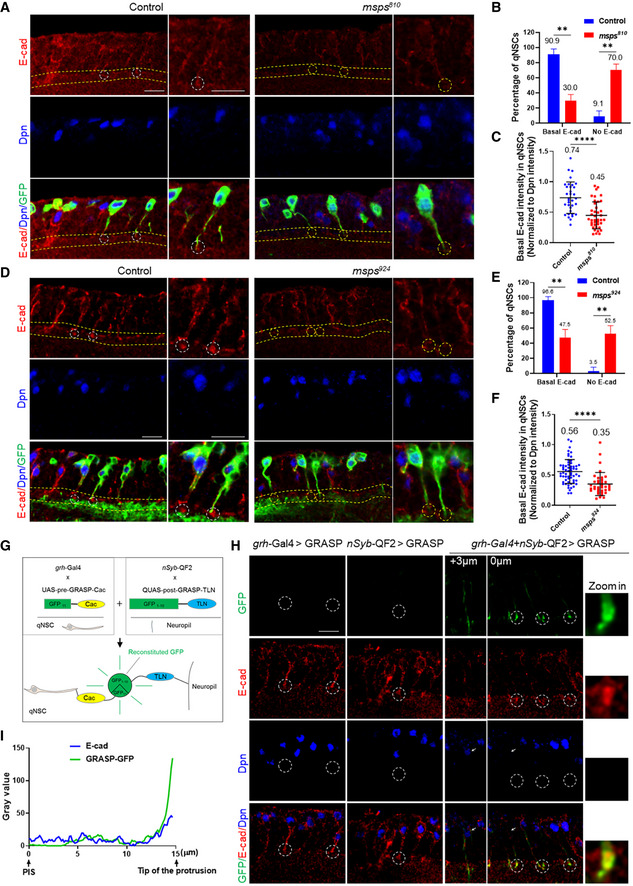
- Larval VNCs at 24 h ALH from the control (grh‐Gal4 UAS‐CD8‐GFP) and msps810 with grh‐Gal4 UAS‐CD8‐GFP were labeled with E‐cadherin, Dpn, and GFP. NSC‐neuropil contact were marked by dashed lines, and NSC‐neuropil contact points were circled.
- Quantification of E‐cadherin basal localization at NSC‐neuropil contact sites in qNSCs from genotypes in (A). “No E‐cad” means absent or strongly reduced E‐cad observed at the basal region of qNSCs. n = 32 NSCs for control; n = 61 NSCs for msps810 . **P = 0.0028.
- Quantification graph of the basal E‐cad intensity at NSC‐neuropil contact sites by normalizing against Dpn intensity in qNSCs from genotypes in (A). n = 34 NSCs for control; n = 40 NSCs for msps810 . ****P < 0.0001.
- Larval VNCs at 24 h ALH from control (grh‐Gal4 UAS‐CD8‐GFP) and msps924 with grh‐Gal4 UAS‐CD8‐GFP were labeled with E‐cadherin, Dpn, and GFP. NSC‐neuropil contact were marked by dashed lines, and NSC‐neuropil contact sites were circled.
- Quantification of E‐cadherin basal localization at NSC‐neuropil contact sites in qNSCs from genotypes in (D). “No E‐cad” means absent or strongly reduced E‐cad observed at the basal region of qNSCs. n = 77 NSCs for control; n = 30 NSCs for msps924 . **P = 0.0080.
- Quantification graph of the basal E‐cad intensity at NSC‐neuropil contact sites by normalizing against Dpn intensity in qNSCs from genotypes in (D). n = 60 NSCs for control; n = 37 NSCs for msps924 . ****P < 0.0001.
- An illustration of targeted GFP Reconstitution Across Synaptic Partners (t‐GRASP).
- Larval brains at 16 h ALH from control t‐GRASP under the control of single driver grh‐Gal4 or nSyb‐QF2 (Q‐system) and t‐GRASP under the control of driver pairs grh‐Gal4 and nSyb‐QF2 (Q‐system) were analyzed for E‐Cad, GFP (reconstituted GFP), and Dpn. Arrows pointing at the cell body of qNSCs on the two different focal planes. NSC‐neuropil contact sites were circled by dashed lines.
- A representative intensity plot of E‐cadherin (in blue) and GRASP‐GFP (in green) in the primary protrusion of a qNSC from (H). Pixel intensity of GFP and E‐cad in qNSCs were measured between the PIS region and the tip of the primary protrusion.
Data information: In (B, C, E, F), data are presented as mean ± SD. In (B, E), statistical significances were determined by two‐way ANOVA with multiple comparisons. In (C, F), statistical significances were determined by two‐tailed Student's t‐test. Scale bars: 10 µm.
Next, we tested whether Msps is required for E‐cad localization at the NSC‐neuropil contact sites. Strikingly, E‐cad localization at the NSC‐neuropil contact sites was lost or reduced in 70.0% of msps810 qNSCs (Fig 5A and B; n = 61) marked by grh>CD8‐GFP compared with the control qNSCs (Fig 5A and B; 9.1%, n = 32). The protein levels of basal E‐cad in qNSCs from msps810 , when normalized against Dpn intensity, dropped to 0.45‐fold compared with 0.74‐fold in control qNSCs (Fig 5C; n = 40 and n = 34, respectively). Likewise, E‐cad at NSC‐neuropil contact sites were lost in 52.5% of msps924 qNSCs (Fig 5D and E; n = 30) marked by grh>CD8‐GFP compared with the control qNSCs (Fig 5D and E; 96.6%, n = 77). E‐Cad intensity at protrusion tips normalized against Dpn intensity was decreased from “0.56” in control qNSCs (Fig 5D and F; n = 60) to “0.35” in msps924 qNSCs (Fig 5D and F; n = 37). Moreover, E‐cad was delocalized from NSC‐neuropil contact sites in 47.2% (Fig EV4C and D; n = 44) of qNSCs upon msps RNAi knockdown, compared with 92.4% E‐cad localization at the NSC‐neuropil contact sites in control (Fig EV4C and D; n = 39). We observed similar E‐cad intensity in the cell body in msps924 qNSCs (Appendix Fig S2H, 0.35‐fold, n = 37) to that of control qNSCs (vs 0.32‐fold, n = 60), when normalized against Dpn. Therefore, the loss of E‐cad at the protrusion tips upon msps depletion is unlikely due to the overall reduction of E‐cad expression.
To confirm the E‐cad localization at the NSC‐neuropil contact sites, we examined the localization of UASp‐E‐cad‐GFP under the control of grh‐Gal4. We stained 16 h ALH larval brains expressing UASp‐E‐cad‐GFP with anti‐GFP and anti‐E‐cad antibodies. We could detect the co‐localization of GFP with E‐cad and distinct E‐cad‐GFP at the tip of the protrusion in 30.7% (Fig EV4M, n = 13) of the qNSCs. E‐cad‐GFP localization at the tip of the protrusion was faint but visible in the remaining 69.3% (Fig EV4M, n = 13) of qNSCs, presumably due to weak GFP signal in these cells.
To further validate the localization of E‐cad at the NSC‐neuropil membrane contact sites, we took the advantage of targeted GFP Reconstitution Across Synaptic Partners (t‐GRASP), a method that specifically detects cell–cell interactions including those in synapse formation (Shearin et al, 2018). In our t‐GRASP experiment, one of the two split‐GFP fragments, UAS‐split‐GFP11, was targeted specifically to the NSCs by grh‐Gal4 driving the expression of a fusion protein consisting of the extracellular domain of CD4 and a presynaptic protein cacophony (Cac), while the other split‐GFP fragment QUAS‐split‐GFP1–10) was targeted specifically to the neuropil by the expression of the extracellular domain of mouse Telencephalin (TLN/ICAM5), which is known to be localized to the dendrites, via a pan‐neuronal driver nSyb‐QF2 (Q‐system; Fig 5G). If qNSCs have direct membrane contact with the neuropil, the full‐length GFP can be reconstituted at the extracellular space between the two cell types, marking the membrane contact sites between qNSCs and the neuropil. Remarkably, only when these two split‐GFP fragments were simultaneously expressed at 16 ALH, strong reconstitution of GFP signal was observed at NSC‐neuropil contact sites (Fig 5H). The weak GFP signal was observed in the primary protrusion of qNSCs (Fig 5H). Quantification of pixel intensity suggested that GFP was strongest at the tip of the protrusion, overlapping with E‐cad at NSC‐neuropil contact sites (Fig 5I). GFP signal was absent when expressing either of single split‐GFP fragments by grh‐Gal4 or nSyb‐QF2 driver (Fig 5H), suggesting the specificity of t‐GRASP.
Therefore, E‐cad localizes to NSC‐neuropil contact sites, which requires functional Msps within NSCs.
E‐cad functions intrinsically in NSCs and requires Msps for its localization to NSC‐neuropil contact sites
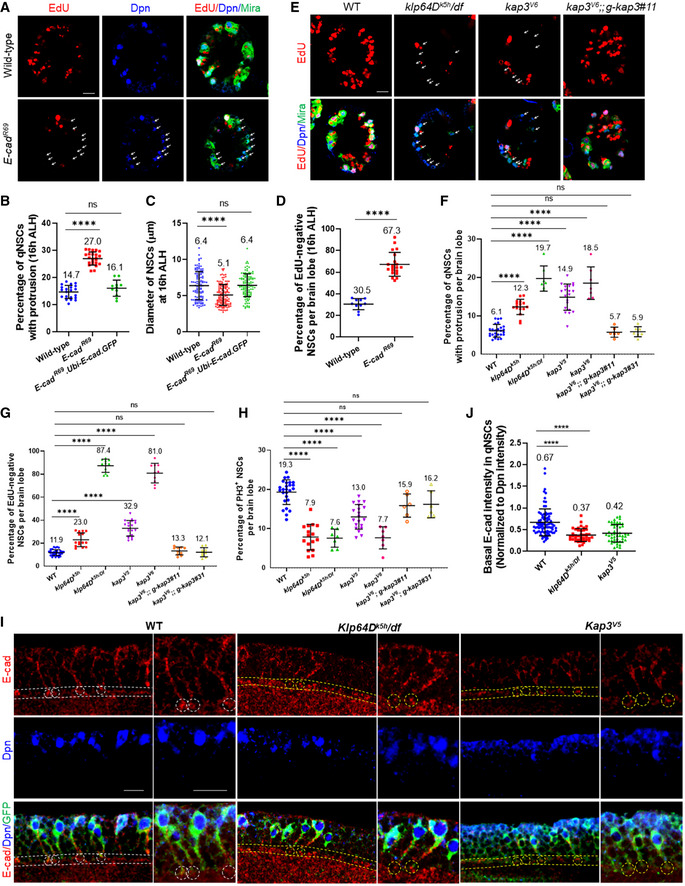
E‐cad was previously reported to act in glial cells to promote the proliferation of NSCs (Dumstrei et al, 2003). However, it was unknown whether E‐Cad is required for NSC reactivation, as previous analyses on E‐cad were carried out in 3rd‐instar larval brains when NSC proliferation is independent of dietary amino acids. To test the role of E‐cad in NSC reactivation, we examined E‐cadR69 , a known null allele resulting from a P‐element excision that removes the translation start site of E‐cad (Godt & Tepass, 1998), at 16 h ALH, as the homozygotes did not survive to 24 h ALH. At 16 h ALH, 27.0% (Fig 6B; n = 23 BLs) of E‐cadR69 NSCs still retained primary protrusion, significantly higher than 14.7% (n = 19 BLs) in wild‐type NSCs. This phenotype in E‐cadR69 NSCs was completely restored by overexpression of E‐cad‐GFP under the control of the Ubi‐p63E promoter (Fig 6B; 16.1%, n = 11 BLs). Moreover, at 16 h ALH, there was a significant reduction in cell diameter in E‐cadR69 (Fig 6C; 5.1 ± 1.4 μm, n = 131) compared with wild‐type (6.4 ± 1.9 μm, n = 110). Overexpression of E‐cad‐GFP completely restored the cell growth defect observed in E‐cadR69 NSCs (Fig 6C; 6.4 ± 1.6 μm, n = 114). Furthermore, at 16 h ALH, the majority of NSCs from E‐cadR69 failed to incorporate EdU (Fig 6A and D; 67.3%, n = 20 BL), compared with 30.5% EdU‐negative NSCs in the wild‐type control (Fig 6A and D; n = 10 BL). Taken together, E‐cad is required for NSC reactivation.
Figure 6. Kinesin‐2 promotes NSC reactivation and targets E‐cad to the NSC‐neuropil contact sites.
- Larval brains at 16 h ALH from wild‐type (yw) and E‐cadR69 were analyzed for EdU incorporation, and larval brains were labeled with EdU, Dpn and Mira.
- Quantification graph of the percentage of qNSCs with primary protrusion in wild‐type (yw), E‐cadR69 and E‐cadR69 .Ubi‐p63E‐E‐cad cells. GFP at 16 h ALH. Larval brains were labeled with Dpn and Mira (not shown). n = 19 BL for control; n = 23 BL for E‐cadR69 ; n = 11 BL for E‐cadR69 .Ubi‐p63E‐E‐cad BL. ****P < 0.0001; P = 0.2690 (ns).
- Quantification graph of NSC diameter at 16 h ALH from wild‐type (yw), E‐cadR69 and E‐cadR69 .Ubi‐p63E‐E‐cad.GFP. NSCs were marked by Dpn and Mira. n = 110 NSCs for control; n = 131 NSCs for E‐cadR69 ; n = 114 NSCs for E‐cadR69 .Ubi‐p63E‐E‐cad. ****P < 0.0001; P = 0.8151 (ns).
- Quantification graph of EdU‐negative NSCs per brain lobe for genotypes in (A). n = 10 BL for control; n = 20 BL for per E‐cadR69 . ****P < 0.0001.
- Larval brains at 24 h ALH from the wild‐type control (yw) and klp64Dk5h/Df , kap3V6 and kap3V6; g‐kap3#11 were stained with EdU, Dpn, and Mira.
- Quantification graph of NSCs with primary protrusion per brain lobe for genotypes in (E) as well as klp64Dk5h , kap3V5 , and kap3V6; g‐kap3#31. n = 26 BL for control; n = 16 BL for klp64Dk5h ; n = 7 BL for klp64Dk5h/Df ; n = 20 BL for kap3V5 ; n = 7 BL for kap3V6 ; n = 6 BL for kap3V6; g‐kap3#11; n = 7 BL for kap3V6; g‐kap3#31. ****P < 0.0001; control vs kap3V6; g‐kap3#11, P = 0.9998 (ns); control vs kap3V6; g‐kap3#31, P > 0.9999 (ns).
- Quantification graph of EdU‐negative NSCs per brain lobe for genotypes in (E) as well as klp64Dk5h , kap3V5 , and kap3V6; g‐kap3#31, which were not shown in (E). n = 33 BL for control; n = 15 BL for klp64Dk5h ; n = 11 BL for klp64Dk5h/Df ; n = 20 BL for kap3V5 ; n = 10 BL for kap3V6 ; n = 10 BL for kap3V6; g‐kap3#11; n = 10 BL for kap3V6; g‐kap3#31. ****P < 0.0001; control vs kap3V6; g‐kap3#11, P = 0.9713 (ns); control vs kap3V6; g‐kap3#31, P > 0.9999 (ns).
- Quantification graph of PH3‐positive NSCs (Dpn+, Mira+) per brain lobe for wild‐type control (yw), klp64Dk5h klp64Dk5h / Df, kap3V5 , kap3V6 and kap3V6; g‐kap3#11, and kap3V6; g‐kap3#31 larval brains. n = 26 BL for control; n = 16 BL for klp64Dk5h ; n = 7 BL for klp64Dk5h / Df; n = 20 BL for kap3V5 ; n = 7 BL for kap3V6 ; n = 6 BL for kap3V6; g‐kap3#11; n = 6 BL for kap3V6; g‐kap3#31. ****P < 0.0001; control vs kap3V6; g‐kap3#11, P = 0.0977 (ns); control vs kap3V6; g‐kap3#31, P = 0.1658 (ns).
- Larval brains at 24 h ALH from wild‐type control (yw), klp64Dk5h/Df , and kap3V5 were analyzed E‐cad at the NSC‐neuropil contact sites, and NSCs were labeled with Dpn and Msps.
- Quantification graph of the fold change of basal E‐cad intensity in qNSCs with primary protrusion for genotypes in (I). n = 85 NSCs for control; n = 40 NSCs for klp64Dk5h/Df ; n = 48 NSCs for kap3V5 . ****P < 0.0001.
Data information: Arrows in A and E indicate EdU‐negative NSCs. In (B–D, F–H, J), data are presented as mean ± SD. In (B–D, F–H, J), statistical significances were determined by one‐way ANOVA with multiple comparisons. Scale bars: 10 µm.
Given that E‐cad is localized to NSC‐neuropil contact sites, we investigated whether E‐cad was required in NSCs to promote NSC reactivation. Upon knocking down E‐cad by two independent RNAi lines driven by grh‐Gal4 at 24 h ALH, there was a significant increase in EdU‐negative NSCs (Appendix Fig S2C and E; E‐cad RNAi I, 29.3%, n = 17 BL; E‐cad RNAi II, 20.9%, n = 18 BL) compared with 11.1% EdU‐negative NSCs in the control (Appendix Fig S2C and E; n = 18 BL). Moreover, there was a significant increase in the percentage of qNSCs retaining primary protrusion upon E‐cad knockdown under grh‐Gal4 (Appendix Fig S2F; E‐cad RNAi I, 15.8%, n = 9 BL; E‐cad RNAi II, 11.7%, n = 8 BL) compared with the control (Appendix Fig S2F; 5.6%, n = 9 BL). In addition, the cell diameter of NSCs from E‐cad RNAi knockdown under grh‐Gal4 was significantly decreased (Appendix Fig S2G; E‐cad RNAi I, 5.6 ± 1.6 μm, n = 312; E‐cad RNAi II, 6.1 ± 1.4 μm, n = 353) compared with that of the control (7.0 ± 1.4 μm, n = 343). These results support the conclusion that E‐cad acts in NSCs to promote their reactivation.
Taken together, E‐cad functions intrinsically in NSCs and requires Msps for its localization to NSC‐neuropil contact sites.
Kinesin‐2 is required for NSC reactivation and E‐cad targeting to the NSC‐neuropil contact sites
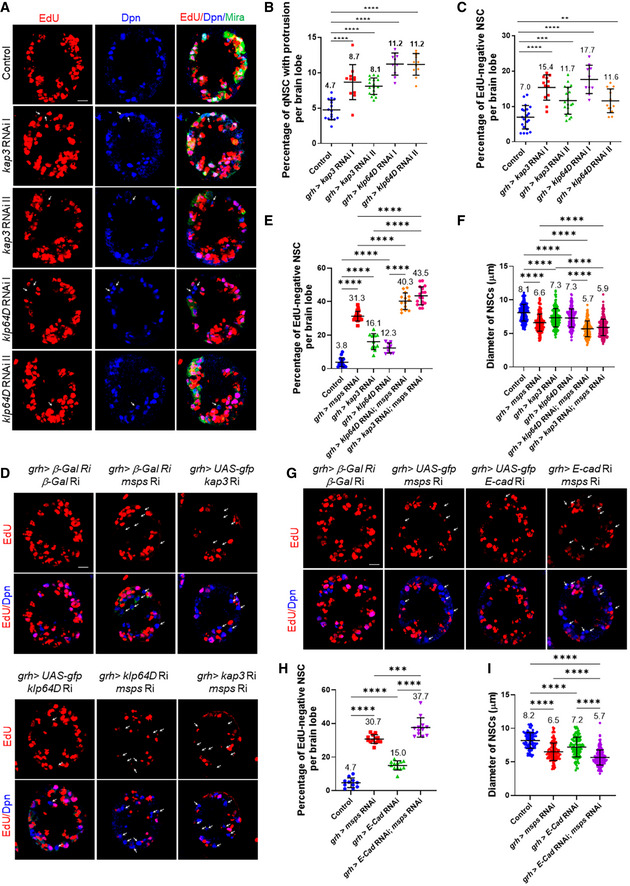
To investigate the mechanism by which microtubule dynamics regulates E‐Cad localization in the protrusion of qNSCs, we sought out to identify the motor protein that might be involved in localizing E‐cad in qNSCs. As E‐cad localizes to the tip of the plus‐end microtubule oriented protrusion, we reasoned that kinesin motor proteins that move their cargos toward the plus‐end microtubules is likely involved in E‐cad localization and NSC reactivation. Toward this end, we performed a small‐scale RNAi screen on major types of kinesins. Among 13 kinesin genes, we have identified klp64D/kif3A, klp68D, and kap3, encoding heterotrimeric Kinesin‐2, for their potential role in NSC reactivation (Table 1). Kinesin‐2 motors are heterotrimeric complexes containing three subunits: two kinesin‐like motor subunits, Klp64D/Kinesin‐2α/Kif3A (Ray et al, 1999) and Klp68D/Kinesin‐2β/Kif3B (Doodhi et al, 2012), and a nonmotor subunit termed Kap3 (Kinesin‐associated polypeptide 3) (Doodhi et al, 2009). Kinesin‐2 is essential for anterograde intraflagellar transport in sensory cilia assembly and axonal transport (Sarpal et al, 2003a), but its potential function in NSC reaction was unknown. We found that knockdown of Kin‐2 subunits under the control of grh‐Gal4 led to more NSCs retaining the primary protrusion (Fig EV5B; kap RNAi I, 8.7%, n = 11 BL; kap RNAi II, 8.1%, n = 17 BL; klp64D RNAi I, 11.2%, n = 10 BL; klp64D RNAi II, 11.2%, n = 11 BL), compared with the control (Fig EV5B, 4.7%, n = 15). Consistently, more NSCs failed to incorporate EdU in those RNAi lines (Fig EV5A and C; kap RNAi I, 15.4%, n = 12 BL; kap RNAi II, 11.7%, n = 19 BL; klp64D RNAi I, 17.7%, n = 10 BL; klp64D RNAi II, 11.6%, n = 13 BL), compared with the control (Fig EV5A and C; 7.0%, n = 20 BL). Since all three subunits of Kin‐2 are potentially required for NSC reactivation, we decided to focus on determining the function of Kinesin‐2 during NSC reactivation and E‐cad localization in qNSCs.
Table 1.
RNAi screen on major types of Kinesins
| Kinesin family | Gene name | RNAi stock X (insc‐Gal4 or grh‐Gal4) | NSC reactivation delay at 24 h ALH? |
|---|---|---|---|
| Kinesin‐1 | Khc |
BDSC #25898 BDSC #35770 |
No No |
| Kinesin‐2 | Kap3 |
V103548KK V45400GD |
Yes Yes |
| Klp68D | V101058KK | Yes | |
| Klp64D/Kif3A | V103358KK | Yes | |
| Kinesin‐5 | Klp61F | V52549GD | No |
| Kinesin‐6 | Pav/MKLP1 | V1103330KK | Yes; also displayed cytokinesis phenotype |
| Kinesin‐8 | Klp67A/Klp3 |
V108852KK V52105GD |
No Yes |
| Kinesin‐like proteins | Cos/costa | V108914KK | No |
| Klp3A/mei‐352 | V104682KK | No | |
| Klp31E | V110696KK | No | |
| Klp98A | V40605GD | No | |
| Klp54D | BDSC #63533 | Yes | |
| Kinesin family proteins | Kif3C |
V108308KK V43639GD |
No No |
To confirm the role of Kinesin‐2 during NSC reactivation, we examined multiple loss‐of‐function alleles of kinesin‐2. At 24 h ALH more qNSCs with primary protrusion were observed in a loss‐of‐function allele, klp64Dk5h , and a transheterozygote klp64Dk5h/Df (Fig 6F; 12.3%, n = 16 BL and 19.7%, n = 7 BL, respectively) compared with the control (Fig 6F; 6.1%, n = 26 BL). Likewise, at 24 h ALH more NSCs from kap3V5 and kap3V6 , two EMS‐induced alleles, retained primary protrusion (Fig 6F; kap3V5 , 14.9%, n = 20 BL and kap3V6 , 18.5%, n = 7 BL, respectively). Importantly, this phenotype in kap3V6 was completely rescued by the expression of genomic transgenes of kap3 (Fig 6F; kap3V6; g‐kap3#11, 5.7%, n = 6 BL and kap3V6; g‐kap3#31, 5.9%, n = 7 BL). Moreover, significantly more NSCs failed to incorporate EdU in klp64Dk5h (Fig 6E and G; 23.0%, n = 15 BL), compared with the control (Fig 6E and G; 12.1%, n = 33 BL). These defects in NSC reactivation in klp64Dk5h were completely rescued by the expression of UASp‐klp64D driven by grh‐Gal4 at 24 h ALH (Fig EV4F). Hemizygous klp64Dk5h over Df(3L)BSC371, a deficiency deleting klp64D gene region (Fig 6E and G; 87.4%, n = 11 BL), displayed a severe defect in EdU incorporation, suggesting the important role of Klp64D in NSC reactivation. As a control, hemizygous klp64DDf /+ had normal NSC cell cycle re‐entry at 24 h ALH (Fig EV4I and J). Similarly, EdU incorporation defects were also found in kap3V5 and kap3V6 (Fig 6E and G; 32.9%, n = 20 BL; 81.0%, n = 10 BL, respectively) at 24 h ALH. Importantly, the failure of EdU incorporation seen in kap3V6 NSCs was completely restored by the expression of a genomic transgene of kap3 (Fig 6E and G; 13.3%, n = 10 BL; 12.1%, n = 10 BL), which was indistinguishable from the control. In addition, the number of mitotic NSCs was dramatically decreased in klp64Dk5h andklp64Dk5h/Df (Fig 6H; 7.9%, n = 16 and BL 7.6%, n = 7 BL, respectively), compared with that of the control (Fig 6H; 19.3%, n = 26 BL). Additionally, PH3‐positive NSCs were significantly reduced in kap3V5 and kap3V6 at 24 h ALH (Fig 6H; 13.0%, n = 20 BL and 7.7%, n = 7 BL, respectively), which was also fully rescued by the presence of genomic transgene of kap3 (Fig 6H; kap3V6; g‐kap3#11, 15.9%, n = 6 BL and kap3V6; g‐kap3#31, 16.2%, n = 6 BL). These observations indicate an essential role of Kin‐2 in promoting cell cycle re‐entry of qNSCs.
Next, we investigated whether Kinesin‐2 is required for the localization of E‐cad at the tip of the protrusion. We examined E‐cad localization at the NSC‐neuropil contact sites in klp64Dk5h /Df(3L)BSC371 at 24 h ALH and found that E‐cad was reduced to 0.37‐fold after normalizing against Dpn intensity (Fig 6I and J; n = 40), compared to 0.67‐fold in control (Fig 6I and J; n = 85). E‐cad localization at the qNSC‐neuropil contact sites was deep in the larval brain and had poor staining quality in kap3V6 qNSCs, presumably due to relatively sick larvae, which precluded us from making reliable conclusions using kap3V6 allele. Nevertheless, relative E‐cad intensity at NSC‐neuropil contact sites was significantly reduced to 0.42‐fold in kap3V5 (Fig 6I and J; n = 48). Therefore, we conclude that Kinesin‐2, a microtubule plus‐end‐directed motor protein, promotes NSC reactivation and is required for E‐cad localization at the NSC‐neuropil junction.
Msps functions upstream of Kin‐2 and E‐cad during NSC reactivation
Since we demonstrate that Msps and Kin‐2 are required for NSC reactivation and targeting E‐cad to the NSC‐neuropil contact sites, we sought to investigate whether Msps functions upstream of Kin‐2 and E‐cad during NSC reactivation. We overexpressed klp64D and found that NSC reactivation phenotypes in msps RNAi were significantly suppressed. At 24 h ALH, in msps knockdown with klp64D expression under the control of insc‐Gal4, the number of EdU‐negative NSCs was significantly reduced to 35.6% (Fig 7A and B; n = 20 BL) compared with 45.0% in msps RNAi (Fig 7A and B; n = 13 BL), but higher than that in RNAi control (Fig 7A and B; 2.7%, n = 13 BL). Moreover, at 24 h ALH, the NSC diameter in msps RNAi with klp64D overexpression was significantly increased to 6.6 ± 1.0 µm in comparison with 6.3 ± 1.0 µm in msps knockdown alone (Fig 7C; n = 457 and n = 494, respectively) and was still smaller than that in RNAi control (Fig 7C; 8.9 ± 1.4 µm, n = 246). Likewise, re‐introduction of the genomic construct of kap3 (g‐kap3) into msps RNAi brains led to a partial suppression of NSC reactivation defects. 34.3% of EdU‐negative NSCs were observed in msps RNAi with g‐kap3 expression (Fig 7D and E; n = 19 BL), which was significantly lower than 45.1% in msps RNAi (Fig 7D and E; n = 15 BL), but higher than 1.8% in RNAi control (Fig 7D and E; n = 13 BL). In addition, the NSC diameter was increased to 6.5 ± 1.1 µm in msps RNAi with g‐kap3 expression (Fig 7F; n = 409), significantly larger than msps knockdown alone (Fig 7F; 6.1 ± 1.1 µm, n = 357) but smaller than that in control (Fig 7F; 8.7 ± 1.5 µm, n = 339). These genetic data strongly support our conclusion that Kin‐2 functions downstream of Msps to promote NSC reactivation.
Figure 7. Kin‐2 and E‐cad act downstream of Msps to promote NSC reactivation.
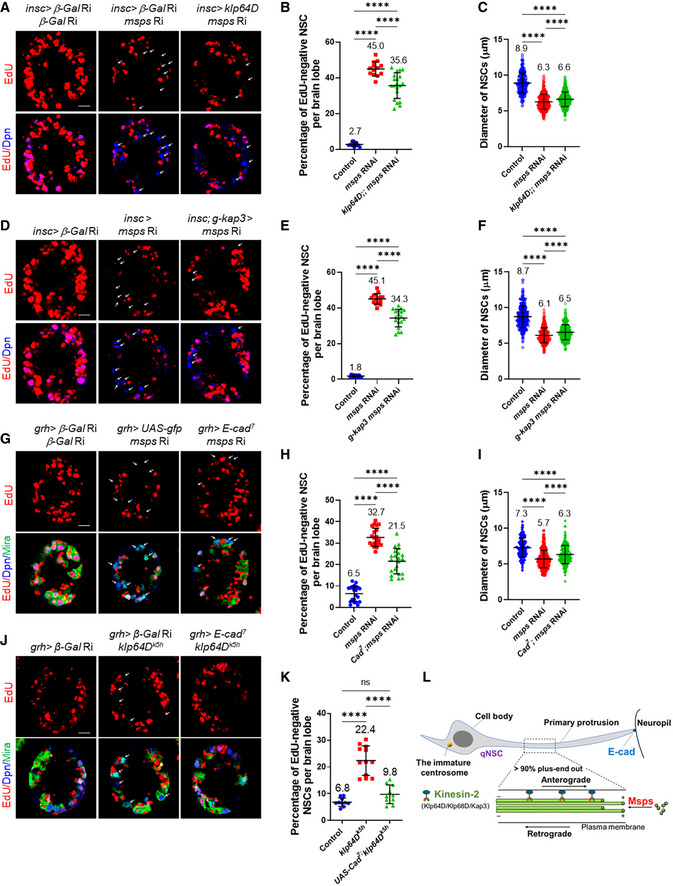
- Larval brains at 24 h ALH from wild‐type control (UAS‐β‐Gal RNAi; UAS‐β‐Gal RNAi), msps RNAi control (UAS‐GFP + UAS‐msps RNAi [21982]), and rescued animals (UAS‐klp64D + msps RNAi [21982]) under the control of insc‐Gal4 were analyzed for EdU incorporation, and larval brains were labeled with EdU and Dpn.
- Quantification graph of EdU‐negative NSCs per brain lobe for genotypes in (A). n = 13 BL for control; n = 13 BL for msps RNAi; n = 20 BL for UAS‐klp64D + msps RNAi. ****P < 0.0001.
- Quantification graph of NSC diameter for genotypes in (A). n = 246 NSCs for control; n = 494 NSCs for msps RNAi; n = 457 NSCs for UAS‐klp64D + msps RNAi. ****P < 0.0001.
- Larval brains at 24 h ALH from wild‐type control (UAS‐β‐Gal RNAi), RNAi control (UAS‐msps RNAi [21982]), and rescued animals (g‐kap3 + msps RNAi [21982]) driven by insc‐Gal4 were examined for EdU incorporation, and larval brains were stained with EdU and Dpn.
- Quantification graph of NSCs negative for EdU incorporation per brain lobe for genotypes in (D). n = 13 BL for control; n = 15 BL for msps RNAi; n = 19 BL for g‐kap3 + msps RNAi. ****P < 0.0001.
- Quantification graph of NSC diameter for genotypes in (D). n = 339 NSCs for control; n = 357 NSCs for msps RNAi; n = 409 NSCs for g‐kap3 + msps RNAi. Error bars represent SD. ****P < 0.0001.
- 24 h ALH larval brains from wild‐type control (UAS‐β‐Gal RNAi; UAS‐β‐Gal RNAi), RNAi control (UAS‐GFP + UAS‐msps RNAi (21982)), and rescued animals (UAS‐E‐cad7 + msps RNAi [21982]) were assessed for EdU incorporation, and larval brains were stained with EdU and Dpn.
- Quantification graph of NSCs negative for EdU incorporation per brain lobe for genotypes in (G). n = 21 BL for control; n = 21 BL for msps RNAi; n = 22 BL for UAS‐E‐cad7 + msps RNAi. ****P < 0.0001.
- Quantification graph of NSC diameter for genotypes in (G). n = n = 127 NSCs for control; n = 230 NSCs for msps RNAi; n = 210 NSCs for UAS‐E‐cad7 + msps RNAi. ****P < 0.0001.
- 24 h ALH larval brains from wild‐type control (UAS‐β‐Gal RNAi), mutant control (UAS‐β‐Gal RNAi + klp64Dk5h ), and rescued animals (UAS‐E‐cad7 + klp64Dk5h ) were processed for EdU incorporation, and larval brains were probed by with EdU, Dpn, and Mira.
- Quantification graph of NSCs negative for EdU incorporation per brain lobe for genotypes in (J). n = 10 BL for control; n = 12 BL for klp64Dk5h ; n = 10 BL for UAS‐E‐cad7 + klp64Dk5h . ****P < 0.0001; P = 0.3006 (ns).
- A working model. Microtubule arrays in the primary protrusion of Drosophila qNSCs are predominantly acentrosomal with plus‐end‐out orientation. Msps regulates microtubule growth and orientation in quiescent NSCs. Msps and Kinesin‐2 target E‐cadherin to the NSC‐neuropil contact for NSC reactivation.
Data information: Arrows point at EdU‐negative NSCs in A, D, G, and J. In (B, C, E, F, H, I, K), data are presented as mean ± SD. In (B, C, E, F, H, I, K), statistical significances were determined by one‐way ANOVA with multiple comparisons. Scale bars: 10 µm.
Next, we overexpressed E‐cad and tested its ability to suppress NSC reactivation defects caused by msps depletion. At 24 h ALH, in msps RNAi with E‐cad overexpression driven by grh‐Gal4, the number of EdU‐negative NSCs (Fig 7G and H; 21.5%, n = 22 BL) was significantly fewer than that in msps RNAi alone (Fig 7G and H; 32.7% n = 21 BL), but higher than 6.5% in control (Fig 7G and H; n = 21 BL). In addition, the NSC diameter in msps RNAi with E‐cad overexpression was increased to 6.3 ± 1.3 µm (n = 210) from 5.7 ± 1.2 µm (n = 230) in msps knockdown (Fig 7I), but it was smaller than 7.3 ± 1.4 µm in control (Fig 7I; n = 127). Therefore, E‐cad overexpression partially suppressed NSC reactivation defects caused by msps RNAi knockdown. Likewise, E‐cad overexpression significantly suppressed NSC reactivation defects in klp64Dk5h brains. The number of EdU‐negative NSCs was reduced to 9.8% in klp64Dk5h with the overexpression of E‐cad7 (Fig 7J and K; n = 10 BL) from 22.4% in klp64Dk5h (Fig 7J and K; n = 12 BL) and was close to 6.8% in RNAi control (Fig 7J and K; n = 10 BL). These data indicate that E‐cad functions downstream of Msps and Kin‐2 in NSC reactivation.
Consistent with the above‐described suppression, simultaneously knockdown of kap3 (kin‐2 subunit) and msps by RNAi enhanced the NSC reactivation defects in single knockdowns. At 24 h ALH, msps kap3 double knockdown under the control of grh‐Gal4 had more qNSCs that failed to incorporate EdU (Fig EV5D and E; 43.5% of NSCs, n = 17 BL) than either of the single knockdown (Fig EV5D and E; msps RNAi, 31.3%, n = 21 BL; kap3 RNAi, 16.1%, n = 11 BL). Further, at 24 h ALH, the average NSC diameter in msps and kap3 double knockdown (Fig EV5F; 5.9 ± 1.2 µm, n = 247) was significantly decreased, compared with either msps RNAi (6.6 ± 1.3 µm, n = 201) or kap3 RNAi (7.3 ± 1.4 µm, n = 162). Similarly, msps klp64D double knockdown resulted in significant more NSCs with failed EdU incorporation (Fig EV5D and E; 40.3%, n = 14 BL), compared to single knockdown (Fig EV5D and E; msps RNAi, 31.3%, n = 21 BL; klp64D RNAi, 12.3%, n = 9 BL) or RNAi control (Fig EV5D and E; 3.8%, n = 16). In addition, NSC diameter of msps klp64D double knockdown (Fig EV5F; 5.7 ± 1.2 µm, n = 130) was significantly smaller than that in msps RNAi (Fig EV5F; 6.6 ± 1.3 µm, n = 201), klp64D RNAi (7.3 ± 1.4 µm, n = 170), or RNAi control (8.1 ± 1.3 µm, n = 192). Further, in double knockdown of msps and E‐cad, significantly more EdU‐negative NSCs were observed (Fig EV5G and H; 37.7%, n = 12 BL) compared with 30.7% in msps knockdown, 15.0% in E‐cad knockdown, and 4.7% in RNAi control (Fig EV5G and H; n = 13, n = 12, and n = 11, respectively) at 24 h ALH. Further, at 24 h ALH, the NSC diameter of msps and E‐cad double knockdown significantly dropped to 5.7 ± 1.1 µm (Fig EV5I; n = 216), compared with msps or E‐cad knockdown alone (Fig EV5I; 6.5 ± 1.3 µm, n = 117 and 7.2 ± 1.5 µm, n = 103, respectively). These data support epistatic links among Msps, Kin‐2, and E‐cad during NSC reactivation.
Taken together, Msps‐dependent acentrosomal microtubules enable NSC‐neuropil contact sites during NSC reactivation by targeting E‐cad to the NSC‐neuropil contact sites via plus‐end directed motor Kinesin‐2 (Fig 7L).
Discussion
In this study, we demonstrate that microtubules in the primary protrusion of qNSCs are predominantly acentrosomal and oriented plus‐end‐out, distal to the cell body. We have identified Msps/XMAP215 as the first key regulator of acentrosomal microtubule assembly in quiescent NSCs. We also demonstrate that qNSCs form membrane contact with the neuropil and E‐cad is localized to these contact sites. Msps and Kinesin‐2 are important for the targeting of E‐cad to NSC‐niche contact points. Loss of function of msps, E‐Cad, and kinesin‐2 components in NSCs results in defects in NSC reactivation. Our data are consistent with a model where Msps governs NSC reactivation by transporting E‐cad via microtubule plus‐end directed motor protein Kinesin‐2. Based on our data, it is interesting to speculate that the target site and site of E‐cad action are NSC‐neuropil contact sites.
Here, we show that in the primary protrusion of wild‐type qNSCs, the speed of EB1‐GFP comet movement is slightly slower but very close to that in dividing NSCs but dramatically faster than that reported in the dendrites of sensory neurons (∼ 0.1 µm/s) (Wang et al, 2019). This result suggests that microtubule assembly in the protrusion is unexpectedly robust. Is microtubule growth in qNSCs dependent on centrosomes? The centrosomes are key MTOCs of dividing cells, including active Drosophila NSCs. In cycling cells, PCM proteins are recruited to the centrosome(s) throughout the cell cycle, with the highest levels at the centrosomes during mitosis (Rebollo et al, 2009). In dividing larval brain NSCs, the apical centrosome organizes a microtubule aster that stays at the apical cortex for most of the cell cycle, while the other centrosome loses PCM and microtubule‐organizing activity and moves dynamically until shortly before mitosis (Rebollo et al, 2007; Rusan & Peifer, 2007). We show that the centrosome in qNSCs has distinct behavior from that in active NSCs. In newly hatched larvae, both centrosomes are mostly located at the apical region of qNSCs and are inactive and devoid of PCM proteins such as CNN and γ‐tub. Since these qNSCs have already extended their primary protrusion, the centrosomes are unlikely the MTOC responsible for organizing the primary protrusion. Consistent with these observations, microtubule aster could not be observed in qNSCs in early larval stages, suggesting the inability of microtubule nucleation by the centrosomes at this stage. Remarkably, tracking EB1‐GFP comets in centrosome‐deficit qNSCs indicates that microtubule growth in the primary protrusion of qNSCs is primarily independent of the centrosomes. Therefore, our study, for the first time, indicates that microtubule growth in the primary protrusion of qNSCs is surprisingly robust and mostly acentrosomal.
Microtubules are polarized and display uniform plus‐end‐out orientation in axons and minus‐end‐out orientation in dendrites in Drosophila neurons (Stone et al, 2008). We show that in the primary protrusion of qNSCs, microtubules are predominantly oriented with their plus‐end‐out (plus‐end distal to the cell body). This is quite similar to the microtubule plus‐end‐out orientation in axons of both vertebrate and invertebrate neurons. Another similarity between the microtubule organization in the primary protrusion of qNSCs and mature neurons is the inactive centrosomes in both cell types (Nguyen et al, 2011). However, we show that the centrosomes in wild‐type qNSCs have a stereotypic position at the apical region in early larval stages, distinct from the centrosome of neurons without a consistent position (Nguyen et al, 2011). In addition, the primary protrusion of qNSCs projects to and contacts the neuropil. Is the NSC‐neuropil contact similar to synapses? The primary protrusion of qNSCs does not express synaptic markers such as Synaptotagmin, suggesting a distinct composition from synapses. However, qNSCs form direct membrane contact with neuropil, as demonstrated by the t‐GRASP experiment. NSCs appear to lose the primary protrusion through the retraction during reactivation (Otsuki & Brand, 2018). Intriguingly, a recent report showed that NSCs segregate the protrusion into the ganglion mother cell (GMC) following their first asymmetric division (preprint: Bostock et al, 2020a; Bostock et al, 2020b). If NSCs could segregate the protrusion into the GMC, the protrusion might be eventually inherited by one of the neurons produced by the GMC. It is conceivable that NSC‐neuropil contact sites may serve as a scaffolding to prime future synapse formation of neurons.
We have identified Msps/MAP215 as a key regulator of acentrosomal microtubule growth in the primary protrusion of qNSCs. Msps/MAP215 directly binds to the tubulin dimer via its tumor‐overexpressed gene (TOG) domains to promote microtubule polymerization. In dividing NSCs, Msps is mainly detected at the centrosomes in both interphase and mitosis, and loss of msps leads to the formation of shorter spindle and NSC polarity defects (Chen et al, 2016). Unlike the absence of PCM proteins in newly hatched larvae, Msps was already seen in the cytoplasm of qNSCs, including the primary protrusion. msps depletion resulted in a gross loss of EB1‐GFP comets in the protrusion of qNSCs, an indication of loss of microtubule growth. Surprisingly, Arl2, which is essential for microtubule growth and centrosomal localization of Msps in dividing NSCs (Chen et al, 2016), appears to be not important for NSC reactivation. It is most likely that Msps regulates acentrosomal microtubule growth in qNSCs, independent of Arl2, which is more critical for centrosomal microtubule growth. Although the centrosome is immature in qNSCs from newly hatched larvae, the intensity of PCM at the centrosomes subsequently increases but remains low in reactivating NSCs. Perhaps the centrosome only becomes mature and functional following the retraction of the primary protrusion of NSCs. It is unknown whether the presence of the primary protrusion prevents centrosomes maturation. Was the assembly of the primary protrusion in late embryonic stages dependent on the centrosomes? Although not been tested directly, this was unlikely, as depletion of a centrosomal protein γ‐tubulin throughout embryonic stages and early larval stages did not disturb NSC cell cycle re‐entry. Although we cannot formally rule out the possibility that microtubule growth in qNSCs requires the centrosomes at the embryonic stages, all our evidence point to acentrosomal microtubule organization in qNSCs during the larval stages.
Microtubule plus‐end‐out orientation in axons of neurons is important for axonal growth and transport (Voelzmann et al, 2016). What is the function of plus‐end‐out polarity in the primary protrusion of qNSCs? We show that Msps is important for the formation of primary protrusion of qNSCs and its depletion results in dramatic thinning of the protrusion. Therefore, Msps‐dependent microtubule growth provides structural support for the formation of primary protrusion. Although the presence of primary protrusion is believed to be a hallmark of qNSCs, we provide evidence that Msps‐dependent microtubule assembly in the protrusion is likely required for NSC reactivation. Primary protrusion of qNSCs directly contacts the neuropil; however, proteins at NSC‐neuropil contact sites were previously unknown. The cell adhesion molecule E‐cad, abundantly expressed in 3rd‐instar larval NSCs, is often localized to cell–cell contacts and was recently reported to localize to MB NSC‐cortex glia contact in the adult Drosophila brain (Dumstrei et al, 2003; Doyle et al, 2017). We show, for the first time, that E‐cad forms an endfeet‐like structure at NSC‐neuropil contact sites. Moreover, Msps is important for targeting E‐cad to the cell junctions where qNSCs contact their niche at the neuropil. E‐cad was previously shown to be required in glia to promote NSC reactivation (Dumstrei et al, 2003). We further show that E‐cad is intrinsically required for NSC reactivation.
Besides the essential role in cilia formation, Kinesin‐2 also regulates axonal elongation and microtubule polarity in dendrites (Takeda et al, 2000; Mattie et al, 2010; Scholey, 2013). In this study, we demonstrate the prominent localization of E‐cad at the NSC‐neuropil contact sites, which is facilitated by Kinesin‐2 components. Kinesin‐2 is likely a major motor protein involved in transporting E‐cad to NSC‐neuropil contact sites. Interestingly, Klp64D and Kap3 are also important for maintaining microtubule polarity in the branched dendritic arborization (da) neurons of the larva in Drosophila (Mattie et al, 2010). E‐cad regulates cell adhesion and the apico‐basal polarity of epithelial cells (Tepass & Hartenstein, 1994). Drosophila E‐cad, together with β‐catenin and α‐catenin, forms adherens junctions in epithelial cells (Tepass & Hartenstein, 1994). E‐cad in qNSCs might also function as a cell adhesion protein to connect qNSCs with the neuropil. It will be of great interest to identify additional proteins located at the NSC‐neuropil junction in Drosophila larval brains. In HeLa cells, overexpressed E‐Cad was found to transit from the Golgi to the Rab11 endosomes (Lock & Stow, 2005). In Drosophila epithelial cells, E‐cad is delivered from recycling endosomes to the plasma membrane (Langevin et al, 2005). It remains to be established whether similar trafficking route is involved for E‐cad delivery to the NSC‐neuropil contact sites in qNSCs.
Recently, microtubule‐based nanotubes were shown to mediate signaling between Drosophila male germline stem cells and their niche (Inaba et al, 2015). The structure of the primary protrusion in qNSCs is distinct from that of nanotubes, as the latter lacks acetylated Tubulin and is much thinner and shorter (∼ 0.4 μm in thickness and ∼ 3 μm in length) than the former (∼ 1.4 μm in thickness and ∼ 15 μm in length). Moreover, qNSC primary protrusion appears to be distinct from primary cilia, as the latter is assembled/attached from the basal body, which is derived from the mother centriole (Seeley & Nachury, 2010). The primary protrusion of qNSCs also differs from the cytonemes and tunneling nanotubes that were up to 700–1,000 µm in length and mediated long‐range signaling between cells (Rustom et al, 2004; Roy et al, 2014). We propose that the primary protrusion of qNSCs is a novel type of cellular protrusion that potentially mediates NSC‐neuropil communication. Our finding that E‐cad localizes to the NSC‐neuropil contact sites and is required for NSC reactivation suggests that the neuropil contacted by the primary protrusion of quiescent NSCs likely functions as a new niche for promoting NSC reactivation.
The mammalian neural stem cells, apical radial glial (aRG) cells, extend an apical process attached to the ventricular surface and a longer basal process extending toward the pial surface of the brain (Paridaen & Huttner, 2014). Interestingly, microtubules in the basal process of mouse aRG appear largely acentrosomal with approximately 85% of them oriented plus‐end‐out (preprint: Coquand et al, 2020; Coquand et al, 2021), analogous to that of the primary protrusion of qNSCs in Drosophila. As the microtubule polarity has just beginning to be elucidated in both flies and mammalian NSCs, future study is warranted to determine whether conserved mechanisms regulate both systems.
Taken together, we propose that Msps is essential for acentrosomal microtubule growth in qNSCs, which facilitates targeting of E‐cad to NSC‐niche contact points via Kinesin‐2 motors to promote NSC reactivation. Our findings may be a general paradigm that could be applied to other types of quiescent stem cells in both Drosophila and mammalian systems.
Materials and Methods
Fly stocks and genetics
Fly stocks and genetic crosses were raised at 25°C unless otherwise stated. Fly stocks were kept in vials or bottles containing standard fly food (0.8% Drosophila agar, 5.8% cornmeal, 5.1% dextrose, and 2.4% brewer's yeast). The following fly strains were used in this study: insc‐Gal4 (BDSC#8751; 1407‐Gal4), grh‐Gal4 (A. Brand), insc‐Gal4 tub‐Gal80ts, msps924 (F. Yu), msps810 (F. Yu), msps810 UAS‐Nod‐β‐gal (F. Yu), mspsP18 (Chen et al, 2016), mspsP (Cullen et al, 1999), g‐msps (HN267) (Cullen et al, 1999), UAS‐Kin‐β‐gal (Clark et al, 1997), UAS‐arl2T30N /TM6B Tb (Chen et al, 2016), Jupiter‐GFP (G147), UAS‐β‐tub‐Venus/CyOβ, UAS‐GFP‐msps/TM6B Tb (F. Yu), kap3V5 (K. Ray), tacc74 UAS‐Nod‐β‐gal (F. Yu), tacc59 (F. Yu), klp64Dk5h (Ray et al, 1999), kap3V6 (Sarpal et al, 2003b), kap3V6;; P{213 w + 11} (labeled as kap3V6;; g‐kap3#11 in this study; Sarpal, 2003 #3), kap3V6;; P{213 w + 31} (labeled as kap3V6;; g‐kap3#31 in this study; Sarpal, 2003 #3). The following stocks were obtained from Bloomington Drosophila Stock Center (BDSC): UAS‐Gal RNAi (BDSC#50680; this stock is often used as a control UAS element to balance the total number of UAS elements), UAS‐Nod‐β‐gal (BDSC#9912), FRT42D E‐cadR69.Ubi‐p63E‐E‐cad.GFP (BDSC#58742), UAS‐E‐cad RNAi (BDSC#32904), UAS‐E‐cad RNAi (BDSC#38207), UASp‐E‐cad‐GFP (BDSC#58445), nSyb‐QF2 (BDSC#51955), 10XQUAS‐post‐t‐GRASP.20XUAS‐pre‐t‐GRASP (BDSC#79038), klp64D RNAi I (BDSC#40945), khc RNAi (BDSC#25898), khc RNAi RNAi (BDSC#35770), Df(3L)BSC371 (klp64D deficiency; BDSC#24395), UAS‐klp64D (BDSC#32008), g‐kap3#11 (separated from kap3V6;; g‐kap3#11 in this study). The following stocks were obtained from Vienna Drosophila Resource Center (VDRC): msps RNAi (21982), arl2 RNAi (110627), sas‐4 RNAi (106051), kap3 RNAi I (45400), kap3 RNAi I (103548), klp64D RNAi II (103358), klp68D RNAi (101058), Klp61F RNAi (52549), pav RNAi (1103330), klp67A RNAi (108852), Klp67A RNAi (52105), costa RNAi (108914), klp3A RNAi (104682), klp31E RNAi (110696), klp98A RNAi (40605), kif3C RNAi (108308), kif3C RNAi (43639). msps RNAi knockdown efficiency in larval brains was verified by immunostaining with an anti‐Msps antibody. Various RNAi knockdown or overexpression constructs were induced using grh‐Gal4 or insc‐Gal4 unless otherwise stated.
All experiments were carried out at 25°C, except for RNAi knockdown or overexpression at 29°C, unless otherwise indicated.
EdU (5‐ethynyl‐2´‐deoxyuridine) incorporation assay
Larvae of various genotypes were fed with food supplemented with 0.2 mM EdU from Click‐iT® EdU Imaging Kits (Invitrogen) for 4 h. Larval brains were dissected in PBS and fixed with 4% EM‐grade formaldehyde in PBS for 22 min, followed by three washes with 0.3% PBST, each wash for 10 min and blocked with 3% BSA in PBST for 30 min. Detection of incorporated EdU by Alexa Fluor azide was performed according to the Click‐iT EdU protocol (Invitrogen). The brains were rinsed twice and subjected to standard immunohistochemistry.
Immunohistochemistry
Drosophila larvae were dissected in PBS, and larval brains were fixed in 4% EM‐grade formaldehyde in PBT (PBS + 0.3% Triton X‐100) for 22 min. The samples were processed for immunostaining as previously described (Li et al, 2017). For α‐tubulin immunohistochemistry, larvae were dissected in Shield and Sang M3 medium (Sigma‐Aldrich) supplemented with 10% FBS, followed by fixation in 10% formaldehyde in testis buffer (183 mM KCl, 47 mM NaCl, 10 mM Tris–HCl, and 1 mM EDTA, pH 6.8) supplemented with 0.01% Triton X‐100.) The fixed brains were washed once in PBS and twice in 0.1% Triton X‐100 in PBS. Images were taken from an LSM710 confocal microscope system (Axio Observer Z1; ZEISS) using a Plan‐Apochromat 40×/1.3 NA oil differential interference contrast objective, and brightness and contrast were adjusted by Photoshop CS6.
Primary antibodies used in this paper were guinea pig anti‐Dpn (1:1,000), mouse anti‐Mira (1:50, F. Matsuzaki), rabbit anti‐Mira (1:500, W. Chia), rabbit anti‐GFP (1:3,000; F. Yu), mouse anti‐GFP (1:5,000; F. Yu), guinea pig anti‐Asl (1:200, C. Gonzalez), rabbit anti‐Sas‐4 (1:100, J. Raff), mouse anti‐α‐tubulin (1:200, Sigma, Cat#: T6199), mouse anti‐γ‐tubulin (1:200, Sigma, Cat#: T5326), rabbit anti‐CNN (1:5,000, E. Schejter and T. Megraw), rabbit anti‐Msps (1:500), rabbit anti‐Msps (1:1,000, J. Raff), rabbit anti‐PH3 (1:200, Sigma, Cat#: 06‐570), rat anti‐E‐cadherin (1:20, DCAD2, DSHB), mouse anti‐β‐Gal (1:1,000, Promega, Cat#: Z3781), rabbit anti‐β‐galactosidase (1:5,000, Invitrogen, A‐11132), mouse nc82 (1:20, DSHB) and mouse anti‐synaptotagmin 1 (1:50, DSHB, 3H2 2D7), rabbit anti‐sas‐4 (1:200, J. Raff), rabbit anti‐Ana2 (Wang et al, 2011) (1:50), α‐tubulin (1:200, Sigma, Cat#: T6199). The secondary antibodies used were conjugated with Alexa Fluor 488, 555 or 647 (Jackson laboratory).
Tracking of EB1‐GFP comets
Larval brains of various genotypes expressing EB1‐GFP under grh‐Gal4 at various time points were dissected in Shield and Sang M3 insect medium (Sigma‐Aldrich) supplemented with 10% FBS. Larval brain explant cultures were supplied with fat bodies from wild‐type third instar and live imaging of larval brains was performed with an LSM710 confocal microscope system using a 40X oil lens and Zoom factor 6. Larval brains were imaged for 151 s with 83 frames acquired for each movie, and images were analyzed with NIH ImageJ software. Velocity and kymograph were calculated or generated by KymoButler (Jakobs et al, 2019).
Spinning disk super‐resolution imaging
Super‐resolution Spinning disk confocal‐structured illumination microscopy (SDC‐SIM) were performed on a spinning disk system (Gataca Systems) based on an inverted microscope (Nikon Ti2‐E; Nikon) equipped with a confocal spinning head (CSU‐W; Yokogawa), a Plan‐Apo objective (100× 1.45‐NA), a back‐illuminated sCMOS camera (Prime95B; Teledyne Photometrics), and a super‐resolution module (Live‐SR; GATACA Systems) based on structured illumination with optical reassignment technique and online processing leading to a two‐time resolution improvement (Roth & Heintzmann, 2016). The maximum resolution is 128 nm with a pixel size in super‐resolution mode of 64 nm. Excitation light was provided by 488‐nm/150 mW (Vortran; for GFP), 561‐nm/100 mW (Coherent; for mCherry/mRFP/tagRFP) and 639‐nm/150mW (Vortran; for iRFP) laser combiner (iLAS system; GATACA Systems), and all image acquisition and processing were controlled by MetaMorph (Molecular Device) software. Images were further processed with ImageJ, and brightness and contrast were adjusted in Photoshop CS6.
Quantification and statistical analysis
Drosophila larval brains from various genotypes were placed dorsal side up on confocal slides. The confocal z‐stacks were taken from the surface to the deep layers of the larval brains (20–30 slides per z‐stack with 2 or 3 µm intervals). For each genotype, at least 5 brain lobes were imaged for z‐stacks, and ImageJ or Zen software was used for quantifications. The cell diameter of quiescent NSCs was measured based on grh>CD8‐GFP or Mira cortical localization in Dpn‐positive cells.
Statistical analysis was essentially performed using GraphPad Prism 8. Unpaired two‐tail t‐tests were used for comparison of two sample groups, and one‐way ANOVA or two‐way ANOVA followed by Sidak's multiple comparisons test was used for comparison of more than two sample groups. All data are shown as the mean ± SD. Statistically nonsignificant (ns) denotes P > 0.05, * denotes P < 0.05, ** denotes P < 0.01, *** denotes P < 0.001, and **** denotes P < 0.0001. All experiments were performed with a minimum of two repeats. All replicates are biological replicates. In general, n refers to the number of NSCs counted unless otherwise indicated. When analyzing larval brains, each brain lobe is considered as one biological replicate. When quantifying fluorescence intensity, each NSC is one biological replicate.
Author contributions
Conceptualization, HW and QD; Methodology, Data curation, and formal analysis, QD, YST, and LYC; Writing—original draft, QD and HW; Writing—review & editing, HW, QD, YST, and LYC; Funding acquisition, HW; Resources, HW; Supervision, HW.
Conflict of interest
The authors declare that they have no conflict of interest.
Supporting information
Appendix
Expanded View Figures PDF
Movie EV1
Movie EV2
Movie EV3
Movie EV4
Movie EV5
Movie EV6
Movie EV7
Acknowledgements
We thank F. Yu, A. Brand, C. Gonzalez, J. Raff, E. Schejter, T. Megraw, T. Lee, F Matsuzaki, W. Chia, and the Bloomington Drosophila Stock Center, Vienna Drosophila Resource Center, Kyoto Stock Centre DGGR, and the Developmental Studies Hybridoma Bank for fly stocks and antibodies. This work is supported by the Ministry of Health‐Singapore National Medical Research Council MOH‐000143 (MOH‐OFIRG18may‐0004) to H.W.
The EMBO Journal (2021) 40: e104549.
Data availability
All data generated or analyzed during this study are included in the manuscript.
References
- Aberg MA, Aberg ND, Palmer TD, Alborn AM, Carlsson‐Skwirut C, Bang P, Rosengren LE, Olsson T, Gage FH, Eriksson PS (2003) IGF‐I has a direct proliferative effect in adult hippocampal progenitor cells. Mol Cell Neurosci 24: 23–40 [DOI] [PubMed] [Google Scholar]
- Bostock MP, Prasad AR, Chaouni R, Yuen AC, Sousa‐Nunes R, Amoyel M, Fernandes VM (2020a) An immobilization technique for long‐term time‐lapse imaging of explanted Drosophila tissues. bioRxiv 10.1101/2020.08.04.234864 [PREPRINT] [DOI] [PMC free article] [PubMed] [Google Scholar]
- Bostock MP, Prasad AR, Chaouni R, Yuen AC, Sousa‐Nunes R, Amoyel M, Fernandes VM (2020b) An immobilization technique for long‐term time‐lapse imaging of explanted Drosophila tissues. Front Cell Dev Biol 8: 590094 [DOI] [PMC free article] [PubMed] [Google Scholar]
- Chell JM, Brand AH (2010) Nutrition‐responsive glia control exit of neural stem cells from quiescence. Cell 143: 1161–1173 [DOI] [PMC free article] [PubMed] [Google Scholar]
- Chen K, Koe CT, Xing ZB, Tian X, Rossi F, Wang C, Tang Q, Zong W, Hong WJ, Taneja Ret al (2016) Arl2‐ and Msps‐dependent microtubule growth governs asymmetric division. J Cell Biol 212: 661–676 [DOI] [PMC free article] [PubMed] [Google Scholar]
- Cheung TH, Rando TA (2013) Molecular regulation of stem cell quiescence. Nat Rev Mol Cell Biol 14: 329–340 [DOI] [PMC free article] [PubMed] [Google Scholar]
- Clark IE, Jan LY, Jan YN (1997) Reciprocal localization of Nod and kinesin fusion proteins indicates microtubule polarity in the Drosophila oocyte, epithelium, neuron and muscle. Development 124: 461–470 [DOI] [PubMed] [Google Scholar]
- Conduit PT, Raff JW (2010) Cnn dynamics drive centrosome size asymmetry to ensure daughter centriole retention in Drosophila neuroblasts. Curr Biol 20: 2187–2192 [DOI] [PubMed] [Google Scholar]
- Coquand L, Victoria GS, Tata A, Brault JB, Guimiot F, Fraisier V, Baffet AD (2020) A dendritic‐like microtubule network is organized from swellings of the basal fiber in neural progenitors. bioRxiv 10.1101/2020.03.16.993295 [PREPRINT] [DOI] [Google Scholar]
- Coquand L, Victoria GS, Tata A, Carpentieri JA, Brault J‐B, Guimiot F, Fraisier V, Baffet AD (2021) CAMSAPs organize an acentrosomal microtubule network from basal varicosities in radial glial cells. J Cell Biol 220: e202003151 [DOI] [PMC free article] [PubMed] [Google Scholar]
- Cullen CF, Deak P, Glover DM, Ohkura H (1999) mini spindles: a gene encoding a conserved microtubule‐associated protein required for the integrity of the mitotic spindle in Drosophila . J Cell Biol 146: 1005–1018 [DOI] [PMC free article] [PubMed] [Google Scholar]
- Ding R, Weynans K, Bossing T, Barros CS, Berger C (2016) The Hippo signalling pathway maintains quiescence in Drosophila neural stem cells. Nat Commun 7: 10510 [DOI] [PMC free article] [PubMed] [Google Scholar]
- Ding WY, Huang J, Wang H (2020) Waking up quiescent neural stem cells: molecular mechanisms and implications in neurodevelopmental disorders. PLoS Genet 16: e1008653 [DOI] [PMC free article] [PubMed] [Google Scholar]
- Doetsch F, Garcia‐Verdugo JM, Alvarez‐Buylla A (1999) Regeneration of a germinal layer in the adult mammalian brain. Proc Natl Acad Sci USA 96: 11619–11624 [DOI] [PMC free article] [PubMed] [Google Scholar]
- Doodhi H, Ghosal D, Krishnamurthy M, Jana SC, Shamala D, Bhaduri A, Sowdhamini R, Ray K (2009) KAP, the accessory subunit of kinesin‐2, binds the predicted coiled‐coil stalk of the motor subunits. Biochemistry 48: 2248–2260 [DOI] [PubMed] [Google Scholar]
- Doodhi H, Jana SC, Devan P, Mazumdar S, Ray K (2012) Biochemical and molecular dynamic simulation analysis of a weak coiled coil association between kinesin‐II stalks. PLoS One 7: e45981 [DOI] [PMC free article] [PubMed] [Google Scholar]
- Doyle SE, Pahl MC, Siller KH, Ardiff L, Siegrist SE (2017) Neuroblast niche position is controlled by Phosphoinositide 3‐kinase‐dependent DE‐Cadherin adhesion. Development 144: 820–829 [DOI] [PMC free article] [PubMed] [Google Scholar]
- Dumstrei K, Wang F, Hartenstein V (2003) Role of DE‐cadherin in neuroblast proliferation, neural morphogenesis, and axon tract formation in Drosophila larval brain development. J Neurosci 23: 3325–3335 [DOI] [PMC free article] [PubMed] [Google Scholar]
- Fabel K, Kempermann G (2008) Physical activity and the regulation of neurogenesis in the adult and aging brain. Neuromolecular Med 10: 59–66 [DOI] [PubMed] [Google Scholar]
- Gil‐Ranedo J, Gonzaga E, Jaworek KJ, Berger C, Bossing T, Barros CS (2019) STRIPAK members orchestrate hippo and insulin receptor signaling to promote neural stem cell reactivation. Cell Rep 27: 2921–2933.e2925 [DOI] [PMC free article] [PubMed] [Google Scholar]
- Godt D, Tepass U (1998) Drosophila oocyte localization is mediated by differential cadherin‐based adhesion. Nature 395: 387–391 [DOI] [PubMed] [Google Scholar]
- Huang J, Wang H (2018) Hsp83/Hsp90 physically associates with insulin receptor to promote neural stem cell reactivation. Stem Cell Rep 11: 883–896 [DOI] [PMC free article] [PubMed] [Google Scholar]
- Inaba M, Buszczak M, Yamashita YM (2015) Nanotubes mediate niche‐stem‐cell signalling in the Drosophila testis. Nature 523: 329–332 [DOI] [PMC free article] [PubMed] [Google Scholar]
- Jakobs MA, Dimitracopoulos A, Franze K (2019) KymoButler, a deep learning software for automated kymograph analysis. Elife 8: e42288 [DOI] [PMC free article] [PubMed] [Google Scholar]
- Juanes M, Guercio G, Marino R, Berensztein E, Warman DM, Ciaccio M, Gil S, Bailez M, Rivarola MA, Belgorosky A (2015) Three novel IGF1R mutations in microcephalic patients with prenatal and postnatal growth impairment. Clin Endocrinol (Oxf) 82: 704–711 [DOI] [PubMed] [Google Scholar]
- Lai S‐L, Doe CQ (2014) Transient nuclear Prospero induces neural progenitor quiescence. eLife 3: e03363 [DOI] [PMC free article] [PubMed] [Google Scholar]
- Langevin J, Morgan MJ, Rossé C, Racine V, Sibarita J‐B, Aresta S, Murthy M, Schwarz T, Camonis J, Bellaïche Y (2005) Drosophila exocyst components sec5, Sec6, and Sec15 regulate DE‐cadherin trafficking from recycling endosomes to the plasma membrane. Dev Cell 9: 365–376 [DOI] [PubMed] [Google Scholar]
- Lee MJ, Gergely F, Jeffers K, Peak‐Chew SY, Raff JW (2001) Msps/XMAP215 interacts with the centrosomal protein D‐TACC to regulate microtubule behaviour. Nat Cell Biol 3: 643–649 [DOI] [PubMed] [Google Scholar]
- Li S, Koe CT, Tay ST, Tan ALK, Zhang S, Zhang Y, Tan P, Sung W‐K, Wang H (2017) An intrinsic mechanism controls reactivation of neural stem cells by spindle matrix proteins. Nat Commun 8: 122 [DOI] [PMC free article] [PubMed] [Google Scholar]
- Littleton JT, Bellen HJ, Perin MS (1993) Expression of synaptotagmin in Drosophila reveals transport and localization of synaptic vesicles to the synapse. Development 118: 1077–1088 [DOI] [PubMed] [Google Scholar]
- Lock JG, Stow JL (2005) Rab11 in recycling endosomes regulates the sorting and basolateral transport of E‐cadherin. Mol Biol Cell 16: 1744–1755 [DOI] [PMC free article] [PubMed] [Google Scholar]
- Lucassen PJ, Meerlo P, Naylor AS, van Dam AM, Dayer AG, Fuchs E, Oomen CA, Czeh B (2010) Regulation of adult neurogenesis by stress, sleep disruption, exercise and inflammation: implications for depression and antidepressant action. Eur Neuropsychopharmacol 20: 1–17 [DOI] [PubMed] [Google Scholar]
- Ly PT, Tan YS, Koe CT, Zhang Y, Xie G, Endow S, Deng WM, Yu F, Wang H (2019) CRL4Mahj E3 ubiquitin ligase promotes neural stem cell reactivation. PLoS Biol 17: e3000276 [DOI] [PMC free article] [PubMed] [Google Scholar]
- Mairet‐Coello G, Tury A, DiCicco‐Bloom E (2009) Insulin‐like growth factor‐1 promotes G(1)/S cell cycle progression through bidirectional regulation of cyclins and cyclin‐dependent kinase inhibitors via the phosphatidylinositol 3‐kinase/Akt pathway in developing rat cerebral cortex. J Neurosci 29: 775–788 [DOI] [PMC free article] [PubMed] [Google Scholar]
- Mattie FJ, Stackpole MM, Stone MC, Clippard JR, Rudnick DA, Qiu Y, Tao J, Allender DL, Parmar M, Rolls MM (2010) Directed microtubule growth, +TIPs, and kinesin‐2 are required for uniform microtubule polarity in dendrites. Curr Biol 20: 2169–2177 [DOI] [PMC free article] [PubMed] [Google Scholar]
- Morin X, Daneman R, Zavortink M, Chia W (2001) A protein trap strategy to detect GFP‐tagged proteins expressed from their endogenous loci in Drosophila . Proc Natl Acad Sci USA 98: 15050–15055 [DOI] [PMC free article] [PubMed] [Google Scholar]
- Morshead CM, Reynolds BA, Craig CG, McBurney MW, Staines WA, Morassutti D, Weiss S, van der Kooy D (1994) Neural stem cells in the adult mammalian forebrain: a relatively quiescent subpopulation of subependymal cells. Neuron 13: 1071–1082 [DOI] [PubMed] [Google Scholar]
- Mosimann C, Hausmann G, Basler K (2006) Parafibromin/hyrax activates Wnt/Wg target gene transcription by direct association with β‐catenin/armadillo. Cell 125: 327–341 [DOI] [PubMed] [Google Scholar]
- Nguyen MM, Stone MC, Rolls MM (2011) Microtubules are organized independently of the centrosome in Drosophila neurons. Neural Dev 6: 38 [DOI] [PMC free article] [PubMed] [Google Scholar]
- Otsuki L, Brand AH (2017) The vasculature as a neural stem cell niche. Neurobiol Dis 107: 4–14 [DOI] [PubMed] [Google Scholar]
- Otsuki L, Brand AH (2018) Cell cycle heterogeneity directs the timing of neural stem cell activation from quiescence. Science 360: 99–102 [DOI] [PMC free article] [PubMed] [Google Scholar]
- Otsuki L, Brand AH (2020) Quiescent neural stem cells for brain repair and regeneration: lessons from model systems. Trends Neurosci 43: 213–226 [DOI] [PubMed] [Google Scholar]
- Paridaen JT, Huttner WB (2014) Neurogenesis during development of the vertebrate central nervous system. EMBO Rep 15: 351–364 [DOI] [PMC free article] [PubMed] [Google Scholar]
- Poon CL, Mitchell KA, Kondo S, Cheng LY, Harvey KF (2016) The hippo pathway regulates neuroblasts and brain size in Drosophila melanogaster . Curr Biol 26: 1034–1042 [DOI] [PubMed] [Google Scholar]
- Ray K, Perez SE, Yang Z, Xu J, Ritchings BW, Steller H, Goldstein LSB (1999) Kinesin‐II is required for axonal transport of choline acetyltransferase in Drosophila . J Cell Biol 147: 507–518 [DOI] [PMC free article] [PubMed] [Google Scholar]
- Rebollo E, Sampaio P, Januschke J, Llamazares S, Varmark H, Gonzalez C (2007) Functionally unequal centrosomes drive spindle orientation in asymmetrically dividing Drosophila neural stem cells. Dev Cell 12: 467–474 [DOI] [PubMed] [Google Scholar]
- Rebollo E, Roldan M, Gonzalez C (2009) Spindle alignment is achieved without rotation after the first cell cycle in Drosophila embryonic neuroblasts. Development 136: 3393–3397 [DOI] [PubMed] [Google Scholar]
- Roth S, Heintzmann R (2016) Optical photon reassignment with increased axial resolution by structured illumination. Methods Appl Fluoresc 4: 045005 [DOI] [PubMed] [Google Scholar]
- Roy S, Huang H, Liu S, Kornberg TB (2014) Cytoneme‐mediated contact‐dependent transport of the Drosophila decapentaplegic signaling protein. Science 343: 1244624 [DOI] [PMC free article] [PubMed] [Google Scholar]
- Rusan NM, Peifer M (2007) A role for a novel centrosome cycle in asymmetric cell division. J Cell Biol 177: 13–20 [DOI] [PMC free article] [PubMed] [Google Scholar]
- Rustom A, Saffrich R, Markovic I, Walther P, Gerdes HH (2004) Nanotubular highways for intercellular organelle transport. Science 303: 1007–1010 [DOI] [PubMed] [Google Scholar]
- Sarpal R, Todi SV, Sivan‐Loukianova E, Shirolikar S, Subramanian N, Raff EC, Erickson JW, Ray K, Eberl DF (2003) Drosophila KAP interacts with the kinesin II motor subunit KLP64D to assemble chordotonal sensory cilia, but not sperm tails. Curr Biol 13: 1687–1696 [DOI] [PubMed] [Google Scholar]
- Scholey JM (2013) Kinesin‐2: a family of heterotrimeric and homodimeric motors with diverse intracellular transport functions. Annu Rev Cell Dev Biol 29: 443–469 [DOI] [PubMed] [Google Scholar]
- Seeley ES, Nachury MV (2010) The perennial organelle: assembly and disassembly of the primary cilium. J Cell Sci 123: 511–518 [DOI] [PMC free article] [PubMed] [Google Scholar]
- Shearin HK, Quinn CD, Mackin RD, Macdonald IS, Stowers RS (2018) t‐GRASP, a targeted GRASP for assessing neuronal connectivity. J Neurosci Methods 306: 94–102 [DOI] [PMC free article] [PubMed] [Google Scholar]
- Sousa‐Nunes R, Yee LL, Gould AP (2011) Fat cells reactivate quiescent neuroblasts via TOR and glial insulin relays in Drosophila . Nature 471: 508–512 [DOI] [PMC free article] [PubMed] [Google Scholar]
- Spéder P, Brand AH (2014) Gap Junction proteins in the blood‐brain barrier control nutrient‐dependent reactivation of Drosophila neural stem cells. Dev Cell 30: 309–321 [DOI] [PMC free article] [PubMed] [Google Scholar]
- Stone MC, Roegiers F, Rolls MM (2008) Microtubules have opposite orientation in axons and dendrites of Drosophila neurons. Mol Biol Cell 19: 4122–4129 [DOI] [PMC free article] [PubMed] [Google Scholar]
- Takeda S, Yamazaki H, Seog D‐H, Kanai Y, Terada S, Hirokawa N (2000) Kinesin superfamily protein 3 (Kif3) motor transports fodrin‐associating vesicles important for neurite building. J Cell Biol 148: 1255–1266 [DOI] [PMC free article] [PubMed] [Google Scholar]
- Tang Q, Rui M, Bu S, Wang Y, Chew LY, Yu F (2020) A microtubule polymerase is required for microtubule orientation and dendrite pruning in Drosophila . EMBO J 39: e103549 [DOI] [PMC free article] [PubMed] [Google Scholar]
- Tepass U, Hartenstein V (1994) The development of cellular junctions in the Drosophila embryo. Dev Biol 161: 563–596 [DOI] [PubMed] [Google Scholar]
- Truman JW, Bate M (1988) Spatial and temporal patterns of neurogenesis in the central nervous system of Drosophila melanogaster . Dev Biol 125: 145–157 [DOI] [PubMed] [Google Scholar]
- Tsuji T, Hasegawa E, Isshiki T (2008) Neuroblast entry into quiescence is regulated intrinsically by the combined action of spatial Hox proteins and temporal identity factors. Development 135: 3859–3869 [DOI] [PubMed] [Google Scholar]
- Varmark H, Llamazares S, Rebollo E, Lange B, Reina J, Schwarz H, Gonzalez C (2007) Asterless is a centriolar protein required for centrosome function and embryo development in Drosophila . Curr Biol 17: 1735–1745 [DOI] [PubMed] [Google Scholar]
- Vaughan KT (2005) TIP maker and TIP marker; EB1 as a master controller of microtubule plus ends. J Cell Biol 171: 197–200 [DOI] [PMC free article] [PubMed] [Google Scholar]
- Venken KJT, Schulze KL, Haelterman NA, Pan H, He Y, Evans‐Holm M, Carlson JW, Levis RW, Spradling AC, Hoskins RAet al (2011) MiMIC: a highly versatile transposon insertion resource for engineering Drosophila melanogaster genes. Nat Methods 8: 737–743 [DOI] [PMC free article] [PubMed] [Google Scholar]
- Voelzmann A, Hahn I, Pearce SP, Sanchez‐Soriano N, Prokop A (2016) A conceptual view at microtubule plus end dynamics in neuronal axons. Brain Res Bull 126: 226–237 [DOI] [PMC free article] [PubMed] [Google Scholar]
- Wagh DA, Rasse TM, Asan E, Hofbauer A, Schwenkert I, Dürrbeck H, Buchner S, Dabauvalle M‐C, Schmidt M, Qin Get al (2006) Bruchpilot, a protein with homology to ELKS/CAST, is required for structural integrity and function of synaptic active zones in Drosophila . Neuron 49: 833–844 [DOI] [PubMed] [Google Scholar]
- Wang Y, Rui M, Tang Q, Bu S, Yu F (2019) Patronin governs minus‐end‐out orientation of dendritic microtubules to promote dendrite pruning in Drosophila . Elife 8: e39964 [DOI] [PMC free article] [PubMed] [Google Scholar]
- Wang C, Li S, Januschke J, Rossi F, Izumi Y, Garcia‐Alvarez G, Gwee S, Soon S, Sidhu H, Yu Fet al (2011) An ana2/ctp/mud complex regulates spindle orientation in Drosophila neuroblasts. Dev Cell 21: 520–533 [DOI] [PubMed] [Google Scholar]
- Yan YP, Sailor KA, Vemuganti R, Dempsey RJ (2006) Insulin‐like growth factor‐1 is an endogenous mediator of focal ischemia‐induced neural progenitor proliferation. Eur J Neuorsci 24: 45–54 [DOI] [PubMed] [Google Scholar]
- Ye P, Popken GJ, Kemper A, McCarthy K, Popko B, D'Ercole AJ (2004) Astrocyte‐specific overexpression of insulin‐like growth factor‐I promotes brain overgrowth and glial fibrillary acidic protein expression. J Neurosci Res 78: 472–484 [DOI] [PubMed] [Google Scholar]