

Abstract
Objective:
Primary repair of peripheral nerves is recommended following transection; however, patient management following repair is challenged by a lack of biomarkers to nerve regeneration. Previous studies have demonstrated that diffusion magnetic resonance imaging (MRI) may provide viable biomarkers of nerve regeneration in injury models; though, these methods have not been systematically evaluated in graded partial transections and repairs.
Methods:
Ex vivo diffusion MRI was performed in fixed rat sciatic nerve samples 4 or 12 weeks following partial nerve transection and repair (25% cut = 12, 50% cut = 12 and 75% cut = 11), crush injuries (n = 12), and sham surgeries (n = 9). Behavioral testing and histologic evaluation were performed in the same animals and nerve samples for comparison.
Results:
Diffusion tractography provided visual characterizations of nerve damage and recovery consistent with the expected degree of injury within each cohort. In addition, quantitative indices from diffusion MRI correlated with both histological and behavioral evaluations, the latter of indicated full recovery for sham and crush nerves and limited recovery in all partially transected/repaired nerves. Nerve recovery between 4 and 12 weeks was statistically significant in partial transections 50% and 75% depth cuts (p = 0.043 and p = 0.022) but not for 25% transections.
Interpretation:
Our findings suggest that DTI can i) distinguish different degrees of partial nerve transection following surgical repair and ii) map spatially heterogeneous nerve recovery (e.g., due to collateral sprouting) from 4 to 12 weeks in partially transected nerves.
Keywords: water diffusion, nerve injury, nerve regeneration, DTI, quantitative MRI, trauma
1. Introduction
In the United States, five percent of admissions to level I trauma centers involve some degree of traumatic peripheral nerve injury (TPNI) [1], which most commonly arise from lacerations, stretch mechanisms, crush mechanisms, penetrating injuries, and/or ischemia. After injury, immediate repair can mitigate edema and scar tissue, provide topographic alignment in complex wounds [2], and promote timely nerve regeneration. Unfortunately, nerve regeneration occurs at only approximately 1 mm/day, which results in lengthy recovery when the injury site is far from the neuromuscular junction [3]. This is exacerbated when microsurgical repair of a nerve fails (up to 40% of cases [4]), resulting in permanent muscle atrophy, weakness, paralysis, and/or the formations of painful traumatic neuromas.
According to Sunderland, nerve injury can be classified in five classes depending of the injury severity [5,6]. The first class, or neurapraxia, is characterized by demyelination typically from compression. The next three classes describe varying degrees of axonotmesis, or axonal injuries in which the epineurium remains intact, but the surrounding connective tissue and/or fascicular arrangement may be damaged. Finally, the fifth class, or neurotmesis, represents complete transection of the nerve including the epineurium. Nerve repair mechanisms differ depending on the injury severity and Sunderland class. For example, remyelinating processes dominate nerve recovery in neurapraxia injuries. In contrast, collateral sprouting from surviving axons following axonotmesis may bring nerve reinnervation to distal region in instances where less than 30% of the axons are damaged, while sprouting across the injury site may be the dominate mode of regeneration in injuries where a majority of the axons are damaged (e.g., neurotmesis) [6,7].
Current methods for peripheral nerve assessment include electromyography (EMG) and nerve conduction studies (NCS) [8], but neither can discriminate subtle injuries from uninjured nerves, nor partial from complete transections. They also provide limited information for sensory axons and cannot quantify nerve recovery prior to muscle reinnervation [9]. Furthermore, both modalities are painful and invasive. This leaves clinicians without tools to monitor nerve regeneration throughout the recovery process, resulting in delayed management and increased risk of permanent sensorimotor deficits. As a result, there is a need for new methodologies capable to accurately evaluate nerve regeneration following surgical repair.
Diffusion tensor imaging (DTI) is a magnetic resonance imaging (MRI) method that measures the effect of tissue barriers on the apparent diffusion of water molecules, thereby providing information on tissue features at the microstructural level [10]. In nerves, axons have an ordered arrangement, resulting in an apparent diffusivity that is faster along the axons than perpendicular to them, or anisotropic diffusion [11–13]. Indices can be derived from DTI measurements that quantify this anisotropy, including fractional anisotropy (FA = 0 – 1, higher values represent higher anisotropy), axial diffusivity (AD, representing diffusivity along the axis of the axons), radial diffusivity (RD, represents the diffusivity perpendicular to axons that is modulated by myelin and axonal density [14]), mean diffusivity (MD, represents the mean value of the diffusivity in all directions), and the direction of the principal eigenvector (V1, represents local fiber orientation [13]). Given the high sensitivity of diffusion MRI methods to axonal microstructure, there has been significant interest in developing DTI methods that can measure nerve degeneration/regeneration in animal models [15–20]. For example, we previously demonstrated that DTI indices can 1) differentiate crush injuries (remyelinating recovery) from complete transections (regeneration sprouting from the site of injury) and 2) predict behavioral recovery over time. [15,16,21]
While previous studies demonstrated a relationship between DTI indices and both pathological and functional outcomes in fully transected nerves [18–21], these methods have not been systematically evaluated in surgically repaired nerves as a function of injury severity. Here we developed a controlled partial nerve transection injury model aimed to test the ability of high-resolution DTI to accurately determine axonal disruption and recovery. In this study, we compare the repair mechanisms following injuries dominated by remyelination (crush injury), collateral sprouting from the surviving axons (25% transection), and combinations of collateral sprouting and sprouting from the site of injury (50% and 75% transections). Toward this end, ex vivo MRI was performed in the sciatic nerve of Sprague-Dawley rats at two timepoints after injury and repair: 1) 4 weeks, allowing time for inflammation/edema and Wallerian degeneration to resolve [22] and 2) 12 weeks, allowing for nerve growth with complete regeneration if the repair was successful.
2. Materials and methods
2.1. Ethics Approval
All procedures were approved and reviewed by the Vanderbilt University Medical Center Institutional Animal Care and Use Committee in agreement with the guide for Care and Use of Laboratory Animals to minimize suffering and pain.
2.2. Sciatic Nerve Partial Injury Device:
Figure 1 shows a sample partial cut device, which was designed with Fusion 360 (Autodesk Inc). All devices were manufactured using a Monoprice Maker Ultimate 3D Printer and consisted of 100% polylactic acid plastic. The device consisted of a handle and a transverse portion, where the nerve was placed in a groove. A second narrower groove perpendicular was designed to control the depth of the cut with a scalpel for either 25%, 50% or 75% transections. Devices were sterilized via ethylene oxide prior to use in surgery.
Figure 1.
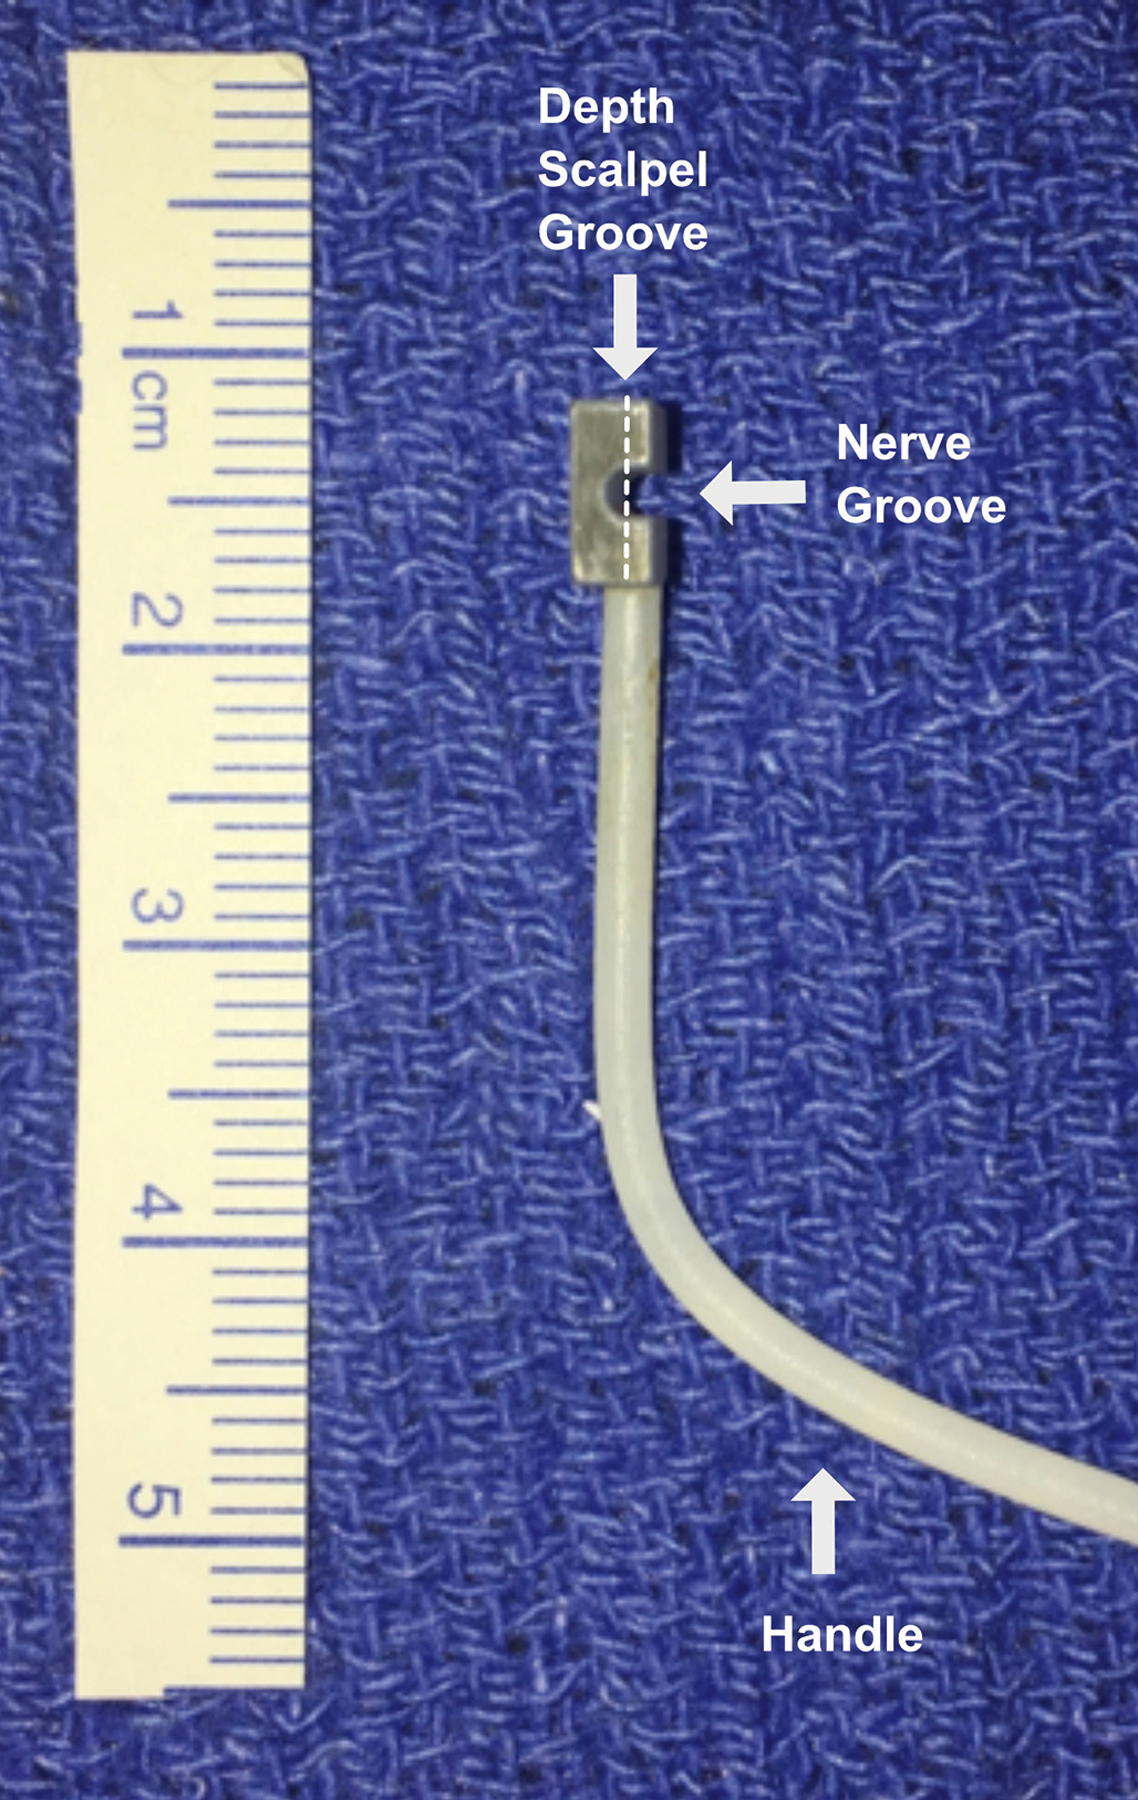
Partial cut device with nerve and scalpel grooves. Different devices where used for each of the three different cut depths. Arrows indicate the nerve groove where the nerve is hold and scalpel groove perpendicular to the nerve orientation used to control the cut depth.
2.3. Experimental Design
Fifty-six Sprague-Dawley rats were randomly assigned to sham surgery (n=9), crush injury (n=12), 25% partial cut and repair (n=12), 50% partial cut and repair (n=12), or 75% partial cut and repair (n=11). For each cohort, samples were harvested at either 4 or 12 weeks after surgery as detailed in Table 1. Behavioral tests included foot fault (FF) asymmetry score and sciatic function index (SFI) and were performed before surgical intervention, three days after, and then weekly until each animal’s endpoint to evaluate recovery following each intervention. A single assessment for each behavioral measurement was collected in each rat at each time point to avoid over-stimulating the animal, which would result in poor performance on these tasks. Assessments were performed as described in previous studies [23] and were performed by the same individual throughout the study to ensure consistency. Behavioral data were grouped by both cut depth and time point regardless of the final endpoint to provide insight into temporal dynamics of the recovery process with each cohort. Following euthanasia, ex vivo MRI scanning and histology were performed in fixed sciatic nerve samples.
Table 1.
Number of rats per injury cohort and timepoint.
| Sham | Crush | 25% | 50% | 75% | |
|---|---|---|---|---|---|
| 4 weeks | 6 | 6 | 6 | 6 | 5 |
| 12 weeks | 3 | 6 | 6 | 6 | 6 |
| Total | 9 | 12 | 12 | 12 | 11 |
2.4. Animal Surgeries
Induction and general anesthesia were performed with a dose of 3 mL/min of 2% Isoflurane. During the procedure, a circulating heating pad was used to prevent hypothermia. A 3-cm skin incision was made from below the ischial notch parallel to the femur’s longer axis on the left hindlimb. Using a split muscle technique, the sciatic nerve was identified and dissected free from the surrounding tissue. Each animal received one of the following: dissection without nerve intervention (sham); application of a Hemostat for 10 seconds (crush injury); or partial transections of 25%, 50%, or 75% achieved with the 3D printed device in Figure 1 and a number 15 stainless steel blade (partial transection). All injuries (crush and partial transections) were performed roughly 1cm proximal to the visible trifurcation of the sciatic nerve. Repair surgery for transected nerves were performed in an end-to-end fashion with interrupted epineurial 9–0 nylon sutures (Ethicon, Somerville, NJ) immediately post-injury. Wounds were closed in two layers using 5–0 Monocryl suture (Ethicon, Somerville, NJ). After surgery, animals were carefully monitored during recovery and provided with daily injections of ketoprofen (5 mg/kg) for 3 days post-operatively. At each endpoint, animals were heavily anesthetized, euthanasia was performed with an intracardiac dose of 120 mg/kg of Euthasol (Virbac AH, Fort Worth, Texas), and sciatic nerves were harvested. All injuries, repair surgeries, euthanasia and nerve harvest within the same cohort were performed by the same person to ensure consistency.
2.5. Tissue Sample Preparation
Harvested nerves were fixed by immersion in 3% glutaraldehyde/2% paraformaldehyde for 24 hrs, washed for a minimum of 1 week in phosphate-buffered saline (PBS) to remove excess fixative, then immersed in 1 mM Gd-DTPA (Magnevist; Berlex, Montville, NJ) at 4 °C for at least 36 hours to reduce spin-lattice relaxation times and corresponding scan times. Samples were trimmed to approximately 1 cm in length with crush and cut/repair regions at the center of each segment. Finally, nerves were placed in 1.75-mm glass capillary tubes filled with a perfluorcarbon solution (Fomblin; Solvay, Thorofare, NJ) to prevent tissue drying without contributing to the proton MRI signal.
2.6. MRI Protocol
To improve throughput, groups of six nerves were arranged parallel to each other and the bore of the magnet in a hexagonal pattern and scanned simultaneously. Diffusion-weighted MRI data were acquired at bore temperature (≈20° C) using a 7-T, 16 cm bore Bruker Biospec console (Rheinstetten, Germany) and a 25-mm quadrature radio-frequency coil (Doty Scientific, Columbia, SC) for transmission and reception. Images were acquired with a three-dimensional diffusion-weighted spin-echo sequence and the following parameters: field-of-view ≈ 6 × 6 × 16 mm3 (adjusted to fit sample), resolution = 125 × 125 × 372 μm3, TE/TR = 22/425 ms, gradient pulse duration/diffusion time (δ/Δ) = 4/12 ms, b-value = 0 and 2000 s/mm2, 20 diffusion directions, uniformly distributed over a sphere, number of averaged excitations = 2, and scan time ≈ 7–10 hours for each b-value (depending on the field-of-view).
2.7. MRI Analysis
Diffusion tensors were estimated on voxel-wise basis using a weighted linear least-squares estimation [24] in MATLAB 2017b (Mathworks, Natick, MA). Slices were oriented perpendicular to the primary nerve orientation and reions-of-interest (ROI) were drawn manually in each nerve to calculate mean ROI values in each slice (i.e., slice-wise) for FA, MD, RD, and AD. FA values were then used to manually classify regions as proximal to injury, within zone of injury, or distal to injury [15]. In the distal region, the 4–5 slices immediately distal to the injury site (~ 2 mm) were included in the study to capture the effects of axonal sprouting.
Fiber tracking was additionally performed for visualization purposes using ExploreDTI [25]. This analysis excluded superficial voxels to prevent partial volume effects in our measurements. Four seeds were placed for tracking: 1) the second most proximal slice, 2) the region immediately proximal to the injury site 3) the region immediately distal to the injury site, and 4) the second most distal slice. For seed point selection, voxels outside the range FA=0.2–1.0 were excluded. In addition, fiber tracts were terminated at points where 1) FA was less 0.2 or 2) the angle between consecutive steps along the tract exceeded 15°.
2.8. Histology
Following MRI scanning, harvested nerves were post-fixed in 3% glutaraldehyde/2% paraformaldehyde for 24 hrs, counterstained with 1% OsO4 solution, dehydrated through increasing concentrations of ethanol, and then embedded in resin at 60° for 72 hours. Embedded specimens were sectioned at 500 nm and stained with 1% toluidine blue. Digital images of sections were acquired on an Olympus C-35AD-4 microscope. The entire cross-section was imaged at 10X and additional 40X images (3 each) were captured from representative healthy and injured regions. Using Image-Pro plus 7.0 software, healthy and injured area measurements were quantified from 10X images. Axons within each 40X image were counted manually using the count tool in Photoshop CS5 Extended Edition and density (number/mm2) measurements were calculated for healthy and injured areas. Axon counts were calculated by multiplying axon density by healthy and injured areas calculated from 40X images and then summing the average total axons for the two regions.
2.9. Statistical Analysis
All statistical analyses were performed using R version 3.6.1 (R Foundation for Statistical Computing, Vienna, Austria). For each injury type (sham, crush, partial cuts 25%, 50% and 75%), differences between timepoints were assessed using an unpaired Mann-Whitney U test. All p-values were adjusted for the effect of multiple comparisons using a false discovery rate approach [26]. Correlations between DTI parameters and histologically derived axon densities and behavioral indices were quantified via Pearson’s correlation coefficient.
In a previous study [15], we developed a probabilistic model or nerve recovery and found that FA = 0.53 separates nerves with high recovery probability from low recovery probability nerves. In the current study, we applied this model to analyze the different repair mechanisms: i) remyelination (crush injury), ii) collateral sprouting from the surviving axons (25% transection) injury, and iii) combination of collateral sprouting and regenerative sprouting from the site of injury comprised (50% and 75% transection). More specifically, to provide insight into the likelihood of recovery of each injury, we estimated the slice-wise percentage of voxels above this FA threshold.
3. Results
Figure 2 shows the longitudinal behavioral data (FF and SFI) for each cohort based in the type of injury (sham, crush, 25% cut, 50% cut and 75% cut). From this, it can be seen that sham injury mildly affected the rats during the first two weeks after injury, which is most likely attributed to inflammation and edema. In contrast, crush injuries resulted in larger functional deficits. A substantial portion of the rats apparently recovered by four weeks (first MRI time point), and a complete recovery was observed by 12 weeks (second MRI time point). Partial cut injuries resulted in similar overall trends, but with a delayed and incomplete apparent recovery relative to crush injuries. It should be noted, however, that a large amount of variability was observed in the functional recovery of the partially cut nerve, which is consistent with the high failure rate of nerve repairs. [4]
Figure 2.

Mean longitudinal behavioral data after sham (grey lines), crush (red lines) and 25%, 50% and 75% partial cut/repair injuries (light blue, blue, dark blue) with corresponding standard error (shaded area). Results are shown for both foot-fault asymmetry score (left panel) and Sciatic Functional Index (SFI) (right panel). Note the sharp decrease in FF and SFI for both cohorts immediately after surgery. Note the two recovery time points at 4 and 12 weeks indicated with arrows correspond to the two MRI scans. These results indicate a faster behavioral recovery following crush and 25% partial injuries relative to 50 and 75% partial cut injuries. Observe how at 12 weeks FF index is close to 0 (full recovery) within standard error while in SFI 50% and 75% are far from full recovery.
Diffusion tensor fiber tracts for crush and partial cuts (25%, 50% and 75%) are shown in Figure 3, with color-coding for FA, the product of V1 and FA (FEFA), and fiber track length. Fiber length maps indicated an inverse relationship between cut-depth and the fiber length, while FEFA maps (color indicates fiber track orientations and brightness is scaled with FA) demonstrated a reduction in fiber coherence at the injury site. In addition, an inverse relationship was observed between FA and cut depth at the injury site; and FA values distal to the injury site were reduced relative to proximal regions consistent with previous reports [15,20].
Figure 3.
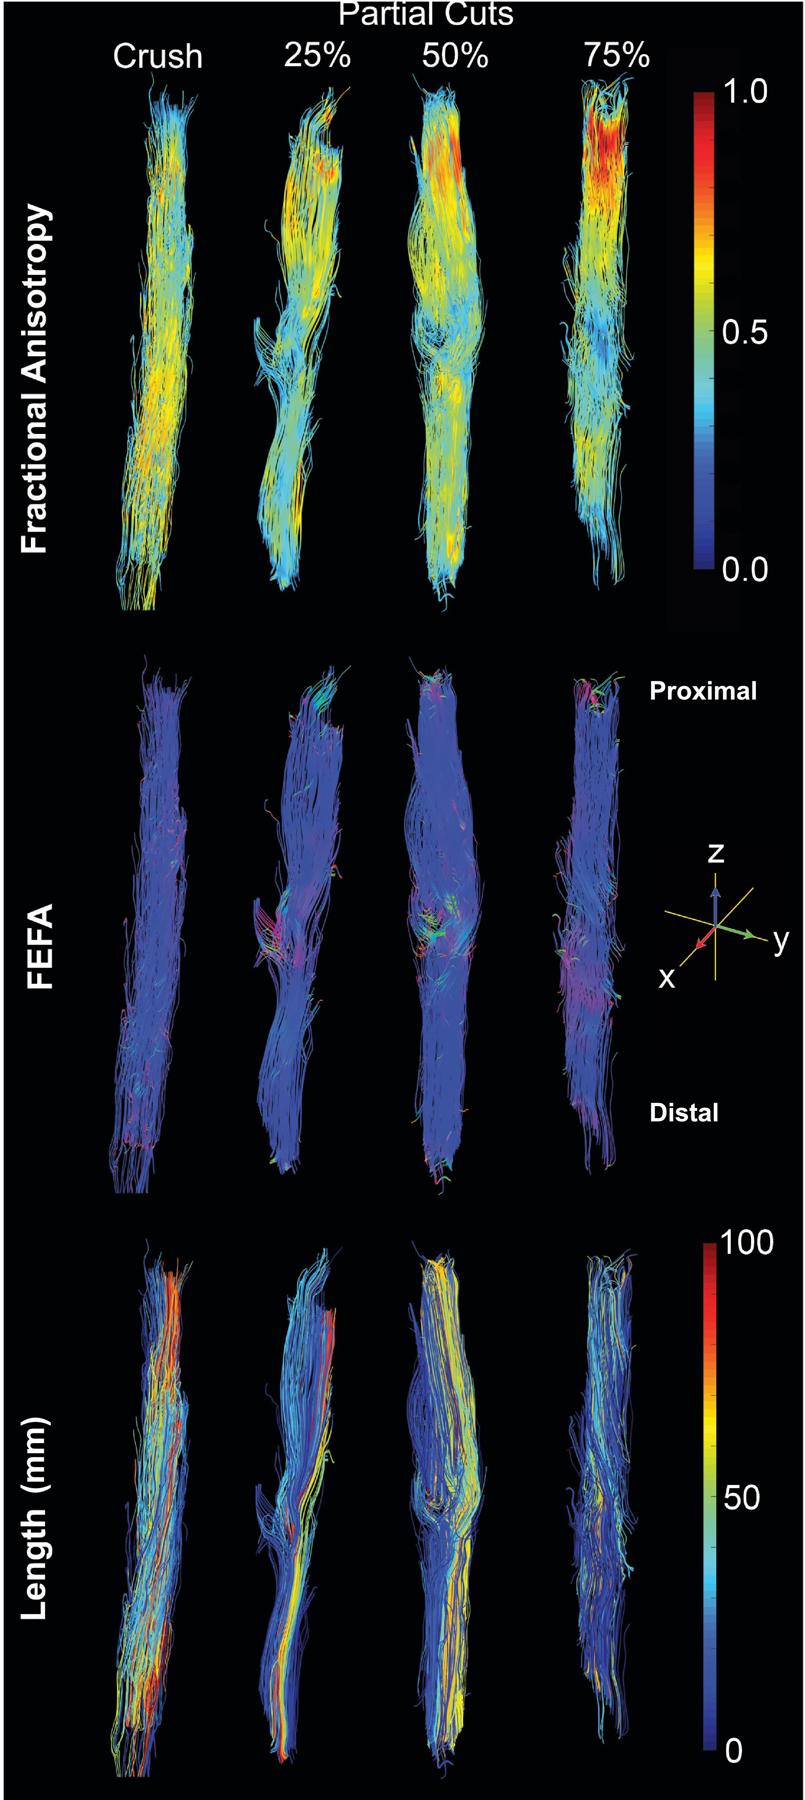
Representative tractography from crush and partial cut nerve (25%, 50% and 75%) 4 weeks after injury. Color-coded tracks of FA (top), FEFA (V1*FA) (middle) and track length (bottom) shown. Notice the drops in FA and changes in FEFA values at the injury sites in partial cuts while crush nerves do not display these changes.
A more comprehensive analysis of DTI findings is given in Figure 4, which plots voxel-wise DTI parameters (FA, RD and AD) distal to injury site. Evolution of the recovery process is indicated with split violin plots separated at 4 weeks (purple) and 12 weeks (yellow) and mean, median, mode and variance of these distributions are included in Table 2. Relative to crush and sham, mean, median and the most frequently observed FA value, or mode, at 4 weeks decreased with increased cut depth (Table 2). By week 12, the three partial cuts showed elongated FA distributions (see bimodal distribution for 25% cut and variance in Table 2), most likely representing regions with high recovery probability or regenerated (high FA values) and degenerated or low recovery probability axons (low FA values) and the mode increased with cut depth. In contrast, crush and sham depict narrower FA distributions (lower variances) and higher mode values indicative of apparent full recovery.
Figure 4.

Split violin plots of A) FA, B) RD, C) AD for sham, crush, and partial cuts nerves at 4 (left, purple) and 12 weeks (right, yellow). Note that while significant differences were observed for all cohort/indices across the two times, this does not tell the complete story given the heterogeneous apparent recovery observed in the partial cut samples at 12 weeks (broad distributions shown in the violin plots). Bimodal distribution in AD appears for all three types of partial injuries but not in sham or crush. RD bimodal distribution is not present in 25% injury (collateral nerve recovery). Dotted line indicates boundary between high probability of recovery to low probability of recovery (FA = 0.53).
Table 2.
Mean, Median, Mode and Variance of, FA, RD and AD distributions.
| Timepoint 4_weeks | Timepoint 12_weeks | |||||||||
|---|---|---|---|---|---|---|---|---|---|---|
| FA | Sham | Crush | Partial_25% | Partial_50% | Partial_75% | Sham | Crush | Partial_25% | Partial_50% | Partial_75% |
| Mean | 0.643 | 0.559 | 0.460 | 0.445 | 0.343 | 0.676 | 0.677 | 0.462 | 0.515 | 0.468 |
| Median | 0.673 | 0.570 | 0.454 | 0.449 | 0.326 | 0.685 | 0.709 | 0.421 | 0.504 | 0.461 |
| 1 Mode | 0.720 | 0.560 | 0.510 | 0.500 | 0.210 | 0.810 | 0.690 | 0.430 | 0.520 | |
| 2 Modes | 0.18/0.73 | |||||||||
| Variance | 0.021 | 0.023 | 0.041 | 0.025 | 0.024 | 0.017 | 0.030 | 0.077 | 0.044 | 0.052 |
| RD | ||||||||||
| (μm 2 /ms) | ||||||||||
| Mean | 0.450 | 0.368 | 0.451 | 0.481 | 0.769 | 0.323 | 0.378 | 0.364 | 0.293 | 0.370 |
| Median | 0.438 | 0.358 | 0.437 | 0.484 | 0.791 | 0.325 | 0.332 | 0.227 | 0.289 | 0.362 |
| 1 Mode | 0.300 | 0.400 | 0.440 | 0.480 | 0.850 | 0.300 | 0.370 | 0.010 | ||
| 2 Modes | 0.01/0.44 | 0.01/0.43 | ||||||||
| Variance | 0.026 | 0.022 | 0.052 | 0.044 | 0.103 | 0.012 | 0.054 | 0.136 | 0.058 | 0.071 |
| AD | ||||||||||
| (μm 2 /ms) | ||||||||||
| Mean | 1.504 | 0.972 | 0.920 | 0.954 | 1.290 | 1.189 | 1.340 | 0.666 | 0.600 | 0.754 |
| Median | 1.540 | 0.971 | 0.963 | 0.984 | 1.336 | 1.244 | 1.343 | 0.657 | 0.648 | 0.776 |
| 1 Mode | 1.650 | 0.950 | 1.080 | 1.040 | 1.130 | 1.290 | 1.430 | |||
| 2 Modes | 0.03/0.88 | 0.05/0.95 | 0.04/0.90 | |||||||
| Variance | 0.106 | 0.044 | 0.111 | 0.123 | 0.279 | 0.055 | 0.069 | 0.244 | 0.181 | 0.204 |
Crush and sham injuries display similar distribution patterns for RD and AD at 4 and 12 weeks, meanwhile, partial cuts display broader and bimodal distributions at 12 weeks. This distribution patterns suggests a more heterogeneous environment due to a combination of pathological features that affect diffusion both perpendicular (RD) and parallel (AD) to the axons. At 12 weeks, Table 2 shows that the first mode (lower AD and RD) of the three partial cut injuries have similar values independent of the injury depth. Second mode in RD (higher values) has similar value for 50% and 75% cut and it is non-existent in 25% cut injuries. On the other side, AD displays a second mode with similar values for all three injuries.
Table 3 displays mean, median and variance of the ratio of high recovery probability (FA>0.53) to low recovery probability (FA<0.53) voxels distal to the injury site for each cohort and time. As expected, significant differences (p = 1.0) were not observed for sham (median = 88.1% at 4 weeks compared to mean = 89.5 % at 12 weeks) since these nerves were fully recovered at 4 weeks (Fig 4). In contrast, crush nerves exhibited a significant increase in the ratio of voxels with high recovery probability (p = 0.04) with the median (4 weeks) = 56.6% and the median (12 weeks) = 83.8%, once again in agreement with figure 4. Looking at partial cut injuries, the medians of the ratio of voxels with high recovery probability (34.4%, 26.7% and 10.1%) decreased with increasing cut depth (25%, 50% and 75%) at 4 weeks; however all three partial injuries displayed a similar level of high recovery probability (median(25% cut) = 39.9% with variance(25% cut)=189.0; median(50% cut) = 38.1% with variance(50% cut)=339.4 and median(75% cut) = 37.7% with variance(75% cut)=61.8) by 12 weeks after surgery. Apparent recovery from 4 to 12 weeks was not highly significant in the case of 25% transected nerves (p = 1.0) but was significant for 50% and 75% transections (p = 0.04 and p = 0.02, respectively).
Table 3.
Ratio of high recovery probability (FA>0.53) to low recovery probability (FA<0.53) voxels distal to the injury site for each cohort. Mean, Median and Variance for each time point (4- and 12 weeks) is calculated and P values between both timepoints within each cohort is also included (last row)
| Sham | Crush | Partial Cut | ||||||||
|---|---|---|---|---|---|---|---|---|---|---|
| 25 % | 50 % | 75 % | ||||||||
| Timepoints (weeks) | 4 | 12 | 4 | 12 | 4 | 12 | 4 | 12 | 4 | 12 |
| Recovered Pixels (%) | ||||||||||
| Mean | 85.8 | 88.7 | 56.7 | 86.0 | 35.5 | 34.9 | 26.3 | 44.3 | 10.0 | 36.4 |
| Median | 88.1 | 89.5 | 56.6 | 83.8 | 34.4 | 39.9 | 26.7 | 38.1 | 10.1 | 37.7 |
| Variance | 222.7 | 14.4 | 487.5 | 139.1 | 94.8 | 189.0 | 16.1 | 339.4 | 40.0 | 61.8 |
| P value | 1.00 | 0.04 | 1.00 | 0.04 | 0.02 | |||||
Figure 5 shows representative partial cut histological sections of the distal region at 4 and 12 weeks. Black boxes in the lower resolution images (10X) mark where the higher resolution images (40X) were acquired. Regions represented in the 40X images were chosen because they showed both undamaged/intact mature axons, as well as regions with new axonal sprouts in each sample. In all the 40X images, undamaged mature axons were identified by their large diameter and dense myelin staining, an example of which is identified via a black arrow in the 25% cut/repair samples at 4 weeks. Immature sprouting axons were identified as axons that were small, more circular, and had either very little or no myelin surrounding them (see white arrow in the same sample).
Figure 5.

Representative distal toluidine blue stained sections at 4 weeks (top panes) and 12 weeks (bottom panel) after each injury type. Black boxes in the 10x (lower resolution) mark the 40x (higher resolution) images and scale bars in the 10x are 200 μm and in the 40x are 50 μm. Note the 40x images contain regions of both mature undamaged axons (black arrow) and immature sprouts axons (white arrow) at 12 weeks. The difference between the mature/immature regions is more pronounced for 50% and 75% transected samples.
Quantitative analysis of the axonal densities for the partial injuries at 4 and 12 weeks are shown in Figure 6. Based on these characteristics, the axonal densities at 4 weeks for the 25% transected samples was mostly the same at the high recovery probability/healthy region than at the low recovery probability region even when there are significant differences (p = 0.04). However, at 12 weeks, the axonal density at the low recovery probability region is significantly larger than the high recovery probability/healthy region (p = 0.005). Observations for the 50% transected samples at 4 weeks, shows no significant differences (p = 0.23). At 12 weeks, while the distribution of the axonal densities at the low recovery probability region has a larger range with larger axonal densities, the differences are not significant (p = 0.095). Furthermore, the margin between the two types of axons (where mature/immature axons meet) is less well defined. At 12 weeks, these 50% transected samples showed more mature sprouted axons, which were larger in size. For the more severely injured 75% transected samples, the margin between mature and immature was even less well-defined, yet the axonal density of newly sprouted axons was similar to that of 25% transected samples (p = 0.22). However, looking at 75% transected samples at 12 weeks, a denser population of maturing axons was observed. This can be seen as a very elongated axonal density distribution at the low recovery probability region even when the statistical differences between both tissues are not significant (p = 0.18).
Figure 6.

Split violin plots of axonal densities of partial cuts nerves: healthy (red) and injured (blue) tissues at 4 and 12 weeks. Note that while significant differences were observed only in partial cuts 25% deep at 12 weeks post injuries, this does not tell the complete story given the heterogeneous distribution observed in the other partial cut samples at 12 weeks (broad distributions shown in the violin plots). Values of larger axonal density above 0.02 appear at 12 weeks for injured regions for all three types of partial injuries.
Correlations between RD in distal nerves and the resulting histological-derived measures of axon density are shown in Figure 7 Note the significant correlation between RD axons of low recovery probability and axon density (RD high recovery probability: r = −0.44, p = 0.002) and the weaker, non-significant trend in axons of low recovery probability (RD low recovery probability : r = 0.31, p = 0.09). Correlations between the percentage number of voxels recovered (FA ≤ 0.53) at 4 and 12 weeks and behavioral measures are shown in Figure 8. Note the significant correlations between the percentage number of voxels with high recovery probability and SFI at 4 weeks (r = 0.61, p = 0) and at 12 weeks (r = 0.56, p = 0.009), which serves to further validate this model.
Figure 7.

Linear correlations between RD parameters and cross-sectional axon densities. Results are shown for all timepoints (encoded via marker shape) and injury type (encoded via marker color). Significant correlations were observed between RD and axon density in healthy tissues, while the relationship between RD and axon density (injured column) was not as significant. The Pearson’s correlation coefficient (r) and corresponding p-value is given in each panel.
Figure 8.

Linear correlations between DTI-derived percentage region high probability of recovery and behavior (SFI and FF) for the timepoints 4 and 12 weeks. Significant relationships were observed across sham (purple), crush (blue), 25% partial cut (dark green), 50% partial cut (light green) and 75% partial cut (yellow) at 4 and 12 weeks. The Pearson’s correlation coefficient (r) and corresponding p-value is given in each panel. Notice that at 12 weeks, no significant relationship between FF and percentage of voxels with FA>0.53 was found.
4. Discussion
The findings herein indicate that high-resolution DTI of ex vivo rat sciatic nerve yields viable biomarkers of peripheral nerve recovery following partial transection and surgical repair. In addition, the heterogeneity of DTI indices in these samples suggests different nerve recovery mechanisms (collateral sprouting and sprouting from the site of injury) associated with injury severity. This can be observed in the violin density plots distributions (Fig 4) at 12 weeks after injury and repair. Our previous study [15] defined a probabilistic classifier that identifies successful from unsuccessful nerve repairs in fully transected injuries. The model indicates that high recovery probability cut/repair nerves had values above the FA threshold = 0.53 for most distal slices. Substitution of full transected injuries for partial injuries results in some parts of the distal region undergoing Wallerian degeneration and posterior regeneration while other parts remain healthy and unchanged instead of Wallerian degeneration along the whole cross section that took place in full transected injuries. Applying this threshold to the partially transected nerves herein (Fig 4 A, dashed horizontal line), we can evaluate whether FA distributions within each cohort were indicative of high probability of recovery. For example, narrow density distributions of FA values above the threshold indicate healthy nerves in the sham cohorts at both 4 and 12 weeks. In crush nerves, FA distributions were broad at 4 weeks, while a narrow density distribution above the threshold was observed at 12 weeks consistent with previous studies [5,15,16,18,19,21,27], which may be indicative of remyelination during recovery. In contrast, FA distribution values of partially cut nerves exhibited elongated density distributions with a range of low and high FA values that may indicate a mixture of healthy (undamaged), regenerated (sprouting), and non-regenerated tissues in agreement with our histological analysis (Fig 5).
Within the group of transected nerves, a bimodal distribution was observed for the 25% injury cohort at 12 weeks. We postulate that this bimodal distribution is related to the existence of two types of tissues located in the distal region—healthy undamaged axonal tissue and new axonal tissue due to lateral sprouting mechanism—as can be seen in the histology slide in Figure 5 (white and black arrows). In contrast, 50% and 75% transected injuries did not exhibit bimodal FA distributions at 12 weeks (Fig 4), which is consistent with histological findings in these samples (Fig 5) where axon diameters and packing were more homogenous at 12 weeks. This result suggests that the added effect of sprouting from the site of injury in the 50% and 75% cut samples is reflected with an increase of FA measurements in the mid-range near the FA threshold, which results in a broad unimodal distribution rather than the bimodal distribution observed in the 25% cohort.
Based on a relatively direct relationship between RD/AD and FA [15,28] we can conclude that if the ratios between RD and AD remain constant, FA will also remain constant. The smaller diameter sprouting axons appear to relate with the lower mode in AD and RD density distributions, as both sham and crush injuries do not display this lower second mode. As seen in Figure 4C and 4D at 12 weeks, this may correspond to regions with high FA values that represent axons with high probability of recovery. Finally, correlations between RD values and axonal density in Figure 7 seem to support the role of sprouting axons in increasing axonal density and lowering RD values at 12 weeks.
Looking at the slice-wise percentage of voxels above the FA threshold (Table 3) it can be seen that sham nerves were classified as almost fully recovered at 4 and 12 weeks using this approach. Meanwhile, approximate 50% of voxels in crush nerves were indicative of high probability of recovery at 4 weeks, while almost 100% of voxels in crushed nerves indicated high probability of recovery by 12 weeks. Interestingly, even when all three partially cut injuries showed lower ratios of voxels with high probability of recovery at 4 weeks, all three partial injuries displayed a similar level of partial apparent recovery by 12 weeks after surgery. This outcome seems to result from the different types of repair mechanisms in 25% transections (collateral sprouting) compared to 50% and 75% transections (collateral sprouting plus sprouting across the site of injury). Furthermore, our study indicates that apparent recovery from 4 to 12 weeks is larger with deeper cuts. In transections 25% deep the DTI nerve recovery shows no significant improvement (p = 1.0), while deeper cuts 50% and 75% transections result in a substantially more significant DTI derived apparent recovery (p = 0.04 and p = 0.02) as indicated in Table 3. In agreement, at 12 weeks axonal densities distributions are larger with the depth of the injury, indicating the existence of larger differences in axonal sizes characteristics of axonal sprouting.
Previous studies [15,27] have shown that sham, crush and cut/repaired nerves are characterized by similar FA values the proximal to the injury sites at 4 and 12 weeks post-injury, while distal FA values were highly correalted with behavioral findings and histology. As a result, this work focuses on the region immediately distal to site of nerve injury, where Wallerian degeneration and sprouting effects can be observed in tissue not directly damaged by trauma. By our first time point (4 weeks post-injury), Wallerian degeneration has completed and inflammation has largely subsided. At this point, axonal sprouting begins, which has been shown to alter FA [17][22]. This suggests that the observed changes in FA herein are largely driven by this sprouting (collateral, terminal, or some mix).
We found that the cross section of the distal region undergoing degeneration increased with transection depth. This effect is seen by MRI as a lower percentage of high probability of recovery/healthy voxels as a function of the injury severity 4 weeks after injury (Table 3). Similarly, a larger injury means a larger number of sprouting axons may begin filling the distal region, with some portion of them reaching the end plate. Thus at 12 weeks, the percentage of voxels with high probability of recovery/healthy was found to be proportional to the injury depth (Table 3). Independent of the injury severity, similar apparent recovery levels at 12 weeks can be seen and are validated with: i) similar behavioral indices (Figure 2) and ii) similar DTI derived percentage of voxels with high probability of recovery (Table 3). Curiously, only 25% injured nerves demonstrated significant differences in axonal density (p = 0.005), indicating that the collateral sprouting mechanism yield a higher axonal density compared with terminally sprouted axons from the region of injury. In other words, we postulate that limitations in the number of regenerative collaterals along with the aforementioned morphological differences between sprouting axons may explain the MRI results herein. [30]. This effect can be seen in the histology images (Figure 5), where we observed sprouted axons surrounding healthy axons, even when the injury was localized to one side of the nerve.
Although promising, the study herein has several limitations. First, this study has limited ability to directly compare histology images (2D) with MRI (3D). Future studies would need 3D histology and MRI for improved validation of the models. These histological images could also analyze separately the different properties of each types of tissue (axonal size, axonal density, and levels of myelination) and how these microstructural tissue features related to the observed DTI findings. Second, MRI was performed in fixed tissues, which alters diffusivities and our ability to directly translate the absolute diffusivities reported herein to fresh tissues. Previous studies [31] have indicated that FA in fresh and fixed tissues values for normal or damage tissue can suffer of changes up to 10%. Third, the current study investigated a cross-section of samples at 4 and 12. Future studies should focus on additional longitudinal in vivo measurements to evaluate the predictive ability of our DTI-based predictions of nerve recovery.
5. Conclusions
In conclusion, while variations in axonal size, density and level of myelination related to maturity of newly sprouted axons have been previously studied, [32–35] the effect of these features on DTI indices has not been fully characterized. We observed that FA distributions following partial cut and repairs may distinguish pure collateral sprouting from combinations of the last and sprouting from the region of injury. Future work will focus on validation via in vivo longitudinal studies and comparison to 3D histology. Clinically, for some ballistic and crush injuries, it can be difficult to determine which patients will require surgical repair. Delays in repair can lead to suboptimal outcomes. Our data imply that we can detect cases with significant nerve injury at the 4 week timepoint. This could allow earlier intervention and better overall long-term function.
Source of funding
This work was supported by U.S. Army Medical Research and Materiel Command, Contract Number W81XWH-15-JPC-8/CRMRP-NMSIRA, Grant number: MR150075 (WPT) and by NIH/NINDS R01 NS97821 (RDD).
Abbreviations
- EMG
electromyography
- NCS
nerve conduction studies
- FF
foot fault
- SFI
asymmetry score and sciatic function index
Footnotes
Publisher's Disclaimer: This is a PDF file of an unedited manuscript that has been accepted for publication. As a service to our customers we are providing this early version of the manuscript. The manuscript will undergo copyediting, typesetting, and review of the resulting proof before it is published in its final form. Please note that during the production process errors may be discovered which could affect the content, and all legal disclaimers that apply to the journal pertain.
Competing
The authors declare no competing interests.
Submission declaration
This paper was original research. Neither the entire paper nor any part of its content has been accepted elsewhere.
Data availability
The data related to the current study will be made available from the corresponding author upon reasonable request.
References
- [1].Noble J, Munro CA, Prasad VSSV, Midha R. Analysis of upper and lower extremity peripheral nerve injuries in a population of patients with multiple injuries. J Trauma Inj Infect Crit Care 1998;45:116–22. doi: 10.1097/00005373-199807000-00025. [DOI] [PubMed] [Google Scholar]
- [2].Moore AM, Wagner IJ, Fox IK. Principles of nerve repair in complex wounds of the upper extremity. Semin Plast Surg 2015;29:40–7. doi: 10.1055/s-0035-1544169. [DOI] [PMC free article] [PubMed] [Google Scholar]
- [3].Ovalle F, Patel A, Pollins A, De La Torre J, Vasconez L, Hunt TR, et al. A simple technique for augmentation of axonal ingrowth into chondroitinase-treated acellular nerve grafts using nerve growth factor. Ann Plast Surg 2012;68:518–24. doi: 10.1097/SAP.0b013e3182380974. [DOI] [PubMed] [Google Scholar]
- [4].Vastamaki M, Kallio P, Solonen K. The Results of secondary microsurgical repair of ulnar nerve injury. J Hand Surg Am 1993;18B:323–6. [DOI] [PubMed] [Google Scholar]
- [5].Wood MD, Kemp SWP, Weber C, Borschel GH, Gordon T. Outcome measures of peripheral nerve regeneration. Ann Anat 2011;193:321–33. doi: 10.1016/j.aanat.2011.04.008. [DOI] [PubMed] [Google Scholar]
- [6].Campbell WW. Evaluation and management of peripheral nerve injury. Clin Neurophysiol 2008;119:1951–65. doi: 10.1016/j.clinph.2008.03.018. [DOI] [PubMed] [Google Scholar]
- [7].Zochodne D, Levy D Nitric Oxide in Damage, Disease an Repair of the Peripheral Nervous System. Cell Mol Biol 2005;51:255–67. doi: 10.1002/pmic.201500224. [DOI] [PubMed] [Google Scholar]
- [8].Han D, Lu J, Xu L, Xu J. Comparison of two electrophysiological methods for the assessment of progress in a rat model of nerve repair. Int J Clin Exp Med 2015;8:2392–8. [PMC free article] [PubMed] [Google Scholar]
- [9].Grant Gerals A. M.D.; Goodkin Robert M.D.; Kliot MM. Evaluation and Surgical Management of Peripheral Nerve Problems. Neurosurgery 1999;44:825–39. [DOI] [PubMed] [Google Scholar]
- [10].Beaulieu C The basis of anisotropic water diffusion in the nervous system - A technical review. NMR Biomed 2002;15:435–55. doi: 10.1002/nbm.782. [DOI] [PubMed] [Google Scholar]
- [11].Pasternak O, Sochen N, Gur Y, Intrator N, Assaf Y. Free water elimination and mapping from diffusion MRI. Magn Reson Med 2009;62:717–30. doi: 10.1002/mrm.22055. [DOI] [PubMed] [Google Scholar]
- [12].Alexander AL, Lee JE, Lazar M, Field AS. Diffusion Tensor Imaging of the Brain. Neurotherapeutics 2008;4:316–29. [DOI] [PMC free article] [PubMed] [Google Scholar]
- [13].Mori S, Zhang J. Principles of Diffusion Tensor Imaging and Its Applications to Basic Neuroscience Research. Neuron 2006;51:527–39. doi: 10.1016/j.neuron.2006.08.012. [DOI] [PubMed] [Google Scholar]
- [14].Song SK, Sun SW, Ju WK, Lin SJ, Cross AH, Neufeld AH. Diffusion tensor imaging detects and differentiates axon and myelin degeneration in mouse optic nerve after retinal ischemia. Neuroimage 2003;20:1714–22. [DOI] [PubMed] [Google Scholar]
- [15].Manzanera Esteve IV, Farinas AF, Pollins AC, Nussenbaum ME, Cardwell NL, Kang H, et al. Probabilistic Assessment of Nerve Regeneration with Diffusion MRI in Rat Models of Peripheral Nerve Trauma. Sci Rep 2019;9. doi: 10.1038/s41598-019-56215-2. [DOI] [PMC free article] [PubMed] [Google Scholar]
- [16].Lehmann HC, Zhang J, Mori S, Sheikh K a. Diffusion tensor imaging to assess axonal regeneration in peripheral nerves. Exp Neurol 2010;223:238–44. doi: 10.1016/j.expneurol.2009.10.012.Diffusion. [DOI] [PMC free article] [PubMed] [Google Scholar]
- [17].Beaulieu C, Does MD, Snyder RE, Allen PS. Changes in water diffusion due to Wallerian degeneration in peripheral nerve. Magn Reson Med 1996;36:627–31. doi: 10.1002/mrm.1910360419. [DOI] [PubMed] [Google Scholar]
- [18].Stanisz GJ, Midha R, Munro C a, Henkelman RM. MR properties of rat sciatic nerve following trauma. Magn Reson Med 2001;45:415–20. doi: [pii]. [DOI] [PubMed] [Google Scholar]
- [19].Morisaki S, Kawai Y, Umeda M, Nishi M, Oda R, Fujiwara H, et al. In vivo assessment of peripheral nerve regeneration by diffusion tensor imaging. J Magn Reson Imaging 2011;33:535–42. doi: 10.1002/jmri.22442. [DOI] [PubMed] [Google Scholar]
- [20].Takagi T, Nakamura M, Yamada M, Hikishima K, Momoshima S, Fujiyoshi K, et al. Visualization of peripheral nerve degeneration and regeneration: Monitoring with diffusion tensor tractography. Neuroimage 2009;44:884–92. doi: 10.1016/j.neuroimage.2008.09.022. [DOI] [PubMed] [Google Scholar]
- [21].Boyer RB, Kelm ND, Riley C, Sexton KW, Pollins AC, Shack RBB, et al. 4.7-T diffusion tensor imaging of acute traumatic peripheral nerve injury 2015;39:1–9. doi: 10.3171/2015.6.FOCUS1590. [DOI] [PMC free article] [PubMed] [Google Scholar]
- [22].Gaudet AD, Popovich PG, Ramer MS. Wallerian degeneration: Gaining perspective on inflammatory events after peripheral nerve injury. J Neuroinflammation 2011;8:110. doi: 10.1186/1742-2094-8-110. [DOI] [PMC free article] [PubMed] [Google Scholar]
- [23].Nguyen L, Afshari A, Kelm ND, Pollins AC, Shack RB, Does MD, et al. Engineered Porcine-derived Urinary Bladder Matrix Conduits as a Novel Scaffold for Peripheral Nerve Regeneration. Ann Plast Surg 2017;78:328–34. doi: 10.1016/j.str.2015.01.010.DNA-damage-inducible. [DOI] [PMC free article] [PubMed] [Google Scholar]
- [24].Veraart J, Sijbers J, Sunaert S, Leemans A, Jeurissen B. Weighted linear least squares estimation of diffusion MRI parameters: Strengths, limitations, and pitfalls. Neuroimage 2013;81:335–46. doi: 10.1016/j.neuroimage.2013.05.028. [DOI] [PubMed] [Google Scholar]
- [25].Leemans A, Jeurissen B, Sijbers J, Jones D. ExploreDTI: a graphical toolbox for processing, analyzing, and visualizing diffusion MR data. Proc 17th Sci Meet Int Soc Magn Reson Med 2009;17:3537. [Google Scholar]
- [26].Benjamini Y, Hochberg Y. Controlling the False Discovery Rate: A practical and Powerful Approach to Multiple Testing. J R Stat Soc Ser B 1995;57:289–300. doi: 10.2307/3866483. [DOI] [Google Scholar]
- [27].Farinas AF, Manzanera Esteve IV, Pollins AC, Cardwell NL, Kaoutzanis C, Nussenbaum ME, et al. Diffusion Magnetic Resonance Imaging Predicts Peripheral Nerve Recovery in a Rat Sciatic Nerve Injury Model. Plast Reconstr Surg 2020;145:949–56. doi: 10.1097/prs.0000000000006638. [DOI] [PMC free article] [PubMed] [Google Scholar]
- [28].Hasan KM, Narayana PA. Retrospective measurement of the diffusion tensor eigenvalues from diffusion anisotropy and mean diffusivity in DTI. Magn Reson Med 2006;56:130–7. doi: 10.1002/mrm.20935. [DOI] [PubMed] [Google Scholar]
- [29].Esteve Manzanera IV, Farinas AF, Pollins AC, Nussenbaum ME, Cardwell NL, Kang H, et al. Probabilistic Assessment of Nerve Regeneration with Diffusion MRI in Rat Models of Peripheral Nerve Trauma. Sci Rep 2019;9. doi: 10.1038/s41598-019-56215-2. [DOI] [PMC free article] [PubMed] [Google Scholar]
- [30].Yin XF, Kou YH, Wang YH, Zhang PX, Zhang DY, Fu ZG, et al. Morphological study on the collaterals developed by one axon during peripheral nerve regeneration. Artif Cells, Nanomedicine Biotechnol 2014;42:217–21. doi: 10.3109/21691401.2013.800082. [DOI] [PubMed] [Google Scholar]
- [31].Sun SW, Liang HF, Xie M, Oyoyo U, Lee A. Fixation, not death, reduces sensitivity of DTI in detecting optic nerve damage. Neuroimage 2009;44:611–9. doi: 10.1016/j.neuroimage.2008.10.032. [DOI] [PubMed] [Google Scholar]
- [32].Liu P, Zhang Z, Liao C, Zhong W, Li P, Zhang W. Dynamic Quantitative Assessment of Motor Axon Sprouting after Direct Facial-Hypoglossal End-To-Side Neurorrhaphy in Rats. J Reconstr Microsurg 2018;34:436–45. doi: 10.1055/s-0038-1636539. [DOI] [PubMed] [Google Scholar]
- [33].Konofaos P, Bassilios Habre S, Wallace RD. End-to-Side Nerve Repair: Current Concepts and Future Perspectives. Ann Plast Surg 2018;81:736–40. doi: 10.1097/SAP.0000000000001663. [DOI] [PubMed] [Google Scholar]
- [34].Kim JK, Chung MS, Baek GH. The origin of regenerating axons after end-to-side neurorrhaphy without donor nerve injury. J Plast Reconstr Aesthetic Surg 2011;64:255–60. doi: 10.1016/j.bjps.2010.04.033. [DOI] [PubMed] [Google Scholar]
- [35].Zigie Z, Johnson Elizabeth O, Soucacos Panayotis N. Overview of the short- and long-term quantitative outcomes following end-to-side neurorrhaphy in a rat model. Injury 2020:10–4. doi: 10.1016/j.injury.2020.02.052. [DOI] [PubMed] [Google Scholar]
Associated Data
This section collects any data citations, data availability statements, or supplementary materials included in this article.
Data Availability Statement
The data related to the current study will be made available from the corresponding author upon reasonable request.