

Abstract
Tumor microenvironment is a special environment for tumor survival, which is characterized by hypoxia, acidity, nutrient deficiency, and immunosuppression. The environment consists of the vasculature, immune cells, extracellular matrix, and proteins or metabolic molecules. A large number of recent studies have shown that not only tumor cells but also the immune cells in the tumor microenvironment have undergone metabolic reprogramming, which is closely related to tumor drug resistance and malignant progression. Tumor immunotherapy based on T cells gives patients new hope, but faces the dilemma of low response rate. New strategies sensitizing cancer immunotherapy are urgently needed. Metabolic reprogramming can directly affect the biological activity of tumor cells and also regulate the differentiation and activation of immune cells. The authors aim to review the characteristics of tumor microenvironment, the metabolic changes of tumor‐associated immune cells, and the regulatory role of metabolic reprogramming in cancer immunotherapy.
Keywords: cancer therapy, immunity, metabolism, tumor microenvironment
Metabolic reprogramming is the basis of tumor microenvironment, which consists of cellular and extracellular components. The cellular components are mainly composed of hematopoietic immune cells (For example, TAMs, tumor‐associated macrophages; TILs, tumor‐infiltrated lymphocytes; TADCs, tumor‐associated dendritic cells; TANKs, tumor‐associated natural killer cells) and resident stromal cells. The extracellular components are mainly composed of extracellular matrix and cell‐secreted factors. The interaction between cancer cells and interstitial cells in the tumor microenvironment regulates tumorigenesis and progression.
1. INTRODUCTION
The transformation from normal cells to neoplastic cells is widely believed to be due to DNA mutations, which causes loss of susceptibility to the tumor immune microenvironment. 1 Under normal circumstances, such cells are quickly cleared by the immune system. However, the failure of immunosurveillance leads to the progression from neoplasia to cancer. 2 , 3 , 4 During this process, tumor cells evade the recognition and elimination of the immune system by regulating their own antigen processing and presentation machinery. Finally, cancerous cells continue to mutate in order to continuously escape immune surveillance, and eventually form tumors. 5
Actually, cancer cells do not simply evade the immune surveillance by themselves. Cancer cells can also create an immunosuppressive microenvironment to regulate surrounding cells, which not only facilitates tumor growth, but also further promotes tumor immune escape. 6 This microenvironment also called “Tumor Microenvironment” (TME) 7 (Figure 1). The TME refers to the networks of cells and structures that surround tumor cells. Apart from the tumor cells, the TME includes surrounding vasculature, the extracellular matrix, other nonmalignant cells (immune cells, cancer‐associated fibroblasts, etc), and signaling molecules (cytokines, growth factors, hormones, etc.). 7 The TME is not only closely related to the occurrence, growth, and metastasis of tumors, but also has a great impact on the treatment of tumors. 6 , 8 , 9 In this review, we focus on the characteristics and composition of the TME, and summarize the metabolic changes of immune cells in the TME and their effects on cancer immunotherapy.
FIGURE 1.

Components of the TME. The TME consists of cellular and extracellular components. The cellular components are mainly composed of hematopoietic immune cells (TAMs, T cells, B cells, NK cells, DCs, and MDSCs) and resident stromal cells (CAFs, ECs, etc). ECM and cell‐secreted proteins such as cytokines and growth factors constitute the extracellular components. The interaction between cancer cells and interstitial cells in the TME regulates tumorigenesis and progression
Abbreviations: CAFs, cancer‐associated fibroblasts; DCs, dendritic cells; ECs, endothelial cells; ECM, extracellular matrix; MDSCs, myeloid‐derived suppressor cells; NKs, natural killer cells; TAMs, tumor‐associated macrophages.
2. CHARACTERISTICS OF THE TUMOR MICROENVIRONMENT
The formation of the TME mainly depends on tumor metabolism. 10 A common feature of tumor metabolism is in order to further consolidate their advantages, tumor cells competitively plunder the nutrients in the microenvironment, and finally promote the tumor malignant progression. 11 , 12 In this perspective, we summarize the characteristics of the TME into the following four aspects: (a) poor nutrient, (b) high acidity, (c) hypoxia, and (d) immunosuppressive microenvironment (Figure 2). Almost all TME have the above four characteristics, and investigation of the antecedents and consequences of the formation of the TME under these features may advance tumor research and improve clinical treatment.
FIGURE 2.
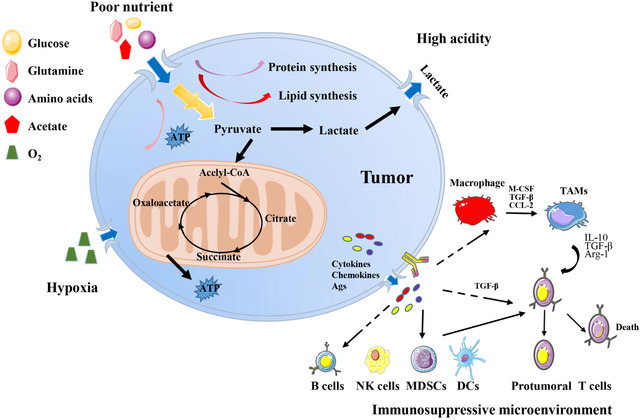
Characteristics of the TME. Tumor cells uptake a large sum of nutrients (glucose, amino acids, etc) from TME for substance and energy demands, resulting a nutrient‐poor environment. Cancer cells take aerobic glycolysis to produce and release lactic acid, making an acidity environment. Tumor cell‐derived cytokines, chemokines, metabolites, and antigens reprogram interstitial immune cells, forming an immunosuppressive environment, characterized by M2‐like TAMs, Tregs, MDSCs, and so forth. Rapid proliferation of tumor cells and the immaturity of tumor vasculature lead to hypoxia
2.1. Poor nutrient
In order to maintain their energy requirements related to survival and progression, cancer cells must continuously acquire nutrients from the TME, including two basic nutrients for tumor survival: glucose and glutamine. 13 German physiologist, Otto Heinrich Warburg, firstly discovered that cancer cells perform glycolysis to provide energy even in the presence of sufficient oxygen, also known as the Warburg effect. 14 Detection of the uptake of a radioactive fluorine‐labeled glucose analog, 18F‐fluorodeoxyglucose (18F‐FDG), by cells based on the Warburg effect has been successfully used in clinic. 15 In the 1950s, American scientist Harry for the first time discovered the high demand of glutamine for the proliferation of cancer cells. 16 Glutamine plays an important role in the biosynthesis of nucleotides, glucosamine‐6‐phosphate, and amino acids. 17 , 18 And 18F‐labeled glutamine tracer has also recently be shown to be promising in preclinical and early clinical studies, especially for brain tumors in which the use of 18F‐FDG is not feasible. 19 , 20 In addition, cancer cells have high demand for almost all nutriments, including lipids and amino acids in the TME, 13 leading to a lack of sufficient nutrition for tumor interstitial cells. These changes may ultimately promote the malignant growth and proliferation of tumors. 21 It has been demonstrated that insufficient glucose in the TME impairs T cell antitumor activity. 22 , 23 , 24 , 25 , 26 Low‐glycemic tumor microenvironments have been found to decreased T cell viability, which are associated with the low expression of zeste methyltransferase enhancer homolog 2 (EZH2) and decreased glycolytic function. 27 Researchers also found that the glycolytic rate of natural killer (NK) cells was low in the microenvironment of lung cancer, which further weakened its cytotoxicity and cytokine production. 28
2.2. High acidity
Tumor cells take up a large amount of glucose in the TME for aerobic glycolysis to generate energy for their own use. 29 Meanwhile, it also secretes a large amount of lactic acid, resulting in a hypoglycemic and acidic TME. 30 , 31 Low PH in the TME impairs the function of tumor mesenchymal cells, especially immune cells, leading to immunosuppression. 32 , 33 For example, lactic acids promote tumor‐associated macrophage M2 polarization and tumor malignant progression through the lactate‐MCT‐HIF1α axis as a critical signaling cascade. 34 The low‐pH condition of the TME prevents the regeneration of NAD+, which acts as an important reductive equivalent, in T cells, and push the mitochondrial tricarboxylic acid cycle (TCA) forward to produce ATP, ultimately inhibiting the function of T cells and cytokines production. 31 Recently, Gao et al proposed a novel intracellular/extracellular lactic acid depletion strategy, also called PMLR nanosystem. They constructed a hollow, MnO2‐catalyzed nanosystem loaded with the lactate oxidase and a glycolytic inhibitor, and coated with red blood cell membrane for lactate consumption and synergy antitumor metabolism and immunity therapy. 35 PMLR nanosystem effectively inhibits tumor growth by blocking ATP production, and also significantly depletes lactic acid in TME, thus activating natural immunity and in situ cellular immunity. 35 Importantly, this effective TME regulation strategy activates local tumor immunity to improve the therapeutic effect of checkpoint blocking therapy, and overcomes the systemic toxicity caused by immunoagonists. 35
2.3. Hypoxia
Oxygen is necessary for cell metabolism to regulate biochemical reactions within cells. 36 The rapid and uncontrolled proliferation of tumors leads to inadequate blood supply and hypoxia in TME, a characteristic of almost all solid tumors. 36 , 37 , 38 Hypoxia generally refers to the area with the oxygen levels less than 2%. 39 Although the rapid proliferation of tumors stimulates angiogenesis, the irregular distribution of new tumor blood vessels causes imbalanced tissue oxygenation capacity of capillaries, eventually leading to the generation of permanent or temporary hypoxic areas of the tumor. 40 As tumors growing, they gradually adapt to hypoxia by utilizing hypoxia‐inducible factor 1α (HIF‐1α) to resist chemotherapy, radiotherapy, or immunotherapy. 41 In the meanwhile, tumors develop a more aggressive and treatment‐resistant phenotype, which is closely related to the poor prognosis of patients. 41 , 42 In addition, hypoxia in the TME also affects the surrounding cells, especially the immune cells. 43 Hypoxia not only promotes the death of immune effector cells and reduces the generation and release of cytokines (such as CD8+T cells 44 and NK cells 45 , 46 ), but also supports the generation of immunosuppressive cells (including regulatory T [Treg] cells 47 and M2‐like macrophages 34 , 43 ) and promotes the production and secretion of immunosuppressive cytokines. Studies have shown that reducing hypoxia by breathing high oxygen can promote the increase of T cell infiltration and the secretion of pro‐inflammatory cytokines, which can improve tumor regression and survival in mice. 48 Recently, Wu et al found that hypoxia in the TME promotes the enrichment of triggering receptor expressed on myeloid cells‐1 (TREM‐1)+ macrophages in tumors, recruits C‐C Motif Chemokine Receptor 6 (CCR6)+ Treg cells through C‐C Motif Chemokine Ligand 20 (CCL20), and indirectly leads to the dysfunction and apoptosis of CD8+T cells, ultimately resulting in the formation of immunosuppressive microenvironment and resistance of PD1 blockade. 49
2.4. Tumor immunosuppressive microenvironment
The formation of tumor immunosuppressive microenvironment depends on the coordination of multiple immune cells, including M2‐like tumor‐associated macrophages (TAMs), 50 Treg cells 51 myeloid‐derived suppressor cells (MDSCs), 52 and so on. The chemokine CCL2 released during tumor growth promotes the infiltration of a large number of monocytes into the tumor by acting on the monocyte surface receptor CCR2. 53 Interleukin‐4 (IL‐4) secreted by tumor cells and CD4+ T cells polarizes TAMs to an M2 phenotype and enhances tumor cell growth, invasion, and metastasis. 50 TAMs also express a series of immune suppressor molecules and promote the formation of an immunosuppressive microenvironment. For example, TAMs express the major histocompatibility complexes HLA‐E and HLA‐G, which bind to CD94 and Ig‐like transcript 2 (ILT2) on the surface of NK cells and T cells, respectively, and inhibit their activation. 54 Additionally, TAMs secrete cytokines such as IL‐10 and transforming growth factor‐β (TGF‐β) to inhibit the activity of CD4+ T cells and CD8+ T cells and mediate the proliferation of Treg cells, and finally maintain the tumor immunosuppressive microenvironment. 55 Moreover, vascular endothelial growth factor (VEGF), granulocyte‐macrophage colony‐stimulating factor (GM‐CSF), TGF‐β, CCL2, interferon gamma (IFN‐γ), IL‐6, IL‐10, and IL‐1β in the TME also promote MDSC infiltration into tumors. MDSCs produce high levels of nitric oxide (NO), arginine (Arg)‐1, and IL‐10, which inhibit antigen‐specific and nonspecific T cell responses. The MDSCs also promote the recruitment of Treg cells by secreting CCL3, CCL4, and CCL5. 52 , 56 , 57 Taken together, in the TME, along with the great suppression of immune killer cells, recruitment and activation of immunosuppressive cells is conducive to the immune escape of tumor cells and promotes tumor progression.
3. MAJOR IMMUNE CONSTITUENTS OF THE TUMOR MICROENVIRONMENT
3.1. Tumor‐associated macrophages
TAMs account for the largest proportion (up to 50%) of myeloid infiltrate in most human solid malignancies. 50 The high heterogeneity of TAMs is not only found in different cancer patients, but also in different malignant lesions and specific tumor lesions of the same patient. 58 In the TME, especially in malignant tumors with a high degree of progression, most TAMs tend to be M2 polarized, which is closely related to tumor growth, invasion, and metastasis; the construction of an immunosuppressive microenvironment; and the poor prognosis of patients. 59 , 60 However, little is known about how TME regulates metabolic changes in TAMs. Here, we review the metabolic changes of TAMs and their possible applications in the treatment of malignant tumors.
3.2. Glucose metabolism
To date, it is generally believed that proinflammatory M1 macrophages are mainly characterized by enhanced glycolysis and attenuated TCAs, and are generally considered to have strong antitumor activity. 61 Anti‐inflammatory M2 macrophages, however, show complete TCA and enhanced fatty acid oxidation, which promote tumor progression. 50 Interestingly, TAMs enhance aerobic glycolysis, and exhibit a mixed phenotype of M1 and M2, with increased expression of pro‐inflammatory cytokines and chemokines, Arg1, IL4Ra, and M2 macrophage‐associated cytokines, which may be mediated to some extent by tumor‐derived lactate via Akt/mTOR signaling. 62 TAMs promote blood vessel formation, enhance tumor cell extravasation, and induce epithelial‐mesenchymal transition, ultimately causing tumor invasion and metastasis, which could be disrupted by the inhibition of glycolysis with 2‐deoxyglucose. 58 However, mTOR inhibition as a therapeutic target in cancer weakens TAM glycolysis in the hypoxic area, causing abnormal vascular structure and further promoting metastasis, which limits the use of this therapy. 63 In contrast, it's also reported that oxidative phosphorylation is elevated in thyroid carcinoma‐primed macrophages through measurement of oxygen consumption rates, suggesting that oxidative phosphorylation is still intact despite of a broken TCA. 64 Given the high heterogeneity of glucose oxidation in TAMs, more specific studies on the TAM subsets are needed in future.
3.3. Lipid metabolism
Activated macrophages also exhibit changes in lipid metabolism. M2 macrophages usually show strong fatty acid oxidation, which may be driven by activation of signal sensors, such as transcriptional activator 6 and peroxisome proliferator‐activated receptor gamma coactivator‐1 beta (PGC‐1β) in response to IL‐4 treatment. 65 IL‐4‐activated macrophages exhibit increased triglyceride uptake through CD36 and enhanced FAO to supply cellular energy. 66 , 67 In contrast, lipopolysaccharide‐stimulated macrophages show enhanced synthesis of fatty acid and triglyceride, with an induction of pro‐inflammatory cytokines. 68 In addition, enhancement of FAS is required for the augment of phagocytosis in monocytes. 69
In the TME, TAMs also change their lipid metabolism to adapt to environmental changes. TAMs enhance the biosynthesis, uptake, or storage of fatty acids, and exert the pro‐ or antitumor effects depending on special lipid metabolism‐associated cytokine prodiction. 70 , 71 For example, TAMs highly express epidermal fatty acid binding protein (E‐FABP), which promotes the formation of lipid droplets and IFN‐β production, thereby inhibiting tumor progression by enhancing the recruitment of tumoricidal effector cells, especially NK cells. 72 However, TAMs also enhance the production of eicosanoids through 15‐lipoxygenase‐2, which promotes the massive production of CCL2 and IL10, eventually leading to immune tolerance. 73
We also systematically describe the regulation of TAM activity by the triglyceride hydrolysis pathway. Colorectal cancer‐associated TAMs have an increase of abhydrolase domain containing 5 (ABHD5), the cofactor of adipose triglyceride lipase, and a decrease of monoacylglycerol lipase (MGLL). ABHD5 in TAMs inhibited the accumulation of reactive oxygen species (ROS), which in turn reduced the production of C/EBPɛ‐dependent spermidine, and ultimately promoted the growth of colorectal cancer. 74 MGLL deficiency in TAMs promotes M2 polarization through the CB2/TLR4 signal axis, inhibits the function of CD8+ T cells, and promotes the malignant progression of tumors. 75 Actually, TAMs are also heterogeneous in lipid metabolism. We demonstrate that ABHD5 was heterogeneously expressed in TAMs. ABHD5‐deficient TAMs facilitate cancer metastasis by promoting the production of matrix metalloproteinases. 76 In short, lipid metabolism of TAMs in the TME is changeable, which in most cases contributes to tumor progression.
3.4. Amino acid metabolism
The most studied amino acid metabolism of macrophages is arginine metabolism. In macrophages, L‐arginine has two main destinations. 77 One is to generate NO through inducible NO synthase (iNOS). NO can suppress the key enzymes between the TCA and electron transport chain to inhibit oxidative phosphorylation, thus promoting glycolysis, which is the key feature of M1 macrophages. On the other hand, Arg‐1 converts L‐arginine into L‐ornithine. L‐Ornithine is further involved in the synthesis of proline and polyamine, 78 , 79 which is helpful for wound healing. 80 This metabolic conversion is an important characteristic of M2 macrophages. In TAMs, decreased iNOS expression results in reduced production of NO, 81 and increased expression of Arg1 may be related to hypoxia and high acidity of the TEM. 82 , 83 Although reduced NO leads to suppressed tumor cytotoxicity, Arg1‐primed TAMs promote M2 polarization and polyamine synthesis, thus enhancing tumor progression. 84 , 85 Furthermore, glutamine and tryptophan (Trp) also play important roles in TAMs. The expression of glutamine transporter and metabolic enzymes are significantly increased in TAM, which is beneficial for M2 polarization. 34 , 86 TAMs upregulate the indoleamine 2,3‐dioxygenase (IDO) and the rate limiting enzyme of Trp and inhibit the tumor immune response, thus promoting the malignant progression of tumors. 87
3.5. T cells
After activation, T cells undergo huge genetic changes in a short period, forming different subpopulations to perform different functions. According to the secretion of cytokines and the expression of related proteins, CD4+ T cells can be divided into Th1, Th2, Th17, follicular helper T (Tfh), and Treg cells. 88 , 89 CD8+ T cells, once activated, are accompanied by a large amount of secretion of IFN‐γ and TNF‐a, and display strong cytotoxicity. 90 However, persistent antigen exposure by tumors causes loss‐of‐function of T cells (eg, exhausted CD8+ T cells), resulting in tumor immune escape. 91 , 92 , 93 The activation and function of T cells must be accompanied by metabolism changes. 94 Here, we focus on studies that highlight links between metabolic and functional changes of T cells in the TME.
3.6. Glucose metabolism
Initially, T cells were thought to be prone to glycolysis after activation. 95 For example, the differentiation of CD4+ T cells and CD8+ T cells is closely related to the activation of mTOR signaling, which is generally believed to promote glycolysis. 96 , 97 Glycolysis also promotes the secretion of IFN‐γ from T cells and enhances the function of CD8+ T cells. 98 Recently, CD4+ cells and CD8+ T cells were found to have varying degrees of dependence on glycolysis and oxidative phosphorylation after activation. 98 Whether pharmacological intervention of glycolysis or mitochondrial respiration inhibits the proliferation of CD4+ T cells and CD8+ T cells requires further studys. 99 , 100 The TME lacking glucose limits the aerobic glycolysis of tumor‐infiltrating T cells, thereby suppressing the tumoricidal effect. 101 For example, low glucose reduces glycolytic flux by inhibiting Akt activity, thereby activating pro‐apoptotic B‐cell lymphoma‐2 (Bcl‐2) family members and inducing T cell apoptosis. 23 , 102 In ovarian cancer, cancer cells limit glucose metabolism by reducing the expression of T cell methyltransferase EZH2, thereby inhibiting T cell function and ultimately promoting tumor progression. 27 In addition, tumor‐specific CD4+ and CD8+ T cells increase phosphoenolpyruvate (PEP) production by overexpressing phosphoenolpyruvate carboxykinase 1 (PCK1), thereby inhibiting sarco/ER Ca2+‐ATPase (SERCA) activity. PEP plays a new role in maintaining T cell receptor‐mediated Ca2+‐NFAT signaling and effector functions, and ultimately inhibits tumor growth. 24 Moreover, acyl glycerol kinase (AGK) promotes glycolysis and antitumor activity of CD8+ T cells by inactivating PTEN and enhancing mTOR activity. 103
3.7. Lipid metabolism
Naive T cells use oxidative phosphorylation to produce energy. Once T cells are activated to become effector cells, they start aerobic glycolysis to maintain their functions. 95 When they become memory cells, they mainly restart to use oxidative phosphorylation, which requires fatty acid oxidation to produce more ATP for their own use. 104 Memory T cells have a larger mitochondrial reserve, also called spare breathing capacity, than the naive T cells. 105 Memory CD8+ T cells showed greater oxygen consumption and significantly enhanced fatty acid oxidation. 106 When CD8+ T cells lack TNF receptor‐associated factor 6, a downstream signaling molecule of the TNF cytokine receptor, memory T cells cannot be formed. 107 Moreover, TRAF6‐deficient T cells show defects in lipid oxidation, as expression of fatty acid metabolism genes is reduced in these cells. 107 Besides, cholesterol metabolism is also highly associated with T cell activity. Yang et al claim that modulation of cholesterol metabolism by targeting the key cholesterol esterification enzyme ACAT1 can largely potentiate the antitumor response of CD8+ T cells. 108
In the TME, increased Treg cells and exhausted CD8+ T cells cause the formation of an immunosuppressive microenvironment. 109 , 110 It has been found that Treg cells depend on lipid metabolism for their survival and function. 111 It has also been reported that two different metabolites of LCA (3‐oxolca and isoalloLCA) regulate T cell function in mice, suggesting that bile acid metabolites directly regulate TH17 and Treg cell balance and host immunity. 112 Recently, Field et al showed that fatty acid‐binding protein‐5 activates the IFN signal in Treg cells, thereby reducing the production of the regulatory factor IL‐10, which ultimately leads to the weakening of the immunosuppressive effect in TME. 111
3.8. Amino acid metabolism
Amino acids play an important role in the maintenance of T cell phenotype and function. For example, IFNAR1, which is inherent in liver cells, inhibits the transcription of metabolic genes including Otc and Ass1, which in turn leads to a decrease in arginine concentration and an increase in ornithine concentration in the circulation, ultimately suppressing the activity of virus‐specific CD8+ T cell. 113 In addition, a recent study found that amino acids enhance mTORC1 signal and Treg cells function through the small G proteins Rag and Rheb. 114 In tumors, the availability of many amino acids is low in the TME, especially glutamine. 17 Previous studies have found that ERK/MAPK‐coordinated regulation of glutamine uptake and metabolism is essential for T lymphocyte activation. 115 Moreover, Trp is heavily utilized by tumor cells, thus resulting in the low concentration of Trp in the TME. 116 However, activated T cell is extremely sensitive to the concentration of Trp in the peripheral environment, which triggers the effector T cell apoptosis. 117 In addition, Kynurenic acid, a metabolite of Trp, acts as a ligand to activate arylhydrocarbon receptor and regulate CD8+ T cells, ultimately suppressing the antitumor immune response. 118 The arginase in tumors and myeloid cells also causes extremely low arginine concentrations in the TME, inhibiting T cell activation and proliferation. 119 For example, a latest study using proteomics, metabolomics, and other big data analysis shows that activated T cells consume large amounts of arginine and rapidly convert it into downstream products. L‐Arginine induces a metabolic shift from glycolysis to oxidative phosphorylation by transcription factors BAZ1B, PSIP1, and TSN, and promotes the survival and proliferation of memory T cells, thus enhancing the tumoricidal effect. 120
3.9. NK cells
The NK cell is an important component of immune system. They are not only related to antitumor, antivirus infection, and immune regulation, but also in some cases participate in the occurrence of hypersensitivity and autoimmune diseases. 121 In recent years, NK cells emerge as an important target for tumor immunotherapy because they kill tumor cells in different ways without the need for prior sensitization. However, hypoxia, high acidity, nutritional deficiencies, and immunosuppression of the TME change the balance between activation and inhibition of NK cells, ultimately limiting the function of NK cells. 122 Moreover, the changes in glucose metabolism of NK cells play an important role in antitumor immunity. 123 , 124 Next, we discuss the metabolic effects of the TME on NK cells and their functional changes.
3.10. Glucose metabolism
The activation of NK cells depends on a wide range of signals through a series of receptors. Activated NK cells rapidly produce IFN‐γ to exert its effector functions, which depends on glycolysis and oxidative phosphorylation to supply energy. 125 , 126 , 127 In addition, NK cells express three types of glucose transporters, GLUT1, GLUT3, and GLUT4, further illustrating the importance of glucose for NK cell activation. 128 , 129 Among these three glucose transporters, the increased expression of GLUT1 promotes glucose uptake and affects NK cell function. 130 Moreover, sterol regulatory element binding proteins (SREBPs) regulate glycolysis and function of NK cells. 131 Therefore, the lack of nutrition, especially glucose, in the TME affects the metabolism of NK cells and their tumoricidal effect. For example, in a mouse lung cancer model, the TME induces glucose metabolism disorder in NK cells, thereby leading to the loss of antitumor activity. In contrast, inhibition of FBP1, which is a key enzyme in the gluconeogenesis pathway and displays abnormally high expression in tumors, restores glycolysis and function of NK cells, ultimately inhibiting tumor progression. 28 In addition, a large amount of TGF‐β in the TME inhibits mTOR, a key molecule that regulates cell metabolism and growth, and suppresses NK cell activity by affecting glucose metabolism. 132 , 133
3.11. Lipid metabolism
The changes in lipid metabolism are one of the most significant metabolic characters in both cancer cells and NK cells. SREBPs are a class of transcription factors that play central roles in lipid metabolism and control the expression of lipid synthesis‐associated genes. 134 It has been found that the stimulation of cytokines (eg, IL‐2 and IL‐12) promoted the expression of SREBPs in NK cells, and might facilitate fatty acid and cholesterol synthesis through Fasn/Scd1 and Hmgcs1/Acat2, respectively. 131 A recent study showed that high levels of cholesterol in the serum accelerate cholesterol accumulation in NK cells, resulting in the formation of lipid raft and the activation of immune signals. These changes ultimately enhance the cytotoxic activity of NK cells and inhibit the progression of liver cancer. 135 Additionally, the metabolism of glycerol and phospholipids also play important roles in the activation of NK cells. 136 , 137 For example, diglyceride kinases (DGKs) control the level of DAG in cells through phosphorylating DAG into phosphatidic acid (PA). And DGKζ‐deficient NK cells release more IFN‐γ and enhance the tumor killing effect through ERK1 signaling. 137 Adiponectin is a highly abundant hormone secreted by adipose tissue, which is involved in the metabolism of glucose and FA, and acts on various types of cells, including NK cells, which express high levels of AdipoRs, through adiponectin receptors 1 and 2 (AdipoR 1 and 2) and T‐cadherin. 138 , 139 Adiponectin might regulate the maturation and activation of NK cells. 139 However, whether these effects are related to lipid metabolism and whether the TME can affect the activation of NK cells through this pathway require further investigation.
3.12. Amino acid metabolism
The utilization of amino acids in NK cells plays a key role in maintaining signaling pathways mediated by metabolic regulators (such as mTOR or cMyc). 140 , 141 For instance, arginine and glutamine affect mTOR signaling, and thus regulate the initial expression of cMyc. cMyc is a transcription factor, which is necessary in IL‐2/IL‐12‐induced metabolic and functional responses of NK cells in mice. 140 In the TME, tumors and tumor‐related cells consume large amounts of amino acids such as arginine, Trp, and glutamine, leading to the accumulation of immunosuppressive metabolites. 142 Among them, NO and L‐kynuric acid, respectively, inhibit the cytotoxic activity and proliferation of NK cells. 143 , 144 Therefore, in order to develop new treatment strategies, further study of the amino acids metabolism of NK cells in the TME and investigation of the correlation between metabolic changes and functions of NK cells are needed.
3.13. Dendritic cells
Dendritic cells (DCs), named for their nerve cell‐like dendritic morphologies, 145 can be divided into bone‐marrow‐derived DCs (BMDCs) and plasmacytoid DCs (pDCs) according to their source, phenotype, and cytokine secretion. 146 After dendritic cells sense pathogen‐associated molecular patterns or damage‐associated molecular patterns through pattern recognition receptors, they are activated from an immature tolerance status to mature immune stimulating phenotypes, and then use MHC Class I or II molecules to activate CD8+ or CD4+ T cells. This process is accompanied by changes in metabolic changes. 147 It has been reported that immature resting BMDCs rely on fatty acid oxidation to perform oxidative phosphorylation in the mitochondrial electron transport chain to meet their energy requirements. 148 Once activated, DCs increase the expression of a variety of molecules involved in antigen presentation, such as MHC molecules, cytokines, etc, 149 which is accompanied by a sudden increase in glycolysis. 150 Here, we discuss recent studies about how tumors manipulate DCs to interfere their homeostasis, and evade immune control by molecular pathways and metabolic changes.
3.14. Glucose metabolism
Activated DCs require high levels of glucose metabolism to meet their substances and energy requirements. 131 , 151 It has been reported that mouse BMDCs rapidly induce glycolysis through PI3k/AKT/mTOR/HIF‐1α signaling cascade after exposure to lipopolysaccharide, increasing the rate of glycolysis and lactic acid production. 152 , 153 Moreover, inhibition of BMDCs using glucose‐deficient media or glycolysis inhibitor, 2‐deoxyglucose, affects their activation and metastasis, including the expression of CD80, CD86, and CCR7, and the secretion of proinflammatory cytokines. 150 , 151 Importantly, the catabolism of prestored glycogen in mouse BMDCs is thought to be a key factor to drive TLR‐activated glycolysis. 154 Thus, metabolic competition and glucose restriction in the TME affect the metabolism and function of DCs. 149 For example, the low availability of glucose may interfere with glucose uptake or metabolism, thereby hindering protein glycosylation in the endoplasmic reticulum of tumor‐associated DCs (TADCs) and triggering an immunosuppressive endoplasmic reticulum stress response. 155 Moreover, rapamycin‐mediated inhibition of mTOR can prolong the lifespan and mitochondrial activity of BMDCs stimulated by lipopolysaccharide, which may be involved in glucose metabolism. 156
3.15. Lipid metabolism
DC maturation mediated by TLR signal requires activation of downstream signal transduction and metabolic changes. De novo lipid biosynthesis is an important metabolic process after BMDCs activation. 157 Early glycolytic bursts after TLR sensing in BMDCs promote the production of citrate and acetyl CoA through TCA, which is a substrate for lipid synthesis. 150 Recent studies have also shown that p32 positively regulates the synthesis of citrate and lipid, ultimately facilitating the maturation and activation of DCs. 158 In contrast, the DCs from solid tumors contain lots of cellular lipid droplets, with a defect in antigen presentation and subsequent T cell activation. 159 A later study have shown that lipid bodies containing oxidatively truncated lipids, but not the lipid bodies in normal cells, block antigen cross‐presentation by DCs in cancer. 160 Inhibition of fatty acid synthesis restore the function of DCs and T cells, thereby inhibiting tumor progression. 160 Thus the regulation of DC activation is a complicated process, involving reprogramming of signal transduction and lipid metabolism. For example, the Wnt signaling can integrate PPARγ‐regulated fatty acid oxidation, driving DC tolerization, Treg recruitment, and immune evasion. 161 Moreover, the retinoic acid derived from vitamin A metabolism also promoted Treg activation and tumor progression. 162
3.16. Amino acid metabolism
Amino acid metabolism is suggested as an important node of immune regulation. 163 , 164 For example, IDO‐1, the rate‐limiting enzyme of kynurenine pathway, catalyzes an essential amino acid L‐tryptophan, leading to Trp depletion and the production of a series of immunoregulatory molecules collectively known as kynurenines. IFN‐γ‐stimulated DCs have an increase of IDO‐1 expression and activity. 165 Thus the effector T cells activated by DCs might suppress DCs’ function as a negative feedback. Actually, IDO‐1 in DCs can be induced by multiple factors, such as TGF‐β, IL‐32, and other cytokines derived from tumor cells, other immune cells, or even the DCs themselves in the TME. 166 , 167 , 168 Those findings integrate the cytokine signals with the Trp metabolism and immune suppression in the TME. Similarly, Arg‐1 is another immunoregulatory enzyme catalyzing the degradation of L‐arginine. A series of Th2 cytokines such as IL‐4, IL‐13, and TGF‐β can induce Arg‐1 expression in myeloid cells, including macrophages and DCs. 169 , 170 Notably, TGF‐β can stimulate IDO‐1 and Arg‐1 expression simultaneously in DCs, indicative of an intensive immune suppression. Moreover, Arg1 activity is absolutely required for IDO1‐dependent signaling events as initiated by TGF‐β. DCs can be conditioned by Arg1+ MDSCs to express an IDO1‐dependent immunosuppressive phenotype. 171 Consistently, arginine‐depleted TADCs inhibit CD8+ T cell proliferation and IFN‐γ secretion. 172 Further investigation of amino acid metabolism in TADCs is extremely important for understanding TADCs activation and developing potential therapeutic strategies.
3.17. Cancer immunotherapy
Cancer immunotherapy is a type of tumor treatment that reactivates the body's antitumor immunity by regulating the immune system. It includes immune checkpoint inhibitors (ICIs), T‐cell transfer therapy, monoclonal antibodies, cancer vaccines, and immune system modulators. 173 , 174 , 175 Immunotherapy appears better than conventional chemotherapy at treating some forms of cancer in patients, especially advanced patients, so it has attracted intensive attentions from researchers in recent years. The positive response of immunotherapy usually relies on the interaction of tumor cells with immunomodulation in the TME. Therefore, the TME plays an important role in suppressing or enhancing the immune response. Understanding the interaction between immunotherapy and the TME is not only the key for analyzing the mechanisms of tumor progression, but it is also of great significance to provide new methods for improving the efficacy of current immunotherapy. Next, we focus on the current types of immunotherapy and their latest developments.
3.18. Immune checkpoint inhibitors
ICIs are monoclonal antibodies that bind to immune checkpoints to stop tumors from inhibiting T cells, including anticytotoxic T lymphocyte antigen‐4 (CTLA‐4), antiprogramed cell death protein 1 (PD‐1), and anti‐PDL‐1. 176 Under normal circumstances, CTLA‐4 and PD‐1 signals are strictly regulated to allow self‐tolerance; however, tumor cells can use these pathways to evade the immune response and establish a microenvironment conducive to tumor growth. 177 , 178 ICIs can reactivate the immune system and prevent tumor immune escape. 179 Currently, a variety of checkpoint inhibitors have been used in a variety of clinical oncology, and achieved good results, especially in melanoma and other malignant tumors. 180 , 181 , 182 , 183 However, a large proportion of patients are either insensitive to ICIs or are burdened by adverse side effects, including dermatologic toxicity, gastrointestinal toxicity (diarrhea or colitis, hepatitis), endocrinopathies (thyroid toxicity, thyroid toxicity), pneumonitis, and rare immune‐related adverse events, during treatments 184 , 185 (Table 1).
TABLE 1.
PD‐1 and PD‐L1 blocking agents in tumor therapy
| Tumor type | Target—antibody | Response rate |
|---|---|---|
| Melanoma | PD‐1—Nivolumab | CR 8.9%, PR 41% 257 |
| CR 4%, PR 30% 258 | ||
| CR 3.3%, PR 28.3% 259 | ||
| PD‐1—Pembrolizumab | CR 5‐6%, PR 27‐29% 260 | |
| CR 2‐3%, PR 19‐23% 261 | ||
| Hodgkin's lymphoma | PD‐1—Nivolumab | CR 14%, PR 55% 262 |
| PD‐1—Pembrolizumab | CR 22%, PR 47% 263 | |
| NSCLC | PD‐1—Nivolumab | CR 0.7%, PR 19.3% 264 |
| CR 1.4%, PR 17.8% 265 | ||
| PD‐1—Pembrolizumab | ORR 18‐19% (PD‐L1 > 1%), 29‐30% (PD‐L1 > 50%) 266 | |
| Hazard ratio 0.53 versus chemotherapy alone 267 | ||
| CR 4%, PR 41% 268 | ||
| PD‐L1—Atezolizumab | OS 12.6 m versus 9.7 m in chemotherapy arm 269 | |
| PD‐L1—Durvalumab | Hazard ratio 0.52 versus placebo 270 | |
| MSI‐H and dMMR CRC | PD‐1—Nivolumab | CR 2.7%, PR 30% 271 |
| Gastric cancer | PD‐1—Pembrolizumab | ORR 13.3% in PD‐L1 positive 272 |
| PD‐1—Nivolumab | ORR 18.7%, DCR 31.2% 273 | |
| Advanced Endometrial Cancer | PD‐1—Pembrolizumab + Lenvatinib | ORR 63.6% 274 |
| HNSCC | PD‐1—Nivolumab | OS 7.5 versus 5.1 m for investigator's choice 275 |
| PD‐1—Pembrolizumab | CR 5%, PR 11% 276 | |
| Urothelial carcinoma | PD‐1—Nivolumab | CR 2.6%, PR 17% 277 |
| PD‐1—Pembrolizumab | ORR 21% 278 | |
| ORR 28.6% 279 | ||
| PD‐L1—Atezolizumab | CR 6.7%, PR 16.8% 280 | |
| CR 5.5%, PR 9.4% 281 | ||
| PD‐L1—Durvalumab | CR 2.7%, PR 14.3% 282 | |
| PD‐L1—Avelumab | CR 5.6%, PR 10.6% (at 6 months follow‐up) 283 | |
| Merkel cell carcinoma | PD‐L1—Avelumab | CR 11.4%, PR 21.6% 284 |
| Gastroesophageal Cancer. | PD‐1—Nivolumab + 5‐Fluorouracil | DCR 73.3%, OS 13.3 m 285 |
| MSI‐H and dMMR solid tumors | PD‐1—Pembrolizumab | ORR 39.6% 286 |
| HCC | PD‐1—Nivolumab | ORR 14.3% 287 |
| nccRCC | PD‐1—Nivolumab | ORR 18.6%, DCR 53.4% 288 |
Abbreviations: CR, complete response; CRC, colorectal cancer; DCR: disease control rate; dMMR, mismatch repair deficient; HCC, hepatocellular carcinoma; HNSCC, head and neck squamous cell carcinoma; MSI‐H, microsatellite instability high; nccRCC, nonclear cell renal cell carcinoma; NSCLC, nonsmall cell lung cancer; ORR, overall response rate; OS, overall survival; PR, partial response.
In order to increase the responsive rate of ICIs, some combination therapies have been developed. Among them, combination of CTLA‐4 and PD‐1 blockers has already proved to be highly effective in clinical trials. 186 In addition, many factors have been identified to cause the insensitivity to ICIs treatment. For example, macrophages are also important in targeting the PD‐1/PD‐L1 axis. Macrophages remove anti‐PD1 antibodies from T cells, attenuating the response of T cells, 187 and meanwhile, express PD1 on their surface, thereby weakening their phagocytic activity. 188 In response to the toxic side effects of ICIs, steroids and immune‐modulating therapy have been reported to have good effects. 189 Tokunaga et al showed that early administration of corticosteroid, rather than late administration of corticosteroid, led to tumor regeneration, suggesting that early administration of corticosteroid inhibited memory CD8+ T cells, which is associated with persistent antitumor responses. 190
3.19. T cell transfer therapy
T cell transfer therapy is an immunotherapy that uses a patient's own immune cells to attack cancer cells. 191 There are two main types: tumor infiltrating lymphocyte (TIL) therapy and CAR‐T cells therapy. 192 , 193 Both methods require collecting immune cells from cancer patients, culturing them in vitro, and then injecting them back into patients via intravenous injection. 194 T cell transfer therapy is also called adoptive cell therapy, adoptive immunotherapy, and immune cell therapy. 195
In TIL therapy, researchers isolated special lymphocytes that can recognize tumor cells, and reinfused to patients to treat tumors after rapid and massive expansion of these cells. 196 Although TIL therapy is effective in some patients with melanoma and has achieved good results in other cancers such as cervical squamous cell carcinoma and bile duct cancer, this treatment is still in the experimental stage. 197 , 198 CAR‐T cell therapy is designed in vitro to make the obtained T cells produce a protein called CAR, also known as a chimeric antigen receptor. 194 CAR can promote T cells to attach to specific proteins on the surface of cancer cells, increasing their ability to attack cancer cells. 194 , 199 CAR‐T is currently used to treat hematological malignancies. 200 , 201
However, CAR‐T cells can induce a large number of adverse side effects. 202 For example, the most common toxic reactions in hematological malignancies are cytokine release syndrome (CRS) and ICANS. 202 Recently, it has been reported that NK cells modified to express anti‐CD19 CAR not only overcome the toxic effect of anti‐CD19 CAR‐T cells, but also respond well to treatment. 203 In addition, Correia et al designed a chemically destroyable heterodimer (CDH), which can be inactivated by small molecule compounds, based on the binding of two human proteins on CAR‐T cells. 204
3.20. Monoclonal antibodies
Monoclonal antibodies are antibodies that bind to specific antigens on cancer cells so that they can be better detected and destroyed by the immune system. 205 Some monoclonal antibodies also help the immune system to fight against cancer cells. 206 , 207 Recently, Yang et al designed tri‐specific antibodies against CD38, CD28, and CD3, which could significantly enhance the activation of T cells and the recognition and killing of tumor cells, and have achieved good results in animal models. 208 In addition to targeting T cells, macrophages are also good effector cells. CD24 has recently been identified to regulate macrophage phagocytic function through siglecl‐10 signaling, affecting tumor progression. 209 CD47 also plays a role in regulating macrophage phagocytosis. 210 Several monoclonal antibodies against CD47, including Hu5F9‐G4 and ALX148, have been shown encouraging data in preclinical trials. 211 , 212
3.21. Others
Cancer vaccines are currently mainly divided into preventive vaccines and therapeutic vaccines. 213 The former ones are used to prevent cancer by preventing and killing certain viral or bacterial infections. For example, cervical cancer vaccine can prevent HPV infection, thus preventing cervical cancer. 214 The latter ones are used to control or kill tumor cells by activating body‐specific immune functions through cancer cell antigens. 213 The first FDA‐approved cancer treatment vaccine is talimogene laherparepvec (T‐VEC), also known as oncolytic virus treatment. 215 The virus can infect cancer cells and normal cells. Normal cells can kill the virus, whereas cancer cells cannot. 216 Recently, Keskin et al have demonstrated that a multi‐epitope, personalized neoantigen vaccination strategy is feasible in the treatment of glioblastoma patients. This strategy has been tested in high‐risk melanoma patients. 217
Immunomodulator is an immunotherapy that enhances the body's immune response to cancer, including cytokines, Bacillus Calmette‐Guerin (BCG), immunomodulatory drugs, and so forth. 218 , 219 , 220 It is generally used to assist other tumor treatments. For example, IL‐2, also known as T‐cell growth factor, increases the number of white blood cells such as NK and T cells in the body, and then causes an immune response to cancers. 221 In a multicenter, randomized phase 3 clinical trial, dinutuximab beta combined with IL‐2 was found to be more effective in treating neuroblastoma than dinutuximab beta alone. 222
4. METABOLISM AND CANCER IMMUNOTHERAPY
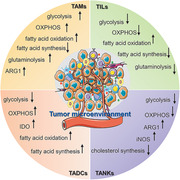
Although a large number of clinical trials of tumor immunotherapy have achieved great success by enhancing host immunity, this is limited to a small number of patients. 184 Increasing evidence indicates that tumor and its interstitial cell metabolic reprogramming plays an important role in tumor immunosuppressive response and resistance to immunotherapy. 142 In the TME, the metabolism of immune interstitial cells is at a disadvantage because tumor cells consume a large amount of nutrients and increase inhibitory signals. 142 At the same time, nutritional deficiencies and metabolic wastes accumulate in TME, leading to metabolic conversion of immune interstitial cells, which impairs their proliferation and function. 223 Therefore, an in‐depth understanding of the metabolic changes in TME and their impact on immune cell metabolism may help to find new and promising ways to rebuild the metabolism of immune cells and thus promote existing immunotherapy. Based on aforementioned introductions, we summarized the main metabolic changes of tumor‐associated macrophages, T cells, dendritic cells, and NK cells (Figure 3). Next, we would conclude the effects of metabolic intervention on tumor cells and immune cells, especially on T cell‐based immunotherapy.
FIGURE 3.
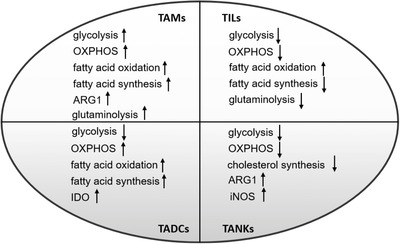
Metabolic changes of tumor‐associated immune cells
Note. “↑” indicates “increase,” and “↓” indicates “decrease.”
Abbreviations: OXPHOS, oxidative phosphorylation; TADCs, tumor‐associated dendritic cells; TAMs, tumor‐associated macrophage; TANKs, tumor‐associated natural killer cells; TIL, tumor‐infiltrated lymphocytes.
4.1. Tumor metabolism and cancer immunotherapy
As we mentioned earlier, in tumors, despite the presence of oxygen, cancer cells still show more glycolysis, because glycolysis is much faster than OXPHOS, which provides cancer cells with a competitive advantage and makes them consume more glucose than surrounding slowly dividing cells and grows under conditions of hypoxia and nutritional deficiencies. 224 Therefore, there have been several drugs targeted at tumor aerobic glycolysis for cancer treatment, including 2‐Deoxyglucose 225 (the inhibitor of GLUT1 and HK), Dichloroacetate 226 (inducing a shift from glycolysis to OXPHOS), and the inhibitor of phosphofructokinase 1. 227 However, these drugs also significantly inhibit T cell function and promote immunosuppression. 228 Therefore, targeting tumors is important for the application of glycolysis inhibitors in tumor therapy. In addition, because a large amount of lactic acid secreted by aerobic glycolysis of cancer cells leads to the formation of acidic immunosuppressive TME, 31 some drugs targeting lactic acid to treat tumors are also being developed, including targeting lactate dehydrogenase (LDH), monocarboxylate transporter (MCT) inhibitors, and oral bicarbonate supplementation. 229 Lenalidomide, a new MCT disruptor, has been found to enhance T cell IL‐2 and IFN‐γ secretion while inhibiting tumor cell proliferation. 230 Diclofenac, a nonsteroidal anti‐inflammatory drug, can inhibit glioma growth, Treg infiltration, and lactic acid secretion. 231 Oral bicarbonate neutralizing lactic acid combined with anti‐PD‐1 immunotherapy can inhibit tumor growth in melanoma model, and combined with adoptive T cell transfer can prolong mouse survival. 232 Recently, Professor Liu and his colleagues proposed a novel intracellular/extracellular lactic acid depletion strategy that can be used in conjunction with immunotherapy to combat tumors. 35 Therefore, the application of targeting lactate should be feasible to improve the effect of immunotherapies.
In addition to glucose metabolism, tumor cells also consume large amounts of amino acids for their own advantage. Therefore, targeting these amino acids (such as L‐arginine, Trp, and glutamine) has broad application prospects in tumor treatment. It has been reported that some malignant tumors lack the arginine succinate synthase, a key enzyme of the urea cycle, causing them to use in vitro amino acids to meet their own growth needs. 233 Therefore, arginine deprivation therapy has been invented and has been used in a variety of tumor treatments, including advanced melanoma, pancreatic tumor, prostate cancer, stromal tumor, hepatocellular carcinoma, and lymphoma. 234 Notably, CB‐1158, an ARG inhibitor, in combination with immunotherapy has achieved good results in clinical trials and can block myeloid‐mediated immunosuppression in the tumor microenvironment. 235 In addition, eliminating IDO to eliminate the role of Trp in tumor promotion and immunosuppression is also a key target for tumor immunotherapy, such as epacadostat 236 and indoximod. 237 The inhibitors of IDO, which can directly inhibit IDO activity to inhibit Trp degradation, enhance cytotoxic T cell function and reduce the number of Tregs, or interfere with Trp degradation signals, and avoiding T cells immunosuppression. 238 Therefore, IDO may also be one of the key targets for immunotherapy. Glutamine is one of the main sources of energy for tumor cells. 17 Glutamine analogs 239 (6‐diazo‐5‐oxo‐L‐norleucine, azaserine, and acivicin) and glutamine transporter inhibitors 240 (gamma‐lglutamyl‐p‐nitroanilide and benzylserine [H‐Ser (Bzl) ‐OH]) have been found to suppress tumor progression in pre‐ and clinical trials. Interestingly, Leone et al found that JHU083, a precursor of DON (the inhibitor of glutaminase), can affect cancer cells without affecting normal cells, making it unable to use glutamine and inhibit tumor progression. 241 At the same time, JHU083 can also enhance antitumor immunity by infiltrating CD8+ T cells, and combined with anti‐PD‐1 treatment showed more significant antitumor effects. 241 In addition to the above mentioned, there are several metabolic interventions in combination with immunotherapy to treat tumors (Table 2)
TABLE 2.
Ongoing trials of metabolic interventions combined with immune‐checkpoint inhibitors
| Pathways | Metabolic agent | Immunotherapy | Cancer types | Study phase | ClinicalTrials.gov references |
|---|---|---|---|---|---|
| Inhibitors of glucose metabolism | Metformin (various effects on glucose levels and metabolism) | Pembrolizumab | Advanced‐stage melanoma | I | NCT03311308 |
| Nivolumab | Unresectable or metastatic NSCLC | II | NCT03048500 | ||
| Glutamine and glutamate pathway inhibitors | CB‐839 | Nivolumab | Advanced‐stage clear cell RCC, melanoma, or NSCLC | I/II | NCT02771626 |
| Trigriluzole | Nivolumab or pembrolizumab (anti‐PD‐1 antibodies) | Metastatic or unresectable solid tumors or lymphom | II | NCT03229278 | |
| Arginine pathway inhibitors | INCB001158 (arginase inhibitor) | Pembrolizumab | Advanced‐stage solid tumors | I/II | NCT02903914 |
| ADI‐PEG 20 (PEGylated arginine deiminase) | Pembrolizumab | Advanced‐stage solid tumors | I | NCT03254732 | |
| Atezolizumab (anti‐PD‐L1 antibody) + pemetrexed and carboplatin | Advanced‐stage NSCLC | I | NCT03498222 | ||
| IDO inhibitors | Epacadostat (INCB024360; IDO1 inhibitor) | Pembrolizumab | Ovarian clear cell carcinoma | II | NCT03602586 |
| Small‐cell lung carcinoma | II | NCT03402880 | |||
| Endometrial carcinoma | II | NCT03310567 | |||
| Gastrointestinal stromal tumors | II | NCT03291054 | |||
| Urothelial cancer | III | NCT03361865 | |||
| HNSCC | II | NCT03325465 | |||
| INCAGN01876 (agonistic anti‐GITR antibody) + pembrolizumab | Advanced‐stage cancers | I/II | NCT03277352 | ||
| Nivolumab | Glioblastoma | I | NCT03707457 | ||
| Linrodostat (BMS‐986205; IDO1 inhibitor) | Relatlimab (anti‐LAG3 antibody) and nivolumab | Advanced‐stage cancers | I/II | NCT03459222 | |
| Nivolumab | Advanced‐stage cancers | I | NCT03335540 | ||
| Indoximod (IDO1 and IDO2 inhibitor) | Pembrolizumab or nivolumab | Advanced‐stage melanoma | II/III | NCT03301636 | |
| Ipilimumab (anti‐CTLA‐4 antibody), nivolumab, or pembrolizumab | Metastatic melanoma | I/II | NCT02073123 | ||
| Navoximod (GDC‐0919 or NLG919; IDO1 inhibitor) | Atezolizumab | Advanced or metastatic solid tumors | I | NCT02471846 | |
| HTI‐1090 (SHR9146; dual IDO1‐TDO inhibitor) | Camrelizumab (SHR‐1210; anti‐PD‐1 antibody) ± apatinib (VEGFR TKI) | Advanced‐stage solid tumors | I | NCT0349163 | |
| LY3381916 (IDO1 inhibitor) | LY3300054 (anti‐PD‐L1 antibody) | Advanced‐stage solid tumors | I | NCT03343613 | |
| Inhibitors of COX enzymes and/or PGE2 signaling | Aspirin (COX1 and/or COX2 inhibitor) or celecoxib (COX2 inhibitor) | BAT1306 (anti‐PD‐1 antibody) | Advanced‐stage MSI‐H/dMMR cancers | II | NCT03638297 |
| Aspirin | Pembrolizumab + clopidogrel (P2Y12 inhibitor) | Recurrent or metastatic HNSCC | I | NCT03245489 | |
| Grapiprant (EP4 antagonist) | Pembrolizumab | NSCLC | I/II | NCT03696212 | |
| Pembrolizumab | Advanced‐stage or progressive microsatellite‐stable CRC | I | NCT03658772 |
Abbreviations: COX, cyclooxygenase; CRC, colorectal cancer; EP4, prostaglandin E2 receptor 4; GITR, glucocorticoid‐induced TNFR‐related protein; HNSCC, head and neck squamous cell carcinoma; MSI‐H/dMMR, microsatellite instability‐high and/or mismatch repair‐deficient; LAG3, lymphocyte activation gene 3 protein; NSCLC, nonsmall‐cell lung carcinoma; P2Y12, P2Y purinoceptor 12.
4.2. T cell metabolism and cancer immunotherapy
Immunotherapy‐mediated enhancement of tumor‐specific T effector cells mostly has transient antitumor effects. Because metabolism plays an important role in homeostasis and adaptation under intracellular and extracellular stimulation, the combination of metabolism‐targeting drugs with immunotherapy may form a more promising treatment. This may promote the production of T memory cells with enhanced activity and plasticity in order to differentiate the effector cells when re‐exposed to cancer antigen.
Recent evidence suggests that both checkpoint ligation and inhibition may directly alter the metabolism and characteristics of T cells and cancer cells. For example, the binding of PD‐1 to its ligand can affect TIL metabolism by inhibiting glycolysis and upregulating FAO. 242 Similarly, the signals received by CTLA‐4 and B7 can inhibit glycolysis. 242 In addition, purely targeted metabolism may affect multiple immune cell populations and may have unpredictable results on systemic antitumor effects. For example, effector T cell proliferation and differentiation depend on FAS, and FAO is essential for the development of CD8+ T cell memory cells and the differentiation of CD4+ Treg cells. 243 , 244 Therefore, it is extremely important to explore more reasonable therapeutic methods of targeted metabolism combined with immunotherapy. It has been reported that targeting AGK in CD8+ T cells can enhance glycolytic metabolism levels to promote antitumor activity of CD8+ T cells. 103 Similarly, Zhang et al also found that in the face of TME with low oxygen and low glucose, T cells lack glucose supply and mainly carry out fatty acid metabolism capacity. Moreover, the use of PPARα agonists not only enhances the fatty acid metabolism and anti‐tumor function of T cells, but also enhances the therapeutic effect in combination with PD‐1 inhibitors. 245 These all provide new ideas for how to target T cell metabolism and regulate its antitumor function.
In addition to the abovementioned, adenosine 5′‐monophosphate‐activated protein kinase (AMPK), as a key molecule in the regulation of biological energy metabolism, is also a key target molecule in the regulation of tumor immune metabolism. 246 Metformin, an AMPK activator, can promote the differentiation of CD8+ memory T cells and may protect cell apoptosis and enhance antitumor effects. 247 At the same time, metformin can also enhance the antitumor effect of PD1/CTLA‐4 blockade by reducing tumor hypoxia. 248 , 249 However, similar studies have found that metformin can promote the formation of Treg cells and inhibit Th1 and Th17, reducing the effect of tumor treatment. 244 Therefore, because of the characteristics of cancer and the type of immune cells that dominate TME in each cancer type, the therapeutic effects obtained by targeting AMPK are also different. Solving this problem may also be a good immune metabolic target for tumor treatment point.
Similarly, improving metabolic impairment caused by immunotherapy through metabolic regulation is also a method. PD1/PDL‐1 can inhibit mitochondrial function of T cells, and then affect its activity. 250 Moreover, mitochondrial metabolites ROS have also been shown to activate CD4+ and CD8+ T cells. 251 And it has been found that mitochondrial activating chemicals (ROS precursors or mitochondrial uncouplers) and PD‐1 block synergistically enhance T cell‐dependent antitumor activity. 252 However, because targeting mitochondria often leads to strong toxic and side effects, this requires further investigation.
4.3. Others
We mentioned above that not only exhausted CD8+ T cells and Treg cells, but M2 TAM, TADC, and NK cells also participate in the formation of immunosuppressed TME. Therefore, it is important to explore these metabolic changes in immune cells and their impact on immunotherapy. TAMs account for the largest proportion of tumor interstitial immune cells and must undergo certain metabolic reprogramming to survive in the tumor microenvironment. At present, metabolic reprograming of TAMs to promote their transition to M1 type has become an important antitumor strategy for targeting macrophages. 50 Our previous research has found that the key molecules that regulate the fatty acid metabolism of macrophages can promote their M1 polarization, maintain the activity of CD8 + T cells, and then inhibit tumor progression. 74 , 75 The enzyme PI3Kγ, important for targeted phospholipid metabolism, can promote macrophage reprogramming and enhance T cell response, which can be used as a single drug or combined with T cell checkpoint blockade to inhibit tumor progression. 253 , 254 In DCs, the combination of FAO inhibition and anti‐PD‐1 blockade indicates that host survival has been significantly improved, driven by enhanced antitumor immunity. 161 In addition, aspirin, a nonsteroidal anti‐inflammatory drug that blocks the COX‐1/2 pathway, and celecoxib, a COX‐2 inhibitor, can limit the production of PGE2 and interfere with lipid metabolism, and combine anti‐PD‐1 therapy can further enhance the antitumor effect. 255 NK cells regulate T cell activity through the PD1/PDL1 axis, and NK cells in TME also undergo large tumor‐promoting metabolic changes, so targeting NK cell metabolism may also provide new ideas for tumor immunotherapy. 256
5. CONCLUSION
This review introduces the characteristics of TME, the metabolic characteristics of immune cells, and the progress of tumor immunotherapy. Facing the dilemma of tumor treatment, immunotherapy gives new hope to tumor patients. However, current immunotherapies, such as CAR‐T, are only effective in a small number of patients with solid tumors. This phenomenon suggests that comprehensive treatment may be the way to deal with tumors. A large number of previous studies have confirmed that the TME plays a key role in the tumor progression and treatment response. Metabolic reprograming is a main feature of tumor microenvironment. From the perspective of metabolic intervention, improving the immune status of tumor microenvironment is expected to provide promising strategies for enhancing the therapeutic effect of tumors. However, up to now, the understanding of tumor microenvironment is still in a relatively preliminary stage. Future studies need to focus on the original driving forces for the formation of TME, variation of TME between different tumor types, ontogeny of the immune cells in TME, the metabolism and immune heterogeneity of tumor‐related immune cells, the crosstalk between immune cells and tumor cells, and the effects of metabolic reprogramming on T cell therapies.
Of course, some problems need to be solved quickly. First of all, exploring the overlapping mechanisms of primary and secondary immune escape may be in dire need. As mentioned above, although some tumor patients respond well to tumor immunotherapy, a large number of patients are not sensitive to treatment. Importantly, some patients will eventually see their tumors return even if they respond to treatment. The former is called primary immune escape and the latter is called secondary immune escape. The two immune escape mechanisms overlap and immune metabolic changes are likely to be involved. Exploring this overlapping mechanism is crucial to rapidly improve the effect of cancer immunotherapy and improve the patients’ quality of life, which may be one of the important directions of tumor immunotherapy in the future. Moreover, targeting the role of immunometabolism in therapy resistance is also an urgent and interesting direction. Many studies have found that drug resistance induced by traditional tumor therapy is closely related to changes in tumor immunometabolism, and reprogramming tumor immunometabolism is crucial to restore the therapeutic effect. Clarifying these questions will help us to identify key pathways and targets that will ultimately serve the cancer therapy in the clinic.
CONFLICT OF INTEREST
The authors declare no conflict of interest.
ACKNOWLEDGMENTS
This work was supported in part by award numbers 81872028 and 81672693 (H.M.) from the National Natural Science Foundation of China (NSFC), cstc2017jcyjBX0071 (H.M.) from the Foundation and Frontier Research Project of Chongqing, and T04010019 (H.M.) from the Chongqing Youth Top Talent Project.
Shi R, Tang Y‐Q, Miao H. Metabolism in tumor microenvironment: Implications for cancer immunotherapy. MedComm. 2020;1:47–68. 10.1002/mco2.6
REFERENCES
- 1. Hanahan D, Weinberg RA. Hallmarks of cancer: the next generation. Cell. 2011;144(5):646‐674. [DOI] [PubMed] [Google Scholar]
- 2. Dunn GP, Bruce AT, Ikeda H, Old LJ, Schreiber RD. Cancer immunoediting: from immunosurveillance to tumor escape. Nat Immunol. 2002;3(11):991‐998. [DOI] [PubMed] [Google Scholar]
- 3. Dunn GP, Old LJ, Schreiber RD. The immunobiology of cancer immunosurveillance and immunoediting. Immunity. 2004;21(2):137‐148. [DOI] [PubMed] [Google Scholar]
- 4. Mittal D, Gubin MM, Schreiber RD, Smyth MJ. New insights into cancer immunoediting and its three component phases–elimination, equilibrium and escape. Curr Opin Immunol. 2014;27:16‐25. [DOI] [PMC free article] [PubMed] [Google Scholar]
- 5. Dunn GP, Old LJ, Schreiber RD. The three Es of cancer immunoediting. Annu Rev Immunol. 2004;22:329‐360. [DOI] [PubMed] [Google Scholar]
- 6. Quail DF, Joyce JA. Microenvironmental regulation of tumor progression and metastasis. Nat Med. 2013;19(11):1423‐1437. [DOI] [PMC free article] [PubMed] [Google Scholar]
- 7. Hanahan D, Coussens LM. Accessories to the crime: functions of cells recruited to the tumor microenvironment. Cancer Cell. 2012;21(3):309‐322. [DOI] [PubMed] [Google Scholar]
- 8. Junttila MR, de Sauvage FJ. Influence of tumour micro‐environment heterogeneity on therapeutic response. Nature. 2013;501(7467):346‐354. [DOI] [PubMed] [Google Scholar]
- 9. Wu T, Dai Y. Tumor microenvironment and therapeutic response. Cancer Lett. 2017;387:61‐68. [DOI] [PubMed] [Google Scholar]
- 10. Lyssiotis CA, Kimmelman AC. Metabolic interactions in the tumor microenvironment. Trends Cell Biol. 2017;27(11):863‐875. [DOI] [PMC free article] [PubMed] [Google Scholar]
- 11. Linehan WM, Schmidt LS, Crooks DR, et al. The metabolic basis of kidney cancer. Cancer Discov. 2019;9(8):1006‐1021. [DOI] [PubMed] [Google Scholar]
- 12. Kimmelman AC, White E. Autophagy and tumor metabolism. Cell Metab. 2017;25(5):1037‐1043. [DOI] [PMC free article] [PubMed] [Google Scholar]
- 13. Pavlova NN, Thompson CB. The emerging hallmarks of cancer metabolism. Cell Metab. 2016;23(1):27‐47. [DOI] [PMC free article] [PubMed] [Google Scholar]
- 14. WARBURG O. On the origin of cancer cells. Science. 1956;123(3191):309‐314. [DOI] [PubMed] [Google Scholar]
- 15. Arslan E, Aksoy T, Gursu RU, et al. The prognostic value of (18)F‐FDG PET/CT and KRAS mutation in colorectal cancers. Mol Imaging Radionucl Ther. 2020;29(1):17‐24. [DOI] [PMC free article] [PubMed] [Google Scholar]
- 16. EAGLE H. The minimum vitamin requirements of the L and HeLa cells in tissue culture, the production of specific vitamin deficiencies, and their cure. J Exp Med. 1955;102(5):595‐600. [DOI] [PMC free article] [PubMed] [Google Scholar]
- 17. Altman BJ, Stine ZE, Dang CV. From Krebs to clinic: glutamine metabolism to cancer therapy. Nat Rev Cancer. 2016;16(11):749. [DOI] [PubMed] [Google Scholar]
- 18. Kovacevic Z, McGivan JD. Mitochondrial metabolism of glutamine and glutamate and its physiological significance. Physiol Rev. 1983;63(2):547‐605. [DOI] [PubMed] [Google Scholar]
- 19. Lieberman BP, Ploessl K, Wang L, et al. PET imaging of glutaminolysis in tumors by 18F‐(2S,4R)4‐fluoroglutamine. J Nucl Med. 2011;52(12):1947‐1955. [DOI] [PubMed] [Google Scholar]
- 20. Venneti S, Dunphy MP, Zhang H, et al. Glutamine‐based PET imaging facilitates enhanced metabolic evaluation of gliomas in vivo. Sci Transl Med. 2015;7(274):217r‐274r. [DOI] [PMC free article] [PubMed] [Google Scholar]
- 21. Hoxhaj G, Manning BD. The PI3K‐AKT network at the interface of oncogenic signalling and cancer metabolism. Nat Rev Cancer. 2020;20(2):74‐88. [DOI] [PMC free article] [PubMed] [Google Scholar]
- 22. Vander HM, Plas DR, Rathmell JC, et al. Growth factors can influence cell growth and survival through effects on glucose metabolism. Mol Cell Biol. 2001;21(17):5899‐5912. [DOI] [PMC free article] [PubMed] [Google Scholar]
- 23. Rathmell JC, Fox CJ, Plas DR, et al. Akt‐directed glucose metabolism can prevent Bax conformation change and promote growth factor‐independent survival. Mol Cell Biol. 2003;23(20):7315‐7328. [DOI] [PMC free article] [PubMed] [Google Scholar]
- 24. Ho PC, Bihuniak JD, Macintyre AN, et al. Phosphoenolpyruvate is a metabolic checkpoint of anti‐tumor T cell responses. Cell. 2015;162(6):1217‐1228. [DOI] [PMC free article] [PubMed] [Google Scholar]
- 25. Chang CH, Qiu J, O'Sullivan D, et al. Metabolic Competition in the tumor microenvironment is a driver of cancer progression. Cell. 2015;162(6):1229‐1241. [DOI] [PMC free article] [PubMed] [Google Scholar]
- 26. Gemta LF, Siska PJ, Nelson ME, et al. Impaired enolase 1 glycolytic activity restrains effector functions of tumor‐infiltrating CD8(+) T cells. Sci Immunol. 2019;4(31):eaap9520. [DOI] [PMC free article] [PubMed] [Google Scholar]
- 27. Zhao E, Maj T, Kryczek I, et al. Cancer mediates effector T cell dysfunction by targeting microRNAs and EZH2 via glycolysis restriction. Nat Immunol. 2016;17(1):95‐103. [DOI] [PMC free article] [PubMed] [Google Scholar]
- 28. Cong J, Wang X, Zheng X, et al. Dysfunction of natural killer cells by FBP1‐Induced inhibition of glycolysis during lung cancer progression. Cell Metab. 2018;28(2):243‐255. [DOI] [PubMed] [Google Scholar]
- 29. Hatzivassiliou G, Zhao F, Bauer DE, et al. ATP citrate lyase inhibition can suppress tumor cell growth. Cancer Cell. 2005;8(4):311‐321. [DOI] [PubMed] [Google Scholar]
- 30. Corbet C, FeronO. Tumour acidosis: from the passenger to the driver's seat. Nat Rev Cancer. 2017;17(10):577‐593. [DOI] [PubMed] [Google Scholar]
- 31. Choi SY, Collins CC, Gout PW, Wang Y. Cancer‐Generated lactic acid: a regulatory, immunosuppressive metabolite. J Pathol. 2013;230(4):350‐355. [DOI] [PMC free article] [PubMed] [Google Scholar]
- 32. Parks SK, Chiche J, Pouyssegur J. Disrupting proton dynamics and energy metabolism for cancer therapy. Nat Rev Cancer. 2013;13(9):611‐623. [DOI] [PubMed] [Google Scholar]
- 33. Ippolito L, Morandi A, Giannoni E, Chiarugi P. Lactate: a metabolic driver in the tumour landscape. Trends Biochem Sci. 2019;44(2):153‐166. [DOI] [PubMed] [Google Scholar]
- 34. Colegio OR, Chu NQ, Szabo AL, et al. Functional polarization of tumour‐associated macrophages by tumour‐derived lactic acid. Nature. 2014;513(7519):559‐563. [DOI] [PMC free article] [PubMed] [Google Scholar]
- 35. Gao F, Tang Y, Liu WL, et al. Intra/Extracellular lactic acid exhaustion for synergistic metabolic therapy and immunotherapy of tumors. Adv Mater. 2019;31(51):e1904639. [DOI] [PubMed] [Google Scholar]
- 36. Jing X, Yang F, Shao C, et al. Role of hypoxia in cancer therapy by regulating the tumor microenvironment. Mol Cancer. 2019;18(1):157. [DOI] [PMC free article] [PubMed] [Google Scholar]
- 37. Wilson WR, Hay MP. Targeting hypoxia in cancer therapy. Nat Rev Cancer. 2011;11(6):393‐410. [DOI] [PubMed] [Google Scholar]
- 38. Petrova V, Annicchiarico‐Petruzzelli M, Melino G, Amelio I. The hypoxic tumour microenvironment. Oncogenesis. 2018;7(1):10. [DOI] [PMC free article] [PubMed] [Google Scholar]
- 39. Tirpe AA, Gulei D, Ciortea SM, Crivii C, Berindan‐Neagoe I. Hypoxia: overview on hypoxia‐mediated mechanisms with a focus on the role of HIF genes. Int J Mol Sci. 2019;20(24):6140. [DOI] [PMC free article] [PubMed] [Google Scholar]
- 40. Weis SM, Cheresh DA. Tumor angiogenesis: molecular pathways and therapeutic targets. Nat Med. 2011;17(11):1359‐1370. [DOI] [PubMed] [Google Scholar]
- 41. Keith B, Johnson RS, Simon MC. HIF1alpha and HIF2alpha: sibling rivalry in hypoxic tumour growth and progression. Nat Rev Cancer. 2011;12(1):9‐22. [DOI] [PMC free article] [PubMed] [Google Scholar]
- 42. Qiu GZ, Jin MZ, Dai JX, et al. Reprogramming of the tumor in the hypoxic niche: the emerging concept and associated therapeutic strategies. Trends Pharmacol Sci. 2017;38(8):669‐686. [DOI] [PubMed] [Google Scholar]
- 43. Multhoff G, Vaupel P. Hypoxia compromises anti‐cancer immune responses. Adv Exp Med Biol. 2020;1232:131‐143. [DOI] [PubMed] [Google Scholar]
- 44. Hatfield SM, Kjaergaard J, Lukashev D, et al. Immunological mechanisms of the antitumor effects of supplemental oxygenation. Sci Transl Med. 2015;7(277):230r‐277r. [DOI] [PMC free article] [PubMed] [Google Scholar]
- 45. Hasmim M, Messai Y, Ziani L, et al. Critical role of tumor microenvironment in shaping NK Cell functions: implication of hypoxic stress. Front Immunol. 2015;6:482. [DOI] [PMC free article] [PubMed] [Google Scholar]
- 46. Parodi M, Raggi F, Cangelosi D, et al. Hypoxia modifies the transcriptome of human NK cells, modulates their immunoregulatory profile, and influences NK cell subset migration. Front Immunol. 2018;9:2358. [DOI] [PMC free article] [PubMed] [Google Scholar]
- 47. Lee JH, Elly C, Park Y, Liu YC. E3 ubiquitin ligase VHL regulates hypoxia‐inducible factor‐1alpha to maintain regulatory T cell stability and suppressive capacity. Immunity. 2015;42(6):1062‐1074. [DOI] [PMC free article] [PubMed] [Google Scholar]
- 48. McNamee EN, Korns JD, Homann D, Clambey ET. Hypoxia and hypoxia‐inducible factors as regulators of T cell development, differentiation, and function. Immunol Res. 2013;55(1‐3):58‐70. [DOI] [PMC free article] [PubMed] [Google Scholar]
- 49. Wu Q, Zhou W, Yin S, et al. Blocking triggering receptor expressed on myeloid cells‐1‐positive tumor‐associated macrophages induced by hypoxia reverses immunosuppression and anti‐programmed cell death ligand 1 resistance in liver cancer. Hepatology. 2019;70(1):198‐214. [DOI] [PMC free article] [PubMed] [Google Scholar]
- 50. Vitale I, Manic G, Coussens LM, Kroemer G, Galluzzi L. Macrophages and metabolism in the tumor microenvironment. Cell Metab. 2019;30(1):36‐50. [DOI] [PubMed] [Google Scholar]
- 51. Liu C, Chikina M, Deshpande R, et al. Treg cells promote the SREBP1‐dependent metabolic fitness of tumor‐promoting macrophages via repression of CD8(+) T cell‐derived interferon‐gamma. Immunity. 2019;51(2):381‐397. [DOI] [PMC free article] [PubMed] [Google Scholar]
- 52. Veglia F, Perego M, Gabrilovich D. Myeloid‐derived suppressor cells coming of age. Nat Immunol. 2018;19(2):108‐119. [DOI] [PMC free article] [PubMed] [Google Scholar]
- 53. Zhang J, Lu Y, Pienta KJ. Multiple roles of chemokine (C‐C motif) ligand 2 in promoting prostate cancer growth. J Natl Cancer Inst. 2010;102(8):522‐528. [DOI] [PMC free article] [PubMed] [Google Scholar]
- 54. Kren L, Muckova K, Lzicarova E, et al. Production of Immune‐modulatory nonclassical molecules HLA‐G and HLA‐E by tumor infiltrating ameboid microglia/macrophages in glioblastomas: a role in innate immunity. J Neuroimmunol. 2010;220(1‐2):131‐135. [DOI] [PubMed] [Google Scholar]
- 55. Brown D, Trowsdale J, Allen R. The LILR family: modulators of innate and adaptive immune pathways in health and disease. Tissue Antigens. 2004;64(3):215‐225. [DOI] [PubMed] [Google Scholar]
- 56. Talmadge JE, Gabrilovich DI. History of myeloid‐derived suppressor cells. Nat Rev Cancer. 2013;13(10):739‐752. [DOI] [PMC free article] [PubMed] [Google Scholar]
- 57. Parker KH, Beury DW, Ostrand‐Rosenberg S. Myeloid‐derived suppressor cells: critical cells driving immune suppression in the tumor microenvironment. Adv Cancer Res. 2015;128:95‐139. [DOI] [PMC free article] [PubMed] [Google Scholar]
- 58. Cassetta L, Pollard JW. Targeting macrophages: therapeutic approaches in cancer. Nat Rev Drug Discov. 2018;17(12):887‐904. [DOI] [PubMed] [Google Scholar]
- 59. Gentles AJ, Newman AM, Liu CL, et al. The prognostic landscape of genes and infiltrating immune cells across human cancers. Nat Med. 2015;21(8):938‐945. [DOI] [PMC free article] [PubMed] [Google Scholar]
- 60. Mantovani A, Marchesi F, Malesci A, Laghi L, Allavena P. Tumour‐associated macrophages as treatment targets in oncology. Nat Rev Clin Oncol. 2017;14(7):399‐416. [DOI] [PMC free article] [PubMed] [Google Scholar]
- 61. Rabold K, Netea MG, Adema GJ, Netea‐Maier RT. Cellular metabolism of tumor‐associated macrophages ‐ functional impact and consequences. FEBS Lett. 2017;591(19):3022‐3041. [DOI] [PubMed] [Google Scholar]
- 62. Allavena P, Sica A, Garlanda C, Mantovani A. The Yin‐Yang of tumor‐associated macrophages in neoplastic progression and immune surveillance. Immunol Rev. 2008;222:155‐161. [DOI] [PubMed] [Google Scholar]
- 63. Arts RJ, Plantinga TS, Tuit S, et al. Transcriptional and metabolic reprogramming induce an inflammatory phenotype in non‐medullary thyroid carcinoma‐induced macrophages. Oncoimmunology. 2016;5(12):e1229725. [DOI] [PMC free article] [PubMed] [Google Scholar]
- 64. Lachmandas E, Boutens L, Ratter JM, et al. Microbial stimulation of different toll‐like receptor signalling pathways induces diverse metabolic programmes in human monocytes. Nat Microbiol. 2016;2:16246. [DOI] [PubMed] [Google Scholar]
- 65. Vats D, Mukundan L, Odegaard JI, et al. Oxidative metabolism and PGC‐1beta attenuate macrophage‐mediated inflammation. Cell Metab. 2006;4(1):13‐24. [DOI] [PMC free article] [PubMed] [Google Scholar]
- 66. Odegaard JI, Chawla A. Alternative macrophage activation and metabolism. Annu Rev Pathol. 2011;6:275‐297. [DOI] [PMC free article] [PubMed] [Google Scholar]
- 67. Huang SC, Everts B, Ivanova Y, et al. Cell‐Intrinsic lysosomal lipolysis is essential for alternative activation of macrophages. Nat Immunol. 2014;15(9):846‐855. [DOI] [PMC free article] [PubMed] [Google Scholar]
- 68. Posokhova EN, Khoshchenko OM, Chasovskikh MI, Pivovarova EN, Dushkin MI. Lipid synthesis in macrophages during inflammation in vivo: effect of agonists of peroxisome proliferator activated receptors alpha and gamma and of retinoid X receptors. Biochemistry. 2008;73(3):296‐304. [DOI] [PubMed] [Google Scholar]
- 69. Ecker J, Liebisch G, Englmaier M, et al. Induction of fatty acid synthesis is a key requirement for phagocytic differentiation of human monocytes. Proc Natl Acad Sci USA. 2010;107(17):7817‐7822. [DOI] [PMC free article] [PubMed] [Google Scholar]
- 70. Crucet M, Wust SJ, Spielmann P, et al. Hypoxia enhances lipid uptake in macrophages: role of the scavenger receptors Lox1, SRA, and CD36. Atherosclerosis. 2013;229(1):110‐117. [DOI] [PubMed] [Google Scholar]
- 71. Schlager SI, Madden LD, Meltzer MS, Bara S, Mamula MJ. Role of macrophage lipids in regulating tumoricidal activity. Cell Immunol. 1983;77(1):52‐68. [DOI] [PubMed] [Google Scholar]
- 72. Zhang Y, Sun Y, Rao E, et al. Fatty acid‐binding protein E‐FABP restricts tumor growth by promoting IFN‐beta responses in tumor‐associated macrophages. Cancer Res. 2014;74(11):2986‐2998. [DOI] [PMC free article] [PubMed] [Google Scholar]
- 73. Daurkin I, Eruslanov E, Stoffs T, et al. Tumor‐associated macrophages mediate immunosuppression in the renal cancer microenvironment by activating the 15‐Lipoxygenase‐2 pathway. Cancer Res. 2011;71(20):6400‐6409. [DOI] [PubMed] [Google Scholar]
- 74. Miao H, Ou J, Peng Y, et al. Macrophage ABHD5 promotes colorectal cancer growth by suppressing spermidine production by SRM. Nat Commun. 2016;7:11716. [DOI] [PMC free article] [PubMed] [Google Scholar]
- 75. Xiang W, Shi R, Kang X, et al. Monoacylglycerol lipase regulates cannabinoid receptor 2‐dependent macrophage activation and cancer progression. Nat Commun. 2018;9(1):2574. [DOI] [PMC free article] [PubMed] [Google Scholar]
- 76. Shang S, Ji X, Zhang L, et al. Macrophage ABHD5 suppresses NFkappaB‐dependent matrix metalloproteinase expression and cancer metastasis. Cancer Res. 2019;79(21):5513‐5526. [DOI] [PubMed] [Google Scholar]
- 77. Rath M, Muller I, Kropf P, Closs EI, Munder M. Metabolism via arginase or nitric oxide synthase: two competing arginine pathways in macrophages. Front Immunol. 2014;5:532. [DOI] [PMC free article] [PubMed] [Google Scholar]
- 78. Wessagowit V, Mallipeddi R, McGrath JA, South AP. Altered expression of L‐arginine metabolism pathway genes in chronic wounds in recessive dystrophic epidermolysis bullosa. Clin Exp Dermatol. 2004;29(6):664‐668. [DOI] [PubMed] [Google Scholar]
- 79. MacMicking J, Xie QW, Nathan C. Nitric oxide and macrophage function. Annu Rev Immunol. 1997;15:323‐350. [DOI] [PubMed] [Google Scholar]
- 80. Albina JE, Mills CD, Barbul A, et al. Arginine metabolism in wounds. Am J Physiol. 1988;254(4 Pt 1):E459‐E467. [DOI] [PubMed] [Google Scholar]
- 81. Klimp AH, Hollema H, Kempinga C, et al. Expression of cyclooxygenase‐2 and inducible nitric oxide synthase in human ovarian tumors and tumor‐associated macrophages. Cancer Res. 2001;61(19):7305‐7309. [PubMed] [Google Scholar]
- 82. Sharda DR, Yu S, Ray M, et al. Regulation of macrophage arginase expression and tumor growth by the ron receptor tyrosine kinase. J Immunol. 2011;187(5):2181‐2192. [DOI] [PMC free article] [PubMed] [Google Scholar]
- 83. Biswas SK, Gangi L, Paul S, et al. A distinct and unique transcriptional program expressed by tumor‐associated macrophages (defective NF‐kappaB and enhanced IRF‐3/STAT1 activation). Blood. 2006;107(5):2112‐2122. [DOI] [PubMed] [Google Scholar]
- 84. Chang CI, Liao JC, Kuo L. Macrophage arginase promotes tumor cell growth and suppresses nitric oxide‐mediated tumor cytotoxicity. Cancer Res. 2001;61(3):1100‐1106. [PubMed] [Google Scholar]
- 85. Mills CD, Shearer J, Evans R, Caldwell MD. Macrophage arginine metabolism and the inhibition or stimulation of cancer. J Immunol. 1992;149(8):2709‐2714. [PubMed] [Google Scholar]
- 86. Choi J, Stradmann‐Bellinghausen B, Yakubov E, Savaskan NE, Regnier‐Vigouroux A. Glioblastoma cells induce differential glutamatergic gene expressions in human tumor‐associated microglia/macrophages and monocyte‐derived macrophages. Cancer Biol Ther. 2015;16(8):1205‐1213. [DOI] [PMC free article] [PubMed] [Google Scholar]
- 87. Zhao Q, Kuang DM, Wu Y, et al. Activated CD69+ T cells foster immune privilege by regulating IDO expression in tumor‐associated macrophages. J Immunol. 2012;188(3):1117‐1124. [DOI] [PubMed] [Google Scholar]
- 88. Zhu J, Yamane H, Paul WE. Differentiation of effector CD4 T cell populations (*). Annu Rev Immunol. 2010;28:445‐489. [DOI] [PMC free article] [PubMed] [Google Scholar]
- 89. Weaver CT, Hatton RD, Mangan PR, Harrington LE. IL‐17 family cytokines and the expanding diversity of effector T cell lineages. Annu Rev Immunol. 2007;25:821‐852. [DOI] [PubMed] [Google Scholar]
- 90. Gajewski TF, Schreiber H, Fu YX. Innate and adaptive immune cells in the tumor microenvironment. Nat Immunol. 2013;14(10):1014‐1022. [DOI] [PMC free article] [PubMed] [Google Scholar]
- 91. Zarour HM. Reversing T‐Cell dysfunction and exhaustion in cancer. Clin Cancer Res. 2016;22(8):1856‐1864. [DOI] [PMC free article] [PubMed] [Google Scholar]
- 92. Saeidi A, Zandi K, Cheok YY, et al. T‐Cell exhaustion in chronic infections: reversing the state of exhaustion and reinvigorating optimal protective immune responses. Front Immunol. 2018;9:2569. [DOI] [PMC free article] [PubMed] [Google Scholar]
- 93. Wherry EJ. T cell exhaustion. Nat Immunol. 2011;12(6):492‐499. [DOI] [PubMed] [Google Scholar]
- 94. Verbist KC, Guy CS, Milasta S, et al. Metabolic maintenance of cell asymmetry following division in activated t lymphocytes. Nature. 2016;532(7599):389‐393. [DOI] [PMC free article] [PubMed] [Google Scholar]
- 95. Fox CJ, Hammerman PS, Thompson CB. Fuel feeds function: energy metabolism and the t‐cell response. Nat Rev Immunol. 2005;5(11):844‐852. [DOI] [PubMed] [Google Scholar]
- 96. Delgoffe GM, Kole TP, Zheng Y, et al. The mTOR kinase differentially regulates effector and regulatory T cell lineage commitment. Immunity. 2009;30(6):832‐844. [DOI] [PMC free article] [PubMed] [Google Scholar]
- 97. Araki K, Turner AP, Shaffer VO, et al. MTOR regulates memory CD8 T‐cell differentiation. Nature. 2009;460(7251):108‐112. [DOI] [PMC free article] [PubMed] [Google Scholar]
- 98. Chang CH, Curtis JD, Maggi LJ, et al. Posttranscriptional control of T cell effector function by aerobic glycolysis. Cell. 2013;153(6):1239‐1251. [DOI] [PMC free article] [PubMed] [Google Scholar]
- 99. Gubser PM, Bantug GR, Razik L, et al. Rapid effector function of memory CD8+ T cells requires an immediate‐early glycolytic switch. Nat Immunol. 2013;14(10):1064‐1072. [DOI] [PubMed] [Google Scholar]
- 100. De Rosa V, Galgani M, Porcellini A, et al. Glycolysis controls the induction of human regulatory T cells by modulating the expression of foxp3 exon 2 splicing variants. Nat Immunol. 2015;16(11):1174‐1184. [DOI] [PMC free article] [PubMed] [Google Scholar]
- 101. Cao Y, Rathmell JC, Macintyre AN. Metabolic reprogramming towards aerobic glycolysis correlates with greater proliferative ability and resistance to metabolic inhibition in CD8 versus CD4 T cells. PLoS One. 2014;9(8):e104104. [DOI] [PMC free article] [PubMed] [Google Scholar]
- 102. Maciver NJ, Jacobs SR, Wieman HL, et al. Glucose metabolism in lymphocytes is a regulated process with significant effects on immune cell function and survival. J Leukoc Biol. 2008;84(4):949‐957. [DOI] [PMC free article] [PubMed] [Google Scholar]
- 103. Hu Z, Qu G, Yu X, et al. Acylglycerol kinase maintains metabolic state and immune responses of CD8(+) T cells. Cell Metab. 2019;30(2):290‐302. [DOI] [PubMed] [Google Scholar]
- 104. van der Windt GJ, Everts B, Chang CH, et al. Mitochondrial respiratory capacity is a critical regulator of CD8+ T cell memory development. Immunity. 2012;36(1):68‐78. [DOI] [PMC free article] [PubMed] [Google Scholar]
- 105. Phan AT, Goldrath AW, Glass CK. Metabolic and epigenetic coordination of T cell and macrophage immunity. Immunity. 2017;46(5):714‐729. [DOI] [PMC free article] [PubMed] [Google Scholar]
- 106. Zhang H, Tang K, Ma J, et al. Ketogenesis‐generated beta‐hydroxybutyrate is an epigenetic regulator of CD8(+) T‐cell memory development. Nat Cell Biol. 2020;22(1):18‐25. [DOI] [PubMed] [Google Scholar]
- 107. Pearce EL, Walsh MC, Cejas PJ, et al. Enhancing CD8 T‐cell memory by modulating fatty acid metabolism. Nature. 2009;460(7251):103‐107. [DOI] [PMC free article] [PubMed] [Google Scholar]
- 108. Yang W, Bai Y, Xiong Y, et al. Potentiating the antitumour response of CD8(+) T cells by modulating cholesterol metabolism. Nature. 2016;531(7596):651‐655. [DOI] [PMC free article] [PubMed] [Google Scholar]
- 109. Tanaka A, Sakaguchi S. Regulatory T cells in cancer immunotherapy. Cell Res. 2017;27(1):109‐118. [DOI] [PMC free article] [PubMed] [Google Scholar]
- 110. Wherry EJ, KurachiM. Molecular and cellular insights into T cell exhaustion. Nat Rev Immunol. 2015;15(8):486‐499. [DOI] [PMC free article] [PubMed] [Google Scholar]
- 111. Field CS, Baixauli F, Kyle RL, et al. Mitochondrial integrity regulated by lipid metabolism is a cell‐intrinsic checkpoint for Treg suppressive function. Cell Metab. 2020;31(2):422‐437. [DOI] [PMC free article] [PubMed] [Google Scholar]
- 112. Hang S, Paik D, Yao L, et al. Bile acid metabolites control TH17 and Treg cell differentiation. Nature. 2019;576(7785):143‐148. [DOI] [PMC free article] [PubMed] [Google Scholar]
- 113. Lercher A, Bhattacharya A, Popa AM, et al. Type I interferon signaling disrupts the hepatic urea cycle and alters systemic metabolism to suppress T cell function. Immunity. 2019;51(6):1074‐1087. [DOI] [PMC free article] [PubMed] [Google Scholar]
- 114. Shi H, Chapman NM, Wen J, et al. Amino acids license kinase mTORC1 activity and Treg cell function via small G proteins Rag and Rheb. Immunity. 2019;51(6):1012‐1027. [DOI] [PMC free article] [PubMed] [Google Scholar]
- 115. Carr EL, Kelman A, Wu GS, et al. Glutamine uptake and metabolism are coordinately regulated by ERK/MAPK during T lymphocyte activation. J Immunol. 2010;185(2):1037‐1044. [DOI] [PMC free article] [PubMed] [Google Scholar]
- 116. Platten M, Wick W, Van den Eynde BJ. Tryptophan catabolism in cancer: beyond IDO and tryptophan depletion. Cancer Res. 2012;72(21):5435‐5440. [DOI] [PubMed] [Google Scholar]
- 117. Lee GK, Park HJ, Macleod M, et al. Tryptophan deprivation sensitizes activated T cells to apoptosis prior to cell division. Immunology. 2002;107(4):452‐460. [DOI] [PMC free article] [PubMed] [Google Scholar]
- 118. Liu Y, Liang X, Dong W, et al. Tumor‐repopulating cells induce PD‐1 expression in CD8(+) T cells by transferring kynurenine and AhR activation. Cancer Cell. 2018;33(3):480‐494. [DOI] [PubMed] [Google Scholar]
- 119. Lind DS. Arginine and cancer. J Nutr. 2004;134(10 Suppl):2837S‐2841S, 2853S. [DOI] [PubMed] [Google Scholar]
- 120. Geiger R, Rieckmann JC, Wolf T, et al. L‐Arginine modulates T cell metabolism and enhances survival and anti‐tumor activity. Cell. 2016;167(3):829‐842. [DOI] [PMC free article] [PubMed] [Google Scholar]
- 121. Vivier E, Tomasello E, Baratin M, Walzer T, Ugolini S. Functions of natural killer cells. Nat Immunol. 2008;9(5):503‐510. [DOI] [PubMed] [Google Scholar]
- 122. Stojanovic A, Correia MP, Cerwenka A. Shaping of NK cell responses by the tumor microenvironment. Cancer Microenviron. 2013;6(2):135‐146. [DOI] [PMC free article] [PubMed] [Google Scholar]
- 123. Michelet X, Dyck L, Hogan A, et al. Metabolic reprogramming of natural killer cells in obesity limits antitumor responses. Nat Immunol. 2018;19(12):1330‐1340. [DOI] [PubMed] [Google Scholar]
- 124. Terren I, Orrantia A, Vitalle J, Zenarruzabeitia O, Borrego F. NK cell metabolism and tumor microenvironment. Front Immunol. 2019;10:2278. [DOI] [PMC free article] [PubMed] [Google Scholar]
- 125. Keppel MP, Saucier N, Mah AY, Vogel TP, Cooper MA. Activation‐specific metabolic requirements for NK cell IFN‐gamma production. J Immunol. 2015;194(4):1954‐1962. [DOI] [PMC free article] [PubMed] [Google Scholar]
- 126. Donnelly RP, Loftus RM, Keating SE, et al. MTORC1‐dependent metabolic reprogramming is a prerequisite for NK cell effector function. J Immunol. 2014;193(9):4477‐4484. [DOI] [PMC free article] [PubMed] [Google Scholar]
- 127. Keating SE, Zaiatz‐Bittencourt V, Loftus RM, et al. Metabolic reprogramming supports IFN‐gamma production by CD56bright NK cells. J Immunol. 2016;196(6):2552‐2560. [DOI] [PubMed] [Google Scholar]
- 128. Salzberger W, Martrus G, Bachmann K, et al. Tissue‐resident NK cells differ in their expression profile of the nutrient transporters Glut1, CD98 and CD71. PLoS One. 2018;13(7):e201170. [DOI] [PMC free article] [PubMed] [Google Scholar]
- 129. Maratou E, Dimitriadis G, Kollias A, et al. Glucose transporter expression on the plasma membrane of resting and activated white blood cells. Eur J Clin Invest. 2007;37(4):282‐290. [DOI] [PubMed] [Google Scholar]
- 130. Marcais A, Cherfils‐Vicini J, Viant C, et al. The metabolic checkpoint kinase mTOR is essential for IL‐15 signaling during the development and activation of NK cells. Nat Immunol. 2014;15(8):749‐757. [DOI] [PMC free article] [PubMed] [Google Scholar]
- 131. Assmann N, O'Brien KL, Donnelly RP, et al. Srebp‐controlled glucose metabolism is essential for NK cell functional responses. Nat Immunol. 2017;18(11):1197‐1206. [DOI] [PubMed] [Google Scholar]
- 132. Zaiatz‐Bittencourt V, Finlay DK, Gardiner CM. Canonical TGF‐beta signaling pathway represses human NK cell metabolism.J Immunol. 2018;200(12):3934‐3941. [DOI] [PubMed] [Google Scholar]
- 133. Viel S, Besson L, Marotel M, Walzer T, Marcais A. Regulation of mTOR, metabolic fitness, and effector functions by cytokines in natural killer cells. Cancers. 2017;9(10):E132. [DOI] [PMC free article] [PubMed] [Google Scholar]
- 134. Shimano H, Sato R. SREBP‐regulated lipid metabolism: convergent physiology ‐ divergent pathophysiology. Nat Rev Endocrinol. 2017;13(12):710‐730. [DOI] [PubMed] [Google Scholar]
- 135. Qin WH, Yang ZS, Li M, et al. High serum levels of cholesterol increase anti‐tumor functions of nature killer cells and reduce growth of liver tumors in mice. Gastroenterology. 2020;158(6):1713‐1727. [DOI] [PubMed] [Google Scholar]
- 136. Gumbleton M, Kerr WG. Role of inositol phospholipid signaling in natural killer cell biology. Front Immunol. 2013;4:47. [DOI] [PMC free article] [PubMed] [Google Scholar]
- 137. Yang E, Singh BK, Paustian AM, Kambayashi T. Diacylglycerol kinase zeta is a target to enhance NK cell function. J Immunol. 2016;197(3):934‐941. [DOI] [PMC free article] [PubMed] [Google Scholar]
- 138. Yamauchi T, Kamon J, Ito Y, et al. Cloning of adiponectin receptors that mediate antidiabetic metabolic effects. Nature. 2003;423(6941):762‐769. [DOI] [PubMed] [Google Scholar]
- 139. Takeuchi T, Adachi Y, Ohtsuki Y, Furihata M. Adiponectin receptors, with special focus on the role of the third receptor, T‐cadherin, in vascular disease. Med Mol Morphol. 2007;40(3):115‐120. [DOI] [PubMed] [Google Scholar]
- 140. Loftus RM, Assmann N, Kedia‐Mehta N, et al. Amino acid‐dependent cMyc expression is essential for NK cell metabolic and functional responses in mice. Nat Commun. 2018;9(1):2341. [DOI] [PMC free article] [PubMed] [Google Scholar]
- 141. Almutairi SM, Ali AK, He W, et al. Interleukin‐18 up‐regulates amino acid transporters and facilitates amino acid‐induced mTORC1 activation in natural killer cells. J Biol Chem. 2019;294(12):4644‐4655. [DOI] [PMC free article] [PubMed] [Google Scholar]
- 142. Li X, Wenes M, Romero P, et al. Navigating metabolic pathways to enhance antitumour immunity and immunotherapy. Nat Rev Clin Oncol. 2019;16(7):425‐441. [DOI] [PubMed] [Google Scholar]
- 143. Stiff A, Trikha P, Mundy‐Bosse B, et al. Nitric oxide production by myeloid‐derived suppressor cells plays a role in impairing Fc receptor‐mediated natural killer cell function. Clin Cancer Res. 2018;24(8):1891‐1904. [DOI] [PMC free article] [PubMed] [Google Scholar]
- 144. Liu X, Shin N, Koblish HK, et al. Selective inhibition of IDO1 effectively regulates mediators of antitumor immunity. Blood. 2010;115(17):3520‐3530. [DOI] [PubMed] [Google Scholar]
- 145. Merad M, Sathe P, Helft J, Miller J, Mortha A. The dendritic cell lineage: ontogeny and function of dendritic cells and their subsets in the steady state and the inflamed setting. Annu Rev Immunol. 2013;31:563‐604. [DOI] [PMC free article] [PubMed] [Google Scholar]
- 146. Murphy TL, Grajales‐Reyes GE, Wu X, et al. Transcriptional control of dendritic cell development. Annu Rev Immunol. 2016;34:93‐119. [DOI] [PMC free article] [PubMed] [Google Scholar]
- 147. Du X, Chapman NM, Chi H. Emerging roles of cellular metabolism in regulating dendritic cell subsets and function. Front Cell Dev Biol. 2018;6:152. [DOI] [PMC free article] [PubMed] [Google Scholar]
- 148. Krawczyk CM, Holowka T, Sun J, et al. Toll‐Like receptor‐induced changes in glycolytic metabolism regulate dendritic cell activation. Blood. 2010;115(23):4742‐4749. [DOI] [PMC free article] [PubMed] [Google Scholar]
- 149. Giovanelli P, Sandoval TA, Cubillos‐Ruiz JR. Dendritic cell metabolism and function in tumors. Trends Immunol. 2019;40(8):699‐718. [DOI] [PubMed] [Google Scholar]
- 150. Everts B, Amiel E, Huang SC, et al. TLR‐driven early glycolytic reprogramming via the kinases TBK1‐IKKvarepsilon supports the anabolic demands of dendritic cell activation. Nat Immunol. 2014;15(4):323‐332. [DOI] [PMC free article] [PubMed] [Google Scholar]
- 151. Guak H, Al HS, Ma EH, et al. Glycolytic metabolism is essential for CCR7 oligomerization and dendritic cell migration. Nat Commun. 2018;9(1):2463. [DOI] [PMC free article] [PubMed] [Google Scholar]
- 152. Lawless SJ, Kedia‐Mehta N, Walls JF, et al. Glucose represses dendritic cell‐induced T cell responses. Nat Commun. 2017;8:15620. [DOI] [PMC free article] [PubMed] [Google Scholar]
- 153. Snyder JP, Amiel E. Regulation of dendritic cell immune function and metabolism by cellular nutrient sensor mammalian target of rapamycin (mTOR). Front Immunol. 2018;9:3145. [DOI] [PMC free article] [PubMed] [Google Scholar]
- 154. Thwe PM, Pelgrom LR, Cooper R, et al. Cell‐intrinsic glycogen metabolism supports early glycolytic reprogramming required for dendritic cell immune responses. Cell Metab. 2019;30(1):225. [DOI] [PMC free article] [PubMed] [Google Scholar]
- 155. Song M, Cubillos‐Ruiz JR. Endoplasmic reticulum stress responses in intratumoral immune cells: implications for cancer immunotherapy. Trends Immunol. 2019;40(2):128‐141. [DOI] [PubMed] [Google Scholar]
- 156. Danova K, Klapetkova A, Kayserova J, et al. NF‐kappaB, P38 MAPK, ERK1/2, mTOR, STAT3 and increased glycolysis regulate stability of paricalcitol/dexamethasone‐generated tolerogenic dendritic cells in the inflammatory environment. Oncotarget. 2015;6(16):14123‐14138. [DOI] [PMC free article] [PubMed] [Google Scholar]
- 157. Pearce EJ, Everts B. Dendritic cell metabolism. Nat Rev Immunol. 2015;15(1):18‐29. [DOI] [PMC free article] [PubMed] [Google Scholar]
- 158. Gotoh K, Morisaki T, Setoyama D, et al. Mitochondrial p32/C1qbp is a critical regulator of dendritic cell metabolism and maturation. Cell Rep. 2018;25(7):1800‐1815. [DOI] [PubMed] [Google Scholar]
- 159. Herber DL, Cao W, Nefedova Y, et al. Lipid accumulation and dendritic cell dysfunction in cancer. Nat Med. 2010;16(8):880‐886. [DOI] [PMC free article] [PubMed] [Google Scholar]
- 160. Veglia F, Tyurin VA, Mohammadyani D, et al. Lipid bodies containing oxidatively truncated lipids block antigen cross‐presentation by dendritic cells in cancer. Nat Commun. 2017;8(1):2122. [DOI] [PMC free article] [PubMed] [Google Scholar]
- 161. Zhao F, Xiao C, Evans KS, et al. Paracrine Wnt5a‐beta‐catenin signaling triggers a metabolic program that drives dendritic cell tolerization. Immunity. 2018;48(1):147‐160. [DOI] [PMC free article] [PubMed] [Google Scholar]
- 162. Villablanca EJ. Retinoic acid‐producing DCs and gut‐tropic FOXP3(+) regulatory T cells in the induction of oral tolerance. Oncoimmunology. 2013;2(2):e22987. [DOI] [PMC free article] [PubMed] [Google Scholar]
- 163. Murray PJ. Amino acid auxotrophy as a system of immunological control nodes. Nat Immunol. 2016;17(2):132‐139. [DOI] [PMC free article] [PubMed] [Google Scholar]
- 164. Grohmann U, Bronte V. Control of immune response by amino acid metabolism. Immunol Rev. 2010;236:243‐264. [DOI] [PubMed] [Google Scholar]
- 165. Grohmann U, Fallarino F, Puccetti P. Tolerance, DCs and tryptophan: much ado about IDO. Trends Immunol. 2003;24(5):242‐248. [DOI] [PubMed] [Google Scholar]
- 166. Pallotta MT, Orabona C, Volpi C, et al. Indoleamine 2,3‐dioxygenase is a signaling protein in long‐term tolerance by dendritic cells. Nat Immunol. 2011;12(9):870‐878. [DOI] [PubMed] [Google Scholar]
- 167. Ohmatsu H, Humme D, Gonzalez J, et al. IL‐32 induces indoleamine 2,3‐dioxygenase(+)CD1c(+) dendritic cells and indoleamine 2,3‐dioxygenase(+)CD163(+) macrophages: relevance to mycosis fungoides progression. Oncoimmunology. 2017;6(2):e1181237. [DOI] [PMC free article] [PubMed] [Google Scholar]
- 168. Munn DH, Mellor AL. IDO in the tumor microenvironment: inflammation, counter‐regulation, and tolerance. Trends Immunol. 2016;37(3):193‐207. [DOI] [PMC free article] [PubMed] [Google Scholar]
- 169. Bronte V, Serafini P, Mazzoni A, Segal DM, Zanovello P. L‐Arginine metabolism in myeloid cells controls T‐lymphocyte functions. Trends Immunol. 2003;24(6):302‐306. [DOI] [PubMed] [Google Scholar]
- 170. Munder M, Eichmann K, Moran JM, et al. Th1/Th2‐regulated expression of arginase isoforms in murine macrophages and dendritic cells. J Immunol. 1999;163(7):3771‐3777. [PubMed] [Google Scholar]
- 171. Mondanelli G, Bianchi R, Pallotta MT, et al. A relay pathway between arginine and tryptophan metabolism confers immunosuppressive properties on dendritic cells. Immunity. 2017;46(2):233‐244. [DOI] [PMC free article] [PubMed] [Google Scholar]
- 172. Norian LA, Rodriguez PC, O'Mara LA, et al. Tumor‐Infiltrating regulatory dendritic cells inhibit CD8+ T cell function via L‐arginine metabolism. Cancer Res. 2009;69(7):3086‐3094. [DOI] [PMC free article] [PubMed] [Google Scholar]
- 173. Topalian SL, Taube JM, Pardoll DM. Neoadjuvant checkpoint blockade for cancer immunotherapy. Science. 2020;367(6477). [DOI] [PMC free article] [PubMed] [Google Scholar]
- 174. Rosenberg SA, Restifo NP, Yang JC, Morgan RA, Dudley ME. Adoptive cell transfer: a clinical path to effective cancer immunotherapy. Nat Rev Cancer. 2008;8(4):299‐308. [DOI] [PMC free article] [PubMed] [Google Scholar]
- 175. Dougan M, Dranoff G. Immune therapy for cancer. Annu Rev Immunol. 2009;27:83‐117. [DOI] [PubMed] [Google Scholar]
- 176. Postow MA, Callahan MK, Wolchok JD. Immune checkpoint blockade in cancer therapy. J Clin Oncol. 2015;33(17):1974‐1982. [DOI] [PMC free article] [PubMed] [Google Scholar]
- 177. Bhatia A, Kumar Y. Cellular and molecular mechanisms in cancer immune escape: a comprehensive review. Expert Rev Clin Immunol. 2014;10(1):41‐62. [DOI] [PubMed] [Google Scholar]
- 178. Tumeh PC, Harview CL, Yearley JH, et al. PD‐1 blockade induces responses by inhibiting adaptive immune resistance. Nature. 2014;515(7528):568‐571. [DOI] [PMC free article] [PubMed] [Google Scholar]
- 179. Pardoll DM. The blockade of immune checkpoints in cancer immunotherapy. Nat Rev Cancer. 2012;12(4):252‐264. [DOI] [PMC free article] [PubMed] [Google Scholar]
- 180. Sullivan RJ, Hamid O, Gonzalez R, et al. Atezolizumab plus cobimetinib and vemurafenib in BRAF‐mutated melanoma patients. Nat Med. 2019;25(6):929‐935. [DOI] [PubMed] [Google Scholar]
- 181. Cortese I, Muranski P, Enose‐Akahata Y, et al. Pembrolizumab treatment for progressive multifocal leukoencephalopathy. N Engl J Med. 2019;380(17):1597‐1605. [DOI] [PubMed] [Google Scholar]
- 182. Hernandez‐Guerrero T, Doger B, Moreno V. Cemiplimab for the treatment of advanced cutaneous squamous cell carcinoma. Drugs Today. 2019;55(8):485‐494. [DOI] [PubMed] [Google Scholar]
- 183. Garassino MC, Cho BC, Kim JH, et al. Durvalumab as third‐line or later treatment for advanced non‐small‐cell lung cancer (ATLANTIC): an open‐label, single‐arm, phase 2 study. Lancet Oncol. 2018;19(4):521‐536. [DOI] [PMC free article] [PubMed] [Google Scholar]
- 184. Kennedy LB, Salama A. A review of cancer immunotherapy toxicity. CA Cancer J Clin. 2020. [DOI] [PubMed] [Google Scholar]
- 185. Mantia CM, Buchbinder EI. Immunotherapy toxicity. Hematol Oncol Clin North Am. 2019;33(2):275‐290. [DOI] [PubMed] [Google Scholar]
- 186. Wang DY, Salem JE, Cohen JV, et al. Fatal toxic effects associated with immune checkpoint inhibitors: a systematic review and meta‐analysis. JAMA Oncol. 2018;4(12):1721‐1728. [DOI] [PMC free article] [PubMed] [Google Scholar]
- 187. Arlauckas SP, Garris CS, Kohler RH, et al. In vivo imaging reveals a tumor‐associated macrophage‐mediated resistance pathway in anti‐PD‐1 therapy. Sci Transl Med. 2017;9(389). [DOI] [PMC free article] [PubMed] [Google Scholar]
- 188. Gordon SR, Maute RL, Dulken BW, et al. PD‐1 expression by tumour‐associated macrophages inhibits phagocytosis and tumour immunity. Nature. 2017;545(7655):495‐499. [DOI] [PMC free article] [PubMed] [Google Scholar]
- 189. Thompson JA. New NCCN guidelines: recognition and management of immunotherapy‐related toxicity. J Natl Compr Canc Netw. 2018;16(5S):594‐596. [DOI] [PubMed] [Google Scholar]
- 190. Tokunaga A, Sugiyama D, Maeda Y, et al. Selective inhibition of low‐affinity memory CD8(+) T cells by corticosteroids. J Exp Med. 2019;216(12):2701‐2713. [DOI] [PMC free article] [PubMed] [Google Scholar]
- 191. Rosenberg SA, Restifo NP. Adoptive cell transfer as personalized immunotherapy for human cancer. Science. 2015;348(6230):62‐68. [DOI] [PMC free article] [PubMed] [Google Scholar]
- 192. Rosenberg SA, Spiess P, Lafreniere R. A new approach to the adoptive immunotherapy of cancer with tumor‐infiltrating lymphocytes. Science. 1986;233(4770):1318‐1321. [DOI] [PubMed] [Google Scholar]
- 193. Fesnak AD, June CH, Levine BL. Engineered T cells: the promise and challenges of cancer immunotherapy. Nat Rev Cancer. 2016;16(9):566‐581. [DOI] [PMC free article] [PubMed] [Google Scholar]
- 194. June CH, O'Connor RS, Kawalekar OU, Ghassemi S, Milone MC. CAR T cell immunotherapy for human cancer. Science. 2018;359(6382):1361‐1365. [DOI] [PubMed] [Google Scholar]
- 195. Dudley ME, Rosenberg SA. Adoptive‐cell‐transfer therapy for the treatment of patients with cancer. Nat Rev Cancer. 2003;3(9):666‐675. [DOI] [PMC free article] [PubMed] [Google Scholar]
- 196. Kalos M, June CH. Adoptive T cell transfer for cancer immunotherapy in the era of synthetic biology. Immunity. 2013;39(1):49‐60. [DOI] [PMC free article] [PubMed] [Google Scholar]
- 197. Landsberg J, Kohlmeyer J, Renn M, et al. Melanomas resist T‐cell therapy through inflammation‐induced reversible dedifferentiation. Nature. 2012;490(7420):412‐416. [DOI] [PubMed] [Google Scholar]
- 198. Gisselbrecht C, Van Den Neste E. How I manage patients with relapsed/refractory diffuse large B cell lymphoma. Br J Haematol. 2018;182(5):633‐643. [DOI] [PMC free article] [PubMed] [Google Scholar]
- 199. Fraietta JA, Lacey SF, Orlando EJ, et al. Determinants of response and resistance to CD19 chimeric antigen receptor (CAR) T cell therapy of chronic lymphocytic leukemia. Nat Med. 2018;24(5):563‐571. [DOI] [PMC free article] [PubMed] [Google Scholar]
- 200. Schuster SJ, Svoboda J, Chong EA, et al. Chimeric antigen receptor T cells in refractory B‐cell lymphomas. N Engl J Med. 2017;377(26):2545‐2554. [DOI] [PMC free article] [PubMed] [Google Scholar]
- 201. Ying Z, Huang XF, Xiang X, et al. A safe and potent anti‐CD19 CAR T cell therapy. Nat Med. 2019;25(6):947‐953. [DOI] [PMC free article] [PubMed] [Google Scholar]
- 202. Brudno JN, Kochenderfer JN. Chimeric antigen receptor T‐cell therapies for lymphoma. Nat Rev Clin Oncol. 2018;15(1):31‐46. [DOI] [PMC free article] [PubMed] [Google Scholar]
- 203. Liu E, Marin D, Banerjee P, et al. Use of CAR‐Transduced natural killer cells in CD19‐Positive lymphoid tumors. N Engl J Med. 2020;382(6):545‐553. [DOI] [PMC free article] [PubMed] [Google Scholar]
- 204. Giordano‐Attianese G, Gainza P, Gray‐Gaillard E, et al. A computationally designed chimeric antigen receptor provides a small‐molecule safety switch for T‐cell therapy. Nat Biotechnol. 2020;38:426‐432. [DOI] [PubMed] [Google Scholar]
- 205. Weiner LM, Surana R, Wang S. Monoclonal antibodies: versatile platforms for cancer immunotherapy. Nat Rev Immunol. 2010;10(5):317‐327. [DOI] [PMC free article] [PubMed] [Google Scholar]
- 206. Weiner LM, Dhodapkar MV, Ferrone S. Monoclonal antibodies for cancer immunotherapy. Lancet. 2009;373(9668):1033‐1040. [DOI] [PMC free article] [PubMed] [Google Scholar]
- 207. Melero I, Hervas‐Stubbs S, Glennie M, Pardoll DM, Chen L. Immunostimulatory monoclonal antibodies for cancer therapy. Nat Rev Cancer. 2007;7(2):95‐106. [DOI] [PubMed] [Google Scholar]
- 208. Garfall AL, June CH. Trispecific antibodies offer a third way forward for anticancer immunotherapy. Nature. 2019;575(7783):450‐451. [DOI] [PubMed] [Google Scholar]
- 209. Barkal AA, Brewer RE, Markovic M, et al. CD24 signalling through macrophage siglec‐10 is a target for cancer immunotherapy. Nature. 2019;572(7769):392‐396. [DOI] [PMC free article] [PubMed] [Google Scholar]
- 210. Jaiswal S, Jamieson CH, Pang WW, et al. CD47 is upregulated on circulating hematopoietic stem cells and leukemia cells to avoid phagocytosis. Cell. 2009;138(2):271‐285. [DOI] [PMC free article] [PubMed] [Google Scholar]
- 211. Advani R, Flinn I, Popplewell L, et al. CD47 blockade by Hu5F9‐G4 and rituximab in non‐Hodgkin's lymphoma. N Engl J Med. 2018;379(18):1711‐1721. [DOI] [PMC free article] [PubMed] [Google Scholar]
- 212. Kauder SE, Kuo TC, Harrabi O, et al. ALX148 blocks CD47 and enhances innate and adaptive antitumor immunity with a favorable safety profile. PLoS One. 2018;13(8):e201832. [DOI] [PMC free article] [PubMed] [Google Scholar]
- 213. Ott PA, Wu CJ. Cancer vaccines: steering T cells down the right path to eradicate tumors. Cancer Discov. 2019;9(4):476‐481. [DOI] [PMC free article] [PubMed] [Google Scholar]
- 214. Zhao KN, Zhang L, Qu J. Dr. Jian Zhou: the great inventor of cervical cancer vaccine. Protein Cell. 2017;8(2):79‐82. [DOI] [PMC free article] [PubMed] [Google Scholar]
- 215. Lalu M, Leung GJ, Dong YY, et al. Mapping the preclinical to clinical evidence and development trajectory of the oncolytic virus talimogene laherparepvec (T‐VEC): a systematic review. BMJ Open. 2019;9(12):e29475. [DOI] [PMC free article] [PubMed] [Google Scholar]
- 216. Chesney J, Puzanov I, Collichio F, et al. Randomized, open‐label phase II study evaluating the efficacy and safety of talimogene laherparepvec in combination with ipilimumab versus ipilimumab alone in patients with advanced, unresectable melanoma. J Clin Oncol. 2018;36(17):1658‐1667. [DOI] [PMC free article] [PubMed] [Google Scholar]
- 217. Keskin DB, Anandappa AJ, Sun J, et al. Neoantigen vaccine generates intratumoral T cell responses in phase Ib glioblastoma trial. Nature. 2019;565(7738):234‐239. [DOI] [PMC free article] [PubMed] [Google Scholar]
- 218. Borden EC. Interferons alpha and beta in cancer: therapeutic opportunities from new insights. Nat Rev Drug Discov. 2019;18(3):219‐234. [DOI] [PubMed] [Google Scholar]
- 219. Morillon YN, Su Z, Schlom J, Greiner JW. Temporal changes within the (Bladder) tumor microenvironment that accompany the therapeutic effects of the immunocytokine NHS‐IL12.J Immunother Cancer. 2019;7(1):150. [DOI] [PMC free article] [PubMed] [Google Scholar]
- 220. Conesa‐Milian L, Falomir E, Murga J, Carda M, Marco JA. Novel multitarget inhibitors with antiangiogenic and immunomodulator properties. Eur J Med Chem. 2019;170:87‐98. [DOI] [PubMed] [Google Scholar]
- 221. Sun Z, Ren Z, Yang K, et al. A next‐generation tumor‐targeting IL‐2 preferentially promotes tumor‐infiltrating CD8(+) T‐cell response and effective tumor control. Nat Commun. 2019;10(1):3874. [DOI] [PMC free article] [PubMed] [Google Scholar]
- 222. Ladenstein R, Potschger U, Valteau‐Couanet D, et al. Interleukin 2 with anti‐GD2 antibody Ch14.18/CHO (dinutuximab beta) in patients with high‐risk neuroblastoma (HR‐NBL1/SIOPEN): a multicentre, randomised, phase 3 trial. Lancet Oncol. 2018;19(12):1617‐1629. [DOI] [PubMed] [Google Scholar]
- 223. Le Bourgeois T, Strauss L, Aksoylar HI, et al. Targeting T cell metabolism for improvement of cancer immunotherapy. Front Oncol. 2018;8:237. [DOI] [PMC free article] [PubMed] [Google Scholar]
- 224. Martinez‐Outschoorn UE, Peiris‐Pages M, Pestell RG, Sotgia F, Lisanti MP. Cancer metabolism: a therapeutic perspective. Nat Rev Clin Oncol. 2017;14(2):113. [DOI] [PubMed] [Google Scholar]
- 225. Gu L, Yi Z, Zhang Y, et al. Low dose of 2‐deoxy‐D‐glucose kills acute lymphoblastic leukemia cells and reverses glucocorticoid resistance via N‐linked glycosylation inhibition under normoxia. Oncotarget. 2017;8(19):30978‐30991. [DOI] [PMC free article] [PubMed] [Google Scholar]
- 226. Zheng MF, Shen SY, Huang WD. DCA increases the antitumor effects of capecitabine in a mouse B16 melanoma allograft and a human non‐small cell lung cancer A549 xenograft. Cancer Chemother Pharmacol. 2013;72(5):1031‐1041. [DOI] [PubMed] [Google Scholar]
- 227. Wang Y, Tang S, Wu Y, et al. Upregulation of 6‐phosphofructo‐2‐kinase (PFKFB3) by hyperactivated mammalian target of rapamycin complex 1 is critical for tumor growth in tuberous sclerosis complex. IUBMB Life. 2020;72(5):965‐977. [DOI] [PubMed] [Google Scholar]
- 228. Sukumar M, Liu J, Ji Y, et al. Inhibiting glycolytic metabolism enhances CD8+ T cell memory and antitumor function. J Clin Invest. 2013;123(10):4479‐4488. [DOI] [PMC free article] [PubMed] [Google Scholar]
- 229. Peppicelli S, Bianchini F, Calorini L. Extracellular acidity, a “Reappreciated” trait of tumor environment driving malignancy: perspectives in diagnosis and therapy. Cancer Metastasis Rev. 2014;33(2‐3):823‐832. [DOI] [PubMed] [Google Scholar]
- 230. Gorgun G, Calabrese E, Soydan E, et al. Immunomodulatory effects of lenalidomide and pomalidomide on interaction of tumor and bone marrow accessory cells in multiple myeloma. Blood. 2010;116(17):3227‐3237. [DOI] [PMC free article] [PubMed] [Google Scholar]
- 231. Chirasani SR, Leukel P, Gottfried E, et al. Diclofenac inhibits lactate formation and efficiently counteracts local immune suppression in a murine glioma model. Int J Cancer. 2013;132(4):843‐853. [DOI] [PubMed] [Google Scholar]
- 232. Pilon‐Thomas S, Kodumudi KN, El‐Kenawi AE, et al. Neutralization of tumor acidity improves antitumor responses to immunotherapy. Cancer Res. 2016;76(6):1381‐1390. [DOI] [PMC free article] [PubMed] [Google Scholar]
- 233. Feun L, You M, Wu CJ, et al. Arginine deprivation as a targeted therapy for cancer. Curr Pharm Des. 2008;14(11):1049‐1057. [DOI] [PMC free article] [PubMed] [Google Scholar]
- 234. Stasyk OV, Boretsky YR, Gonchar MV, Sibirny AA. Recombinant arginine‐degrading enzymes in metabolic anticancer therapy and bioanalytics. Cell Biol Int. 2015;39(3):246‐252. [DOI] [PubMed] [Google Scholar]
- 235. Steggerda SM, Bennett MK, Chen J, et al. Inhibition of arginase by CB‐1158 blocks myeloid cell‐mediated immune suppression in the tumor microenvironment. J Immunother Cancer. 2017;5(1):101. [DOI] [PMC free article] [PubMed] [Google Scholar]
- 236. Hellmann MD, Gettinger S, Chow L, et al. Phase 1 study of epacadostat in combination with atezolizumab for patients with previously treated advanced non‐small Cell lung cancer. Int J Cancer. 2020. [DOI] [PMC free article] [PubMed] [Google Scholar]
- 237. Watanabe T, Gaedicke S, Guffart E, Firat E, Niedermann G. Adding indoximod to hypofractionated radiotherapy with anti‐PD‐1 checkpoint blockade enhances early NK and CD8(+) T‐cell‐dependent tumor activity. Clin Cancer Res. 2020;26(4):945‐956. [DOI] [PubMed] [Google Scholar]
- 238. Lob S, Konigsrainer A, Rammensee HG, Opelz G, Terness P. Inhibitors of indoleamine‐2,3‐dioxygenase for cancer therapy: can we see the wood for the trees. Nat Rev Cancer. 2009;9(6):445‐452. [DOI] [PubMed] [Google Scholar]
- 239. Ahluwalia GS, Grem JL, Hao Z, Cooney DA. Metabolism and action of amino acid analog anti‐cancer agents. Pharmacol Ther. 1990;46(2):243‐271. [DOI] [PubMed] [Google Scholar]
- 240. Hassanein M, Qian J, Hoeksema MD, et al. Targeting SLC1a5‐mediated glutamine dependence in non‐small cell lung cancer. Int J Cancer. 2015;137(7):1587‐1597. [DOI] [PMC free article] [PubMed] [Google Scholar]
- 241. Leone RD, Zhao L, Englert JM, et al. Glutamine blockade induces divergent metabolic programs to overcome tumor immune evasion. Science. 2019;366(6468):1013‐1021. [DOI] [PMC free article] [PubMed] [Google Scholar]
- 242. Patsoukis N, Bardhan K, Chatterjee P, et al. PD‐1 alters T‐cell metabolic reprogramming by inhibiting glycolysis and promoting lipolysis and fatty acid oxidation. Nat Commun. 2015;6:6692. [DOI] [PMC free article] [PubMed] [Google Scholar]
- 243. O'Sullivan D, van der Windt GJ, Huang SC, et al. Memory CD8(+) T cells use cell‐intrinsic lipolysis to support the metabolic programming necessary for development. Immunity. 2014;41(1):75‐88. [DOI] [PMC free article] [PubMed] [Google Scholar]
- 244. Michalek RD, Gerriets VA, Jacobs SR, et al. Cutting edge: distinct glycolytic and lipid oxidative metabolic programs are essential for effector and regulatory CD4+ T cell subsets. J Immunol. 2011;186(6):3299‐3303. [DOI] [PMC free article] [PubMed] [Google Scholar]
- 245. Zhang Y, Kurupati R, Liu L, et al. Enhancing CD8(+) T cell fatty acid catabolism within a metabolically challenging tumor microenvironment increases the efficacy of melanoma immunotherapy. Cancer Cell. 2017;32(3):377‐391. [DOI] [PMC free article] [PubMed] [Google Scholar]
- 246. Blagih J, Coulombe F, Vincent EE, et al. The energy sensor AMPK regulates T cell metabolic adaptation and effector responses in vivo. Immunity. 2015;42(1):41‐54. [DOI] [PubMed] [Google Scholar]
- 247. Eikawa S, Nishida M, Mizukami S, et al. Immune‐Mediated antitumor effect by type 2 diabetes drug, metformin. Proc Natl Acad Sci USA. 2015;112(6):1809‐1814. [DOI] [PMC free article] [PubMed] [Google Scholar]
- 248. Scharping NE, Menk AV, Whetstone RD, Zeng X, Delgoffe GM. Efficacy of PD‐1 blockade is potentiated by metformin‐induced reduction of tumor hypoxia. Cancer Immunol Res. 2017;5(1):9‐16. [DOI] [PMC free article] [PubMed] [Google Scholar]
- 249. Afzal MZ, Mercado RR, Shirai K. Efficacy of metformin in combination with immune checkpoint inhibitors (anti‐PD‐1/anti‐CTLA‐4) in metastatic malignant melanoma. J Immunother Cancer. 2018;6(1):64. [DOI] [PMC free article] [PubMed] [Google Scholar]
- 250. Patsoukis N, Weaver JD, Strauss L, et al. Immunometabolic regulations mediated by coinhibitory receptors and their impact on T cell immune responses. Front Immunol. 2017;8:330. [DOI] [PMC free article] [PubMed] [Google Scholar]
- 251. Sena LA, Li S, Jairaman A, et al. Mitochondria are required for antigen‐specific T cell activation through reactive oxygen species signaling. Immunity. 2013;38(2):225‐236. [DOI] [PMC free article] [PubMed] [Google Scholar]
- 252. Chamoto K, Chowdhury PS, Kumar A, et al. Mitochondrial activation chemicals synergize with surface receptor PD‐1 blockade for T cell‐dependent antitumor activity. Proc Natl Acad Sci USA. 2017;114(5):E761‐E770. [DOI] [PMC free article] [PubMed] [Google Scholar]
- 253. Sai J, Owens P, Novitskiy SV, et al. PI3K inhibition reduces mammary tumor growth and facilitates antitumor immunity and anti‐PD1 responses. Clin Cancer Res. 2017;23(13):3371‐3384. [DOI] [PMC free article] [PubMed] [Google Scholar]
- 254. De Henau O, Rausch M, Winkler D, et al. Overcoming resistance to checkpoint blockade therapy by targeting PI3Kgamma in myeloid cells. Nature. 2016;539(7629):443‐447. [DOI] [PMC free article] [PubMed] [Google Scholar]
- 255. Zelenay S, van der Veen AG, Bottcher JP, et al. Cyclooxygenase‐dependent tumor growth through evasion of immunity. Cell. 2015;162(6):1257‐1270. [DOI] [PMC free article] [PubMed] [Google Scholar]
- 256. Zhou J, Peng H, Li K, et al. Liver‐resident NK cells control antiviral activity of hepatic T Cells via the PD‐1‐PD‐L1 axis. Immunity. 2019;50(2):403‐417. [DOI] [PubMed] [Google Scholar]
- 257. Larkin J, Hodi FS, Wolchok JD. Combined nivolumab and ipilimumab or monotherapy in untreated melanoma. N Engl J Med. 2015;373(13):1270‐1271. [DOI] [PubMed] [Google Scholar]
- 258. Robert C, Long GV, Brady B, et al. Nivolumab in previously untreated melanoma without BRAF mutation. N Engl J Med. 2015;372(4):320‐330. [DOI] [PubMed] [Google Scholar]
- 259. Weber JS, D'Angelo SP, Minor D, et al. Nivolumab versus chemotherapy in patients with advanced melanoma who progressed after anti‐CTLA‐4 treatment (CheckMate 037): a randomised, controlled, open‐label, phase 3 trial. Lancet Oncol. 2015;16(4):375‐384. [DOI] [PubMed] [Google Scholar]
- 260. Robert C, Schachter J, Long GV, et al. Pembrolizumab versus ipilimumab in advanced melanoma. N Engl J Med. 2015;372(26):2521‐2532. [DOI] [PubMed] [Google Scholar]
- 261. Ribas A, Puzanov I, Dummer R, et al. Pembrolizumab versus investigator‐choice chemotherapy for ipilimumab‐refractory melanoma (KEYNOTE‐002): a randomised, controlled, phase 2 trial. Lancet Oncol. 2015;16(8):908‐918. [DOI] [PMC free article] [PubMed] [Google Scholar]
- 262. Ansell SM, Lesokhin AM, Borrello I, et al. PD‐1 blockade with nivolumab in relapsed or refractory Hodgkin's lymphoma. N Engl J Med. 2015;372(4):311‐319. [DOI] [PMC free article] [PubMed] [Google Scholar]
- 263. Chen R, Zinzani PL, Fanale MA, et al. Phase II Study of the efficacy and safety of pembrolizumab for relapsed/refractory classic Hodgkin lymphoma. J Clin Oncol. 2017;35(19):2125‐2132. [DOI] [PMC free article] [PubMed] [Google Scholar]
- 264. Brahmer J, Reckamp KL, Baas P, et al. Nivolumab Versus docetaxel in advanced squamous‐cell non‐small‐cell lung cancer.N Engl J Med. 2015;373(2):123‐135. [DOI] [PMC free article] [PubMed] [Google Scholar]
- 265. Borghaei H, Paz‐Ares L, Horn L, et al. Nivolumab versus docetaxel in advanced nonsquamous non‐small‐cell lung cancer.N Engl J Med. 2015;373(17):1627‐1639. [DOI] [PMC free article] [PubMed] [Google Scholar]
- 266. Herbst RS, Baas P, Kim DW, et al. Pembrolizumab versus docetaxel for previously treated, PD‐L1‐positive, advanced non‐small‐cell lung cancer (KEYNOTE‐010): a randomised controlled trial. Lancet. 2016;387(10027):1540‐1550. [DOI] [PubMed] [Google Scholar]
- 267. Langer CJ, Gadgeel SM, Borghaei H, et al. Carboplatin and pemetrexed with or without pembrolizumab for advanced, non‐squamous non‐small‐cell lung cancer: a randomised, phase 2 cohort of the open‐label KEYNOTE‐021 Study. Lancet Oncol. 2016;17(11):1497‐1508. [DOI] [PMC free article] [PubMed] [Google Scholar]
- 268. Reck M, Rodriguez‐Abreu D, Robinson AG, et al. Pembrolizumab versus chemotherapy for PD‐L1‐Positive non‐small‐cell lung cancer. N Engl J Med. 2016;375(19):1823‐1833. [DOI] [PubMed] [Google Scholar]
- 269. Fehrenbacher L, Spira A, Ballinger M, et al. Atezolizumab versus docetaxel for patients with previously treated non‐small‐cell lung cancer (POPLAR): a multicentre, open‐label, phase 2 randomised controlled trial. Lancet. 2016;387(10030):1837‐1846. [DOI] [PubMed] [Google Scholar]
- 270. Antonia SJ, Villegas A, Daniel D, et al. Durvalumab after chemoradiotherapy in stage III non‐small‐cell lung cancer. N Engl J Med. 2017;377(20):1919‐1929. [DOI] [PubMed] [Google Scholar]
- 271. Overman MJ, McDermott R, Leach JL, et al. Nivolumab in patients with metastatic DNA mismatch repair‐deficient or microsatellite instability‐high colorectal cancer (CheckMate 142): an open‐label, multicentre, phase 2 study. Lancet Oncol. 2017;18(9):1182‐1191. [DOI] [PMC free article] [PubMed] [Google Scholar]
- 272. Fuchs CS, Niedzwiecki D, Mamon HJ, et al. Adjuvant chemoradiotherapy with epirubicin, cisplatin, and fluorouracil compared with adjuvant Chemoradiotherapy with fluorouracil and leucovorin after curative resection of gastric cancer: results from CALGB 80101 (Alliance). J Clin Oncol. 2017;35(32):3671‐3677. [DOI] [PMC free article] [PubMed] [Google Scholar]
- 273. Petrillo A, Tirino G, Zito MF, et al. Nivolumab in heavily pretreated metastatic gastric cancer patients: real‐life data from a western population. Onco Targets Ther. 2020;13:867‐876. [DOI] [PMC free article] [PubMed] [Google Scholar]
- 274. Makker V, Taylor MH, Aghajanian C, et al. Lenvatinib plus pembrolizumab in patients with advanced endometrial cancer. J Clin Oncol. 2020. 10.1200/JCO.19.02627 [DOI] [PMC free article] [PubMed] [Google Scholar]
- 275. Ferris RL, Blumenschein GJ, Fayette J, et al. Nivolumab for recurrent squamous‐cell carcinoma of the head and neck. N Engl J Med. 2016;375(19):1856‐1867. [DOI] [PMC free article] [PubMed] [Google Scholar]
- 276. Seiwert TY, Burtness B, Mehra R, et al. Safety and clinical activity of pembrolizumab for treatment of recurrent or metastatic squamous cell carcinoma of the head and neck (KEYNOTE‐012): an open‐label, multicentre, phase 1B trial. Lancet Oncol. 2016;17(7):956‐965. [DOI] [PubMed] [Google Scholar]
- 277. Sharma P, Retz M, Siefker‐Radtke A, et al. Nivolumab in metastatic urothelial carcinoma after platinum therapy (CheckMate 275): a multicentre, single‐arm, phase 2 trial. Lancet Oncol. 2017;18(3):312‐322. [DOI] [PubMed] [Google Scholar]
- 278. Bellmunt J, de Wit R, Vaughn DJ, et al. Pembrolizumab as second‐line therapy for advanced urothelial carcinoma. N Engl J Med. 2017;376(11):1015‐1026. [DOI] [PMC free article] [PubMed] [Google Scholar]
- 279. Balar AV, Castellano D, O'Donnell PH, et al. First‐Line pembrolizumab in cisplatin‐ineligible patients with locally advanced and unresectable or metastatic urothelial cancer (KEYNOTE‐052): a multicentre, single‐arm, phase 2 study. Lancet Oncol. 2017;18(11):1483‐1492. [DOI] [PubMed] [Google Scholar]
- 280. Balar AV, Galsky MD, Rosenberg JE, et al. Atezolizumab as first‐line treatment in cisplatin‐ineligible patients with locally advanced and metastatic urothelial carcinoma: a single‐arm, multicentre, phase 2 trial. Lancet. 2017;389(10064):67‐76. [DOI] [PMC free article] [PubMed] [Google Scholar]
- 281. Rosenberg JE, Hoffman‐Censits J, Powles T, et al. Atezolizumab in patients with locally advanced and metastatic urothelial carcinoma who have progressed following treatment with platinum‐based chemotherapy: a single‐arm, multicentre, phase 2 trial. Lancet. 2016;387(10031):1909‐1920. [DOI] [PMC free article] [PubMed] [Google Scholar]
- 282. Powles T, O'Donnell PH, Massard C, et al. Efficacy and safety of durvalumab in locally advanced or metastatic urothelial carcinoma: updated results from a phase 1/2 open‐label study. JAMA Oncol. 2017;3(9):e172411. [DOI] [PMC free article] [PubMed] [Google Scholar]
- 283. Patel MR, Ellerton J, Infante JR, et al. Avelumab in metastatic urothelial carcinoma after platinum failure (JAVELIN solid tumor):pooled results from two expansion cohorts of an open‐label, phase 1 trial. Lancet Oncol. 2018;19(1):51‐64. [DOI] [PMC free article] [PubMed] [Google Scholar]
- 284. Kaufman HL, Russell J, Hamid O, et al. Avelumab in patients with chemotherapy‐refractory metastatic Merkel cell carcinoma: a multicentre, single‐group, open‐label, phase 2 trial. Lancet Oncol. 2016;17(10):1374‐1385. [DOI] [PMC free article] [PubMed] [Google Scholar]
- 285. Rogers JE, Xiao L, Trail A, et al. Nivolumab in combination with irinotecan and 5‐fluorouracil (FOLFIRI) for refractory advanced gastroesophageal cancer. Oncology. 2020;98(5):289‐294. [DOI] [PubMed] [Google Scholar]
- 286. Le DT, Uram JN, Wang H, et al. PD‐1 blockade in tumors with mismatch‐repair deficiency. N Engl J Med. 2015;372(26):2509‐2520. [DOI] [PMC free article] [PubMed] [Google Scholar]
- 287. El‐Khoueiry AB, Sangro B, Yau T, et al. Nivolumab in patients with advanced hepatocellular carcinoma (CheckMate 040): an open‐label, non‐comparative, phase 1/2 dose escalation and expansion trial. Lancet. 2017;389(10088):2492‐2502. [DOI] [PMC free article] [PubMed] [Google Scholar]
- 288. Chahoud J, Msaouel P, Campbell MT, et al. Nivolumab for the treatment of patients with metastatic non‐clear cell renal cell carcinoma (nccRCC): a single‐institutional experience and literature meta‐analysis. Oncologist. 2020;25(3):252‐258. [DOI] [PMC free article] [PubMed] [Google Scholar]