Biochem. J. (2021) 478 (4): 735–748 https://doi.org/10.1042/BCJ20200952
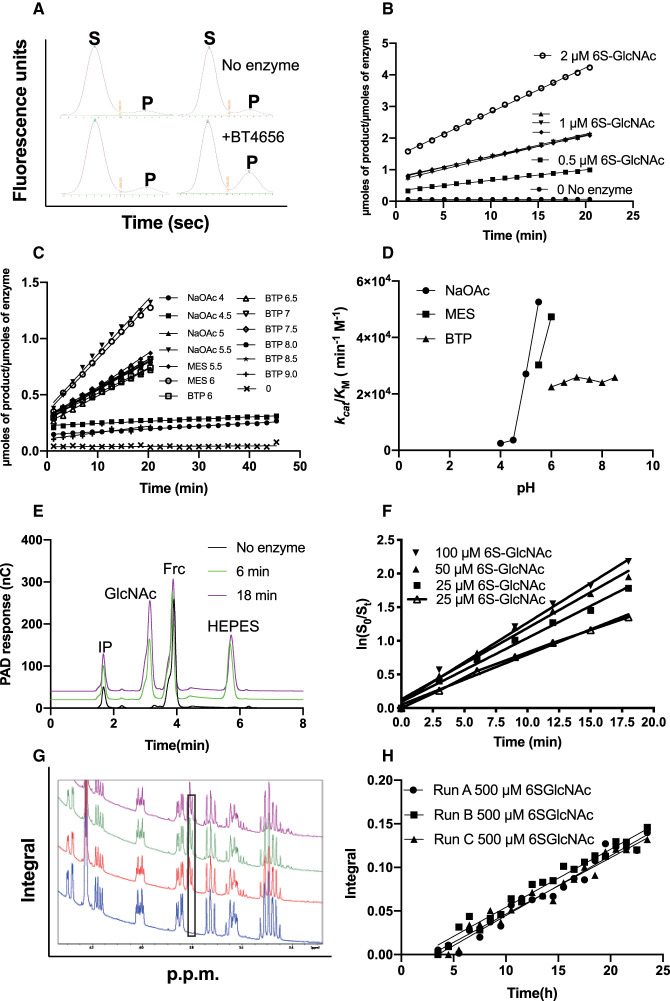
The authors would like to make the following corrections to their article. The equation appearing in the section ‘A novel microfuidic-based desulfation assay’ of the Methods, should appear as V0=(kcat/KM)[S][E]. The y-axis in Figure 2H should be ‘Integral’. The corrected version can be seen below. The footnote in Table 1 should read “The table list the kinetic values and the corresponding amount of resources required in terms of time and components. *Indicates value is a specific activity (h−1). All experiments represent technical triplicates.” The authors apologise for any confusion caused by these errors.
Figure 2. Side-by-side comparison of enzyme activity and kinetic data calculated using capillary electrophoresis (CE) and microfluidics, HPAEC or NMR.
(A) Raw capillary electrophoresis data outputs generated by the PerkinElmer EZ Reader II software. S indicates sulfated substrate peak and P desulfated product peak, a snapshot of an identical time point is shown in the presence and absence of the sulfatase; (B) kcat/KM determinations calculated using capillary electrophoresis coupled to fluorescence detection, using 100 nM BT4656S1_11; (C) linear rates produced at a range of pH values to determine the pH optimum for BT4656 using 1 µM substrate and 350 nM BT4656S1_11; (D) kcat/KM determination produced from C plotted against pH; (E) Raw data from HPAEC chromatograms, IP = injection peak, GlcNAc = N-acetylglucosamine product produced by BT4656S1_11, Frc = Fructose used as an internal standard to enable accurate quantification between runs and HEPES indicates dialysis buffer ‘contamination’; (F) kcat/KM determinations produced using HPAEC coupled to PAD using 800 nM BT4656S1_11; (G) Raw integrals from NMR experiment using 500 µM substrate and 10 nM nM BT4656S1_11; (H) Specific activity produced from raw NMR data presented in G, the black box indicates the appearance of a desulfated O6 product, which increases with time.


