ABSTRACT
We investigated the gene-expression variation among humans by analysing previously published mRNA-seq and ribosome footprint profiling of heart left-ventricles from healthy donors. We ranked the genes according to their coefficient of variation values and found that the top 5% most variable genes had special features compared to the rest of the genome, such as lower mRNA levels and shorter half-lives coupled to increased translation efficiency. We observed that these genes are mostly involved with immune response and have a pleiotropic effect on disease phenotypes, indicating that asymptomatic conditions contribute to the gene expression diversity of healthy individuals.
KEYWORDS: Gene expression profiling, genetic variation, human heart, translatome, ribosome profiling, heart ventricles
Introduction
The gene expression variation across different individuals arises from a complex interplay between the environment and the cellular responses to a wide range of stimuli and, therefore, can be attributed to either genetic or non-genetic factors [1]. To pinpoint the gene expression responses linked to a specific illness, one must also understand which are the genes presenting the highest degree of expression variation across the general human population. Most of the studies comparing gene-expression levels have been done in the context of disease. These studies aimed to identify changes in cellular and molecular processes associated with the illness and/or to identify expression quantitative trait loci (eQTLs) or splicing QTLs (sQTLs) related to the disease state. In such studies, data on gene expression variation among non-disease individuals are not explicitly discussed. Instead, the non-disease group is treated as a control, and the inter-individual variation data are embedded in the calculation of differential gene expression. By contrast, studies dealing with phenotypic and genetic diversity in human populations directly describe the natural variation of gene expression. Such studies were levered by international projects, such as HapMap [2] and Gtex [3,4], designed to capture the natural genetic variance of the human population. Following this rationale, different groups showed that gene expression variation between individuals is greater than the variation among populations and mapped many polymorphic genetic variances that influence gene expression differences between individuals [5–13]. These studies access genome-wide gene expression at the mRNA level by microarray or by mRNA sequencing (mRNA-seq). More recently, the development of the ribosome profiling (RP) technique, which captures mRNA footprints protected by translating ribosomes [14], allowed the direct interrogation of the translatome using mRNA-seq. However, there are few studies aimed to compare gene regulation results obtained through RNA-seq and ribosome profiling [15], and most of these references focus on the disease state.
In this work, we accessed the natural variation in gene expression using a specific dataset containing RNA-seq and RP data of healthy donors’ left-ventricle heart tissue. Using a stringent criterium, we selected a group of genes with a high coefficient of variation (CV) between individuals. Next, we analysed several parameters related to gene expression control, such as translation efficiency, mRNA and protein half-life, and protein abundance. The genes with high CV presented high translation efficiency while their mRNA levels and mRNA half-lives were shorter than the entire group of transcripts, suggesting an optimization for fast, transient expression. Consistently, many of these genes are involved in immune response and response to virus infection and have been identified as pleiotropic factors involved in the disease phenotype. We also directly compared the most variable genes in the RNA-seq and RP profiling datasets. Even though these techniques show a good general correlation, most genes in the high CV group obtained with each technique did not coincide. This result may arise not only from technical particularities of the RP assay but also from the additional layers of regulation influencing the translation process.
Results and discussion
To study cardiac mRNA expression and variation among individuals, we used previously published mRNA-seq and ribosome profiling data from fifteen different donors (Supplementary Table S1). Those individuals were used as controls in a large study with dilated cardiomyopathy (DCM) patients [16]. From the clinical perspective, the fifteen individuals presented no heart-related pathology [16]. Our first aim was to compare the Spearman correlation among the mRNA-seq data e ribosome profiling (RP) data for each individual (Fig. 1A,B). Ribosome profiling involves sequencing library preparation and data analysis procedures that are similar to the ones used for RNA-seq. However, RP involves additional steps before sequencing, such as ribosome purification and endonucleolytic cleavage of non-protected mRNA. In this way, ribosome profiling targets only mRNA sequences protected by the ribosome during decoding by translation [17]. Usually, there is a strong positive correlation between RNA-seq and RP data [18], but this is not necessarily true for all genes. For example, genes with efficient ribosome initiation might have a large amount of RP protected reads, even with relatively few copies of mRNA [19]. Fig. 1A represents a scatter plot of mRNA-seq vs. RP data from one of the individuals from the data set. We observed a strong positive Spearman’s correlation coefficient (ρ = 0.80) between the two data. When the same analysis was extended to the other 14 subjects, we observed correlation coefficient values ranging from 0.47 to 0.85 (Fig. 1B). Then, we analysed how gene expression correlates between individuals. The correlation matrix using mRNA-seq data revealed two main clusters (Fig. 1C). The first cluster (B, M, and N individuals) had correlation coefficient values ranging from 0.72 to 0.89, while the second cluster (A, C, D, E, F, G, H, I, J, K, L, and O individuals) grouped similar individuals with ρ values ranging from 0.91 to 0.96 (Fig. 1C). We observed a different clustering pattern when the RP data was used to build the matrix. The A individual was separated from the others while the N individual clustered together with the rest of the group (Fig. 1D). Notably, the RP data correlations with different individuals resulted in a broader variation of correlation coefficient values (ρ = 0.58 to 0.94) than the variation observed with correlation analysis of the RNA-seq data (ρ = 0.72 to 0.96).
Figure 1.
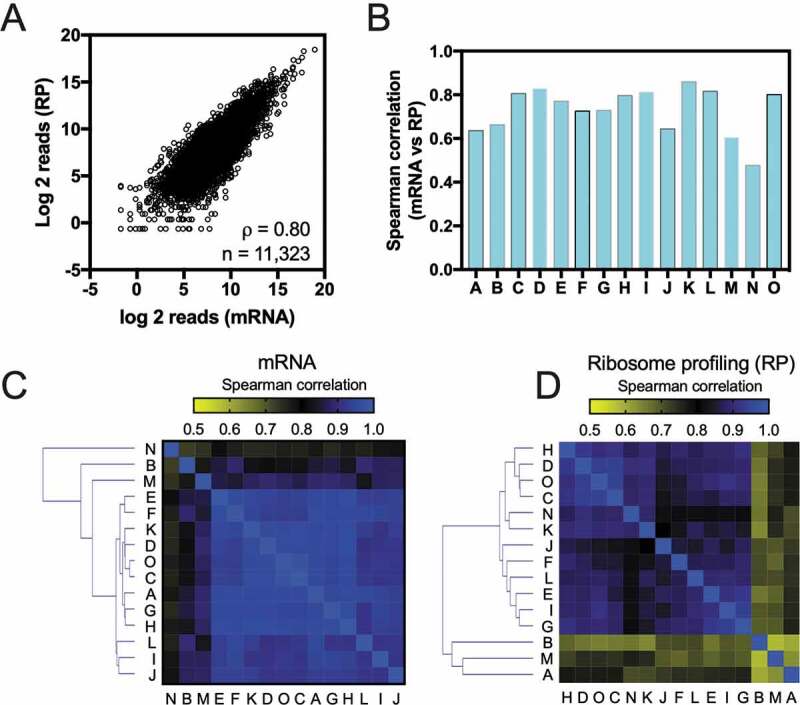
Correlation analyses between mRNA-seq data and ribosome profiling from a healthy human heart left ventricles. (A) Gene expression measured by RNA-seq compared to gene expression measured by ribosome profiling (RP). Spearman correlation (ρ) is indicated. (B) The Spearman correlation (ρ) values between RNA-seq and ribosome profiling (RP) data for each of the fifteen individuals used herein. A correlation matrix of the Spearman correlation (ρ) values obtained with RNA-seq data (C) or ribosome profiling data (D) among the individuals
Next, we used RNA-seq data to select the group of genes that had the highest variability across healthy individuals. To make our analysis more stringent and less suscetible to variations introduced by particular subjects, we excluded the three individuals that presented the lower correlation coefficient values for mRNA expression across the population (B, M, and N individuals, Fig. 1C). We determined the expression variability between individuals by calculating the coefficient of variation (CV) of each gene. Fig. 2A shows the CV of four representative genes. While a low variation value (CV = 0.009) was observed for the gene RTFDC1, a higher variation value (CV = 0.19) was observed for SERPINE1, comprising a 43-fold difference between the lower vs. higher values (Fig. 2A). The statistical test to identify the most variable group of genes was based on the assumption that the top 2.5% more expressed genes are the housekeeping genes of each sample. Then, the CV value of each of the other genes was compared to the mean CV value of this group of housekeeping genes. We observed that 32.2% of the genes had CV values different from the house-keeping group (p < 0.05). We focused on the top 5% genes with the highest CV (Fig. 2B, 565 genes).
Figure 2.
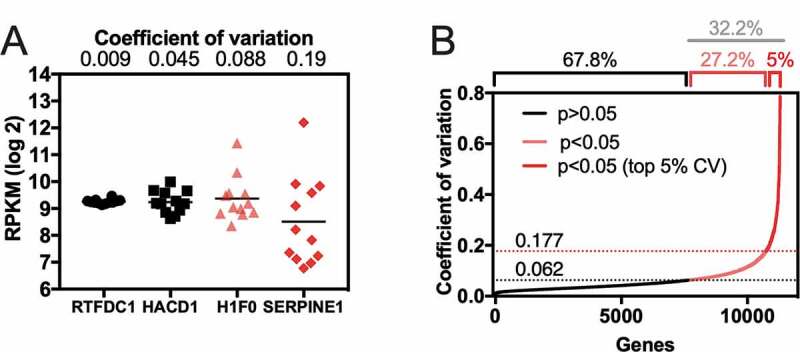
Expression variability of the heart transcriptome among individuals. (A) Example of expression variation of four genes with a variation coefficient ranging from low (0.009, RTFDC1) to high (0.19, SERPINE1). The expression of those genes was measured by RNA-seq and plotted as reads per kilobase per million (RPKM). (B) Cumulative distribution plot of the coefficient of variation values obtained from a healthy human heart left ventricles (12 individuals). Values of CV higher than 0.062 (dotted black line) were considered statistically different (p < 0.05) when compared with the average CV from housekeeping genes (see details in methodology). The top 5% higher CV genes have CV values higher than 0.177 (dotted red line)
To determine if the results obtained with these 12 individuals would represent a larger human population, we analysed RNA-seq data from 432 heart left-ventricles of different healthy donors, available through the GTex database. The mean of gene expression values for each gene of the van Heesch’s dataset and the Gtex dataset had a positive correlation coefficient of 0.84 (Fig S1A), and the CV values had a correlation coefficient of 0.52 (Fig S1B). The group of the most variable genes from the GTex (CV #2, with 550 genes) contained 297 genes in common (or 54%) with the group of the most variable genes from van Heesch (CV #1, with 565 genes) (Fig S2A). The Gene ontology analysis of the groups #1 and #2 showed that the genes were involved in similar molecular processes (Fig S2B-C), mainly inflammatory process. These results indicate that the van Heesch’s group generally reflects the results obtained with a larger RNA-seq dataset. The next objective was to determine if the genes with the most variable transcriptional levels would also have the most variable translational levels between individuals. For this, we repeated the methodology described above using RP data and obtained a group of 565 genes ranked as the top 5% with the highest CV values (p < 0.05). When we compared the mRNA-seq high CV group with the RP high CV group, we found that only 148 genes (or 26%) were the same (not shown). This is three-fold more than what would be expected by random (8.5%) but is 2-fold less than the intersection between Gtex and van Heesch’s RNA-seq high CV groups (FigS2A). Despite this difference in the high CV groups, we observed a meaningful Spearman correlation of 0.60 between the overall CV values obtained with mRNA-seq and RP datasets (Fig S3A). Most of the identified outliers were genes with high RP-CV and low mRNA-seq CV (Fig S3A, red points). Differences in the techniques can account for this lack of correlation, but biological mechanisms can be contributing to this result. One possibility is the effect of mRNA subcellular localization on translation. Stress granules (SGs) are non-membrane-bound assemblies of protein and RNA that form when translation initiation is limited by stress. Parker and colleagues recently showed that some mRNAs are enriched in SG under stress conditions and, SG localization leads to lower mRNA translation [20]. The SG transcriptome [20] allowed us to give to each mammalian gene an SG score directly proportional to the fraction of each mRNA found in SG under stress (Supplementary Table S2). We observed that the outlier genes of Figure S3A presented higher SG scores compared to the overall genome (Fig S3B). As mRNA subcellular localization affects translation in a way independent from the mRNA levels, this could represent a biological mechanism that contributes to the lack of correlation between RP and mRNA seq observed for some genes. When comparing DCM hearts vs. control hearts, van Heesch and colleagues found that from the 2648 genes differentially expressed by RP, only 964 genes could have their expression levels explained by transcriptional differences. Our result agrees with this previous observation and emphasizes that healthy individuals also present variances in translation that are not necessarily linked to variances in mRNA levels.
Next, we asked whether the group of genes with high CV values, derived from RNA-seq (van Heesch’s CV #1), would have any particular signature concerning a variety of parameters related to gene expression. For this analysis, protein abundance [21], mRNA abundance [21], and protein to mRNA ratios [21] were derived from a study that investigated determinants of gene expression in several human tissues, including the heart. The translation efficiency value for each gene was computed using van Heesch’s RP [16] and RNA-seq datasets. Finally, half-life values for mRNA [22] and protein [23] were obtained from studies with human cells (Fig. 3). As controls, we used two other lists of genes derived from Eraslan’s study [21]: one containing the top 5% most abundant proteins in heart tissue and the other containing the least 5% expressed heart proteins [21]. As expected, the genes coding for the top 5% most abundant proteins had higher values for all analysed parameters, compared to the overall genome (Fig. 3A-F, compare blue bars with black bars, see also Table S2). Accordingly, the least expressed gene list had lower expression indicators, except for the protein half-life that was no different from the control group (Fig. 3E). The high CV genes followed a particular profile, characterized by lower mRNA abundance, shorter half-lives (panel 3B, 3 F), and higher TE (panel 3D). Combined, these features suggest that genes with high CV may be optimized for transient, yet fast and efficient expression.
Figure 3.
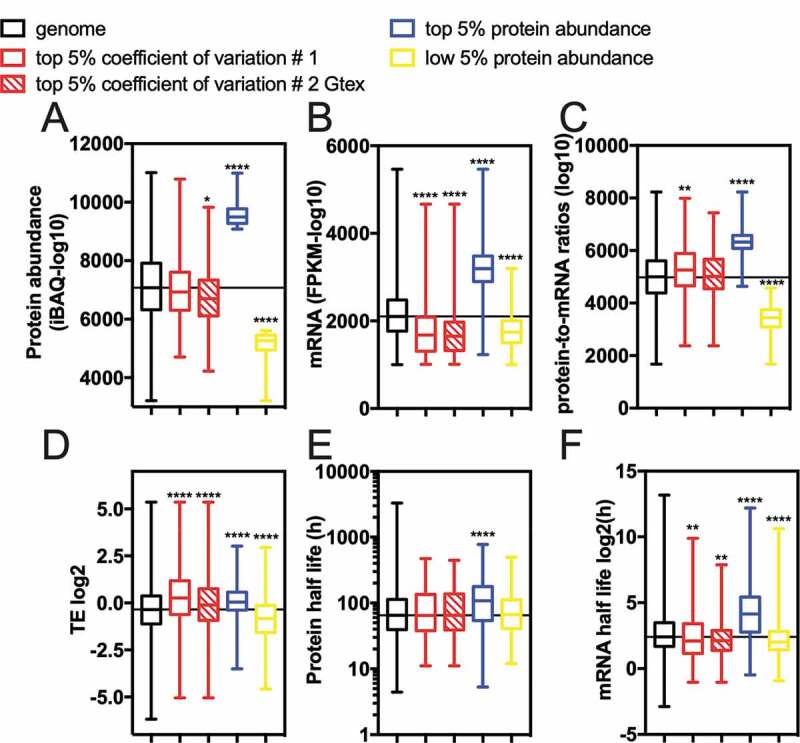
Indicators of expression for the genes with a high coefficient of variation (CV) in healthy human heart left ventricle tissue. (A) protein abundance [21], (B) mRNA abundance [21], (C) protein-to-mRNA ratios [21], (D) translation efficiency (TE) [16], (E) protein half-lives [23], and (F) mRNA half-lives [22] for genes with a high coefficient of variation of the genome. As a positive control, we used the top 5% most abundant proteins of cardiac proteome [21]. ANOVA Kruskal-Wallis test *0.011, **0.0054, and ****<0.0001
The gene ontology analyzes (GO) of genes with high CV showed that several pathways were over-represented, including immune response and metal homeostasis (Fig S2 and Table S3). Next, to identify co-regulation patterns within the high CV list #1, we used the mRNA-seq gene expression data for these 565 genes to build a correlation matrix (Fig. 4A, 565 genes X 565 genes = 319,225 correlations). We defined eleven clusters. The gene interactions from each cluster were analysed using the STRING database, which compiles protein-protein interactions (physical and functional) [24]. We found that 4 clusters were enriched in specific pathways Fig. 4B-E (see also Table S4). Genes related to the renal system regulation were upregulated in individuals A, C, F, I, and L (Fig. 4B). The other three main clusters were enriched in genes related to the immune system (Fig. 4C-E).
Figure 4.
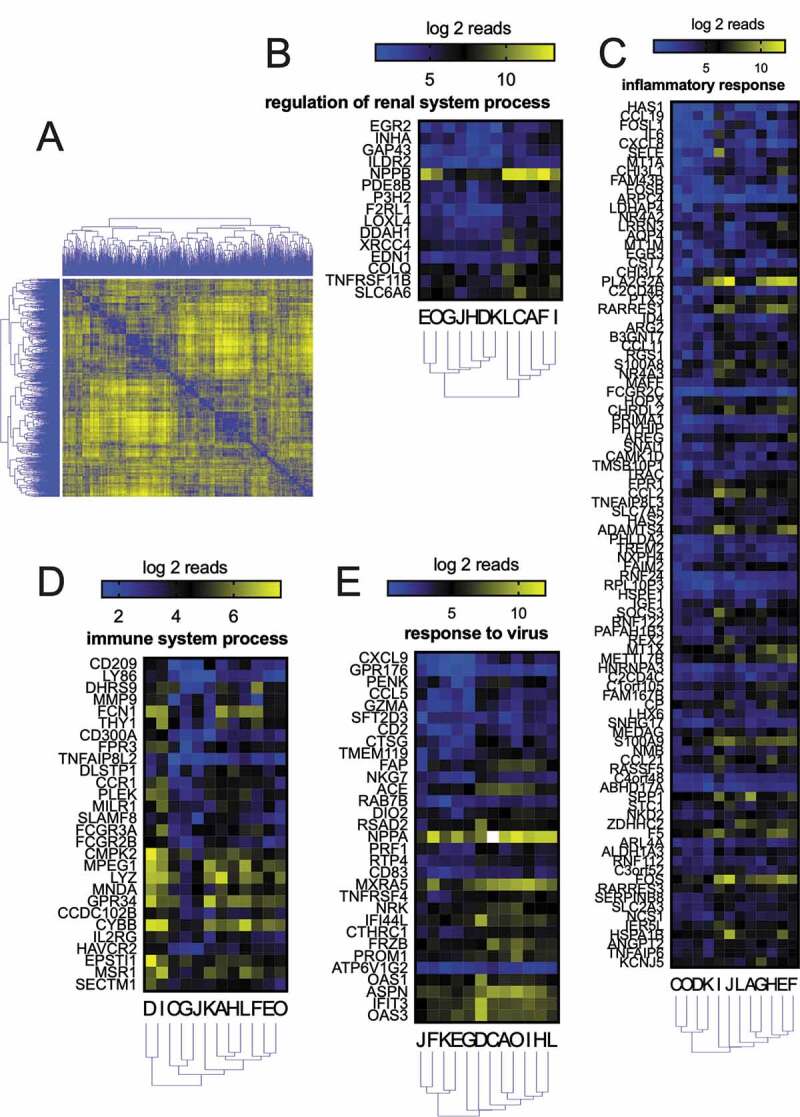
Co-regulation analyzes of genes with a high coefficient of variation (CV) measured by RNA-seq. (A) The distance matrix was created from the gene level (565 genes) clustering-based on co-regulation among twelve individuals. Eleven main clusters were found. Each cluster gene list was analysed by STRING to found predicted protein-protein interactions (Table S3). Four main pathways were found, namely, regulation of renal system process (B), inflammatory response (C), immune system process (D), and response to the virus (E)
Finally, we analysed whether the genes with high CV in the cardiac transcriptome were previously associated with disease. To address this point, we used DisGeNET, a platform that integrates disease-associated genes and variants from multiple sources [25]. The DisGeNET gives three kinds of scores: i) the ‘disease score’ reflects the disease genes associations that are reported by several databases [25]; ii) the ‘disease specificity index’ means that the gene or gene variant is disease-specific; and, iii) the ‘disease pleiotropy index’ calculates the score for the disease-promiscuous genes or variants. The high CV genes had the same overall distribution of disease score values as the entire genome (Fig. 5A, black bars compared with red bars). However, the high CV list had lower disease specificity index scores and higher scores for disease pleiotropy (Fig. 5C). That is, genes with high CV among healthy individuals tend to be non-specifically associated with disease. Therefore, asymptomatic conditions or infections may account for much of the variation observed between individuals.
Figure 5.
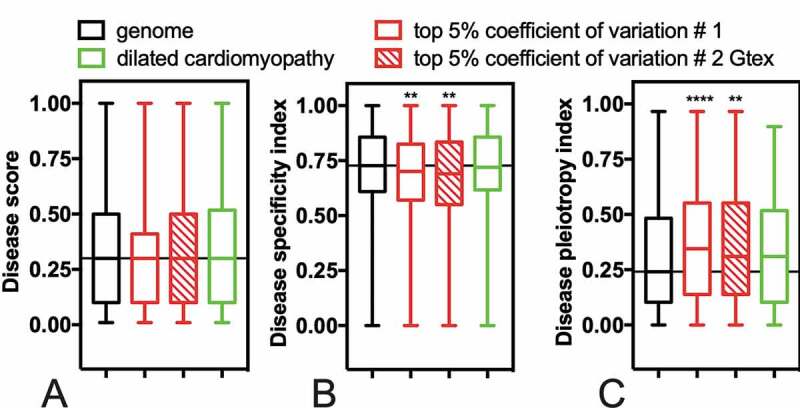
Genes with a high coefficient of variation are associated with pleiotropic diseases. The disease scores (A), disease specificity indexes (B), and disease pleiotropy indexes (C) were calculated for each gene using the DisGeNET database [25]. Boxplots compare the different disease indexes for genes with a high coefficient of variation (top 5%) with the genome. As a control, we used a list of genes identified as altered in dilated cardiomyopathy [16]. We expected to find differences among the dilated cardiomyopathy-related genes compared to the genome, but it was not the case. ANOVA Kruskal-Wallis test **0.006 and ****<0.0001
Previous work linked high variability in the expression of specific genes to differential susceptibility to diseases among human [26,27]. Here, we showed that genes with a high coefficient of variation in cardiac transcriptome possess features associated with high translational activity, such as high protein to RNA ratios and high translation efficiency (Fig. 3C, D). Similar features were observed with stress-related genes in yeast [28]. Since the expression of genes with high CV seems to respond to external stimuli (Fig. 4), efficient translation can promote a fast up-regulation of adaptive pathways. The short mRNA half-lives of the genes with high CV suggests that those genes are transiently regulated (Fig. 3F). A classic example of a transiently regulated gene is the expression control of tumour necrosis factor-alpha (TNF-α) mRNA [29], which is induced in the myocardium upon exposure to endotoxins [30]. TNF-α and other transiently expressed cytokine mRNAs contain an AU-rich element (ARE) in their 3ʹUTR region [28]. ARE and other 3ʹUTR elements present in TNF-α decrease the TNF-α mRNA stability through the action of RNA binding proteins that promote mRNA decay [31]. The loss of these regulatory elements results in TNF-α mRNA stabilization, leading to autoimmune inflammatory diseases and heart valve disease [31,32]. Following this model, many of the genes that we found to have a high CV among healthy individuals were involved in inflammatory and immune responses and should have a tightly regulated expression.
Materials and methods
| Data | Source |
| mRNA abundance (human heart) | van Heesch et al., 2019 |
| mRNA abundance (human heart) | gtexportal.org/home/ |
| Ribosome profiling (human heart) | van Heesch et al., 2019 |
| Dilated cardiomyopathy (DCM) genes | van Heesch et al., 2019 |
| Translation efficiency (human heart) | van Heesch et al., 2019 |
| Protein abundance (human heart) | Eraslan et al., 2019 |
| mRNA abundance (human heart) | Eraslan et al., 2019 |
| Protein per RNA amount (human heart) | Eraslan et al., 2019 |
| Protein half-life (human hepatocyte) | Mathieson et al., 2018 |
| mRNA half-life (human embryonic kidney 293 cells) | Narula et al., 2019 |
| Stress granules score (human osteosarcoma U-2 OS cells) | Khong et al., 2017 |
| Disease score | Piñero et al., 2020 |
| Disease specificity index | Piñero et al., 2020 |
| Disease pleiotropy index | Piñero et al., 2020 |
Data sources
Coding sequences and annotation of Homo sapiens were obtained from the Ensembl Genome Browser (http://ensemblgenomes.org/).
Statistical analyses, correlations, and raw data
The raw data used to create all Figures and the statistical analyses are presented in the Supplementary Tables (1–4). The statistical test used for Figs. 3 and 5 was the ANOVA Kruskal-Wallis test. Outliers of the Figure S3A were identified by Robust regression and Outlier removal (ROUT) method with Q = 1%. The statistical test used for Figure S3B was the Kolmogorov-Smirnov t-test. All statistical analyses were performed with GraphPad Prism 7 software.
GTEx data
To analyse the expression data from the GTEx database [3,4] (https://gtexportal.org/home/) for the left ventricle, we wrote two algorithms in Python to get data from Left Ventricle experiments. The first uses the annotation file downloaded from the GTEx portal in.txt format and creates an output file containing only the annotations that contained the key term ‘left ventricle.’ The second algorithm uses the output from GetTranscripts.py, and any RNA-seq data downloaded from the GTEx portal and writes as output only the data from the experiments listed in the GetTranscript.py output. The algorithms were deposited on Github repository https://github.com/RodolfoCarneiro/left_ventricle.
STRING analyses
The STRING database (http://string-db.org/)[24] was used to provide a critical assessment and integration of protein-protein interactions from the clusters of Fig. 4.
Clustering analysis
All clustering analyses were performed by the Euclidean distance using Orange 3 software [33].
Translation efficiency calculation
Translation efficiency for each gene was calculated by dividing the RNA-seq reads by ribosome profiling reads. Next, the average translation efficiency for each gene from the 12 individuals was calculated (see Table S2).
Calculation of coefficient of variation
The expression data were log-transformed (base = 2), and means, standard deviations, and gene to gene coefficients of variation were calculated. Genes with low expression were considered rare, i.e., those with an expression equal to or less than 1% of the genes in 75% (9 out of 12) of the samples. Similarly, those genes with high expression, i.e., those with an expression equal to or greater than 97.5% of the genes in 75% (9 out of 12) of the samples, were considered constitutive (house-keeping). After this, tests of equal coefficients of variation between each gene and the coefficient of variation of the mean expression of the genes selected as constitutive were calculated [34,35]. Genes with coefficient of variation higher than the CV of the constitutive group were considered to be those whose adjusted p-value by the Bonferroni method was less than 0.05 (alpha = 0.1) and the coefficient of variation was higher than the coefficient of variation of the mean expression of the constitutive genes. We used an asymptotic test for CV’s equality and a modified signed-likelihood ratio test (SLRT) for CV’s equality. Both tests were implemented in the R package cvequality and, SLRT evaluation was made as previously described [35].
Disease score database
The DisGeNET (http://disgenet.org/) was used as a platform to score the disease-associated genes and variants from multiple sources [25].
Supplementary Material
Acknowledgments
We thank Rodrigo Requião and Carlos G. Schrago for helpful discussions. We thank Leonardo Maciel for critically reading the manuscript. We also thank Jared Nedzel from Broad Institute for help with the Gtex analyzes.
Funding Statement
This work was supported by Conselho Nacional de Desenvolvimento Científico e Tecnológico (CNPq), Fundação de Amparo à Pesquisa do Estado do Rio de Janeiro (FAPERJ), and Coordenação de Aperfeiçoamento de Pessoal de Nível Superior (CAPES).
Disclosure statement
The authors declare that they have no conflicts of interest with the contents of this article.
Supplementary material
Supplemental data for this article can be accessed here.
References
- [1].Hulse AM, Cai JJ.. Genetic variants contribute to gene expression variability in humans. Genetics. 2013;193:95–108. [DOI] [PMC free article] [PubMed] [Google Scholar]
- [2].Frazer KA, Ballinger DG, Cox DR, et al. A second generation human haplotype map of over 3.1 million SNPs. Nature. 2007;449:851–861. [DOI] [PMC free article] [PubMed] [Google Scholar]
- [3].Aguet F, Brown AA, Castel SE, et al. Genetic effects on gene expression across human tissues. Nature. 2017;550:204–213. [DOI] [PMC free article] [PubMed] [Google Scholar]
- [4].Consortium TGte . The GTEx consortium atlas of genetic regulatory effects across human tissues. Science. 2020;369:1318–1330. [DOI] [PMC free article] [PubMed] [Google Scholar]
- [5].Storey JD, Madeoy J, Strout JL, et al. Gene-expression variation within and among human populations. Am J Hum Genetics. 2007;80:502–509. [DOI] [PMC free article] [PubMed] [Google Scholar]
- [6].Heinig M, Adriaens ME, Schafer S, et al. Natural genetic variation of the cardiac transcriptome in non-diseased donors and patients with dilated cardiomyopathy. Genome Biol. 2017;18:170. [DOI] [PMC free article] [PubMed] [Google Scholar]
- [7].Heinig M. Using gene expression to annotate cardiovascular GWAS loci. Front Cardiovasc Med. 2018;5:59. [DOI] [PMC free article] [PubMed] [Google Scholar]
- [8].Stranger BE, Nica AC, Forrest MS, et al. Population genomics of human gene expression. Nat Genet. 2007;39:1217–1224. [DOI] [PMC free article] [PubMed] [Google Scholar]
- [9].Stranger BE, Forrest MS, Dunning M, et al. Relative impact of nucleotide and copy number variation on gene expression phenotypes. Science. 2007;315:848–853. [DOI] [PMC free article] [PubMed] [Google Scholar]
- [10].Spielman RS, Bastone LA, Burdick JT, et al. Common genetic variants account for differences in gene expression among ethnic groups. Nat Genet. 2007;39:226–231. [DOI] [PMC free article] [PubMed] [Google Scholar]
- [11].Crawford DL, Oleksiak MF. The biological importance of measuring individual variation. J Exp Biol. 2007;210:1613–1621. [DOI] [PubMed] [Google Scholar]
- [12].Whitehead A, Crawford DL. Variation in tissue-specific gene expression among natural populations. Genome Biol. 2005;6:R13. [DOI] [PMC free article] [PubMed] [Google Scholar]
- [13].Oleksiak MF, Roach JL, Crawford DL. Natural variation in cardiac metabolism and gene expression in Fundulus heteroclitus. Nat Genet. 2005;37:67–72. [DOI] [PMC free article] [PubMed] [Google Scholar]
- [14].Ingolia NT, Brar GA, Rouskin S, et al. The ribosome profiling strategy for monitoring translation in vivo by deep sequencing of ribosome-protected mRNA fragments. Nat Protoc. 2012;7:1534–1550. [DOI] [PMC free article] [PubMed] [Google Scholar]
- [15].Cenik C, Cenik ES, Byeon GW, et al. Integrative analysis of RNA, translation, and protein levels reveals distinct regulatory variation across humans. Genome Res. 2015;25:1610–1621. [DOI] [PMC free article] [PubMed] [Google Scholar]
- [16].van Heesch S, Witte F, Schneider-Lunitz V, et al. The Translational Landscape of the Human Heart. Cell. 2019;178:242–260.e29. [DOI] [PubMed] [Google Scholar]
- [17].Ingolia NT, Ghaemmaghami S, Newman JRS, et al. Genome-wide analysis in vivo of translation with nucleotide resolution using ribosome profiling. Science. 2009;324(5924):218–223. [DOI] [PMC free article] [PubMed] [Google Scholar]
- [18].Weinberg DE, Shah P, Eichhorn SW, et al. Improved ribosome-footprint and mRNA measurements provide insights into dynamics and regulation of yeast translation. Cell Rep. 2016;14:1787–1799. [DOI] [PMC free article] [PubMed] [Google Scholar]
- [19].Fang H, Huang Y-F, Radhakrishnan A, et al. Scikit-ribo enables accurate estimation and robust modeling of translation dynamics at codon resolution. Cell Syst. 2018;6:180–191.e4. [DOI] [PMC free article] [PubMed] [Google Scholar]
- [20].Khong A, Matheny T, Jain S, et al. The stress granule transcriptome reveals principles of mRNA accumulation in stress granules. Mol Cell. 2017;68:808–820.e5. [DOI] [PMC free article] [PubMed] [Google Scholar]
- [21].Eraslan B, Wang D, Gusic M, et al. Quantification and discovery of sequence determinants of protein‐per‐mRNA amount in 29 human tissues. Mol Syst Biol. 2019;15:e8513. [DOI] [PMC free article] [PubMed] [Google Scholar]
- [22].Narula A, Ellis J, Taliaferro JM, et al. Coding regions affect mRNA stability in human cells. Rna. 2019;25:1751–1764. [DOI] [PMC free article] [PubMed] [Google Scholar]
- [23].Mathieson T, Franken H, Kosinski J, et al. Systematic analysis of protein turnover in primary cells. Nat Commun. 2018;9:689. [DOI] [PMC free article] [PubMed] [Google Scholar]
- [24].Szklarczyk D, Gable AL, Lyon D, et al. STRING v11: protein–protein association networks with increased coverage, supporting functional discovery in genome-wide experimental datasets. Nucleic Acids Res. 2018;47:gky1131. [DOI] [PMC free article] [PubMed] [Google Scholar]
- [25].Piñero J, Ramírez-Anguita JM, Saüch-Pitarch J, et al. The DisGeNET knowledge platform for disease genomics: 2019 update. Nucleic Acids Res. 2019;48:D845–55. [DOI] [PMC free article] [PubMed] [Google Scholar]
- [26].Li J, Liu Y, Kim T, et al. Gene expression variability within and between human populations and implications toward disease susceptibility. Plos Comput Biol. 2010;6:e1000910. [DOI] [PMC free article] [PubMed] [Google Scholar]
- [27].Wegler C, Ölander M, Wiśniewski JR, et al. Global variability analysis of mRNA and protein concentrations across and within human tissues. NAR Genomics Bioinf. 2019;2:lqz010 . [DOI] [PMC free article] [PubMed] [Google Scholar]
- [28].Carneiro RL, Requião RD, Rossetto S, Domitrovic T, Palhano FL . Codon stabilization coefficient as a metric to gain insights into mRNA stability and codon bias and their relationships with translation. Nucleic Acids Res 2019;47:2216–28. [DOI] [PMC free article] [PubMed] [Google Scholar]
- [29].Shaw G, Kamen R. A conserved AU sequence from the 3′ untranslated region of GM-CSF mRNA mediates selective mRNA degradation. Cell. 1986;46:659–667. [DOI] [PubMed] [Google Scholar]
- [30].Kapadia S, Lee J, Torre-Amione G, et al. Tumor necrosis factor-alpha gene and protein expression in adult feline myocardium after endotoxin administration. J Clin Invest. 1995;96:1042–1052. [DOI] [PMC free article] [PubMed] [Google Scholar]
- [31].Clayer E, Dalseno D, Kueh A, et al. Severe dysregulation of TNF expression leads to multiple inflammatory diseases and embryonic death. iScience. 2020;23:101726. [DOI] [PMC free article] [PubMed] [Google Scholar]
- [32].Lacey D, Hickey P, Arhatari BD, et al. Spontaneous retrotransposon insertion into TNF 3′UTR causes heart valve disease and chronic polyarthritis. Proc Natl Acad Sci. 2015;112:9698–9703. [DOI] [PMC free article] [PubMed] [Google Scholar]
- [33].Demšar J, Curk T, Erjavec A, et al. Orange: data mining toolbox in Python. J Mach Learn Res. 2013;14:2349–2353. [Google Scholar]
- [34].Feltz CJ, Miller GE. An asymptotic test for the equality of coefficients of variation from k populations. Stat Med. 1996;15:647–658. [DOI] [PubMed] [Google Scholar]
- [35].Krishnamoorthy K, Lee M. Improved tests for the equality of normal coefficients of variation. Comput Stat. 2014;29:215–232. [Google Scholar]
Associated Data
This section collects any data citations, data availability statements, or supplementary materials included in this article.


