Abstract
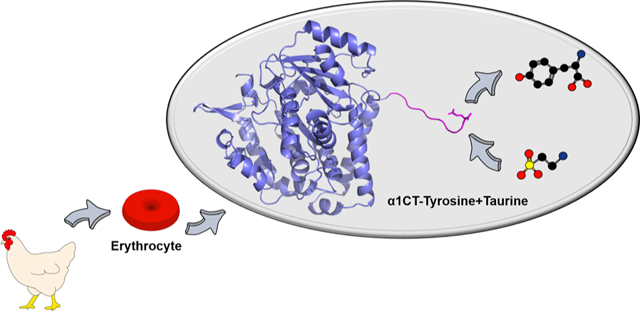
Taurine is the most abundant free amino acid in the human body. It is found in relatively high concentrations (1–10 mM) in many animal tissues but not in plants. It has been studied since the early 1800s but has not been found to be covalently incorporated into proteins in any animal tissue. Taurine has been found in only one macromolecular complex as a post-transcriptional modification to mitochondrial tRNA. Tubulin is the subunit of microtubules found in all eukaryotic species and almost all eukaryotic cells and subject to numerous post-translational modifications (PTMs). An important PTM on α-tubulin is the removal and re-ligation of the final carboxyl residue, tyrosine. We here demonstrate that taurine can be covalently incorporated at the C-terminal end of alpha-tubulin in avian erythrocytes in a reaction that requires the de-tyrosination PTM and prevents the re-tyrosination PTM. Further, this is, to our knowledge, the first instance of taurine incorporation into a large protein.
Keywords: post-translational modification, proteomics, mass spectrometry, sulfur, isotope cluster
Graphical Abstract
INTRODUCTION
Taurine is the most abundant free amino acid in the human body. It is a β-amino acid and found in relatively high concentrations (1–10 mM) in many animal tissues, but not in plants.1,2 Despite being known and studied for nearly 200 years, taurine has not been found to be covalently incorporated into proteins in any animal tissue. It is known to be found in some covalent complexes, such as bile salts and small brain peptides, but in only one macromolecular complex as a clinically significant post-transcriptional modification to mitochondrial tRNA.3
Tubulin is the heterodimeric (αβ) subunit of microtubules found in all eukaryotic species and in almost all eukaryotic cells.4 The sequence is highly conserved except for the carboxyl-terminus (~3%, 10–20 residues), which is highly variable, disordered, acidic, and the site of many reversible post-translational modifications (PTMs).5,6 An important PTM on α-tubulin is the removal and re-ligation of the final carboxyl residue tyrosine, de-tyrosination by a carboxypeptidase and re-tyrosination by tubulin tyrosine ligase.7 Here, we describe a PTM that requires de-tyrosination and prevents re-tyrosination, by the addition of taurine to de-tyrosinated α-tubulin of avian erythrocytes. Further, this is, to our knowledge, the first instance of taurine incorporation into a large protein.
EXPERIMENTAL SECTION
Materials
All reagents were obtained and used as supplied from Sigma-Aldrich (Milwaukee, WI) unless otherwise noted. VASH1/SVBP complex was a kind gift from Dr. J. Nieuwenhuis, Division of Biochemistry, Netherlands Cancer Institute, Plesmanlaan 121, 1066 CX Amsterdam, Netherlands.
Purification
Tubulin was purified by salt-selective polymerization8 from microtubule protein preparations from frozen rat brain.9 Chicken brain tubulin was prepared the same way from frozen chicken brains. Bovine brain tubulin was prepared as described.10 Chicken and turkey erythrocytes were obtained as citrate saline-washed pellets from Pel-Freez Biologicals, (Rogers, AR) stored frozen at −80 °C until used. Tubulin was purified from erythrocytes as described.11 Tubulin tyrosine ligase (TTL) was prepared as described.12
Enzymatic Modification of Tubulins
Tubulin was treated with carboxypeptidase and tubulin tyrosine ligase as described previously.12,13 Briefly, tubulin in PME buffer (0.1 M PIPES, 1 mM MgSO4, 2 mM EGTA, pH 6.9) was treated with carboxypeptidase (CPA: final concentrations: 0.1 g/L CPA, 3 g/L tubulin) at 37 °C for 30 min. To quench the reaction, DTT (final concentration: 20 mM) was added, and the solution was incubated on ice for 20 min. The cleaved tyrosine residues were removed, and the protein was equilibrated in TTL buffer (25 mM MES, 150 mM KCl, 27 μM MgCl2, 2.5 mM ATP, 1 mM DTT, 1.5% glycerol, pH 6.8) by rapid gel filtration chromatography using Sephadex G50 resin in TTL buffer. Tubulin re-tyrosination was performed by incubating the de-tyrosinated tubulin with excess tyrosine and recombinant GST-tubulin tyrosine ligase (final concentrations: 0.2 g/L GST-TTL, 1 mM tyrosine) at 37 °C for 30 min prior to gel filtration and SDS-PAGE or cyanogen bromide (CNBr) cleavage and preparation for mass spectrometry.
Proteolysis
VASH1/SVBP digestion of tubulin was performed as described.14 VASH1/SVBP is a carboxyprotease that removes tyrosine from α-tubulin. It requires that the tyrosine (or phenylalanine) be the C-terminal and the sequence –GEEY and not –QEEY.14,15 The protein was then processed for mass spectrometry as described below.
Production and Purification of CNBr Peptides
The purified tubulins were cleaved by an optimized protocol involving 0.1 M CNBr, which is roughly a 2000–10,000-fold excess of CNBr relative to methionine, in a 20% trifluoroacetic acid (TFA) solution. Cleavage proceeded overnight at room temperature in a light-protected, closed vessel. The next day, reactions were quenched with water, dried in vacuo, re-dissolved in water, and dried again.16
Peptides were dissolved in 0.06 mL of 50 mM ammonium formate, pH 6, 20% acetonitrile (ACN), vortexed, sonicated, and purified by ion exchange chromatography on 0.01 mL microcolumns of Sephadex DEAE Fast Flow anion exchange resin, pre-equilibrated in the same buffer and contained in Pierce Thermo micro spin columns. Samples were loaded by centrifuging at 140 × g for 30 s, and the sample was run through a second time. Columns were washed (140 × g for 30 s) with 0.06 mL of water, and samples were eluted (140 × g for 30 s) with 0.06 mL of 2.5% TFA:20% ACN (the eluate was run through the column a second time as above). Eluted samples were dried in vacuo, re-suspended in 0.1 mL of water, re-dried, and then re-suspended in 0.01 mL 1:1 ACN:0.1% TFA for mass spectrometry analysis.
MALDI Mass Spectrometry
Each sample was spotted in triplicate using 1 μL aliquots on the MALDI target wells and, before drying, mixed with an equal volume of the matrix consisting of 5 g/L CHCA in 1:1 ACN:0.1% TFA, 10 mM ammonium phosphate. Ten 1000-shot spectra were acquired from each sample well and merged using the methodology described previously16 on an Applied Biosystems 4800 Proteomics Analyzer mass spectrometer (Framingham, MA) operated in the linear negative mode. The spectra were calibrated internally using the tyrosinated CNBr-cleaved peptide of the chicken erythrocyte α-isotype and a synthetic unmodified tubulin peptide. MSMS fragmentation of peptides was accomplished in the negative-ion mode by isolating specific m/z values corresponding to peptides observed in the linear spectra by using the timed ion selector of the instrument and collecting reflector-mode fragment ion spectra. External calibration of the MSMS spectra was accomplished using glu-fibrinopeptide peptide y-series fragments in the positive-ion mode. The accurate mass of the unidentified peak was determined using a SimulTOF MALDI-TOF instrument (SimulTOF, Sudbury, MA) operated at an 8000 resolution in the negative-ion reflector mode. This instrument enabled the determination of monoisotopic rather than average values for the m/z.
Electrospray Mass Spectrometry
Peptide samples were injected into an Agilent 6550 iFunnel Q-TOF mass spectrometer operated in the negative-ion mode equipped with a JetStream technology ion source (dual AJS-ESI). For separation, reversed-phase chromatography (C18-Eclipse, 2.1 mm × 50 mm,1.8 μm) was performed with a gradient of 5–45% B (ACN, 0.1% formic acid) in 10 min at a flow rate of 150 μL/min. Eluted peptides were analyzed via the mass spectrometer operated at m/z 300–1700 in the high-sensitivity mode. Tandem MS spectra were collected via collision-induced dissociation at 40 V. Spectra were manually inspected for the ions of interest corresponding to predicted m/z values. Raw ESI data are deposited in MASSiVE (massive.ucsd.edu; with dataset identifier MSV000085344).
RESULTS AND DISCUSSION
Eukaryotes often contain multiple genes for α- and β-tubulin and express these different isotypes in different tissue and developmental patterns.4 In order to study tubulin expression in an accessible differentiated cell model, we chose chicken erythrocyte tubulin, a tubulin previously reported to be fairly free of PTM.17 Purified chicken erythrocyte tubulin (ChET) was chemically cleaved using CNBr, and the most acidic peptides (which are the carboxyl terminal (CT) peptides) were purified by anion exchange chromatography at pH 6. The resulting peptides were examined by negative-ion MALDI-MS; a representative spectrum is shown in Figure 1A. Peptides were assigned according to the predicted m/z values of ChET isotypes of α- and β-tubulin or expected m/z values for known PTMs combined with these isotypes. A list of isotype masses of the C-terminus expected as a result of cleavage by CNBr is shown in Table S1.
Figure 1.
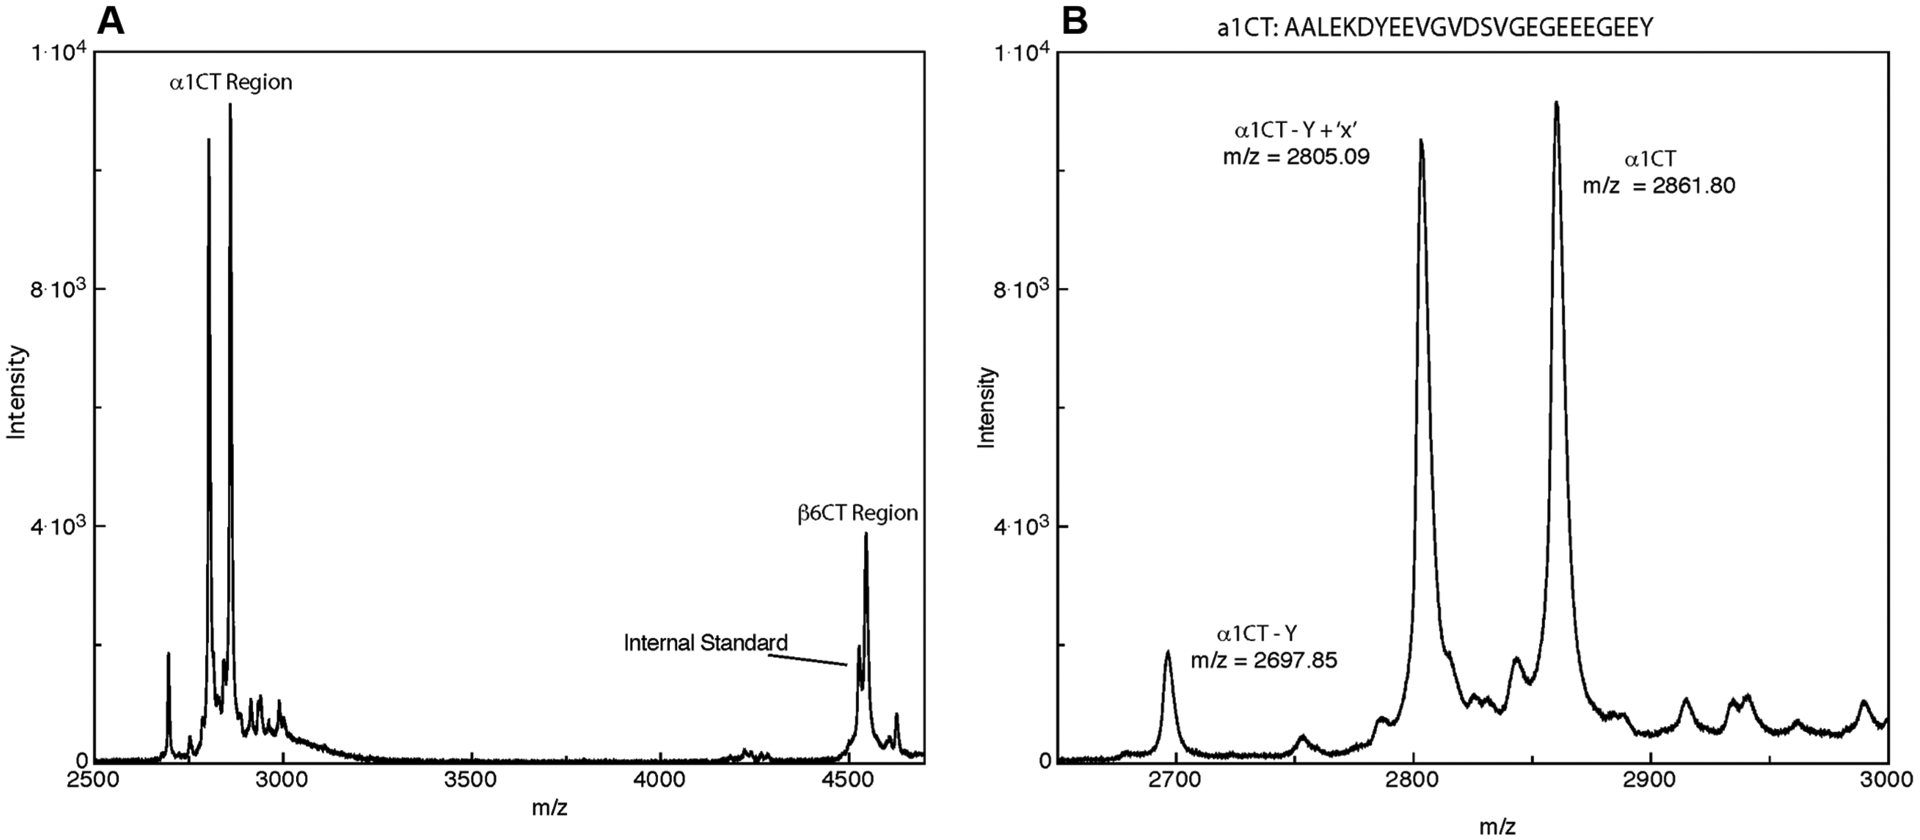
MALDI-TOF MS reveals C-terminal peptides generated following CNBr cleavage predominantly from one isotype of α-tubulin (α−1) and one isotype of β-tubulin (β−6). (A) Full m/z region containing peptides from α- and β-tubulins. Denoted in the figure are signals from both α and β isotypes as well as the internal standard used for mass calibration. (B) Expanded region containing the C-terminal peptides of α−1 tubulin, including the full length peptide (noted as α1CT; m/z 2861), de-tyrosinated CT peptide (α1CT-Y; m/z 2697), and the peptide of intermediate mass, labeled α1CT-Y+‘X’; m/z 2805.
The CT peptides were identified as α1 and β6 tubulins by their accurate mass and are labeled in Figure 1A. The notation used includes “CT” for the C-terminal CNBr peptide and the corresponding tubulin type (α- or β-) and isotype as well as PTMs. Thus, “α1CT” refers to the C-terminal-most peptide produced by CNBr cleavage of α1 tubulin, and “α1CT-Y” refers to the C-terminal-most CNBr peptide lacking the terminal tyrosine. It is important to note that, owing to the location of the cleavage site, the peptides from CNBr (“CT’s”) include more amino acids than the ~15 residues in the CTT-tail peptides. These sequence differences are outlined in Scheme S1.
Inspection of the m/z region corresponding to α isotypes of ChET revealed that, in addition to the full-length peptide (α1CT: m/z 2861.80) and the de-tyrosinated peptide (α1CT-Y: m/z 2697.85), there was an unidentified peak in between these signals (α1CT-Y+’X’: m/z 2805.09). This observation is expanded in detail in Figure 1B. The mass of this analyte does not match that of any CNBr peptide predicted from the sequence or known PTMs. Essentially, identical results were obtained from multiple preparations of ChET, prepared at NIH and Binghamton University. Tubulin prepared from turkey erythrocytes yielded spectra with the same features at the same m/z values. Most notably, all preparations revealed the presence of the high-intensity peak 56 Da less than that of the α1CT ion and 108 Da greater than the α1CT-Y signal.
Three possibilities emerge in the identification of this reproducible, but unassignable peak. First, the peak could represent an unexpected mass loss or gain from known tubulin isotypes (likely α). Second, the peak could represent an analyte unrelated to tubulin, and third, the peak could represent a heretofore unrecognized tubulin isotype. To address any of these possibilities, a high-mass accuracy measurement of the peak at m/z 2805 was necessary.
We performed high-resolution, high-mass accuracy measurements of the peptide mixture. The m/z of the a1CT-Y+X peptide was determined to be 2803.1029 ± 0.0103 Da from four replicate measurements. Note that this is the monoisotopic mass, while the former number, 2805, was the average mass. The difference between the de-tyrosinated peptide, α1CT-Y, and the unidentified peak (a1CT-Y + X) is 106.979 ± 0.0102 Da. Therefore, we considered that the difference of m/z 106.979 represents the mass of the modification being observed. If we were to consider that the signal at 2803.1029 was a result of only a loss from the parent α1CT peptide, the difference in mass is 56.085 ± 0.015 Da, which could not be clearly assigned. Therefore, we considered that the m/z 2803.1029 represented a modified version of the de-tyrosinated peptide.
To further confirm the identity of the unidentified signal, we considered that the difference of 106.979 ± 0.0102 Da would equal the mass of a chemical moiety analogous to a dehydrated peptide residue. Thus, the mass was hydrated in silico, and the NIST chemical database (http://webbook.nist.gov) was searched for all compounds in the mass range of 124.99–125.03 Da. This search yielded 31 compounds consisting mostly of structural isomers and radical species. When these are excluded, taurine is the only plausible compound to fit the search constraints and the results of the mass spectrometry measurements. A similar search for an explanation based on the loss of 56.085 ± 0.015 from α1CT showed two reactive boranes, which eliminate this possibility. The chemical formula of taurinated, de-tyrosinated, α1CT has an expected mass of 2803.1276 Da. This differs from the measured value by 8.8 ppm well within the measurement accuracy of the instrument and analysis mode in which the data were collected. Based on the high-resolution measurements, and the chemical database search, we concluded that the most likely explanation for α1CT-Y+X is that “X” is a taurine residue added to a de-tyrosinated C-terminus of α1-tubulin. This possibility was explored further with fragmentation of the putatively assigned signal. The expected mass of a y1 fragment of taurine in the negative-ion mode is 124 Da. The fragmentation spectrum in Figure 2 shows a y-ion peptide fragmentation series beginning at 124.2 Da and demonstrates clear sequence coverage of the α1CT-Y sequence for 13 additional residues. The sequence information obtained via this method confirms the assignment based on accurate mass measurement. Further, this fragmentation data strongly suggests that taurine is bonded to the C-terminus of α1CT-Y.
Figure 2.
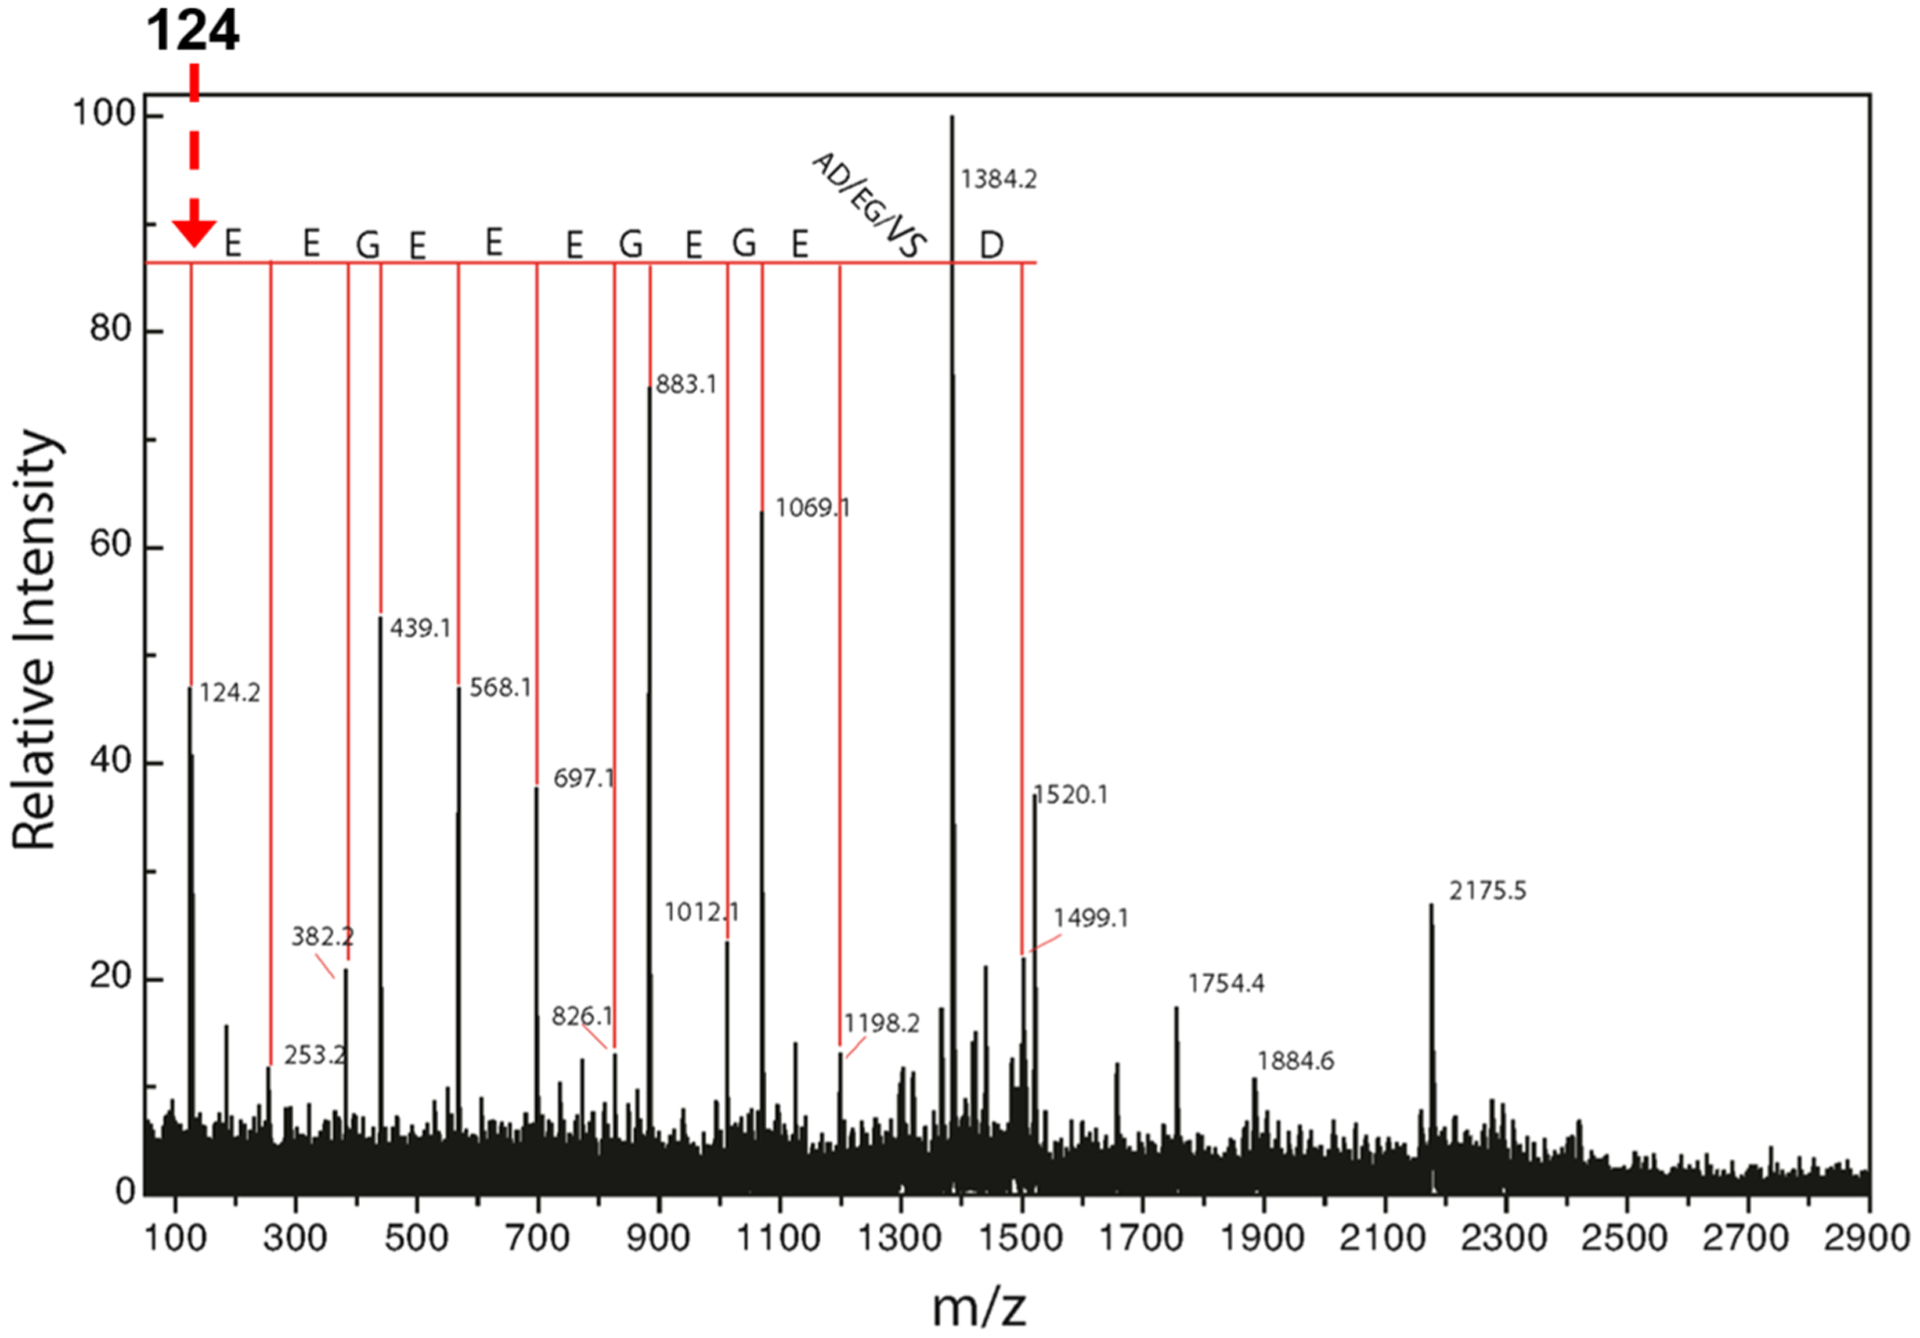
Fragmentation spectra show that the unidentified peptide is α1CT-Y with a C- terminal adduct, “X”. Peaks that are observed in the fragmentation spectra are noted with the corresponding amino acid and denote y-type ions. Interestingly, the y1 ion expected for a C-terminal taurine residue is 124 Da, and this signal is observed in the fragmentation spectrum highly suggestive of taurine inclusion.
Taurine is a sulfur-containing amino acid, and sulfur has a unique effect on the isotope cluster of peptides in mass spectrometry data because 4.2% of sulfur isotopes are 34S, which contain two neutrons more than those of 32S. Therefore, high-resolution mass spectra of relative abundances within the isotope cluster can be used to evaluate the inclusion of sulfur. Addition of taurine to a peptide necessarily shifts the cluster in favor of the third peak in the cluster more than the addition of the same mass from some other combination of C, H, N, or O due to the presence and effect of 34S. This effect is most noticeable for small peptides given that the isotope cluster of small peptides that do not contain sulfur is dominated by the distribution of 13C and 2H, which enhance the second isotopic peak much more than the third one.
To produce smaller peptides and achieve a better signal to noise ratio, the anionic fraction of CNBr fragments of ChET was digested with AspN, yielding a N-terminally truncated peptide from α1CT-Y+X (m/z 749.2520). Figure 3 displays the high-resolution mass spectra of AspN-cleaved α1CT-Y+X where X was considered taurine. Figure 3A displays the isotopic peak distribution of the measured data (black) compared to a theoretical isotopic distribution of the same peptide sequence with taurine included (red). Notably, the measured and theoretical abundances are nearly identical. Conversely, Figure 3B compares the measured data for the de-tyrosinated peptide (black) with the taurine prediction in which a significant difference is observed. Finally, residual analysis of the peak intensities between the measured de-tyrosinated and measured taurinated versus the theoretical indicates that great differences show if sulfur is not included (Figure 3C).
Figure 3.
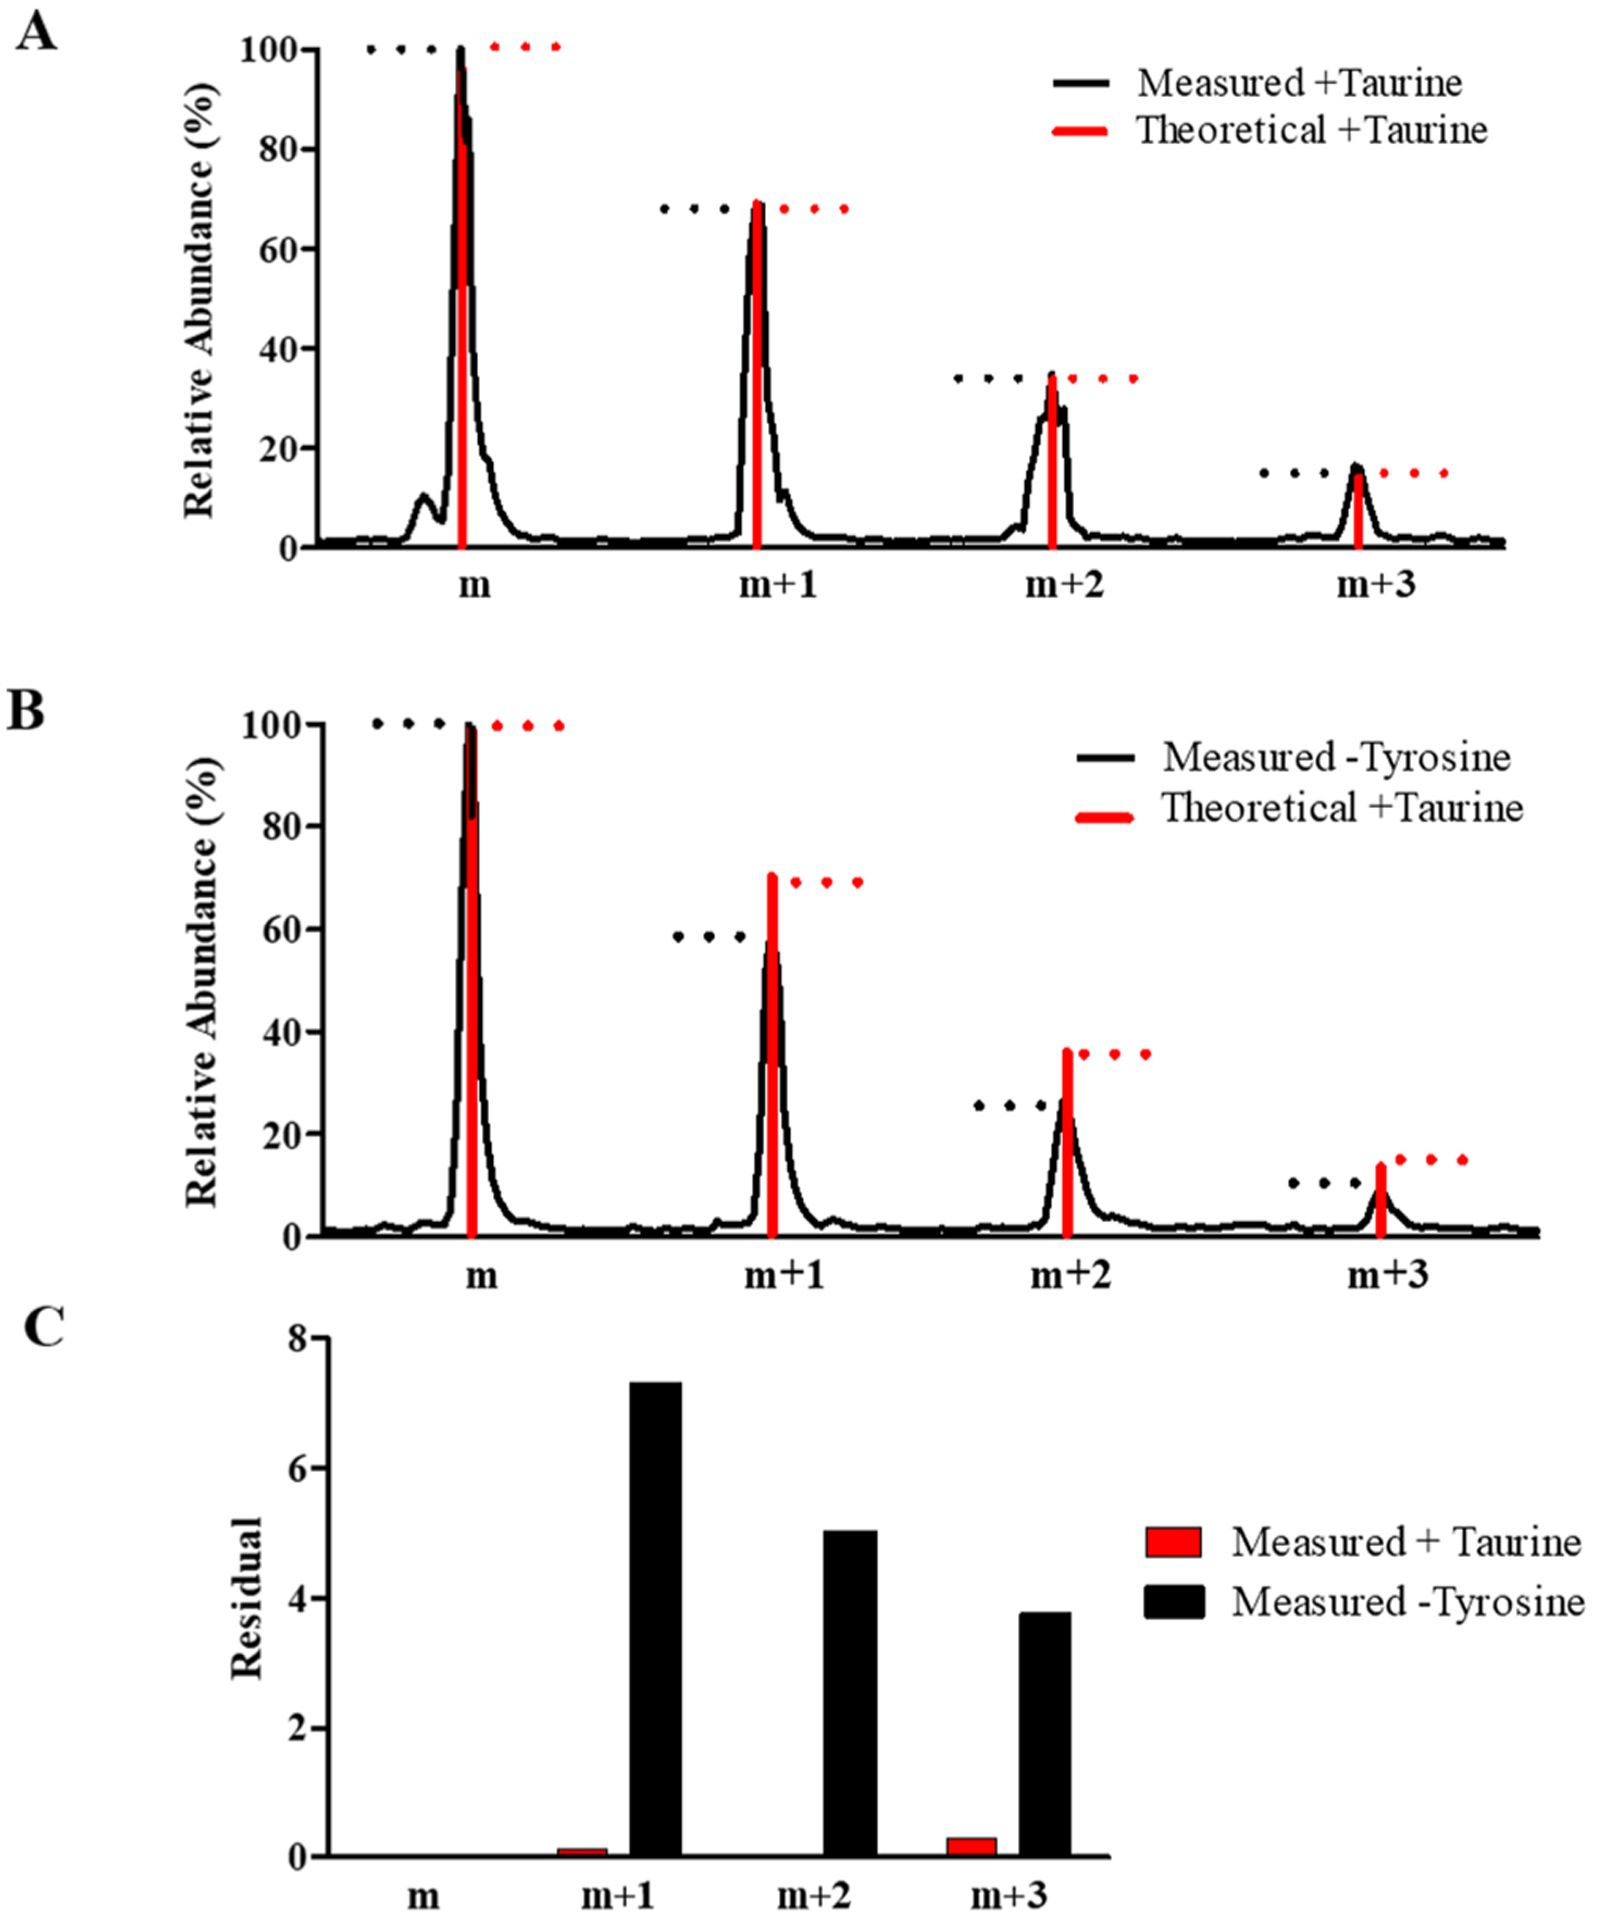
Isotopic cluster and residual plot analysis for AspN-digested de-tyrosinated and taurinated CT peptides of α1 tubulin. (A) Comparison of the measured and theoretical isotopic clusters for the measured taurinated peptide (DSVEGEGEEEGEE + taurine, m/z 749.2520). (B) Comparison of the isotopic clusters from the measured de-tyrosinated peptide (DSVEGEGEEEGEE-Y, m/z 695.7468) and theoretical isotopic clusters from the taurinated peptide. Dashed lines in (A) and (B) represent peak maxima for the measured (black) and theoretical (red) isotopes. (C) Residual plot for the isotopic clusters in (A) and (B).
Comparison of the isotopic clusters in Figure 3A reveals a stronger correlation between the measured and theoretical isotopic clusters for the taurinated peptide, whereas comparison of the isotopic clusters in Figure 3B reveals differences between the measured de-tyrosinated peptide isotopic clusters and theoretical isotopic clusters for the taurinated peptide. These observed differences are the result of peptide taurination where a higher contribution from the m + 1, m + 2, and m + 3 isotopes occurs due to the incorporation of sulfur (found in taurine). Additionally, a comparative analysis was carried out in which the isotopic clusters for synthetic peptides terminating with either tyrosine or taurine were measured and plotted, comparing both with the theoretical distribution of the synthetic taurinated peptide (Figure S1). Here, we also observe a higher contribution from the m + 1, m + 2, and m + 3 isotopes in the synthetic taurinated peptide compared to the synthetic tyrosinated peptide.
The finding of C-terminal α1CT-Y taurination in avian erythrocytes prompts the question of whether taurination exists in other tissues. Since brain has high intracellular concentrations of taurine1,2 and brain tubulin has a complex complement of PTMs,18 we isolated tubulin from chicken, rat, and bovine brains and compared the CNBr peptides obtained from each. The α1-CT regions of the three resulting spectra are shown in Figure S2, demonstrating that taurine PTM was not found in any brain sample. For each spectrum, an arrow is provided at m/z 2805, the expected (average mass) position of α1CT-Y + taurine.
To investigate the potential role of enzymes that modify the tubulin CTT, tubulin was de-tyrosinated with carboxypeptidase A (CPA) and re-tyrosinated with tubulin tyrosine ligase (TTL)5,6 under varying conditions (see Experimental Section)13 using bovine brain tubulin (BBT) as a source of non-taurinated tubulin. BBT was prepared in the same fashion as that of the avian erythrocyte tubulin, and the mass spectral range corresponding to α1CT of BBT is shown in Figure 4A. The full length (α1CT) and de-tyrosinated (α1CT-Y) peptides are found as well as a peak identified as the de-tyrosinated with an addition of glutamic acid (α1CT-Y + E), presumably as γ-glutamylation, e.g., at E406 (see Scheme S1, Supporting Information). The arrows show the positions where the taurinated peptides would occur if they were present.
Figure 4.
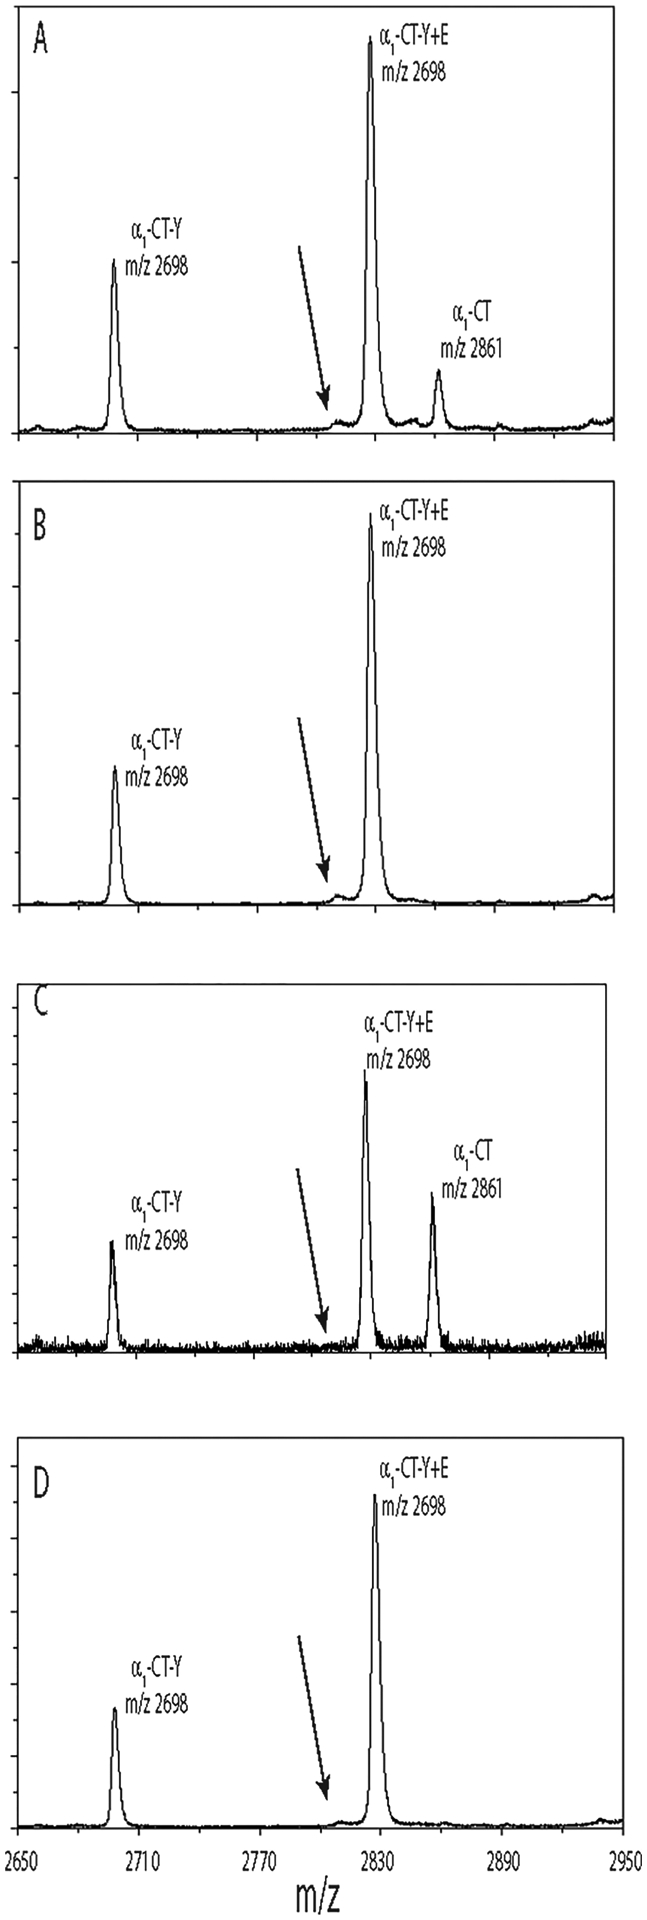
Bovine brain tubulin does not contain α-tubulin with C-terminal taurine, and taurine modification is not produced with enzymatic treatments. All panels show the m/z region corresponding to bovine α1CT collected by MALDI-TOF MS. The arrow in all panels shows the position of the expected mass of taurinated CT, i.e., α1CT-Y + taurine, if it occurred. (A) Bovine brain tubulin (BBT) sample, untreated. (B) BBT treatment with CPA to remove tyrosine as indicated by the loss of signal at m/z 2861. (C) Treatment of BBT with CPA followed by TTL in the presence of tyrosine. Restoration of the full-length peptide at m/z 2861 is observed. (D) Incubation of BBT is the same as (C), but with taurine rather than Tyr and does not produce taurinated CTT, i.e., α1CT-Y + taurine (expected average m/z 2805).
Treatment with CPA completely removed the terminal tyrosine, as expected (Figure 4B). Subsequent treatment with TTL in the presence of tyrosine resulted in restoration of the C-terminal tyrosine (Figure 4C, peak at m/z 2861). Performing the same incubation in the presence of taurine rather than tyrosine did not produce a taurinated peptide (Figure 4D). Thus, under conditions where TTL can add tyrosine to α1CT-Y, it cannot add taurine to α1CT-Y, indicating that the enzyme responsible for this addition is different from TTL.
We also performed a Tyr-deTyr cycle with ChET as a source of taurinated tubulin. This shows that taurine is not removed by CPA (Figure 5A, compared to Figure 1B). TTL restored tyrosine to α1CT-Y but does not alter α1CT-Y + taurine (Figure 5B). This demonstrates that taurine does not participate in the Tyr-deTyr cycle. Thus, taurination is likely an enzymatic reaction involving a hitherto unknown enzyme.
Figure 5.
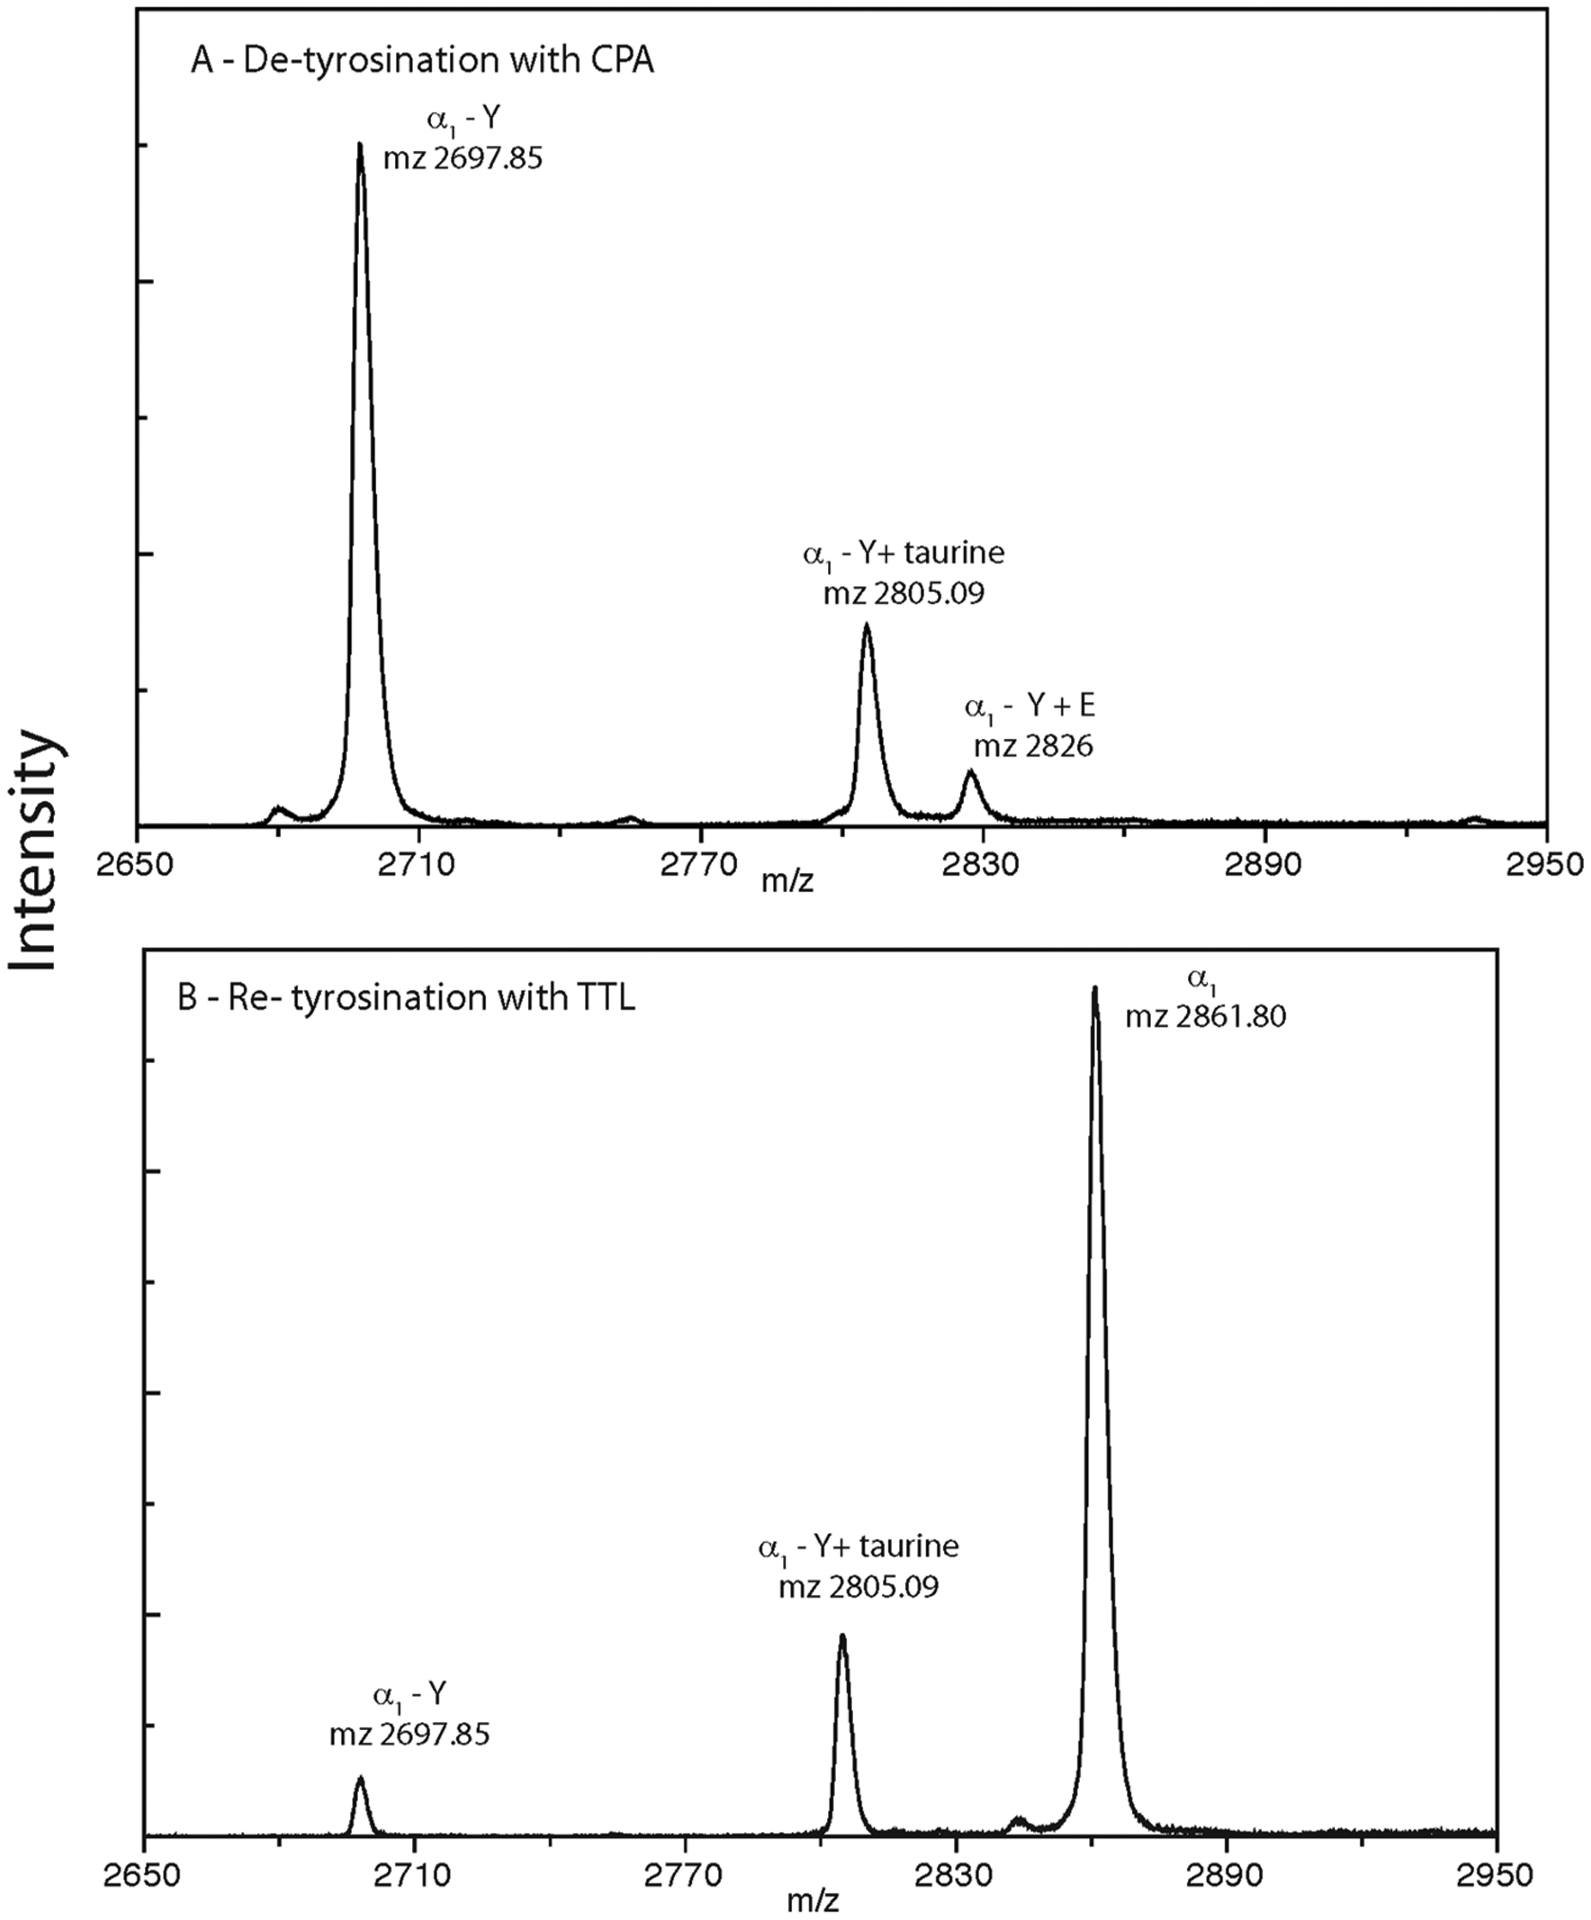
Enzymatic treatment of chicken erythrocyte tubulin (ChET) analyzed via MALDI-TOF MS. The taurine adduct is not removed by carboxypeptidase, and TTL does not add Y to this terminal adduct. Panel (A) presents CNBr peptides of ChET digested with carboxypeptidase A. Note the loss of α1CT peptide signal at m/z 2861.Observation of the loss of tyrosine and addition of glutamic acid is presented (m/z 2826). The taurination is still present at m/z 2805. (B) CNBr peptides of the preparation from (A) that were incubated with tubulin tyrosine ligase in the presence of tyrosine. Note the increase in the m/z 2861 (α1CT) signal and lowered intensity of m/z 269 (α1CT-Y) confirming the conversation of ligating the tyrosine amino acid. No change in the taurinated signal is observed upon treatment.
Finally, we investigated the enzymatic activity of VASH1/SVBP, an endogenous tubulin carboxypeptidase,14,15 on the α1CT peptides of ChET (taurinated tubulin) (Figure S3). Prior to treatment, the de-tyrosinated and taurinated species are observed as well as the unmodified peptide (Figure S3A). Following treatment with VASH1/SVBP, the relative abundance of α1CT greatly diminishes due to de-tyrosination with an accompanying increase in α1CT-Y; however, the taurinated species (m/z 2805) is left unchanged. Thus, neither CPA nor the endogenous tubulin carboxypeptidase VASH1/SVBP is able to remove taurine from a modified α-tubulin C-terminus, indicating that an as-yet-unknown enzyme is involved.
CONCLUSIONS
Incorporation of taurine is an unexpected PTM for tubulin or any other protein, and this is, to our knowledge, the first report of taurine incorporation into a large protein. Taurine is almost always found as a free amino acid or in small peptides, such as γ-glutamyltaurine.19 The only macromolecular occurrence of taurine previously reported is in a functional, clinically significant post-transcriptional modification of mitochondrial tRNA.3,20,21 The exact role of taurine as a free amino acid is controversial although it is clear that it is among the most abundant free amino acids. As a free amino acid, it accounts for about 0.1% of the total adult human weight.1,22 Taurine deficiency is associated with several diseases whose nature and severity can vary depending on age among other things.20,21 Taurine distribution is organ-specific with the highest concentrations found in the retina, leukocytes, platelets, heart, skeletal muscle, and brain.1,2 Since human erythrocytes have a significantly lower concentration of taurine than that of these tissues, we posit that the formation of a peptide bond between taurine and the C-terminus of α1-CT-Y in ChET, where taurine concentration is high, is the action of a tissue-specific enzyme that is yet to be described in this role.
The functional relationship of taurination with respect to what is known about erythrocyte tubulins and the C-terminal tyrosine is currently not clear. Finding the answers to these questions as well as addressing the biological significance of this PTM will be the subjects of future studies.
Supplementary Material
ACKNOWLEDGMENTS
This work was supported by the intramural program of the Eunice Kennedy Shriver National Institute of Child Health and Human Development, National Institute of Health, DHHS (M.T.O., A.L.Y., and D.L.S.). The authors would like to acknowledge support from the University of Illinois at Chicago, Department of Chemistry, College of Liberal Arts and Sciences (M.R.P. and S.M.C.), and the UIC DFI Fellowship to M.R.P. Support from the State University of New York Binghamton and NIH-1R15GM093941 is acknowledged (K.M. and S.L.B.). We would like to thank Kenneth Parker of SimulTOF for making the high-resolution measurements of the modified peptide. The authors would like to thank Fidel Serna-Perez for assistance with graphical figures.
Footnotes
The authors declare no competing financial interest.
Supporting Information
The Supporting Information is available free of charge at https://pubs.acs.org/doi/10.1021/acs.jproteome.0c00147.
Figure S1: synthetic peptides with taurine and tyrosine, Figure S2: taurination in difference species, Figure S3: enzymatic treatment of tubulin by VASH, Scheme S1: C-terminal peptides of tubulin, and Table S1: isotypes of chicken tubulin (PDF)
Complete contact information is available at: https://pubs.acs.org/10.1021/acs.jproteome.0c00147
A pre-print version of this work was posted on ChemRxiv at https://doi.org/10.26434/chemrxiv.11470167.v1.
Contributor Information
Kamalika Mukherjee, Department of Chemistry, Binghamton University, State University of New York, Binghamton, New York 13902, United States.
Melissa R. Pergande, Department of Chemistry, University of Illinois at Chicago, Chicago, Illinois 60607, United States
Susan L. Bane, Department of Chemistry, Binghamton University, State University of New York, Binghamton, New York 13902, United States.
Stephanie M. Cologna, Department of Chemistry, University of Illinois at Chicago, Chicago, Illinois 60607, United States.
Dan L. Sackett, Division of Basic and Translational Biophysics, Eunice Kennedy Shriver National Institute of Child Health and Human Development, National Institutes of Health, Bethesda, Maryland 20892, United States
REFERENCES
- (1).Huxtable RJ Physiological actions of taurine. Physiol. Rev 1992, 72, 101–163. [DOI] [PubMed] [Google Scholar]
- (2).Lambert IH; Kristensen DM; Holm JB; Mortensen OH Physiological role of taurine–from organism to organelle. Acta Physiol. (Oxf) 2015, 213, 191–212. [DOI] [PubMed] [Google Scholar]
- (3).Suzuki T; Suzuki T; Wada T; Saigo K; Watanabe K Taurine as a constituent of mitochondrial tRNAs: new insights into the functions of taurine and human mitochondrial diseases. EMBO J. 2002, 21, 6581–6589. [DOI] [PMC free article] [PubMed] [Google Scholar]
- (4).Findeisen P; Muhlhausen S; Dempewolf S; Hertzog J; Zietlow A; Carlomagno T; Kollmar M Six subgroups and extensive recent duplications characterize the evolution of the eukaryotic tubulin protein family. Genome Biol. Evol 2014, 6, 2274–2288. [DOI] [PMC free article] [PubMed] [Google Scholar]
- (5).Gadadhar S; Bodakuntla S; Natarajan K; Janke C The tubulin code at a glance. J. Cell Sci 2017, 130, 1347–1353. [DOI] [PubMed] [Google Scholar]
- (6).Yu I; Garnham CP; Roll-Mecak A Writing and Reading the Tubulin Code. J. Biol. Chem 2015, 290, 17163–17172. [DOI] [PMC free article] [PubMed] [Google Scholar]
- (7).Nieuwenhuis J; Brummelkamp TR The Tubulin Detyrosination Cycle: Function and Enzymes. Trends Cell Biol. 2019, 29, 80–92. [DOI] [PubMed] [Google Scholar]
- (8).Wolff J; Sackett DL; Knipling L Cation selective promotion of tubulin polymerization by alkali metal chlorides. Protein Sci. 1996, 5, 2020–2028. [DOI] [PMC free article] [PubMed] [Google Scholar]
- (9).Sackett DL; Knipling L; Wolff J Isolation of microtubule protein from mammalian brain frozen for extended periods of time. Protein Expression Purif. 1991, 2, 390–393. [DOI] [PubMed] [Google Scholar]
- (10).Williams RC Jr.; Lee JC [36] Preparation of tubulin from brain. Methods Enzymol. 1982, 85, 376–385. [DOI] [PubMed] [Google Scholar]
- (11).Sackett DL; Werbovetz KA; Morrissette NS Isolating tubulin from nonneural sources. Methods Cell Biol. 2010, 95, 17–32. [DOI] [PubMed] [Google Scholar]
- (12).Mukherjee K; Bane SL Site-specific fluorescent labeling of tubulin. Methods Cell Biol. 2013, 115, 1–12. [DOI] [PubMed] [Google Scholar]
- (13).Banerjee A; Panosian TD; Mukherjee K; Ravindra R; Gal S; Sackett DL; Bane S Site-specific orthogonal labeling of the carboxy terminus of alpha-tubulin. ACS Chem. Biol 2010, 5, 777–785. [DOI] [PMC free article] [PubMed] [Google Scholar]
- (14).Nieuwenhuis J; Adamopoulos A; Bleijerveld OB; Mazouzi A; Stickel E; Celie P; Altelaar M; Knipscheer P; Perrakis A; Blomen VA; Brummelkamp TR Vasohibins encode tubulin detyrosinating activity. Science 2017, 358, 1453–1456. [DOI] [PubMed] [Google Scholar]
- (15).Aillaud C; Bosc C; Peris L; Bosson A; Heemeryck P; Van Dijk J; Le Friec J; Boulan B; Vossier F; Sanman LE; Syed S; Amara N; Coute Y; Lafanechere L; Denarier E; Delphin C; Pelletier L; Humbert S; Bogyo M; Andrieux A; Rogowski K; Moutin M-J Vasohibins/SVBP are tubulin carboxypeptidases (TCPs) that regulate neuron differentiation. Science 2017, 358, 1448–1453. [DOI] [PubMed] [Google Scholar]
- (16).Olson MT; Blank PS; Sackett DL; Yergey AL Evaluating reproducibility and similarity of mass and intensity data in complex spectra–applications to tubulin. J. Am. Soc. Mass Spectrom 2008, 19, 367–374. [DOI] [PubMed] [Google Scholar]
- (17).Rudiger M; Weber K Characterization of the post-translational modifications in tubulin from the marginal band of avian erythrocytes. Eur. J. Biochem 1993, 218, 107–116. [DOI] [PubMed] [Google Scholar]
- (18).Song Y; Brady ST Post-translational modifications of tubulin: pathways to functional diversity of microtubules. Trends Cell Biol. 2015, 25, 125–136. [DOI] [PMC free article] [PubMed] [Google Scholar]
- (19).Bittner S; Win T; Gupta R gamma-L-glutamyltaurine. Amino Acids 2005, 28, 343–356. [DOI] [PubMed] [Google Scholar]
- (20).Schaffer SW; Jong CJ; Warner D; Ito T; Azuma J Taurine deficiency and MELAS are closely related syndromes. Adv. Exp. Med. Biol 2013, 776, 153–165. [DOI] [PubMed] [Google Scholar]
- (21).Suzuki T; Nagao A; Suzuki T Human mitochondrial diseases caused by lack of taurine modification in mitochondrial tRNAs. Wiley Interdiscip. Rev. RNA 2011, 2, 376–386. [DOI] [PubMed] [Google Scholar]
- (22).Jacobsen JG; Smith LH Biochemistry and physiology of taurine and taurine derivatives. Physiol. Rev 1968, 48, 424–511. [DOI] [PubMed] [Google Scholar]
Associated Data
This section collects any data citations, data availability statements, or supplementary materials included in this article.


