

Abstract
Parkinson’s disease (PD) is the second most common age-related neurodegenerative disorder and is characterized by the formation of cellular inclusions inside neurons that are rich in an abnormal form of the protein α-synuclein (α-syn). Microglia are the CNS resident immune cells that react to misfolded proteins through pattern recognition receptor ligation and activation of signaling transduction pathways. Here, we studied activation of primary microglia isolated from wild-type mouse by distinct α-syn forms and their clearance. Internalization of α-syn monomers and oligomers efficiently activated the NOD-like receptor pyrin domain containing 3 (NLRP3) inflammasome via TLR2 and TLR5 ligation, thereby acting on different signaling checkpoints. We found that primary microglia effectively engulf α-syn but hesitate in its degradation. NLRP3 inhibition by the selective inhibitor CRID3 sodium salt and NLRP3 deficiency improved the overall clearance of α-syn oligomers. Together, these data show that distinct α-syn forms exert different microglial NLRP3 inflammasome activation properties, thereby compromising its degradation, which can be prevented by NLRP3 inhibition.
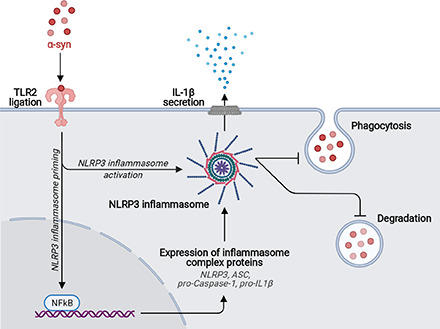
Visual Abstract
Key Points
α-syn monomers and oligomers efficiently activated the NLRP3 inflammasome via TLR2.
Activation of the NLRP3 inflammasome compromised the α-syn clearance capacity.
NLRP3 inhibition improved the overall clearance of α-syn oligomers.
Introduction
Parkinson’s disease (PD) is the most common movement disorder and, after Alzheimer’s disease, the second most common neurodegenerative disease. PD is mainly characterized by the presence of intraneuronal cytoplasmic inclusions called Lewy bodies that are rich in aggregated α-synuclein (α-syn) (1, 2). α-syn is a 14-kDa protein with no defined structure (3). The monomeric form of the protein progressively forms oligomeric structures and insoluble fibrillary complexes that, together with crowded organellar components (1), accumulate in Lewy bodies under pathological conditions. The fibrillar forms of α-syn interfere with neuronal functioning by affecting the normal distribution of important membrane proteins (4), disrupting neurotransmitter release (5), impairing mitochondrial function (6–8), blocking intracellular vesicle transport (9, 10), affecting endolysosomal compartment integrity (11), and compromising protein degradation mechanisms (12), thereby inducing toxicity and eventually leading to neuronal injury and degeneration. Even though α-syn aggregates are first found in neurons, evidence suggests that neuronal cell death and spreading of pathology will expose these proteins to the environment, thereby activating surrounding immune cells.
Being the brain’s primary innate immune cells, microglia contribute to cerebral homeostasis by sensing changes in their immediate environment, clearing cellular debris, and providing neurotrophins (13). On ligation of pattern recognition receptors (PRRs), microglia become activated and execute an inflammatory response that, if it persists, causes chronic neuroinflammation and neuronal damage (13, 14). Evidence for such a chronic neuroinflammatory response can be found in brains of patients with PD and other synucleinopathies, where microglia activation occurs in all brain regions where aggregated α-syn accumulates (15–17). In keeping with this, α-syn has been shown to induce excessive microglial activation and inflammatory activity.
IL-1β is the most extensively studied proinflammatory cytokine, which has been linked to various disorders of the CNS (18, 19). In PD, α-syn has been shown to induce the microglia-derived IL-1β secretion after NOD-like receptor pyrin domain containing 3 (NLRP3) inflammasome activation (20–22). Likewise, NLRP3 inflammasome inhibition prevented α-syn pathology and dopaminergic neurodegeneration in PD-related mouse models (23). In vitro, IL-1β is synthesized by microglia as a precursor (pro–IL-1β) in response to pathogen-associated molecular patterns, such as LPS that is acting via TLR ligation (24, 25). This step, which is referred to as “priming,” is required to induce the expression of the inflammasome components: the PRR NLRP3, apoptosis-associated speck-like protein (ASC), and the procaspase-1. A second stimulus, which is referred to as “activation,” results in the formation and activation of cytosolic multiprotein complexes called inflammasomes (19, 26, 27) that process the precursor pro–IL-1β to its mature IL-1β form that is rapidly secreted from the cell into its microenvironment (28).
To unravel microglial activation by different α-syn forms, we used structurally and functionally well-characterized human α-syn monomers, oligomers, and two different fibrillar polymorphs that have been shown to trigger distinct synucleinopathies (29, 30) and tested their potential to activate microglia through PRR ligation. We further analyzed how microglia survival is affected on exposure to monomeric, oligomeric, and fibrillar α-syn and how microglia deal with the clearance of α-syn assemblies. Here, we present evidence that α-syn monomers and oligomers are able to prime and activate the NLRP3 inflammasome through TLR2 and TLR5 ligation, leading to NLRP3 inflammasome-dependent IL-1β secretion, thereby inhibiting α-syn clearance. In addition, the microglial survival was not affected by the different α-syn forms, thus largely excluding pyroptotic cell death within the tested time period.
Materials and Methods
Animals
Wild-type (WT; Charles River Laboratories, Wilmington, MA) and NLRP3-deficient (Millennium Pharmaceuticals, Cambridge, MA) animals were all of the C57BL/g genetic background. Mice were housed under standard conditions at 22°C and a 12-h light-dark cycle with free access to food and water. Animal care and handling was performed according to the guidelines of animal welfare as laid down by the German Research Council (Deutsche Forschungsgemeinschaft) and approved by the local ethical committees.
Cell culture
Primary microglia cells were isolated by the method of Giulian and Baker (31). In brief, brains from neonatal mice were stripped of the meninges and dissociated using mechanical shearing and trypsin (Life Technologies, Carlsbad, CA). Cells of two brains were plated on poly-l-lysine (Sigma-Aldrich by Merck, Darmstadt, Germany)-coated T75 culture flasks (Greiner bio-one, Kremsmünster, Austria) and cultivated in DMEM (Life Technologies by Thermo Fisher Scientific, Waltham, MA) supplemented with 10% heat-inactivated FCS (Life Technologies) and 1% penicillin/streptomycin (P/S; Life Technologies). On the next day, cells were washed three times with DPBS (Life Technologies) to remove cellular debris and were cultured with DMEM supplemented with 10% FCS, 1% P/S, and 1% L929 conditioned medium as a source of growth factors. After 7–10 d, loosely attached mature microglia were shaken off the astrocytic layer with a repetition of the harvesting procedure all 2–3 days for up to three times. For experiments, primary microglia were seeded into well plates and allowed to adhere overnight in DMEM supplemented with 10% FCS and 1% P/S. On the next day, medium was changed to serum-free DMEM complemented with 1% N-2 supplement (Life Technologies), and microglia were allowed to rest for another 24 h before experiments were performed.
α-syn assemblies generation
Human WT α-syn was expressed in E. coli BL21 DE3 CodonPlus cells (Stratagene, San Diego, CA) and purified as described previously (32). To assemble human WT α-syn into the fibrillar polymorph “fibrils,” the protein (100 µM) was incubated in 50 mM Tris–HCl (pH 7.5), 150 mM KCl at 37°C under continuous shaking in an Eppendorf Thermomixer set at 600 rpm for 5 d (29). The assembly reaction was followed by withdrawing aliquots (20 µl) from the assembly reaction at different time intervals, mixing them with Thioflavin T (10 µM final), and recording the fluorescence increase on a Cary Eclipse Fluorescence Spectrophotometer (Varian Medical Systems, Palo Alto, CA) using an excitation wavelength = 440 nm, an emission wavelength = 480 nm, and excitation and emission slits set at 5 and 10 nm, respectively. To label α-syn fibrils with extrinsic fluorophores, we centrifuged the fibrils twice at 15,000 × g for 10 min and resuspended them twice in PBS at 1446 g/L, and two molar equivalents of ATTO-488 NHS-ester (AD 488-35; Atto-Tec, Siegen, Germany) fluorophore in DMSO were added. The mix was incubated for 1 h at room temperature. The labeling reactions were arrested by addition of 1 mM Tris (pH 7.5). The unreacted fluorophore was removed by a final cycle of two centrifugations at 15,000 × g for 10 min and resuspensions of the pellets in PBS. The fibrillar nature of α-syn was assessed by transmission electron microscopy after adsorption of the fibrils onto carbon-coated 200 mesh grids and negative staining with 1% uranyl acetate using a Jeol 1400 transmission electron microscope. The images were recorded with a Gatan Orius CCD camera (Gatan, Pleasanton, CA). The resulting α-syn fibrils were fragmented by sonication for 20 min in 2-ml Eppendorf tubes in a Vial Tweeter powered by an ultrasonic processor UIS250v (250 W, 2.4 kHz; Hielscher Ultrasonic, Teltow, Germany) to generate fibrillar particles with an average size of 42–52 nm as assessed by transmission electron microscopy analysis.
Measurement of cytokine secretion
Cytokine release was determined using the mouse IL-1 β/IL-1F2 DuoSet ELISA (DY401; R&D Systems, Minneapolis, MN), mouse TNF-α DuoSet ELISA (DY410; R&D Systems), mouse IL-6 DuoSet ELISA (DY406; R&D Systems), mouse IL-10 DuoSet ELISA (DY417; R&D Systems), and mouse CXCL2/MIP-2 DuoSet ELISA (DY452; R&D Systems). Primary microglia (7.5 × 10⁴ cells/well) were seeded into 96-well plates and allowed to adhere overnight. Microglia were used unprimed or primed for 3 h before experiments with 10 ng/ml (≙ 100 endotoxin units/ml) LPS (InvivoGen, San Diego, CA) before cells were washed with DPBS and treated with α-syn monomers and different assemblies and BSA as a protein control. For TLR-neutralizing experiments, microglia were treated 5 µg/ml mouse anti-TLR2 (Invitrogen), mouse anti-TLR4 (Invitrogen), or rat anti-TLR5 (InvivoGen) in conjunction with 2 µM α-syn assemblies. Supernatants were assayed after 24-h treatment according to the manufacturer’s protocol. OD was determined at 450 nm photometrically with a microplate reader (Infinite M200; Tecan, Männedorf, Switzerland). Concentrations of the secretion of the different cytokines were calculated by interpolation using a respective cytokine-specific standard curve.
The expression profile of different cytokines and chemokines in response to different α-syn species was analyzed using a Proteome Profiler Array (ARY020; R&D Systems). Primary microglia (2 × 10⁶ cells/well) were seeded into six-well plates and allowed to adhere overnight. Microglia were used unprimed or primed for 3 h before experiments with 10 ng/ml (Α100 endotoxin units/ml) LPS before cells were washed with DPBS and treated with α-syn monomers and different assemblies for 24 h. The Proteome Profiler Array was performed according to the manufacturer’s protocol using 1 ml of cell supernatant per condition. After overnight incubation with the sample/Ab mixture, membranes were washed three times with the wash buffer and incubated with the fluorescent near-infrared secondary Ab IRDye 680LT streptavidin (1:10,000 in 3% BSA; LI-COR Biosciences, Lincoln, NE) for 30 min at room temperature. Capture spots were then visualized with the Odyssey CLx Imaging System (LI-COR Biosciences) and quantified using Image Studio (LI-COR Biosciences).
Precipitation of supernatant samples
For detection of the cleaved caspase-1 subunit p20 in the supernatant of treated primary microglia cultures, we performed a protein precipitation to concentrate the sample as described by Jakobs et al. (33). In brief, primary microglia (1.5 × 10⁶ in 2 ml medium) were cultured for 24 h in six-well plates under control conditions or in medium containing chemical compounds. After harvesting the supernatants, 500 µl methanol and 125 µl chloroform were added to 500 µl supernatant and vortexed vigorously. After 5-min centrifugation at 13,000 × g, the upper aqueous phase was removed and replaced by 500 µl methanol. Samples were vortexed again and centrifuged for 5 min at 13,000 × g. Subsequently, supernatants were removed and pellets were dried for 5 min in a vacuum dryer. The pellet was then resuspended in 20 µl 2× loading buffer and denatured for 3 min at 95°C. Samples were then subjected to Western blot analysis.
Western blot
For lysate collection, primary microglia (2 × 10⁶) were cultured in six-well plates under control conditions or in medium containing different α-syn assemblies for 24 h before supernatants (for protein precipitation) were collected, and cells were washed and scraped off the well with ice-cold PBS containing 1× protease and phosphatase inhibitor cocktails (Thermo Fisher Scientific). After pelleting the cells for 5 min at 10,000 × g, PBS was completely removed and cells were lysed in ice-cold radioimmunoprecipitation assay buffer (50 mM Tris–HCl, 1% Triton X-100, 0.5% Na deoxycholate, 0.1% NaDodSO4 [SDS], 150 mM NaCl [pH 8]) containing 1× protease inhibitor cocktails for 15 min on ice. Lysates were centrifuged for 5 min at 4°C and 10,000 × g, and supernatants were frozen and kept in −20°C until use.
Cell lysates and samples from protein precipitation were separated by a NuPAGE 4–12% Bis-Tris Gel (Invitrogen by Thermo Fisher Scientific) and transferred to a nitrocellulose blotting membrane (0.2 µm; GE Healthcare Life Sciences, Freiburg, Germany). Membranes were washed with TBS supplemented with Tween 20 (TBST, 10 mM Tris–HCl, 150 mM NaCl, 0.05% Tween 20 [pH 8]). Membrane surface was blocked with 3% BSA in TBST for 30 min at room temperature. Membranes were then incubated with the rat anti–caspase-1 Ab (1:1,000; clone 4B4, Genentech, CA), rabbit anti-ASC (AL177, 1:1,000; AdipoGen, San Diego, CA), mouse anti-NLRP3 (1:500; AdipoGen), rabbit anti-MyD88 (1:500; Cell Signaling Technologies), rabbit anti-NF-κB p65 (1:500; Cell Signaling Technologies), or mouse anti–α-tubulin (1:2,000; Thermo Fisher Scientific) overnight at 4°C. After three washing steps at 5 min with TBST, the fluorescent near-infrared secondary Abs IRDye 800CW Goat anti-Rat IgG (H + L) (1:10,000 in 3% BSA; LI-COR Biosciences, Lincoln, NE) and IRDye 680LT Donkey anti-Mouse IgG (H + L) (1:10,000 in 3% BSA; LI-COR Biosciences) were applied for 30 min at room temperature. Proteins were then visualized with the Odyssey CLx Imaging System (LI-COR Biosciences) and quantified using Image Studio (LI-COR Biosciences).
Immunocytochemistry
Cultures were fixed in 4% paraformaldehyde (Sigma-Aldrich) dissolved in PBS (Biochrom, Berlin, Germany) for 15 min and permeabilized by washing them three times for 5 min with PBS containing 0.1% Triton X-100. Blocking solution containing PBS containing 0.1% Triton X-100 and 5% normal goat serum (Vector Laboratories, Burlingame, CA) was applied for 30 min. The primary Abs rabbit anti-ASC (1:250; D2W8U; Cell Signaling Technologies, Danvers, MA) and rat anti-CD11b (1:250; Serotec by Bio-Rad) were applied for 1 h followed by three washing steps. The secondary Abs goat anti-rabbit Alexa Fluor 594 (1:250; Invitrogen) and goat anti-rat Alexa Fluor 594 (1:250; Invitrogen) were applied for 30 min. The LysoTracker Red DND-99 (Thermo Fisher Scientific) was applied according to the manufacturer’s protocol. DAPI (Sigma-Aldrich) was used for nuclear counterstaining at 0.1 mg/ml for 20 min in PBS. Images were taken using a 60× oil objective.
Phagocytosis assay
To assess microglial phagocytosis, we seeded primary microglia (3.5 × 10⁵ cells/well) to 24-well plates and allowed them to adhere. Microglia were treated with 1 µM Atto488-labeled α-syn assemblies and incubated for 5–15 min. Phagocytosis was stopped by one washing step with PBS to remove free α-syn, and cells were harvested using 0.5% trypsin (Life Technologies). Blocking solution containing PBS and FCS (1:1 ratio) was applied for 10 min on ice. Cells were then labeled with the allophycocyanin anti-mouse/human CD11b Ab (1:100; #101212; BioLegend, San Diego, CA) for 30 min in FACS solution (PBS supplemented with 2% FCS) on ice. After labeling, cells were collected, resuspended in 300 µl ice-cold FACS solution, and measured by flow cytometry using the FACSCanto II and the FACSDiva software (Becton Dickinson, Heidelberg, Germany). Phagocytosis was then analyzed and quantified using FlowJo (v3.05470; Ashland, OR).
Microscopy and data analysis
All experiments were examined with a Nikon Eclipse Ti fluorescence microscope (Nikon, Tokyo, Japan). Acquired images were processed using NIS-elements 4 (Nikon) and Fiji ImageJ (Wayne Rusband, National Institutes of Health). Data were evaluated using Graph Pad Prism and presented as mean ± SEM of at least three independent experiments with two to three replicates. An outlier test was performed, and data were analyzed for Gaussian distribution. When data passed the normality test, statistical comparisons of controls versus treatments were performed with one-way or two-way ANOVA followed by a Tukey test. Otherwise, data were analyzed with the Kruskal–Wallis test and a Dunn post hoc test for nonparametric data. Levels of significance are indicated as *p < 0.05, **p < 0.01, ***p < 0.001, and ****p < 0.0001.
Results
We and others recently demonstrated that monomeric α-syn populates oligomeric species (34–36) and assembles into structurally distinct fibrillar polymorphs that, when injected into rodents, trigger the hallmarks of two distinct synucleinopathies, PD and multiple system atrophy (29, 30). These assemblies expose different polypeptide chains at their surfaces and as a consequence exhibit differential tropism to neurons (37). How different α-syn assemblies that form in the brain of patients target and activate glial cells is still unclear. To investigate whether structurally different α-syn polymorphs induce the NLRP3 inflammasome in microglia, we exposed primary mouse microglia to well-characterized recombinant human α-syn assemblies (29, 30). To investigate the potential impact on microglial activation of different forms of α-syn (Fig. 1A–K), we performed all experiments on microglia with and without pre-exposure to the inflammogen LPS (10 ng/ml [≙100 endotoxin units/ml], 3 h) (Supplemental Fig. 1A). All α-syn species were initially validated as endotoxin-free (Supplemental Fig. 1B), and dose–response curve analyses were performed (Supplemental Fig. 1C). The following stimulation experiments were performed using 2 µM α-syn, which has been the lowest concentration inducing NLRP3 inflammasome activation in unprimed conditions (Supplemental Fig. 1C) and has been confirmed as being noncytotoxic using the XTT viability assay in conjunction with an LDH assay (Supplemental Fig. 1D, 1E). BSA was tested in parallel to α-syn as a protein control.
FIGURE 1.

Different forms of α-syn prime and activate the NLRP3 inflammasome under basal conditions. (A) Schematic drawing of the α-syn species used throughout this study. (B–H) Characterization of the α-syn species used throughout this study. (B) The monomeric nature of α-syn was assessed by analytical ultracentrifugation. (C) The assembly of monomeric α-syn (100 µM) into the fibrillar polymorphs, fibrils (red) and ribbons (green), was monitored in triplicate using Thioflavin T binding because this assay shows the lag phase is short and the fluorescence at steady state is high for the polymorph fibrils as compared with that of the polymorph ribbons. (D–H) Electron micrographs of oligomeric and fibrillar α-syn species after negative staining with uranyl acetate (1%). (D) On fibrillar assembly pathway oligomeric α-syn purified through a Superose 6 column. (E and F) The fibrillar polymorph fibrils before and after fragmentation into particles with an average size of 40 nm, respectively. (G and H) The fibrillar polymorph ribbons before and after fragmentation into particles with an average size of 40 nm, respectively. (I–K) Proteolytic patterns on exposure to Proteinase K of the α-syn oligomers (I), and the fibrillar polymorphs fibrils (J) and ribbons (K) after SDS-PAGE and Coomassie blue staining. The arrowheads on the right point to bands that distinguish the polymorph fibrils from the polymorph ribbons. (L and M) IL-1β levels in conditioned medium of primary microglia treated for 6 (L) or 24 h (M) with 2 µM α-syn monomers, oligomers, fibrils, and ribbons. BSA was used as protein control [(A) n = 3; (B) n = 7–10 independent experiments with triplicate treatments for all conditions]. (N) Immunoblot of microglia cell lysates and supernatants exposed to 2 µM α-syn for 24 h, stained for caspase-1, NLRP3, ASC, and α-tubulin (for lysates: n = 7–9; for supernatants: n = 5 independent experiments). Quantification of caspase-1 p45 (O), secreted cleaves caspase-1 p20 (P), NLRP3 (Q), and ASC (R) of cell lysates and supernatants of microglia exposed for 24 h to 2 µM α-syn. All graphs are presented as mean ± SEM and were analyzed by one-way ANOVA followed by Tukey multiple comparison post hoc test (O–R) or Kruskal–Wallis test for nonparametric data (L and M). Levels of significance are as follows: ****p < 0.0001, **p < 0.01, *p < 0.05. Scale bars: 20 µm. A.U., arbitrary units; Ctrl, control. See also Supplemental Figs. 1 and 3.
α-syn activates the NLRP3 inflammasome via TLR2 and TLR5 ligation and induces the release of IL-1β
IL-1β release is mediated by activation of the NLRP3 inflammasome on assembly of NLRP3, ASC, and procaspase-1. We assessed conditioned medium of primary microglia exposed to monomeric, oligomeric, or fibrillar polymorphs, further referred to as “fibrils” and “ribbons” for IL-1β concentrations at 6 and 24 h. Even though there was no detectable IL-1β release at 6 h (Fig. 1L), exposure to α-syn monomers and oligomers was sufficient to induce pro–IL-1β (Supplemental Fig. 2A) and mature IL-1β (Fig. 1M) in unprimed microglia at 24 h. NLRP3 inflammasome activation was confirmed by immunoblot detection showing increased levels of cleaved caspase-1 compared with their controls (Fig. 1N–P). Interestingly, α-syn monomers and oligomers upregulated the expression of NLRP3 (Fig. 1Q), while the expression of the adapter protein ASC showed only a slight increase on treatment with ribbons (Fig. 1R). Using immunoblot analysis, we found the expression of the universal adapter protein MyD88 upregulated on treatment with monomeric and oligomeric α-syn (Fig. 2A), which further activates the transcription factor NF-κB. Even though there was no detectable difference in the NF-κB expression levels (Fig. 2B), immunostainings revealed the translocation of NF-κB p65 into the nucleus in microglia exposed to α-syn monomers (Fig. 2B, arrows).
FIGURE 2.
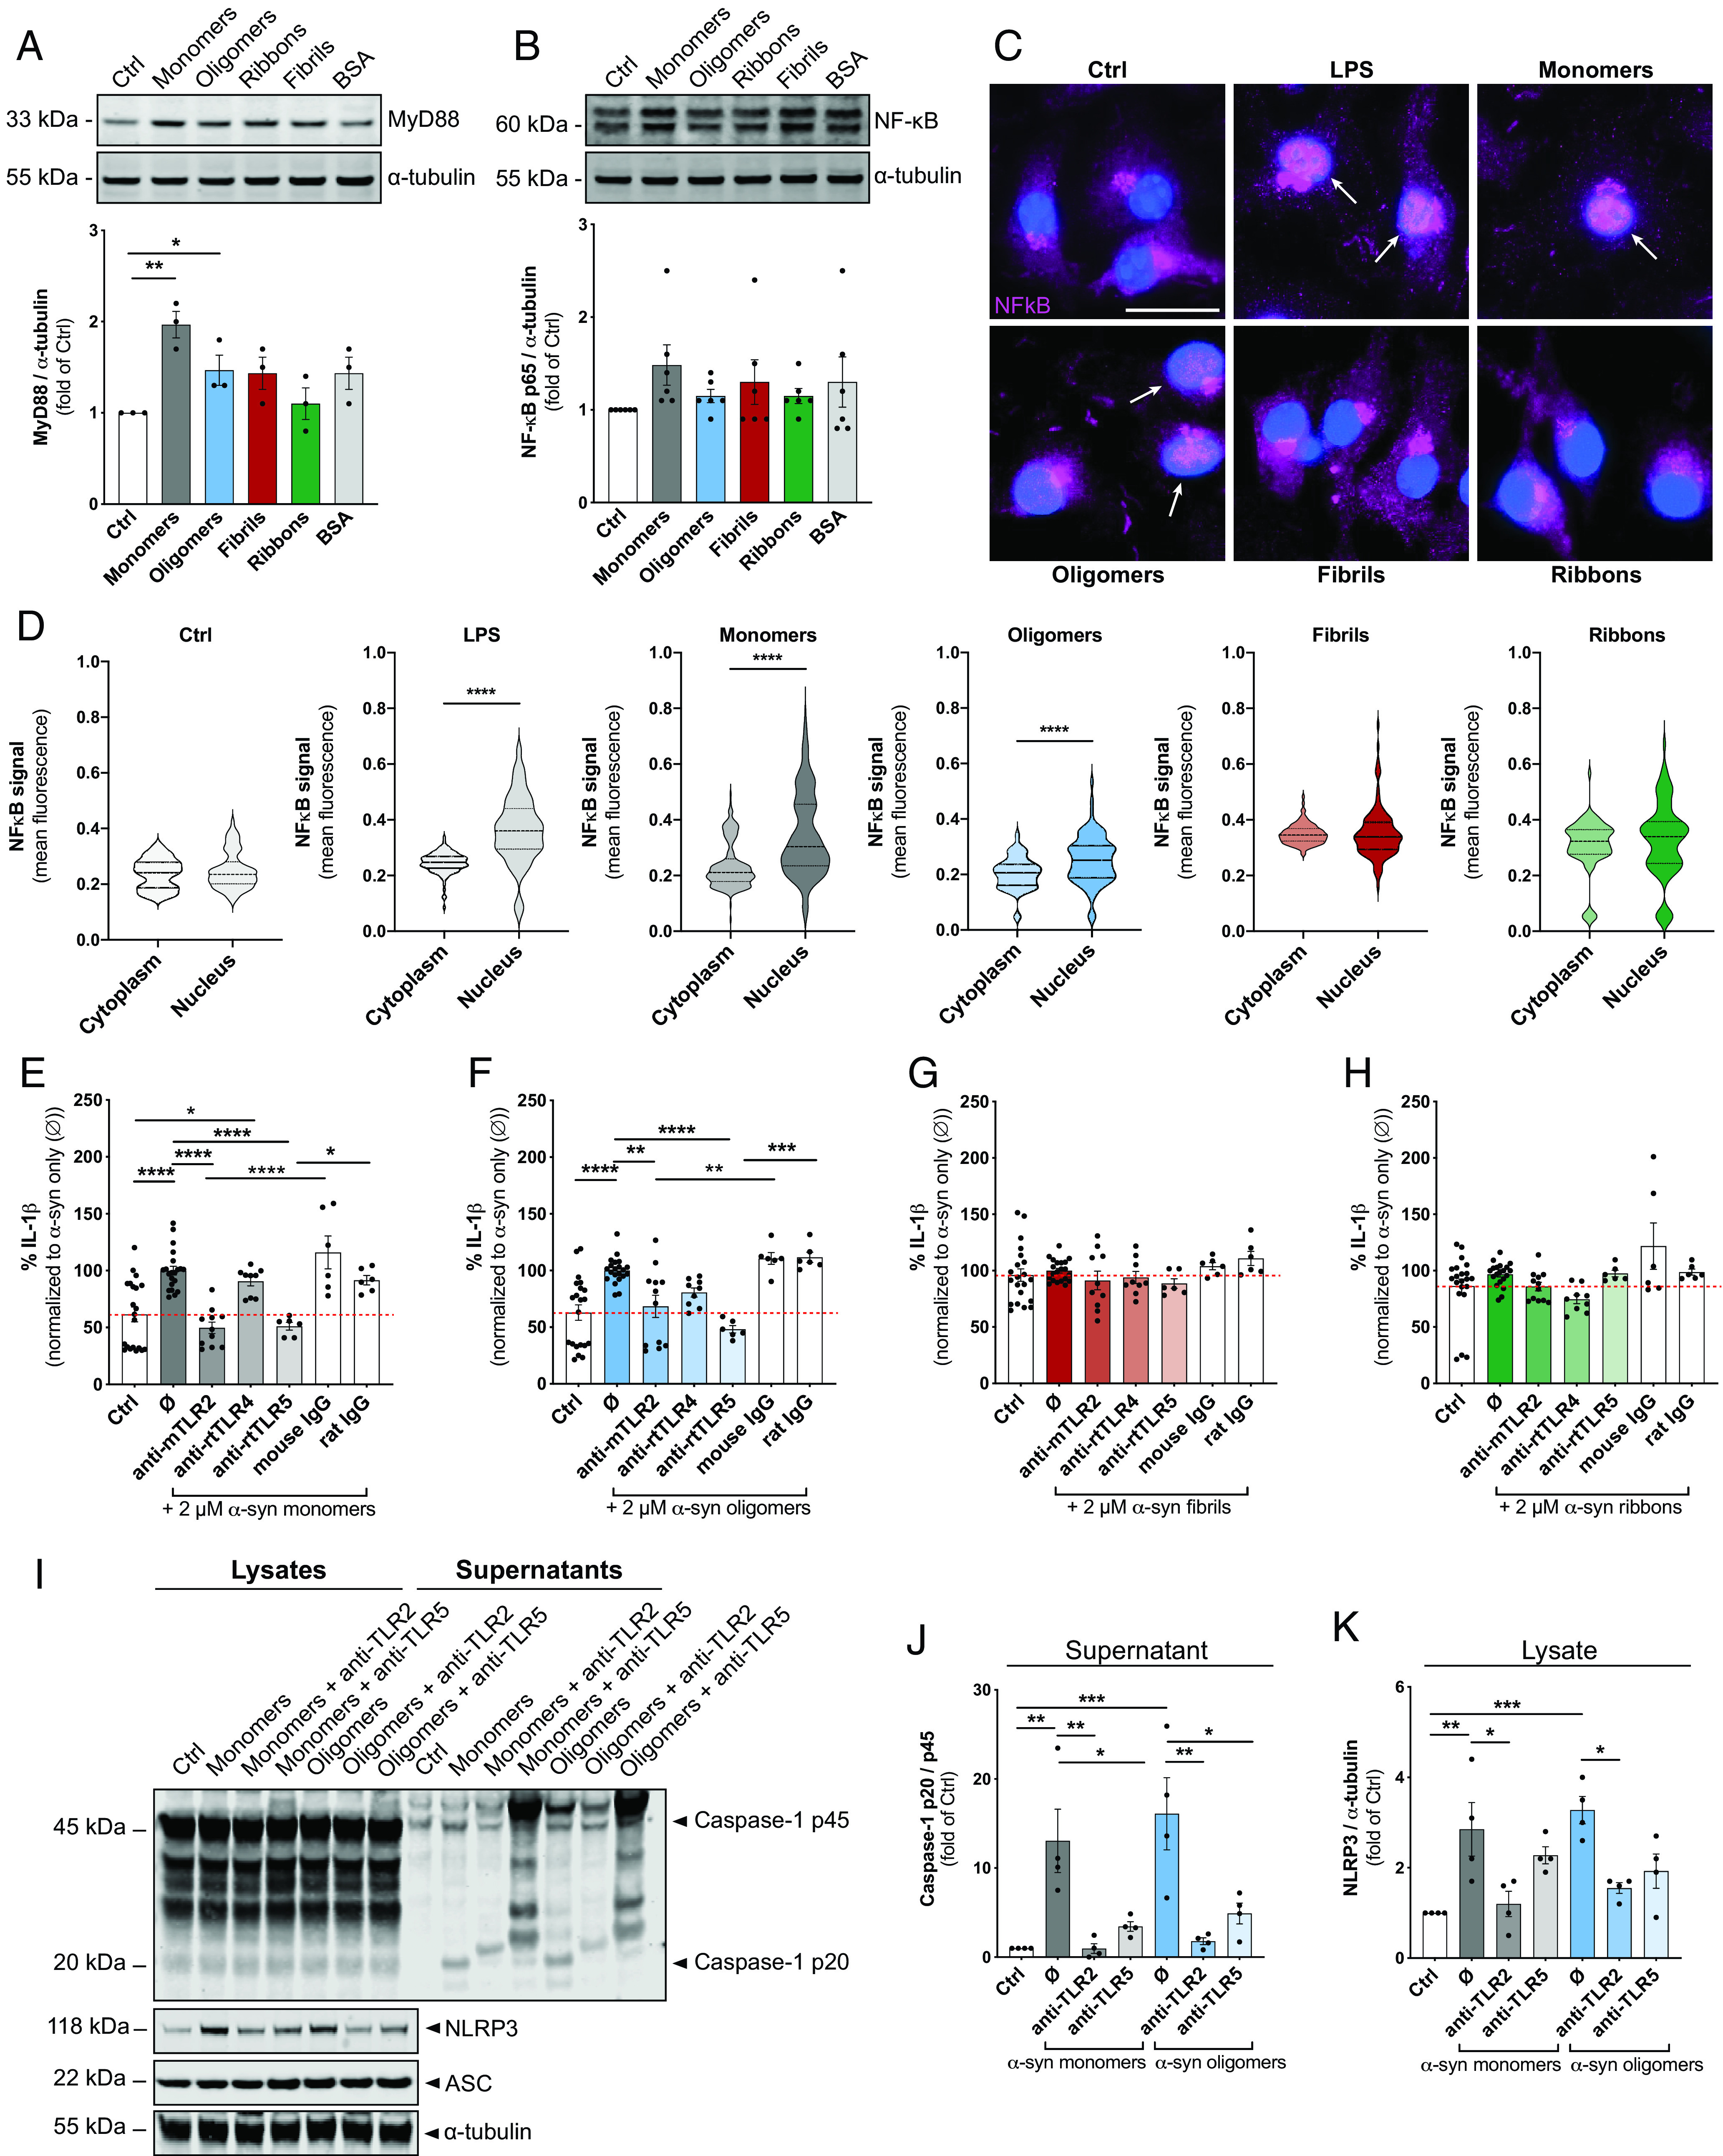
TLR2 and TLR5 neutralization suppresses α-syn–mediated IL-1β release after NLRP3 inflammasome activation in primary microglia. (A) Immunoblot analysis and quantification of the expression of MyD88 after exposure to 2 µM α-syn for 24 h (n = 3 independent experiments). (B) Immunoblot analysis and quantification of the expression of NF-κB in microglia cell lysates exposed to 2 µM α-syn for 24 h. (C) Representative staining with NF-κB (magenta) of microglia exposed to α-syn shows the translocation of NF-κB from the cytoplasm when treated with LPS or α-syn monomers for 24 h. Arrows point toward the translocation of NF-κB into the nucleus (DAPI, blue). (D) Quantification of the translocation of NF-κB from the cytosol to the nucleus in microglia exposed for 24 h to 2 µM α-syn. IL-1β levels in conditioned medium of unprimed primary microglia treated for 24 h with TLR2-, TLR4-, and TLR5-neutralizing Abs or the respective isotype controls in parallel to stimulation with α-syn monomers (E), oligomers (F), fibrils (G), and ribbons (H). The baseline release of IL-1β is indicated by the red dashed line for all graphs (n = 3–4 per group with duplicate or triplicate treatments for all conditions). (I) Immunoblot for caspase-1 p45, cleaved caspase-1 p20, NLRP3, ASC, and α-tubulin. Quantification of secreted cleaved caspase-1 p20 (J) and NLRP3 (K) in microglia treated with the different α-syn forms alone (Ø) or in combination with TLR2-, TLR4-, and TLR5-neutralizing Abs or the respective IgG controls (n = 4 independent experiments). All graphs are presented as mean ± SEM and were analyzed by one-way ANOVA followed by Tukey multiple-comparison post hoc test. Levels of significance are as follows: ****p < 0.0001, ***p < 0.001, **p < 0.01, *p < 0.05. Ctrl, control. See also Supplemental Fig. 2.
To elucidate by which PRR ligation α-syn monomers and oligomers activate the NLRP3 inflammasome, we tested three TLR-neutralizing Abs, including anti-mouse TLR2, anti-mouse TLR4, and anti-rat TLR5 (Fig. 2). Unprimed microglia were exposed to different forms of α-syn in the presence or absence of the respective TLR-neutralizing Abs (Fig. 2E–H). Isotype-specific Abs were used as negative control. For better clarity, we calculated the percent of neutralization to the α-syn-treated control levels (Ø). We found that anti-TLR2 and anti-TLR5 attenuated the IL-1β release by ∼50% to α-syn–treated control levels and isotype-specific controls in microglia exposed to α-syn monomers (Fig. 2E) and oligomers (Fig. 2F). α-syn fibrils (Fig. 2G) and ribbons (Fig. 2H) did not increase IL-1β levels. We confirmed the inhibitory effects of TLR neutralization on NLRP3 inflammasome activation by immunoblot analysis. Both TLR2 and TLR5 neutralization inhibited the α-syn monomer- and oligomer-induced cleavage of caspase-1 (Fig. 2I, 2J), while only TLR2 neutralization blocked the induction of NLRP3 (Fig. 2I, 2K). Caspase-1 p45 and ASC expression remained unchanged (Supplemental Fig. 2B, 2C). Importantly, the ability of α-syn to prime and activate the NLRP3 inflammasome was completely abolished in primary microglia derived from TLR2 knockout animals (Supplemental Fig. 2D, 2E), as confirmed by immunoblot analysis and ELISA readings. Importantly, caspase-1 cleavage inhibition by the NLRP3 inflammasome inhibitor CRID3 largely suppressed NLRP3 inflammasome activation and IL-1β secretion by α-syn–treated unprimed microglia (Supplemental Fig. 3).
Because NLRP3 inflammasome-mediated IL-1β production usually requires a priming step, we investigated whether a classical priming condition would influence the degree and pattern of α-syn–induced NLRP3 activity. Therefore, we prestimulated primary microglia for 3 h with 10 ng/ml LPS before treating the cells with α-syn. LPS priming did not change the IL-1β release within 6 h of treatment (Fig. 3A) but largely increased the secretion of IL-1β at 24 h when microglia were exposed to α-syn monomers, oligomers, or fibrils (Fig. 3B). We performed immunoblot analysis to check for the activation of the NLRP3 inflammasome (Fig. 3C). Even though caspase-1 p45, NLRP3, and ASC expression levels remained unchanged after exposure to α-syn monomers and assemblies for 24 h (Fig. 3C–G), we found significantly increased secretion levels of the active caspase-1 subunit p20 in response to monomers and oligomers (Fig. 3E). Most importantly, NLRP3 knockout and caspase-1 cleavage inhibition by CRID3 largely suppressed NLRP3 inflammasome activation and IL-1β secretion by α-syn–treated LPS-primed microglia (Supplemental Fig. 4). In addition to caspase-1 cleavage, inflammasome activation is characterized by formation of ASC specks (38) that can be visualized by intracellular and extracellular ASC-immunopositive specks (Fig. 3H). LPS-primed microglia displayed an increase of ASC specks at 24 h after exposure to α-syn monomers (Fig. 3I) with a partial colocalization of α-syn monomers and ASC specks (Fig. 3J). Again, we used TLR neutralization Abs to check for PRR ligation of α-syn monomers and distinct assemblies under primed conditions. For better clarity, we calculated the percent of neutralization to the α-syn–treated control levels (Ø). Using anti-TLR neutralization Abs on LPS-primed α-syn–treated microglia, we confirmed that the IL-1β release of microglia treated with α-syn monomers (Fig. 3K), oligomers (Fig. 3L), and fibrils (Fig. 3M) was attenuated on neutralization of TLR2, whereas ribbons neither increased IL-1β nor did TLR neutralization show any effect (Fig. 3N). TLR4 and TLR5 neutralization did not change the α-syn–induced IL-1β release of LPS-primed microglia (data not shown).
FIGURE 3.

Different forms of α-syn activate the NLRP3 inflammasome in LPS-primed microglia. IL-1β levels in conditioned medium of LPS-primed primary microglia treated for 6 (A) or 24 h (B) with 2 µM α-syn monomers, oligomers, fibrils, and ribbons. BSA was used as protein control [(A) n = 3; (B) n = 7–10 independent experiments with triplicate treatments for all conditions]. (C) Immunoblot of primed microglia cell lysates and supernatants exposed to 2 µM α-syn for 24 h, stained for caspase-1, NLRP3, ASC, and α-tubulin (for lysates: n = 7–9; for supernatants: n = 5 independent experiments). Quantification of caspase-1 p45 (D), secreted cleaves caspase-1 p20 (E), NLRP3 (F), and ASC (G) of cell lysates and supernatants of LPS-primed microglia exposed for 24 h to 2 µM α-syn. (H) Representative staining with ASC (red) of LPS-primed microglia exposed to α-syn–Atto488 (green) shows the formation of ASC specks after 24 h. (I) Quantification of the number of ASC speck-containing cells (n = 3 independent experiments). (J) Colocalization analysis of ASC specks and α-syn after 24-h exposure (n = 3 independent experiments). IL-1β levels in conditioned medium of LPS-primed primary microglia treated for 24 h with TLR2-neutralizing Ab or the respective isotype control in parallel to stimulation with α-syn monomers (K), oligomers (L), fibrils (M), or ribbons (N). The baseline release of IL-1β is indicated by the red dashed line for all graphs (n = 3–6 per group with duplicate or triplicate treatments for all conditions). All graphs are presented as mean ± SEM and were analyzed by one-way ANOVA followed by Tukey multiple comparison post hoc test (D–I and K–N) or Kruskal–Wallis test for nonparametric data (A, B, and J). Levels of significance are as follows: ****p < 0.0001, ***p < 0.001, **p < 0.01, *p < 0.05. Scale bars: 20 µm. Ctrl, control. See also Supplemental Fig. 4.
In addition to IL-1β, we checked for the release of other proinflammatory and anti-inflammatory cytokines (Supplemental Fig. 5). Initially, we exposed supernatants of primary microglia with or without prior LPS priming to a proteome profile array to get an overview about the inflammatory profile of the cells (Supplemental Fig. 5A). We found that α-syn monomer, oligomers, and fibrils augmented the release of various proinflammatory cytokines (Supplemental Fig. 5A, left panel), which was further amplified by prior LPS priming (Supplemental Fig. 5A, right panel). Ribbons showed no effect on the cytokine secretion. To confirm these findings and to quantify the cytokine release in more detail, we selected certain cytokines and performed ELISA readings on supernatants of primed and unprimed microglia exposed to α-syn monomers and distinct assemblies.
Interestingly, we found that α-syn monomers, oligomer, and fibrils induced the release of TNF-α (Supplemental Fig. 5B), IL-6 (Supplemental Fig. 5C), IL-10 (Supplemental Fig. 5D), NO (Supplemental Fig. 5E), and CXCL2 (Supplemental Fig. 5F), whereby the release was further amplified by prior LPS priming. Again, ribbons had no effect on the cytokine secretion. To confirm the involvement of TLRs in α-syn–induced immune signaling, we performed TLR-neutralizing experiments on unprimed microglia and used CXCL2 secretion as another readout (Supplemental Fig. 5G–J). For better clarity, we calculated the percent of neutralization to the α-syn–treated control levels (Ø). Again, we found that neutralization of TLR2 and TLR5 attenuated the release of CXCL2 from microglia exposed to α-syn monomers (Supplemental Fig. 5G) and oligomers (Supplemental Fig. 5H). In line with that, TLR2 and TLR5 neutralization decreased the CXCL2 release in response to fibrils (Supplemental Fig. 5I) and ribbons (Supplemental Fig. 5J). We did not find any indication for an involvement of TLR4 in α-syn–induced CXCL2 release.
Together, our data show TLR2- and TLR5-mediated inflammatory signaling in microglia dependent on α-syn structural characteristics. Moreover, to our knowledge, this is the first evidence for involvement of TLR5 in monomeric and oligomeric α-syn–induced microglial activation. In addition to IL-1β, we found various other inflammatory agents upregulated by α-syn, including TNF-α, IL-6, IL-10, NO, and CXCL2, further underlining differential proinflammatory properties of distinct α-syn species (Supplemental Fig. 5).
NLRP3 modulates the uptake and degradation of α-syn in microglia
To characterize and compare the microglial uptake of different α-syn forms, we exposed cells for 5, 10, or 15 min to fluorescently labeled α-syn monomers, oligomers, fibrils, or ribbons prior to uptake assessment analysis (Fig. 4). Using flow cytometry analysis, we found that microglia took up the different forms of α-syn as soon as they were exposed to them; however, α-syn monomers and distinct assemblies were taken up to a different extent. Although ∼10% of microglia had taken up α-syn monomers (Fig. 4A) and oligomers (Fig. 4B), around 90% of the cells were immunopositive to fibrils (Fig. 4C) and ribbons (Fig. 4D) after 5 min of exposure. At 15 min, 64% and 75% of microglia had incorporated α-syn monomers and oligomers, respectively, while 98% of cells contained fibrils or ribbons. The uptake of α-syn was blocked by the actin polymerization inhibitor cytochalasin D in all cases, indicating active α-syn phagocytosis by microglia. The engulfment of BSA was performed in parallel as a phagocytosis and degradation control (Supplemental Fig. 6A–D). Immunocytochemical analysis of microglia exposed to the different α-syn forms revealed limited internalization of monomers and oligomers as compared with massive uptake of fibrils and ribbons (Fig. 4E, Supplemental Fig. 6E).
FIGURE 4.

Microglia take up α-syn within minutes but hesitate in its degradation. Flow cytometric analysis and quantification of the percentage of α-syn–positive cells after exposure to 2 µM monomers (A), oligomers (B), fibrils (C), and ribbons (D) (n = 5 independent experiments). Active α-syn uptake was verified by inhibiting the engulfment with the phagocytosis inhibitor cytochalasin D (CytD). (E) Representative immunostainings for CD11b-positive microglia (red) containing distinct forms of α-syn–Atto488 (green). DAPI (blue) was used as a counterstain. (F) Quantification of the percentage of α-syn degradation after 24 h in microglia treated with 2 µM α-syn monomers (gray), oligomers (blue), fibrils (red), or ribbons (green) (n = 4 independent experiments with duplicated treatments for all conditions). Representative immunostaining (G) for LysoTracker (red) and α-syn–Atto488 (green) and quantification (H) of the lysosome: α-syn colocalization calculated by the Pearson’s correlation coefficient. Graphs in (A)–(D) are presented as mean ± SEM and were analyzed by one-way ANOVA followed by Tukey multiple-comparison post hoc test (B–D) or Kruskal–Wallis test for nonparametric data (A). Graphs in (F) are presented as mean ± SEM and were analyzed by an unpaired t test. Levels of significance are as follows: ****p < 0.0001, ***p < 0.001, **p < 0.01, *p < 0.05. Scale bars: 20 µm. See also Supplemental Fig. 6.
To determine whether microglia process α-syn after phagocytosis, we allowed microglia to take up monomers, oligomers, fibrils, or ribbons for 15 min; then we washed the cells twice with warm PBS and further incubated them for 24 h in fresh α-syn–free culture medium. We found that ∼50% of all the exogenously applied α-syn monomers and different assemblies remained inside microglia after 24 h (Fig. 4F). Consistently, immune staining of microglia exposed to α-syn oligomers, fibrils, or ribbons exhibited aggregates after allowing degradation for 24 h (Supplemental Fig. 6F) that was largely colocalized to lysosomes (Fig. 4G, 4H).
Several studies have shown that cytokines, including NLRP3 inflammasome-derived IL-1β, impair β-amyloid uptake (39). In keeping with this, suppression of inflammatory cytokine production resets microglial phagocytosis capacity in the APP/PS1 AD mouse model. To test whether NLRP3 inflammasome activity and the resulting IL-1β release play a similar role in α-syn phagocytosis, we analyzed the latter in WT microglia, WT microglia treated with the NLRP3 inflammasome inhibitor CRID3, and NLRP3-knockout microglia (Fig. 5). FACS analysis demonstrated that α-syn monomers (Fig. 5A) and oligomers (Fig. 5B) were engulfed to a significantly greater extent by WT microglia treated with the NLRP3 inflammasome inhibitor CRID3 or NLRP3-knockout microglia compared with WT cells, whereas NLRP3 inhibition or deficiency did not change the engulfment of fibrils (Fig. 5C) and ribbons (Fig. 5D). Interestingly, those α-syn monomers and oligomers were previously shown to activate the NLRP3 inflammasome even under basal conditions (Fig. 1). A similar NLRP3-dependent engulfment behavior was found in microglia exposed to BSA (Supplemental Fig. 6D). By expressing the degradation as a function of what was phagocytosed, we found that the degradation of α-syn monomers (Fig. 5E) was unaffected, while the degradation of oligomers was largely improved in cells deficient for a functional NLRP3 inflammasome (Fig. 5F). Also, the degradation of α-syn fibrils did not change in WT or NLRP3-deficient microglia (Fig. 5G), but CRID3 treatment improved the degradation of ribbons, while NLRP3 deficiency did not show any effects (Fig. 5H). Together, these data suggest that there is an inverse relation between microglial NLRP3 inflammasome activation (Fig. 1) and its negative regulation on oligomeric α-syn uptake and clearance (Figs. 5, 6).
FIGURE 5.
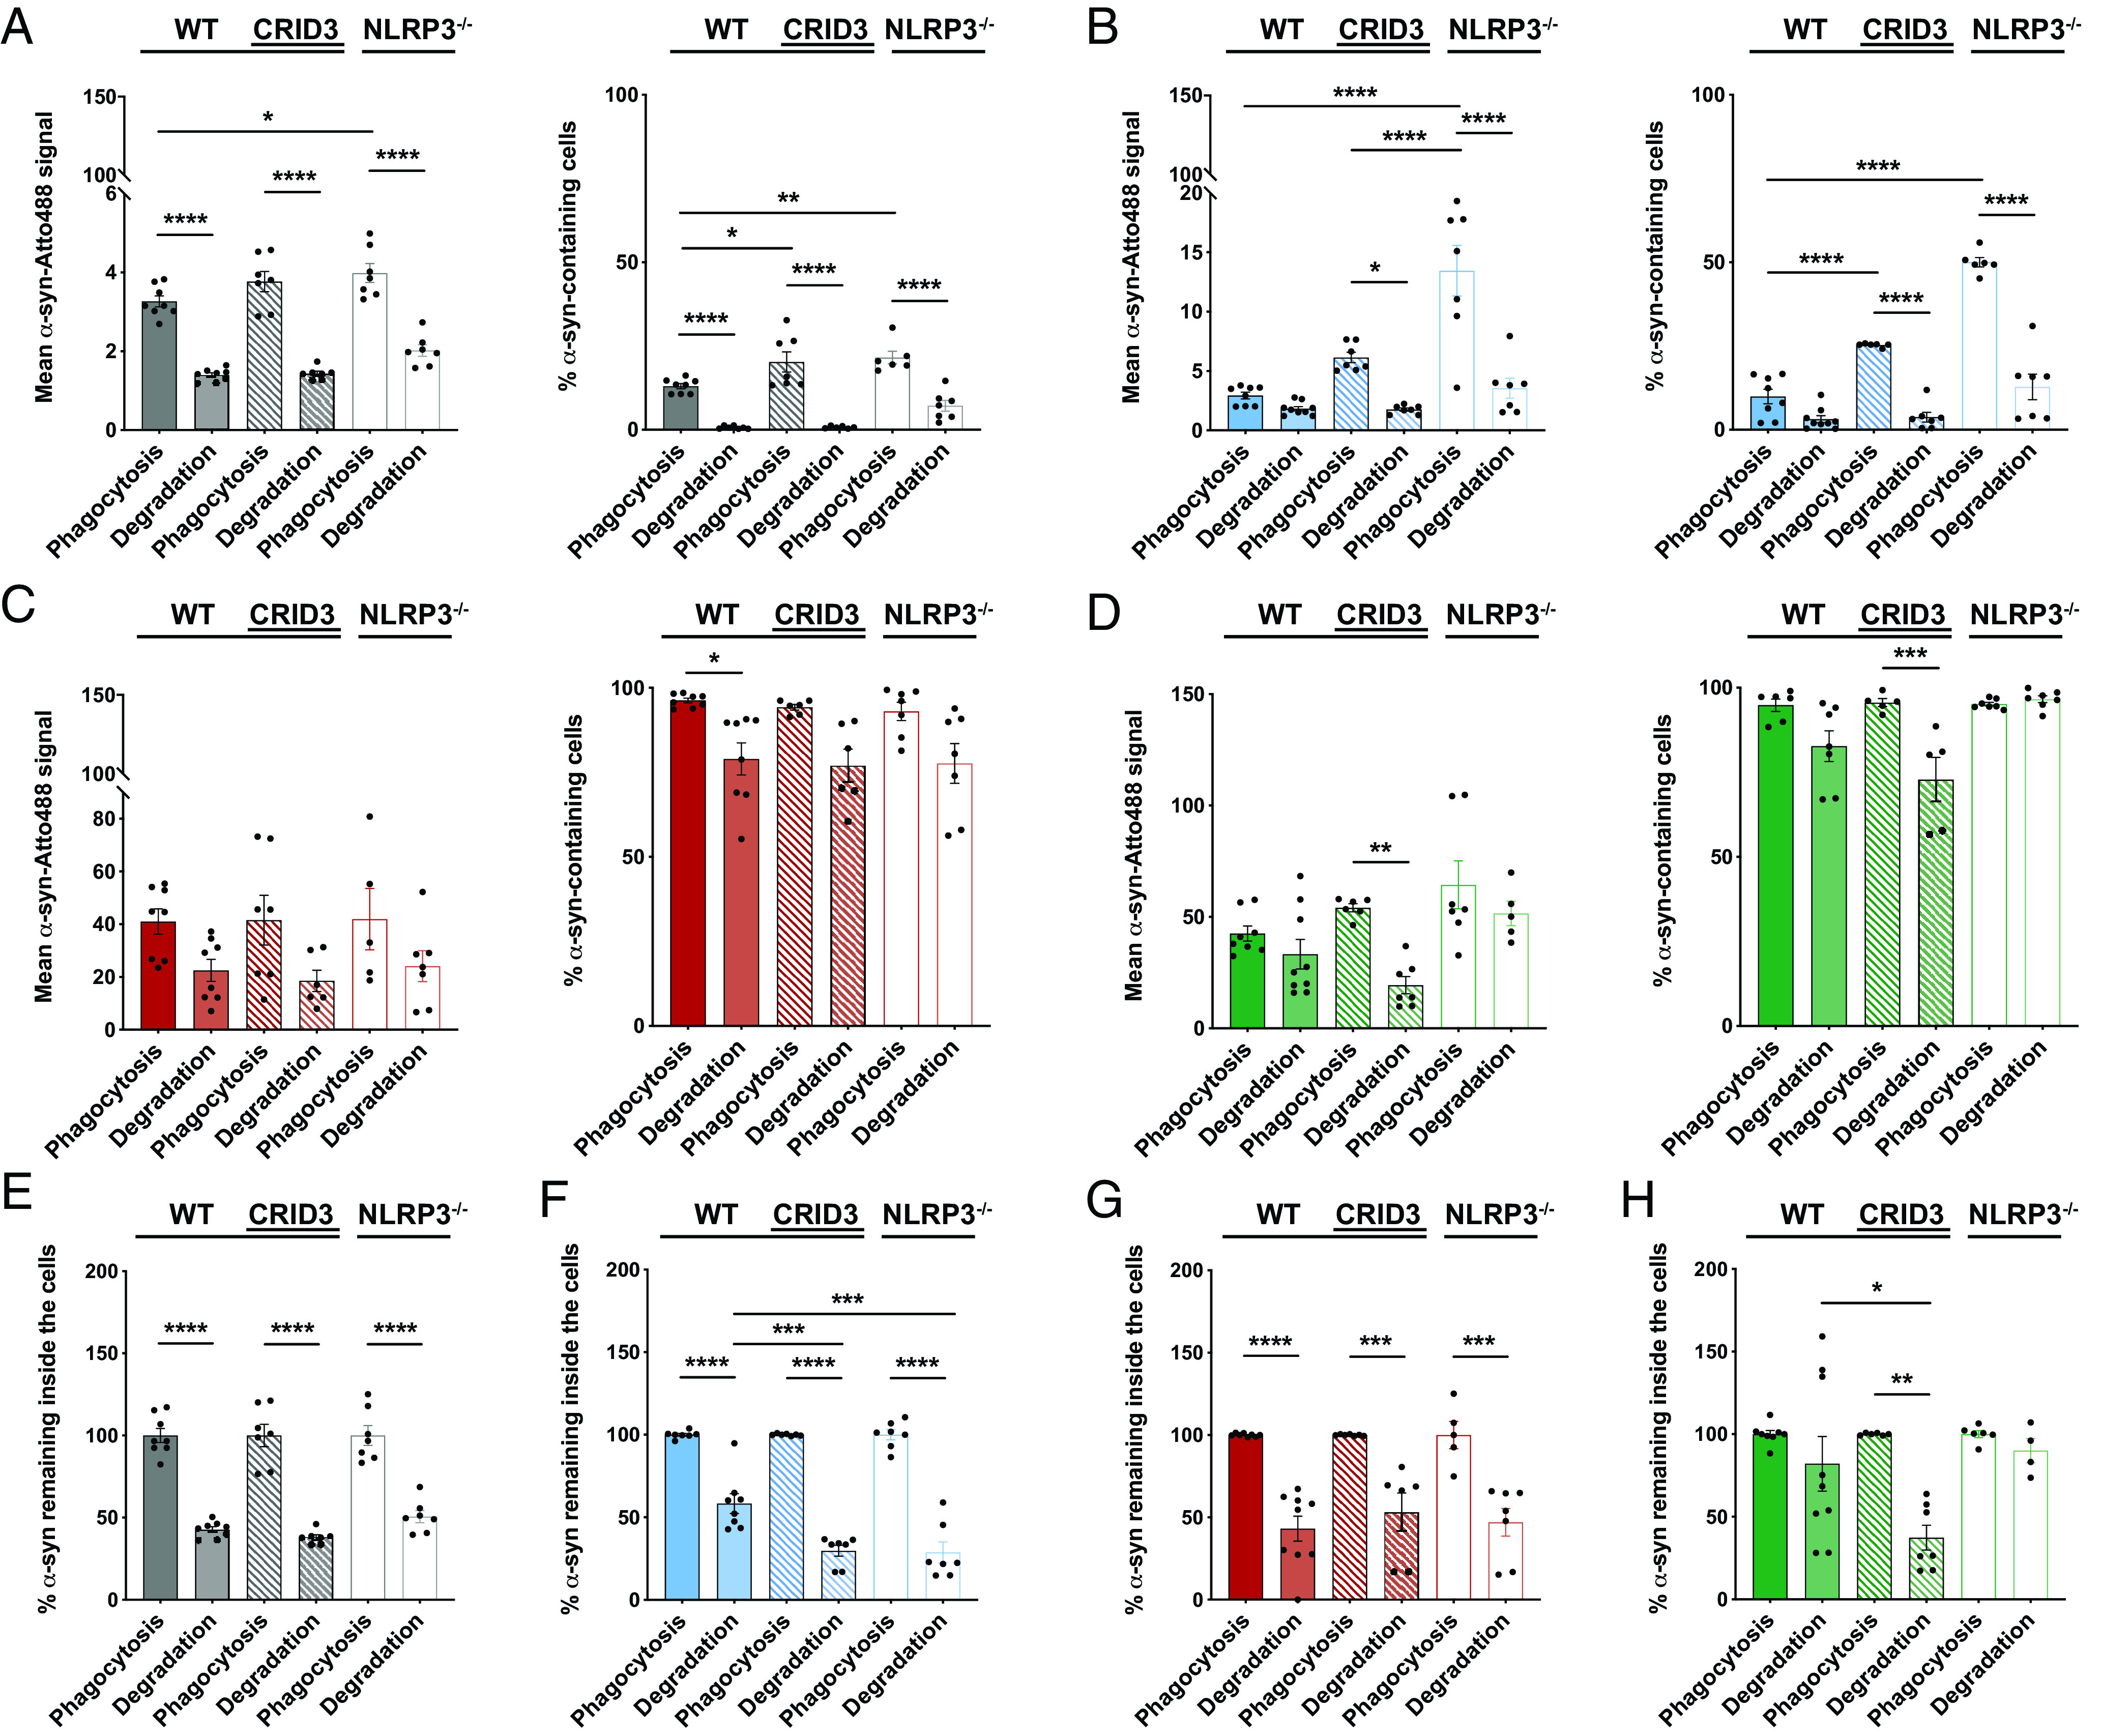
Microglia take up α-syn monomers and oligomers in an NLRP3-dependent manner. Quantification and comparison of the relative uptake and degradation of α-syn monomers (A), oligomers (B), fibrils (C), and ribbons (D) by WT microglia (filled bars), WT microglia treated with 200 nM NLRP3 inhibitor CRID3 (striped bars), and NLRP3-deficient microglia (open bars). Expression of the degradation as a function of α-syn monomers (E), oligomers (F), fibrils (G), and ribbons (H) that have been phagocytosed by WT microglia (filled bars), WT microglia treated with 200 nM NLRP3 inhibitor CRID3 (striped bars), and NLRP3-deficient microglia (open bars) (n = 6–7 independent experiments). All graphs are presented as mean ± SEM and were analyzed by one-way ANOVA followed by Tukey multiple comparison post hoc test. Levels of significance are as follows: ****p < 0.0001, ***p < 0.001, **p < 0.01, *p < 0.05. See also Supplemental Fig. 6.
FIGURE 6.

The inverse relationship between microglial NLRP3 inflammasome activation and α-syn clearance. The schematic was created with BioRender (https://biorender.com). TLR2 ligation by α-syn monomer and oligomers induce the expression of NLRP3, ASC, and caspase-1 p45 after translocation of NF-κB to the nucleus. Ligation of TLR5 by α-syn monomer and oligomers acts as an “activation” stimulus, resulting in the assembly of the NLRP3 inflammasome and the release of IL-1β. Activation of the NLRP3 inflammasome blocks the phagocytosis and degradation of α-syn oligomers and, to a lower extent, α-syn monomers, resulting in protein accumulation.
Discussion
Abnormal α-syn accumulations and microglial activation represent key pathological hallmarks of synucleinopathies. Even though α-syn aggregates are first found in neurons, evidence suggests that spreading of pathology will expose such protein aggregates to surrounding microglia. Microglia are responsible for the clearance of misfolded and aggregated proteins from the brain and represent the main drivers of inflammatory processes within the CNS. They are equipped with PRRs, which enable them to respond to α-syn aggregates, and their activation has been widely observed in PD (40). Once activated, microglia initiate a range of inflammatory responses, including the release of immune mediators, such as cytokines and complement factors, which, once chronically present, collectively contribute to neuronal dysfunction and degeneration. They also initiate response mechanisms for phagocytic clearance of the respective protein aggregates. Because α-syn proteins can adopt distinct conformations with noticeable differences in their aggregation phenotype, this may cause quantitative and qualitative differences in microglial immune response. The aim of this work is to delineate the different response patterns microglia show when exposed to various α-syn assemblies.
Bent out of shape: α-syn misfolding and its inflammatory consequences
NLRP3 inflammasome activation by misfolded proteins has emerged as an important mechanism for neurodegeneration (21), and misfolded α-syn has been reported to cause IL-1β release following microglial NLRP3 inflammasome activation (23). The pathological impact of this finding is further supported by the fact that NLRP3 inhibition prevents α-syn–mediated pathology in multiple rodent PD models (23). Native α-syn exists as a monomer; however, under pathological conditions, it forms aggregates with different inflammatory features. Most studies have been focusing on the induction of inflammation by various α-syn oligomers and inhomogeneous fibrillar assemblies. None, however, addressed the possible proinflammatory effects of α-syn monomers and homogeneous and structurally distinct fibrillar polymorphs. Due to variable experimental procedures and concentrations used throughout different reports, a direct comparison between the effects of different α-syn forms on NLRP3 inflammasome activation is therefore impossible. For example, it has been demonstrated elsewhere that 10 µM fibrillar α-syn largely upregulated the assembly of the NLRP3 inflammasome complex in primary microglia that were prestimulated with 200 ng/ml LPS (23). In contrast, another study reported the induction of the NLRP3 inflammasome on treatment with 3.5–7 µg/ml α-syn on prestimulation of primary microglia with 1 µg/ml LPS (41). Comparing those studies, both the α-syn concentration and the LPS concentration vary greatly and may possibly complicate any interpretation. Most importantly, both reports do not take possible actions of the monomeric form of α-syn and its potential to activate the NLRP3 inflammasome complex into account. We therefore set out to compare structurally well-characterized recombinant α-syn monomers, oligomers, and two fibrillar polymorphs, fibrils and ribbons, for their capacity to induce microglial inflammatory activation (Fig. 1A–K). Compared with both reports mentioned earlier, we used microglia that were unprimed or primed with a minimal dose of LPS (10 ng/ml) to avoid microglial overactivation and selected an α-syn concentration that was just sufficient to trigger IL-1β secretion (Supplemental Fig. 1C).
In vitro, microglia show no or just minimal activation of the NLRP3 inflammasome, and its priming is usually required as the first signaling step of activation by inducing the transcription of its components and substrates, including NLRP3, the adaptor ASC, procaspase-1, and pro–IL-1β. This is usually followed by a secondary posttranscriptional activation step that leads to the assembly of the inflammasome complex followed by cleavage of its substrates and cytokine release (21, 26). Here, we provide evidence that α-syn monomers and oligomers are able to effectively activate the inflammasome without the requirement of a prior priming step (Fig. 1L–R). In contrast, α-syn fibrils showed NLRP3 inflammasome assembly and IL-1β release only after initial priming (Fig. 3A–G), while ribbons did not affect the NLRP3 inflammasome in microglia.
Cell priming occurs through ligation of PRRs, which usually respond to a relatively restricted ligand spectrum (42). Various receptors have been implicated in binding to and mediating α-syn signaling in microglia, including TLR2, MHC class II, Fc receptor, and fractalkine receptor (43–46). Using TLR neutralization Abs, we found that monomers and oligomers exert their effects on the NLRP3 inflammasome via TLR2 and TLR5 (Fig. 2). Interestingly, neutralization of TLR2 largely blocked the α-syn–mediated NLRP3 protein expression in unprimed microglia, indicating an important role of TLR2 for NLRP3 inflammasome priming (Fig. 2I). In addition, TLR5 neutralization prevented caspase-1 cleavage in response to α-syn monomers and oligomers (Fig. 2J). Thus, our data indicate that TLR2 ligation by α-syn monomers and oligomers implements the inflammasome priming step, whereas TLR5 ligation results in the activation of the inflammasome under basal conditions (Fig. 6). A recent screening of TLR expression dynamics in mouse models of neurodegenerative disease, including PD and dementia with Lewy bodies, revealed the upregulation of TLR2 (47), resulting in the activation of microglial inflammation (45, 48, 49). Also, increased TLR2 levels have been found in the substantia nigra of patients with PD (50), further suggesting a pathogenetic role of TLR2 in synucleinopathies. In contrast, TLR5 has not yet been described as a PRR involved in microglial activation by α-syn; this PRR is rather known to be activated by flagellin, a monomer present on the outer cell wall of Gram-negative flagella bacteria. Although it remains unknown whether flagellin and α-syn monomers and oligomers share a similar TLR recognition site, to our knowledge, our data provide the first insights into TLR5-mediated inflammatory activation mechanisms by which α-syn monomers and oligomers prime and activate the NLRP3 inflammasome.
The inverse relation between the NLRP3 inflammasome and α-syn clearance
Effective microglial clearance of misfolded and aggregated proteins may play an important role in neurodegenerative disease. α-syn has been shown to be released from neurons and is detectable in biological fluids, including plasma and CSF (51, 52), as well as in conditioned media of α-syn–expressing neurons (53). Microglia are the main cell type responsible for the uptake and degradation of misfolded or aggregated proteins within the CNS, thereby avoiding the spreading of pathology between neighboring neurons. We therefore assessed the efficacy of microglial uptake and degradation of the aforementioned α-syn species. Microglia quickly internalized the protein in an assembly- and time-dependent manner (Fig. 4), but seemed to fail to fully degrade their cargo (Fig. 5), resulting in the accumulation of internalized α-syn aggregates (Supplemental Fig. 6E, 6F). Several studies provide evidence for impaired clearance mechanisms in PD, leading to the idea that α-syn can block its own clearance (54, 55). Alternatively, the microglial activation state may alter its intracellular capacity to effectively degrade the taken-up protein aggregates (56). In response to persistent neurodegeneration, microglia adopt a chronically activated phenotype resulting in the sustained release of cytokines, including IL-1β, that have been found to impair its own clearance functions (57). We therefore analyzed the impact of NLRP3 inflammasome inhibition by CRID3 and NLRP3 depletion on the phagocytic and degrading capacity of microglia. A large increase in oligomeric α-syn phagocytosis was found in CRID3-treated WT or NLRP3-knockout microglia (Fig. 5B). Interestingly, we showed that oligomeric α-syn has the potential to activate the inflammasome (Fig. 1), suggesting that NLRP3 inflammasome activation deteriorates microglial phagocytosis (58). In addition, degradation experiments revealed that NLRP3 deficiency substantially induces the depletion of oligomeric α-syn (Fig. 5B, 5F). Monomeric α-syn uptake was barely increased in NLRP3-deficient cells (Fig. 5A), whereas its degradation did not show any NLRP3 dependency (Fig. 5E). In contrast, uptake and degradation of fibrils and ribbons did not show NLRP3 dependency (Fig. 5).
Taken together, we provide the first evidence, to our knowledge, that α-syn monomers, rather than oligomers or fibrillar polymorphs, largely induce microglial NLRP3 inflammasome activation. Both α-syn monomers and, to a lower extent, oligomers had the potential to prime and activate the NLRP3 inflammasome via TLR2 and TLR5 ligation without the requirement of an initial inflammogen (LPS) treatment. Activation of the NLRP3 inflammasome compromised α-syn clearance capacity (Fig. 6). Likewise, NLRP3 inflammasome inhibition or NLRP3 depletion improved α-syn phagocytosis and degradation of α-syn monomers and oligomers. These findings highlight the potential of targeting the NLRP3 inflammasome or related intracellular signaling mechanisms to control excessive cytokine release mediated by α-syn monomers even before the development of fibrillar complexes.
Supplementary Material
Acknowledgments
We thank the German Center for Neurodegenerative Diseases (DZNE) light microscope facility for providing microscopes and advice, and the DZNE Image and Data Analysis Facility for providing analysis computers, software, and advice.
This article is featured in Top Reads, p.
This work was supported by the EU Joint Programme on Neurodegenerative Disease Research (JPND-SYNACTION-ANR-15-JPWG-0012-03) and by the Deutsche Forschungsgemeinschaft (German Research Foundation) under Germany’s Excellence Strategy EXC2151-390873048. H.S. received funding from the Gemeinnützige Hertie Stiftung (Hertie-Stiftung) under the Hertie Network of excellence in clinical neuroscience. R.M. and L.B. were supported by the CNRS, the EU Joint Programme on Neurodegenerative Disease Research (JPND-SYNACTION-ANR-15-JPWG-0012-03 and TransPath-ND-ANR-17-JPCD-0002-02), and the Fondation pour la Recherche Médicale (Contract DEQ. 20160334896).
H.S. and M.T.H. designed all experiments; H.S. performed experiments and analyzed data with assistance of A.G., S.S., and M.T.H.; L.B. and R.M. generated and characterized all α-synuclein assemblies and provided advice; E.L. provided chemical compounds; H.S. and M.T.H. wrote the manuscript with input from all coauthors.
The online version of this article contains supplemental material.
- ASC
- apoptosis-associated speck-like protein
- NLRP3
- NOD-like receptor pyrin domain containing 3
- PD
- Parkinson’s disease
- PRR
- pattern recognition receptor
- P/S
- penicillin/streptomycin
- α-syn
- α-synuclein
- WT
- wild-type
Disclosures
M.T.H. serves as an advisory board member at IFM Therapeutics, Alector, and Tiaki. He received honoraria for oral presentations from Novartis, Roche, and Biogen. The other authors have no financial conflicts of interest.
References
- 1.Shahmoradian S. H., Lewis A. J., Genoud C., Hench J., Moors T. E., Navarro P. P., Castaño-Díez D., Schweighauser G., Graff-Meyer A., Goldie K. N., et al. 2019. Lewy pathology in Parkinson’s disease consists of crowded organelles and lipid membranes. Nat. Neurosci. 22: 1099–1109. [DOI] [PubMed] [Google Scholar]
- 2.Spillantini M. G., Schmidt M. L., Lee V. M.-Y., Trojanowski J. Q., Jakes R., Goedert M.. 1997. α-synuclein in Lewy bodies. Nature 388: 839–840. [DOI] [PubMed] [Google Scholar]
- 3.Weinreb P. H., Zhen W., Poon A. W., Conway K. A., Lansbury P. T. Jr. 1996. NACP, a protein implicated in Alzheimer’s disease and learning, is natively unfolded. Biochemistry 35: 13709–13715. [DOI] [PubMed] [Google Scholar]
- 4.Shrivastava A. N., Redeker V., Fritz N., Pieri L., Almeida L. G., Spolidoro M., Liebmann T., Bousset L., Renner M., Léna C., et al. 2015. α-synuclein assemblies sequester neuronal α3-Na+/K+-ATPase and impair Na+ gradient. EMBO J. 34: 2408–2423. [DOI] [PMC free article] [PubMed] [Google Scholar]
- 5.DeWitt D. C., Rhoades E.. 2013. α-Synuclein can inhibit SNARE-mediated vesicle fusion through direct interactions with lipid bilayers. Biochemistry 52: 2385–2387. [DOI] [PMC free article] [PubMed] [Google Scholar]
- 6.Faustini G., Bono F., Valerio A., Pizzi M., Spano P., Bellucci A.. 2017. Mitochondria and α-synuclein: friends or foes in the pathogenesis of Parkinson’s disease? Genes (Basel) 8: 377. [DOI] [PMC free article] [PubMed] [Google Scholar]
- 7.Gribaudo S., Tixador P., Bousset L., Fenyi A., Lino P., Melki R., Peyrin J.-M., Perrier A. L.. 2019. Propagation of α-synuclein strains within human reconstructed neuronal network. Stem Cell Reports 12: 230–244. [DOI] [PMC free article] [PubMed] [Google Scholar]
- 8.Martínez J. H., Fuentes F., Vanasco V., Alvarez S., Alaimo A., Cassina A., Coluccio Leskow F., Velazquez F.. 2018. Alpha-synuclein mitochondrial interaction leads to irreversible translocation and complex I impairment. Arch. Biochem. Biophys. 651: 1–12. [DOI] [PubMed] [Google Scholar]
- 9.Cooper A. A., Gitler A. D., Cashikar A., Haynes C. M., Hill K. J., Bhullar B., Liu K., Xu K., Strathearn K. E., Liu F., et al. 2006. Alpha-synuclein blocks ER-Golgi traffic and Rab1 rescues neuron loss in Parkinson’s models. Science 313: 324–328. [DOI] [PMC free article] [PubMed] [Google Scholar]
- 10.Thayanidhi N., Helm J. R., Nycz D. C., Bentley M., Liang Y., Hay J. C.. 2010. α-synuclein delays endoplasmic reticulum (ER)-to-Golgi transport in mammalian cells by antagonizing ER/Golgi SNAREs. Mol. Biol. Cell 21: 1850–1863. [DOI] [PMC free article] [PubMed] [Google Scholar]
- 11.Flavin W. P., Bousset L., Green Z. C., Chu Y., Skarpathiotis S., Chaney M. J., Kordower J. H., Melki R., Campbell E. M.. 2017. Endocytic vesicle rupture is a conserved mechanism of cellular invasion by amyloid proteins. Acta Neuropathol. 134: 629–653. [DOI] [PubMed] [Google Scholar]
- 12.Martinez-Vicente M., Vila M.. 2013. Alpha-synuclein and protein degradation pathways in Parkinson’s disease: a pathological feed-back loop. Exp. Neurol. 247: 308–313. [DOI] [PubMed] [Google Scholar]
- 13.Colonna M., Butovsky O.. 2017. Microglia Function in the Central Nervous System During Health and Neurodegeneration. Annu. Rev. Immunol. 35: 441–468. [DOI] [PMC free article] [PubMed] [Google Scholar]
- 14.Heneka M. T., Kummer M. P., Latz E.. 2014. Innate immune activation in neurodegenerative disease. Nat. Rev. Immunol. 14: 463–477. [DOI] [PubMed] [Google Scholar]
- 15.Croisier E., Moran L. B., Dexter D. T., Pearce R. K. B., Graeber M. B.. 2005. Microglial inflammation in the parkinsonian substantia nigra: relationship to alpha-synuclein deposition. J. Neuroinflammation 2: 14. [DOI] [PMC free article] [PubMed] [Google Scholar]
- 16.Gerhard A., Pavese N., Hotton G., Turkheimer F., Es M., Hammers A., Eggert K., Oertel W., Banati R. B., Brooks D. J.. 2006. In vivo imaging of microglial activation with [11C](R)-PK11195 PET in idiopathic Parkinson’s disease. Neurobiol. Dis. 21: 404–412. [DOI] [PubMed] [Google Scholar]
- 17.McGeer P. L., Itagaki S., Boyes B. E., McGeer E. G.. 1988. Reactive microglia are positive for HLA-DR in the substantia nigra of Parkinson’s and Alzheimer’s disease brains. Neurology 38: 1285–1291. [DOI] [PubMed] [Google Scholar]
- 18.Allan S. M., Tyrrell P. J., Rothwell N. J.. 2005. Interleukin-1 and neuronal injury. Nat. Rev. Immunol. 5: 629–640. [DOI] [PubMed] [Google Scholar]
- 19.Lamkanfi M., Dixit V. M.. 2012. Inflammasomes and their roles in health and disease. Annu. Rev. Cell Dev. Biol. 28: 137–161. [DOI] [PubMed] [Google Scholar]
- 20.Codolo G., Plotegher N., Pozzobon T., Brucale M., Tessari I., Bubacco L., de Bernard M.. 2013. Triggering of inflammasome by aggregated α-synuclein, an inflammatory response in synucleinopathies. PLoS One 8: e55375. [DOI] [PMC free article] [PubMed] [Google Scholar]
- 21.Heneka M. T., McManus R. M., Latz E.. 2018. Inflammasome signalling in brain function and neurodegenerative disease. [Published erratum appears in 2019 Nat. Rev. Neurosci. 20: 187.] Nat. Rev. Neurosci. 19: 610–621. [DOI] [PubMed] [Google Scholar]
- 22.Wang S., Yuan Y.-H., Chen N.-H., Wang H.-B.. 2019. The mechanisms of NLRP3 inflammasome/pyroptosis activation and their role in Parkinson’s disease. Int. Immunopharmacol. 67: 458–464. [DOI] [PubMed] [Google Scholar]
- 23.Gordon R., Albornoz E. A., Christie D. C., Langley M. R., Kumar V., Mantovani S., Robertson A. A. B., Butler M. S., Rowe D. B., O’Neill L. A., et al. 2018. Inflammasome inhibition prevents α-synuclein pathology and dopaminergic neurodegeneration in mice. Sci. Transl. Med. 10: eaah4066. [DOI] [PMC free article] [PubMed] [Google Scholar]
- 24.Liu X., Quan N.. 2018. Microglia and CNS Interleukin-1: Beyond Immunological Concepts. Front. Neurol. 9: 8. [DOI] [PMC free article] [PubMed] [Google Scholar]
- 25.Takeuchi O., Akira S.. 2010. Pattern recognition receptors and inflammation. Cell 140: 805–820. [DOI] [PubMed] [Google Scholar]
- 26.Broz P., Dixit V. M.. 2016. Inflammasomes: mechanism of assembly, regulation and signalling. Nat. Rev. Immunol. 16: 407–420. [DOI] [PubMed] [Google Scholar]
- 27.Guo H., Callaway J. B., Ting J. P.-Y.. 2015. Inflammasomes: mechanism of action, role in disease, and therapeutics. Nat. Med. 21: 677–687. [DOI] [PMC free article] [PubMed] [Google Scholar]
- 28.Christgen S., Place D. E., Kanneganti T.-D.. 2020. Toward targeting inflammasomes: insights into their regulation and activation. Cell Res. 30: 315–327. [DOI] [PMC free article] [PubMed] [Google Scholar]
- 29.Bousset L., Pieri L., Ruiz-Arlandis G., Gath J., Jensen P. H., Habenstein B., Madiona K., Olieric V., Böckmann A., Meier B. H., Melki R.. 2013. Structural and functional characterization of two alpha-synuclein strains. Nat. Commun. 4: 2575. [DOI] [PMC free article] [PubMed] [Google Scholar]
- 30.Peelaerts W., Bousset L., Van der Perren A., Moskalyuk A., Pulizzi R., Giugliano M., Van den Haute C., Melki R., Baekelandt V.. 2015. α-Synuclein strains cause distinct synucleinopathies after local and systemic administration. Nature 522: 340–344. [DOI] [PubMed] [Google Scholar]
- 31.Giulian D., Baker T. J.. 1986. Characterization of ameboid microglia isolated from developing mammalian brain. J. Neurosci. 6: 2163–2178. [DOI] [PMC free article] [PubMed] [Google Scholar]
- 32.Ghee M., Melki R., Michot N., Mallet J.. 2005. PA700, the regulatory complex of the 26S proteasome, interferes with α-synuclein assembly. FEBS J. 272: 4023–4033. [DOI] [PubMed] [Google Scholar]
- 33.Jakobs C., Bartok E., Kubarenko A., Bauernfeind F., Hornung V.. 2013. Immunoblotting for active caspase-1. Methods Mol. Biol. 1040: 103–115. [DOI] [PubMed] [Google Scholar]
- 34.Pieri L., Madiona K., Melki R.. 2016. Structural and functional properties of prefibrillar α-synuclein oligomers. Sci. Rep. 6: 24526. [DOI] [PMC free article] [PubMed] [Google Scholar]
- 35.Cremades N., Chen S. W., Dobson C. M.. 2017. Structural characteristics of α-synuclein oligomers. Int. Rev. Cell Mol. Biol. 329: 79–143. [DOI] [PubMed] [Google Scholar]
- 36.Lashuel H. A., Petre B. M., Wall J., Simon M., Nowak R. J., Walz T., Lansbury P. T. Jr. 2002. α-Synuclein, especially the Parkinson’s disease-associated mutants, forms pore-like annular and tubular protofibrils. J. Mol. Biol. 322: 1089–1102. [DOI] [PubMed] [Google Scholar]
- 37.Shrivastava A. N., Bousset L., Renner M., Redeker V., Savistchenko J., Triller A., Melki R.. 2020. Differential membrane binding and seeding of distinct α-synuclein fibrillar polymorphs. Biophys. J. 118: 1301–1320. [DOI] [PMC free article] [PubMed] [Google Scholar]
- 38.Fernandes-Alnemri T., Wu J., Yu J.-W., Datta P., Miller B., Jankowski W., Rosenberg S., Zhang J., Alnemri E. S.. 2007. The pyroptosome: a supramolecular assembly of ASC dimers mediating inflammatory cell death via caspase-1 activation. Cell Death Differ. 14: 1590–1604. [DOI] [PMC free article] [PubMed] [Google Scholar]
- 39.Heneka M. T., Kummer M. P., Stutz A., Delekate A., Schwartz S., Vieira-Saecker A., Griep A., Axt D., Remus A., Tzeng T.-C., et al. 2013. NLRP3 is activated in Alzheimer’s disease and contributes to pathology in APP/PS1 mice. Nature 493: 674–678. [DOI] [PMC free article] [PubMed] [Google Scholar]
- 40.Lecours C., Bordeleau M., Cantin L., Parent M., Paolo T. D., Tremblay M.-È.. 2018. Microglial implication in Parkinson’s disease: loss of beneficial physiological roles or gain of inflammatory functions? Front. Cell. Neurosci. 12: 282. [DOI] [PMC free article] [PubMed] [Google Scholar]
- 41.Panicker N., Sarkar S., Harischandra D. S., Neal M., Kam T.-I., Jin H., Saminathan H., Langley M., Charli A., Samidurai M., et al. 2019. Fyn kinase regulates misfolded α-synuclein uptake and NLRP3 inflammasome activation in microglia. J. Exp. Med. 216: 1411–1430. [DOI] [PMC free article] [PubMed] [Google Scholar]
- 42.Akira S., Uematsu S., Takeuchi O.. 2006. Pathogen recognition and innate immunity. Cell 124: 783–801. [DOI] [PubMed] [Google Scholar]
- 43.Cao S., Standaert D. G., Harms A. S.. 2012. The gamma chain subunit of Fc receptors is required for alpha-synuclein-induced pro-inflammatory signaling in microglia. J. Neuroinflammation 9: 259. [DOI] [PMC free article] [PubMed] [Google Scholar]
- 44.Harms A. S., Cao S., Rowse A. L., Thome A. D., Li X., Mangieri L. R., Cron R. Q., Shacka J. J., Raman C., Standaert D. G.. 2013. MHCII is required for α-synuclein-induced activation of microglia, CD4 T cell proliferation, and dopaminergic neurodegeneration. J. Neurosci. 33: 9592–9600. [DOI] [PMC free article] [PubMed] [Google Scholar]
- 45.Kim C., Ho D.-H., Suk J.-E., You S., Michael S., Kang J., Joong Lee S., Masliah E., Hwang D., Lee H.-J., Lee S.-J.. 2013. Neuron-released oligomeric α-synuclein is an endogenous agonist of TLR2 for paracrine activation of microglia. Nat. Commun. 4: 1562. [DOI] [PMC free article] [PubMed] [Google Scholar]
- 46.Thome A. D., Standaert D. G., Harms A. S.. 2015. Fractalkine Signaling Regulates the Inflammatory Response in an α-Synuclein Model of Parkinson Disease. PLoS One 10: e0140566. [DOI] [PMC free article] [PubMed] [Google Scholar]
- 47.Letiembre M., Liu Y., Walter S., Hao W., Pfander T., Wrede A., Schulz-Schaeffer W., Fassbender K.. 2009. Screening of innate immune receptors in neurodegenerative diseases: a similar pattern. Neurobiol. Aging 30: 759–768. [DOI] [PubMed] [Google Scholar]
- 48.Béraud D., Twomey M., Bloom B., Mittereder A., Ton V., Neitzke K., Chasovskikh S., Mhyre T. R., Maguire-Zeiss K. A.. 2011. α-Synuclein alters Toll-like receptor expression. Front. Neurosci. 5: 80. [DOI] [PMC free article] [PubMed] [Google Scholar]
- 49.Gustot A., Gallea J. I., Sarroukh R., Celej M. S., Ruysschaert J.-M., Raussens V.. 2015. Amyloid fibrils are the molecular trigger of inflammation in Parkinson’s disease. Biochem. J. 471: 323–333. [DOI] [PubMed] [Google Scholar]
- 50.Doorn K. J., Moors T., Drukarch B., van de Berg W. Dj., Lucassen P. J., van Dam A.-M.. 2014. Microglial phenotypes and Toll-like receptor 2 in the substantia nigra and hippocampus of incidental Lewy body disease cases and Parkinson’s disease patients. Acta Neuropathol. Commun. 2: 90. [DOI] [PMC free article] [PubMed] [Google Scholar]
- 51.El-Agnaf O. M. A., Salem S. A., Paleologou K. E., Cooper L. J., Fullwood N. J., Gibson M. J., Curran M. D., Court J. A., Mann D. M. A., Ikeda S., et al. 2003. α-synuclein implicated in Parkinson’s disease is present in extracellular biological fluids, including human plasma. FASEB J. 17: 1945–1947. [DOI] [PubMed] [Google Scholar]
- 52.Mollenhauer B., Locascio J. J., Schulz-Schaeffer W., Sixel-Döring F., Trenkwalder C., Schlossmacher M. G.. 2011. α-Synuclein and tau concentrations in cerebrospinal fluid of patients presenting with parkinsonism: a cohort study. Lancet Neurol. 10: 230–240. [DOI] [PubMed] [Google Scholar]
- 53.Emmanouilidou E., Melachroinou K., Roumeliotis T., Garbis S. D., Ntzouni M., Margaritis L. H., Stefanis L., Vekrellis K.. 2010. Cell-produced alpha-synuclein is secreted in a calcium-dependent manner by exosomes and impacts neuronal survival. J. Neurosci. 30: 6838–6851. [DOI] [PMC free article] [PubMed] [Google Scholar]
- 54.Cuervo A. M., Stefanis L., Fredenburg R., Lansbury P. T., Sulzer D.. 2004. Impaired degradation of mutant α-synuclein by chaperone-mediated autophagy. Science 305: 1292–1295. [DOI] [PubMed] [Google Scholar]
- 55.Snyder H., Mensah K., Theisler C., Lee J., Matouschek A., Wolozin B.. 2003. Aggregated and monomeric α-synuclein bind to the S6' proteasomal protein and inhibit proteasomal function. J. Biol. Chem. 278: 11753–11759. [DOI] [PubMed] [Google Scholar]
- 56.Lee H.-J., Suk J.-E., Bae E.-J., Lee S.-J.. 2008. Clearance and deposition of extracellular α-synuclein aggregates in microglia. Biochem. Biophys. Res. Commun. 372: 423–428. [DOI] [PubMed] [Google Scholar]
- 57.Hickman S. E., Allison E. K., El Khoury J.. 2008. Microglial dysfunction and defective beta-amyloid clearance pathways in aging Alzheimer’s disease mice. J. Neurosci. 28: 8354–8360. [DOI] [PMC free article] [PubMed] [Google Scholar]
- 58.Jin L., Batra S., Jeyaseelan S.. 2017. Deletion of Nlrp3 augments survival during polymicrobial sepsis by decreasing autophagy and enhancing phagocytosis. J. Immunol. 198: 1253–1262. [DOI] [PMC free article] [PubMed] [Google Scholar]
Associated Data
This section collects any data citations, data availability statements, or supplementary materials included in this article.