Abstract
Cholesterol is essential for membrane biogenesis, cell proliferation, and differentiation. The role of cholesterol in cancer development and the regulation of cholesterol synthesis are still under active investigation. Here we show that under normal‐sterol conditions, p53 directly represses the expression of SQLE, a rate‐limiting and the first oxygenation enzyme in cholesterol synthesis, in a SREBP2‐independent manner. Through transcriptional downregulation of SQLE, p53 represses cholesterol production in vivo and in vitro, leading to tumor growth suppression. Inhibition of SQLE using small interfering RNA (siRNA) or terbinafine (a SQLE inhibitor) reverses the increased cell proliferation caused by p53 deficiency. Conversely, SQLE overexpression or cholesterol addition promotes cell proliferation, particularly in p53 wild‐type cells. More importantly, pharmacological inhibition or shRNA‐mediated silencing of SQLE restricts nonalcoholic fatty liver disease (NAFLD)‐induced liver tumorigenesis in p53 knockout mice. Therefore, our findings reveal a role for p53 in regulating SQLE and cholesterol biosynthesis, and further demonstrate that downregulation of SQLE is critical for p53‐mediated tumor suppression.
Keywords: cholesterol, SQLE, p53, cell proliferation
Subject Categories: Cancer; Chromatin, Transcription & Genomics; Metabolism
This study reveals a SREBP2‐independent role for p53 in regulating SQLE and cholesterol biosynthesis under normal sterol conditions, and further demonstrate that downregulation of SQLE is critical for p53‐mediated tumor suppression.

Introduction
Cholesterol is an essential component of cell membrane and important for cell proliferation and differentiation (Silvente‐Poirot & Poirot, 2012). In mammalian cells, cholesterol is synthesized through multiple steps catalyzed by different metabolic enzymes. Squalene epoxidase (SQLE), one of the two rate‐limiting enzymes in cholesterol synthesis, catalyzes the first oxygenation step converting squalene to 2,3(S)‐monooxidosqualene (MOS). SQLE is relatively unstable and can be degraded through cholesterol‐dependent proteasomal turnover (Gill et al, 2011; Foresti et al, 2013; Zelcer et al, 2014). Under lipid‐depleted conditions, the expression of SQLE can be transcriptionally regulated by mature form of SREBP2 (Hidaka et al, 1990; Nakamura et al, 1996; Nagai et al, 2002). Among the multiple enzymes in cholesterol synthesis, SQLE appears to be the key one that is crucial for tumor development. High expression of SQLE is frequently observed in many human cancers and is associated with poor patient outcomes (Helms et al, 2008; Brown et al, 2016; Stopsack et al, 2016; Liu et al, 2018). Moreover, abnormal elevation of SQLE is responsible for hepatic cholesterol accumulation and accelerates the nonalcoholic fatty liver disease (NAFLD)‐associated hepatocellular carcinoma (HCC) development (Liu et al, 2018). However, how tumor cells augment SQLE expression to reprogram cholesterol metabolism still remains unclear.
Tumor suppressor p53, the most frequent mutant gene in human cancer, controls a wide variety of biological processes, including apoptosis, cell‐cycle arrest, and senescence (Vousden & Prives, 2009). However, it appears that manipulation of antioxidant function and metabolism regulation is more critical for the tumor‐suppressive function of p53 (Li et al, 2012; Valente et al, 2013; Kastenhuber & Lowe, 2017). Numerous studies suggest that p53 plays an important role in regulating glucose, lipid, amino acid, as well as other metabolic pathways (Vousden & Ryan, 2009; Floter et al, 2017; Liu et al, 2019; Lahalle et al, 2021; Liu & Gu, 2021). Hepatic p53 has been recognized as an important regulator of different liver diseases, such as NAFLD development, hepatic insulin resistance, nonalcoholic steatohepatitis, HCC development, and liver regeneration (Krstic et al, 2018). Interestingly, recent study reveals that under low‐sterol conditions p53 represses cellular mevalonate pathway to mediate liver tumor suppression through inhibition of SREBP2 maturation (Moon et al, 2019). Intriguingly, p53 unexpectedly functions in promoting hepatocellular carcinoma (HCC) tumorigenesis through inducing PUMA‐dependent suppression of oxidative phosphorylation (Kim et al, 2019). Thus, the role of p53 in HCC is contentious and needs further investigation.
Here we report that, under normal‐sterol conditions, p53 has a role in repressing cholesterol accumulation and liver tumor growth through transcriptional repression of SQLE, a key metabolic enzyme in cholesterol synthesis. We also provide an evidence that p53 is capable to directly bind to SQLE gene in a SREBP2‐independent manner. Thus, our findings, together with others (Moon et al, 2019), uncover a strong surveillance capability of p53 in guarding cholesterol synthesis pathway under both low‐sterol and normal‐sterol conditions.
Results
p53 suppresses cholesterol synthesis
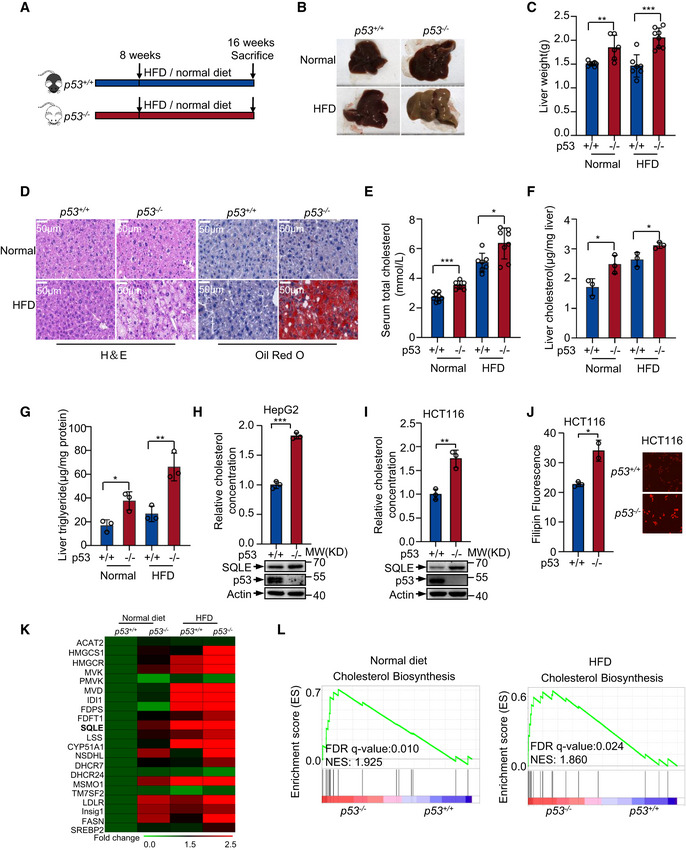
To assess the role of p53 in NAFLD‐induced HCC, we firstly evaluated the role of p53 in NAFLD. p53 wild‐type (p53 +/+) and knockout (p53 −/−) mice were fed with normal diet (Normal) or high‐fat diet (HFD) starting at the age of 8 weeks. All mice were weighed every week. Mice were sacrificed at the age of 16 weeks, and the livers were analyzed. p53 −/− mice showed increased liver weight and body weight with HFD (Fig 1A–C and Fig EV1A and B). We also valued the effect of p53 on the lipid droplets formation in liver. p53 −/− mice liver tissues had more lipid compared with the liver tissues from p53 +/+ mice fed with HFD (Fig 1D). p53 −/− mice showed an increase in both serum and hepatic cholesterol concentrations compared with p53 +/+ mice with either normal diet or HFD (Fig 1E and F). Similarly, higher levels of hepatic triglyceride were observed in p53 −/− mice (Fig 1G). Moreover, HFD‐treated mice showed increased hepatic cholesterol accumulation and triglyceride concentrations compared to normal‐treated mice (Fig 1F and G). These data indicate that p53 restricts cholesterol accumulation. To further determine the function of p53 in cholesterol metabolism, we knocked out p53 using CRISPR/Cas9 system in human hepatocellular carcinoma cell line HepG2. p53 knockout augmented cholesterol accumulation (Fig 1H). We also knocked down p53 using two different sets of small interfering RNA (siRNA) in other two HCC cell lines SK‐HEP‐1 and BEL‐7402. p53 deficiency led to increased cholesterol concentration compared with their wild‐type counterparts (Fig EV1C and D). Next, we examined the cholesterol levels in isogenic p53 +/+ and p53 −/− human colon cancer HCT116 cells (Bunz et al, 1998). Cholesterol concentration increased in p53 −/− cells compared to p53 +/+ cells (Fig 1I and J). These data suggest p53 suppresses cholesterol accumulation both in vivo and in vitro.
Figure 1. p53 suppresses cholesterol biosynthesis.
-
A–Gp53+/+ and p53 −/− C57BL/6N male mice were treated as in (A). Data are means ± s.d. (n = 6 to 8). (B) Representative liver photos of mice livers. (C) Representative changes in liver weight. (D) H&E (hematoxylin‐eosin) staining (left) and oil red O staining (right) of livers. Scale bar, 50 μm. (E) Serum cholesterol concentrations of each group. Liver cholesterol concentrations (F) and triglyceride levels (G) of each group were examined.
-
H, ICholesterol levels in p53+/+ and p53 −/− HepG2 cells (H) or HCT116 cells (I) were examined. Protein expression was shown by Western blotting (bottom panel).
-
JCholesterol concentrations of p53+/+ and p53 −/− HCT116 cells were determined by Filipin III staining.
-
KHeat map analysis of 17 sterol biosynthesis genes and 3 other SREBP2 target genes from RNA‐seq data using mice livers of p53+/+ and p53 −/− mice fed with normal or HFD diet. Expression levels were normalized to the mean level of each gene among all samples and compared to p53 +/+ normal diet mice. Color scale indicates the expression fold change of target gene.
-
LEnrichment of cholesterol biosynthesis genes in the liver of normal diet (left) and HFD diet (right). FDR: false discovery rate; NES: normalized enrichment score.
Data information: In (C, E, F, G, H, I, J), bars represent mean ± s.d., *P < 0.05; **P < 0.01; ***P < 0.001; for (B, D), n = 6–8 biologically independent samples; for (F, G, H, I, J) n = 3 biologically independent samples; statistical significance was determined by two‐tailed unpaired t‐test.
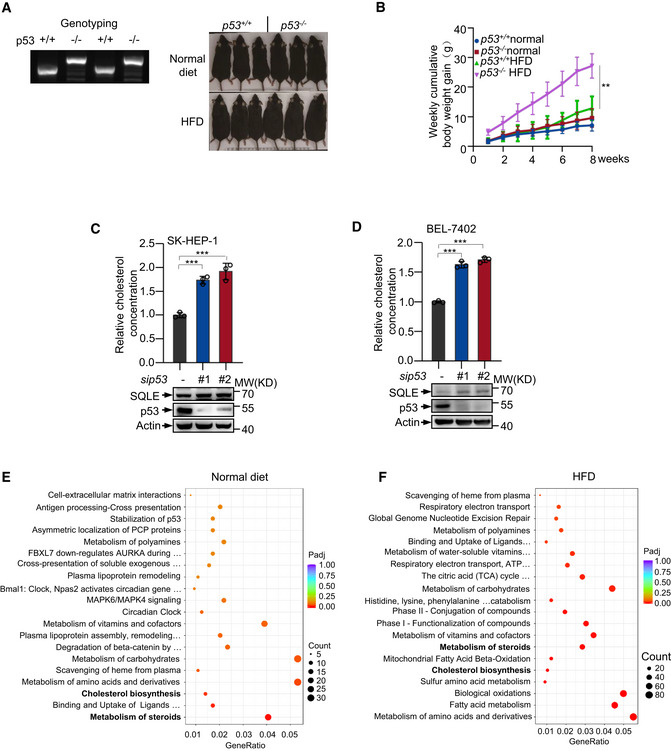
Figure EV1. p53 restricts cholesterol synthesis.
-
Ap53 wild‐type and knockout mice were examined by genotyping. p53 +/+ product size: 281 bp. p53 −/− product size: 441 bp (left). Representative mice photos are shown (right).
-
BWeekly body weight gain of mice is shown.
-
C, DCholesterol concentration of SK‐HEP‐1 (C) and BEL‐7402 (D) cells treated with control or two sets of p53 siRNA for 72 h.
-
E, FDifferential expression genes from RNA‐seq of mice livers from p53 +/+ and p53 −/− mice fed with normal (E) or HFD (F) diet were analyzed by REACTOME Database Enrichment analysis. Dot plots show the 20 most significantly enriched gene biological process. Dot sizes represent counts of enriched differential expressed genes. Dot color scale changes from red to blue, with blue indicating lower adjusted P‐value (Padj) for the category.
Data information: (C, D) Bars represent mean ± s.d., **P < 0.01; ***P < 0.001; (B) n = 6‐8 biologically independent samples; (C, D) n = 3 biologically independent samples; statistical significance was determined by two‐tailed unpaired t‐test.
To investigate the mechanism by which p53 regulates the cholesterol metabolism, we performed RNA‐seq using the liver mice samples in Fig 1A. Reactome pathway enrichment analysis showed different genes could be targeted by p53, and notably, steroids metabolism and cholesterol biosynthesis were significantly enriched under both normal diet and HFD (Fig EV1E and F). Mevalonate pathway is a route to produce sterols in mammalian cells. As shown in Fig 1K, expression of genes in mevalonate pathway mostly increased in p53 −/− mice. Moreover, gene set enrichment analysis of the genome‐wide dataset revealed that p53 expression correlated with decreased gene signature of cholesterol biosynthesis (Fig 1L). These data suggest that p53 may have a role in repressing expression of genes involved in cholesterol biosynthesis.
p53 represses SQLE expression in a SREBP2‐independent manner under normal‐sterol conditions
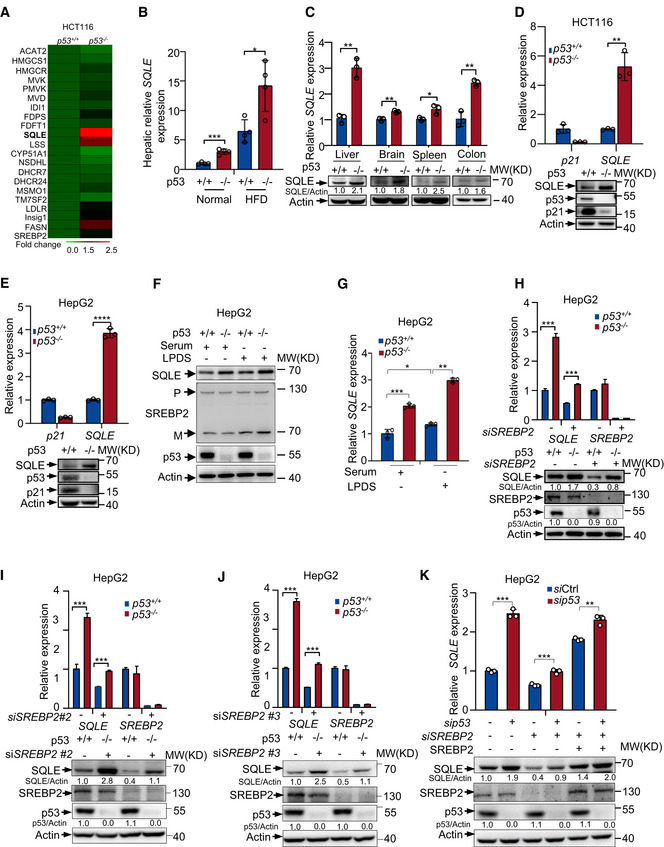
To investigate the mechanism(s) for p53 in regulating cholesterol biosynthesis, we performed RNA‐seq using isogenic p53 +/+ and p53 −/− human colon cancer HCT116 cells. Consistent with previous data, p53 deficiency increased expression of genes in mevalonate pathway. Of note, SQLE expression was vastly augmented in p53 −/− cells (Fig 2A). SQLE is the first monooxygenase and a rate‐limited enzyme in cholesterol synthesis pathway. We next examined how p53 modulates SQLE expression. Hepatic SQLE mRNA levels were markedly higher in p53 −/−mice in comparison to p53 +/+ mice (Fig 2B). We also examined the SQLE expression in various tissues from p53 −/− and p53 +/+ mice. The tissues from p53 −/− mice‐including liver, brain, spleen, and colon had higher levels of SQLE expression, compared with those in the corresponding tissues from p53 +/+ mice (Fig 2C). Similarly, p53 deficiency increased both protein and mRNA levels of SQLE in several cell lines (Figs 2D and E and EV2A–D). These data suggest p53 suppresses SQLE expression.
Figure 2. A SREBP2‐independent mechanism for p53‐mediated SQLE inhibition.
-
AHeat map analysis of 17 sterol biosynthesis genes and 3 other SREBP2 target genes from RNA‐seq data using p53 +/+ and p53 −/− HCT116 cells. Expression levels were normalized to the mean level of each gene among all samples and compared to p53 +/+ cells. Color scale indicates the expression fold change of target gene.
-
BmRNA expression of SQLE in the mouse liver of p53 +/+ and p53 −/− mice with normal or HFD diet.
-
CmRNA and protein levels of SQLE in different tissues of p53 +/+ or p53 −/− mice were determined by qRT–PCR and Western blot respectively.
-
D, ESQLE protein expression and mRNA levels were examined in p53 +/+ and p53 −/−HCT116 cells (D) and HepG2 cells (E). Actin was used as loading control.
-
F, Gp53+/+ and p53 −/− HepG2 cells were cultured for 48 h in medium containing fetal bovine serum (Serum) or lipoprotein‐depleted FBS (LPDS). Protein expression was shown by Western blotting (F). mRNA levels of SQLE were examined by qRT–PCR (G). P, premature SREBP2; M, mature SREBP2.
-
H–JProtein expression and mRNA levels of p53 +/+ and p53 −/− HepG2 cells treated with control siRNA or three separated sets of SREBP2 siRNAs for 72 h as indicated.
-
Kp53+/+ and p53 −/− HepG2 cells were treated with control siRNA or SREBP2 siRNA, followed by ectopically expressed RNA‐resistant SREBP2 for 48 h. mRNA and protein expression were examined by qRT–PCR and Western blotting.
Data information: In (B, C, D, E, G, H, I, J, K), bars represent mean ± s.d., *P < 0.05; **P < 0.01; ***P < 0.001; ****P < 0.0001; for (B), n = 4 biologically independent samples; for (C, D, E, G, H, I, J, K), n = 3 biologically independent samples; statistical significance was determined by two‐tailed unpaired t‐test.
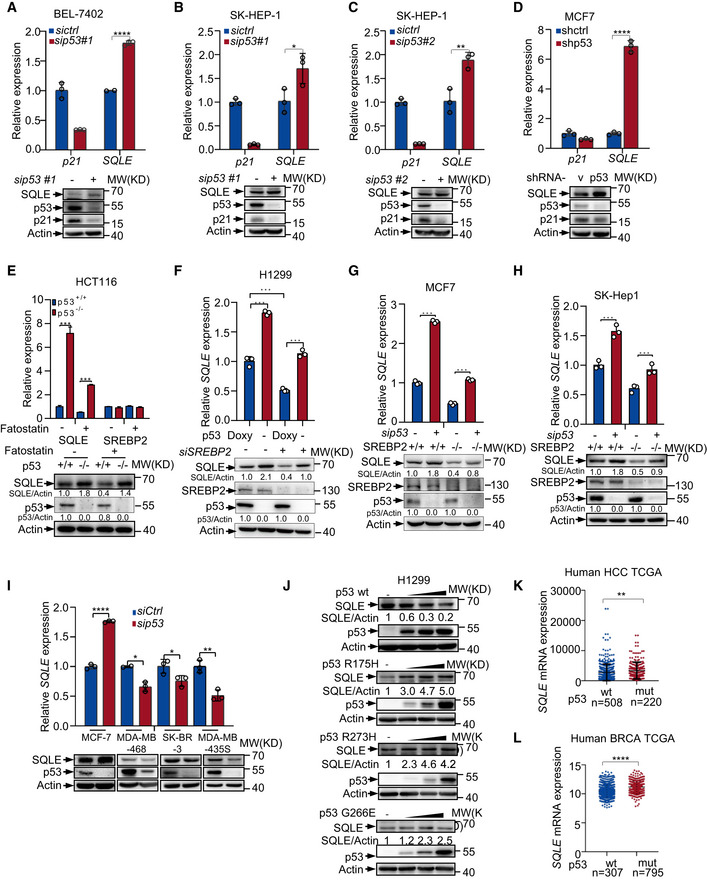
Figure EV2. p53 inhibits SQLE expression.
-
A–CmRNA and protein expression of SQLE in BEL‐7402 (A) and SK‐HEP‐1 (B and C) treated with control or p53 siRNA for 48 h.
-
DSQLE protein expression and mRNA levels in MCF‐7 cells stably expressing control or p53 shRNA.
-
Ep53+/+ and p53 −/− HCT116 cells were treated with Fatostatin (10 μM) for 24 h. mRNA and protein expression were analyzed by qRT–PCR and Western blotting respectively.
-
FH1299 p53‐inducible cells treated with or without doxycycline (1 μg/ml) were transfected with control siRNA or SREBP2 siRNA for 48 h. mRNA and protein expression were examined as indicated.
-
G, HControl and SREBP2 knockout MCF‐7 cells (G) or SK‐HEP‐1 cells (H) using sgRNA CRISPR/Cas9 were treated with control siRNA or p53 siRNA for 48 h. mRNA and protein expression were examined as indicated.
-
ImRNA and protein expression of SQLE and p53 in MCF‐7 (wild‐type p53), MDA‐MB‐468 (mutant p53 R273H), SK‐BR‐3 (mutant p53 R175H), and MDA‐MB‐435s (mutant p53 G266E) cells treated with p53 or control siRNA for 48 h.
-
JH1299 cells were transfected with increasing amounts of control plasmid or plasmid expressing wild‐type (PRK5‐flag p53) or mutant p53 (PRK5‐flag‐p53‐G266E, PRK5‐HA‐p53‐R273H, and PRK5‐HA‐p53‐R175H) for 24 h as indicated. Cell lysates were analyzed by Western blotting. Relative SQLE/actin ratios are shown below. Data represent three independent experiments.
-
KHuman HCC TCGA datasets were analyzed to determine whether tumors bearing wild‐type p53 correlate with lower expression of SQLE. Patients were classified by p53 status (wild‐type versus mutant). SQLE exhibited higher expression levels in p53 mutant (mut, n = 220) HCC tumors compared with wild‐type (n = 508) p53 tumors.
-
LSQLE expression in p53 wild‐type (n = 307) and p53 mutant (mut, n = 795) human breast tumors (BRCA) of the TCGA database.
Data information: (A–I) Bars represent mean ± s.d., *P < 0.05; **P < 0.01; ***P < 0.001; n = 3 biologically independent samples; statistical significance was determined by two‐tailed unpaired t‐test.
To examine whether p53‐mediated SQLE suppression is related to sterol conditions, we cultured p53 +/+ and p53 −/− HepG2 cells in medium containing normal‐sterol fetal bovine serum (Serum) or lipoprotein‐deficient serum (LPDS). As shown in Fig 2F, when cells were cultured in LPDS medium, more precursor SREBP2 (P) was cleaved to active mature form of SREBP2 (M). Consistent with previous findings (Moon et al, 2019), p53 −/− cells showed more active mature form of SREBP2 (M) than p53 +/+ cells, which led to increased SQLE expression under sterol‐depleted conditions (Fig 2F and G), Interestingly, p53 loss also led to increased levels of SQLE when cells were cultured in normal serum medium, but had no effect on SREBP2 maturation (Fig 2F and G). These data indicate there is a SREBP2‐independent mechanism for p53‐mediated SQLE suppression under normal‐sterol conditions.
To evaluate whether SREBP2 is involved in the regulating SQLE by p53 under normal‐sterol conditions, we knocked down SREBP2 using multiple sets of siRNAs. Surprisingly, upregulation of SQLE by p53 deficiency also occurred in SREBP2‐depleted cells (Fig 2H–J). Enforced expression of RNAi‐resistant SREBP2 cDNA in SREBP2‐depleted cells augmented SQLE expression, while p53‐mediated SQLE downregulation still existed in these cells (Fig 2K). Consistent with this, SREBP2 inhibitor fatostatin (Kamisuki et al, 2009) failed to sufficiently block SQLE expression induced by p53 loss, because both SQLE mRNA and protein levels were still higher in p53 −/− cells than those in p53 WT cells (Fig EV2E). Similar results were obtained when we used a p53 Tet‐on expression system in a p53‐null lung cancer cell line H1299. Doxycycline‐induced ectopic p53 expression still reduced SQLE levels even in the absence of SREBP2 (Fig EV2F). Moreover, we generated SREBP2 knockout cells using CRISPR/Cas9 system. Concordant with SREBP2 siRNA data, p53‐mediated inhibition of SQLE expression still exhibited in SREBP2 knockout cells (Fig EV2G and H). These data indicate that p53 represses SQLE expression in a SREBP2‐independent manner under normal‐sterol conditions.
Mutant p53 enhances mevalonate pathway through SREBP2 (Freed‐Pastor et al, 2012). Next, we examined the effect of mutant p53 on SQLE expression using four different breast cancer cell lines which carry wild‐type p53 or mutant p53. Conformably, wild‐type p53 inhibited SQLE expression, whereas mutant p53 increased the expression of SQLE (Fig EV2I). Moreover, we overexpressed exogenous wild‐type or mutant p53 in H1299 cells. Unlike wild‐type p53, mutant p53 failed to suppress SQLE expression but enhanced the expression of SQLE in a dose‐dependent manner (Fig EV2J). To further investigate the clinical relevance between SQLE expression and p53 status, we analyzed a human HCC database and a human BRCA (The Cancer Genome Atlas, TCGA). SQLE expression levels were higher in human carcinomas harboring p53 mutations (mut) than those with wild‐type (wt) p53 (Fig EV2K and L). These findings support that wild‐type p53 inhibits SQLE expression, while cancer‐derived p53 mutants upregulate SQLE expression.
SQLE is a transcriptional target of p53
Under lower‐sterol conditions, SREBP2 is responsible for p53‐mediated suppression of mevalonate pathway (Moon et al, 2019). Thus, we wanted to know how p53 inhibits SQLE expression under normal‐sterol conditions. To investigate whether the transcriptional activity of p53 was required to p53 mediate SQLE suppression, we used an inhibitor of p53 transcriptional activity, pifithrin‐α (PFTα) (Komarov et al, 1999). PFTα restored p53‐inhibited SQLE expression. As a control, p53‐induced expression of p21 was inhibited by PFTα (Fig EV3A). The mutant p53 (R175H) that lost DNA binding ability failed to repress SQLE expression (Fig EV3B). These data indicate p53 requires transcriptional activity to repress SQLE. Next, we examined whether SQLE is a transcriptional target of p53. We analyzed the human SQLE gene sequence for potential p53 response elements (Riley et al, 2008). We identified two putative p53 response elements (RE1 and RE2) in the first intron of human SQLE gene (Fig 3A). Chromatin immunoprecipitation assays in HCT116 cells revealed that p53 bound to the genomic region of RE2, but not RE1 (Fig 3B). Moreover, PFTα reduced the amount of p53 bound to SQLE‐RE2 as well as p21‐RE (Fig EV3C). To determine if SREBP2 is also involved in p53‐mediated SQLE inhibition, we knocked down SREBP2 expression using siRNA. SREBP2 depletion had no effect on the recruitment of p53 to SQLE genomic region RE2 (Fig 3C). Similar result was obtained in SREBP2 knockout cells using CRISPR/Cas9 system (Fig 3D). Furthermore, to investigate whether p53 directly binds to SQLE genomic region RE2, we performed EMSA assay. A specific band was observed in RE2, but not RE2 mut in the presence of nuclear extracts. Super‐shift band with anti‐p53 antibodies identified p53 as the protein present in the EMSA band (Fig 3E). Taken together, these results demonstrate that p53 directly binds to the genomic region RE2.
Figure EV3. Murine p53 transcriptionally regulates mouse SQLE.
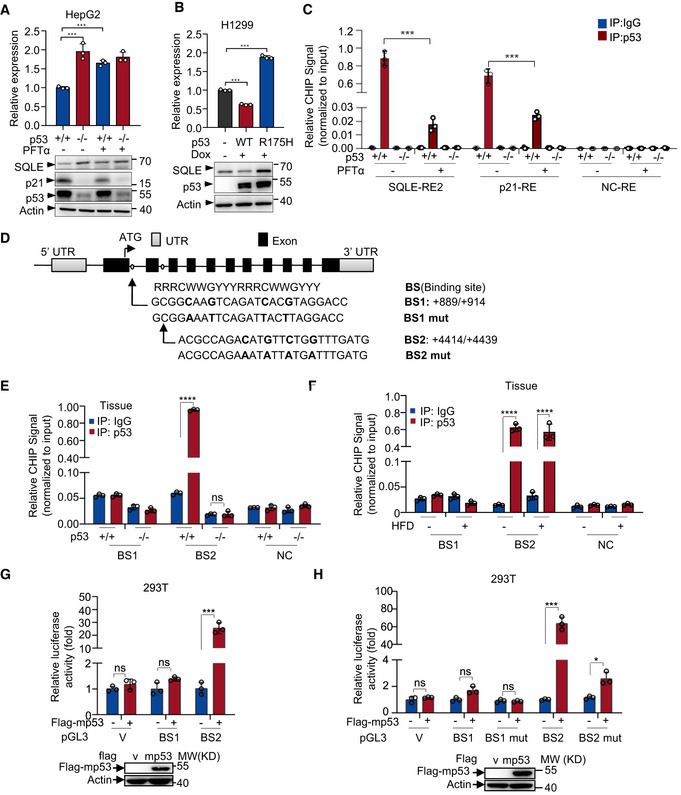
- p53+/+ and p53 −/− HepG2 cells were treated with PFTα (20 μM) for 24 h. mRNA and protein expression were analyzed by qRT–PCR and Western blotting respectively.
- mRNA and protein expression of H1299 p53‐inducible cells (wild‐type versus R175H mutant) treated with or without doxycycline (1 μg/ml).
- p53+/+ and p53 −/− HepG2 cells treated with or without PFTα (20 μM) for 24 h were analyzed by chromatin immunoprecipitation (ChIP) assay using normal IgG and anti‐p53 antibody as indicated.
- Schematic representation of mouse SQLE genomic structure. Shown are the exon/intron organization and two potential p53 binding sites (BS1 and BS2) and the corresponding mutant binding sites.
- p53+/+ and p53 −/− mice livers were analyzed by ChIP assay using normal IgG and anti‐p53 antibody.
- p53+/+ mice livers from Normal or HFD mice were analyzed by ChIP assay using normal IgG and anti‐p53 antibody.
- Luciferase reporter constructs containing mouse SQLE potential binding sites BS1 and BS2 were transfected into HEK293T cells together with control or mouse p53 expression vector for 48 h. Renilla vector pRL‐CMV was used as a transfection internal control. Relative levels of luciferase are shown. Protein expression is shown.
- Luciferase reporter constructs containing mouse SQLE potential binding sites BS1, BS2, and their corresponding mutant binding sites (BS1 mut and BS2 mut) were transfected into HEK293T cells together with control or mouse p53 expression vector for 48 h. Renilla vector pRL‐CMV was used as a transfection internal control. Relative levels of luciferase are shown. Protein expression is shown.
Data information: (A, B, C, E, F, G, H) Bars represent mean ± s.d., *P < 0.05; ***P < 0.001; ****P < 0.0001; n = 3 biologically independent samples; statistical significance was determined by two‐tailed unpaired t‐test.
Figure 3. SQLE is a transcriptional target of p53.
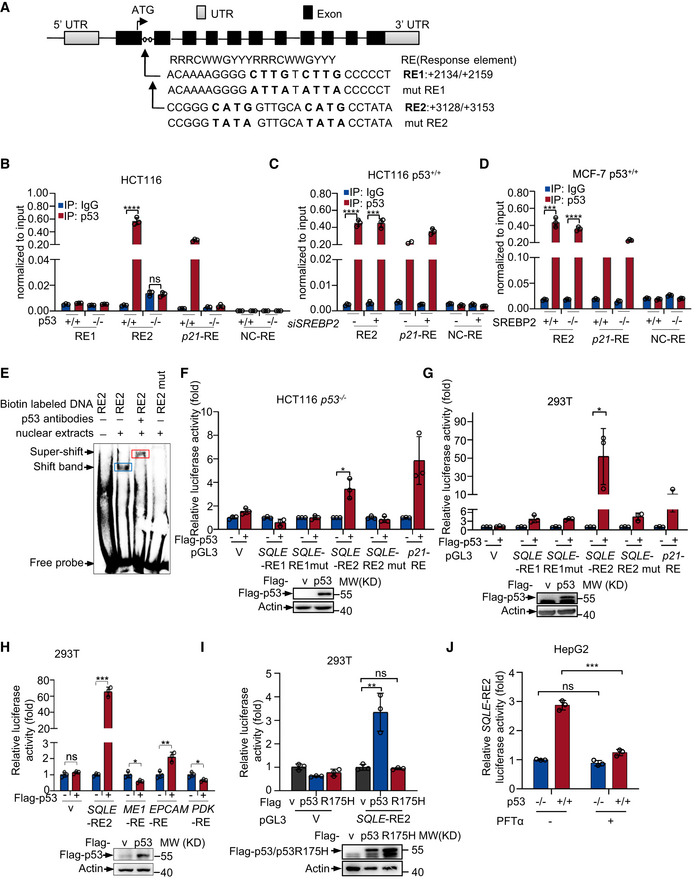
- Schematic representation of human SQLE genomic structure. Shown are the exon/intron organization and two potential p53 response elements (RE1 and RE2) and the corresponding mutant response elements.
- p53+/+ and p53 −/− HCT116 cells were analyzed by chromatin immunoprecipitation (ChIP) assay using normal IgG and anti‐p53 antibody as indicated.
- p53+/+ HCT116 cells transfected with control siRNA or SREBP2 siRNA for 72 h were analyzed by ChIP assay with the indicated antibodies.
- Control and SREBP2 knockout MCF‐7 cells using sgRNA CRISPR/Cas9 were analyzed by ChIP assay using anti‐p53 or normal mouse IgG antibodies.
- The electrophoretic mobility shift assay (EMSA) of SQLE‐RE2 or RE2 mut in the presence or absence of p53 antibodies as indicated. Blue box (shift band) means the binding between nuclear extracts and RE2, red box (super‐shift band) means p53 as the protein presented in the EMSA band.
- Luciferase reporter constructs containing RE1, RE2, RE1mut, or RE2mut were transfected into p53 −/− HCT116 cells together with control (PRK5‐flag vector) or p53 expression vector (PRK5‐flag p53) for 48 h. Renilla vector pRL‐CMV was used as a transfection internal control. Relative levels of luciferase are shown. Data represent three independent experiments. Protein expression is shown.
- Luciferase reporter constructs containing RE1, RE2, RE1mut, or RE2mut were transfected into HEK293T cells together with control (PRK5‐flag vector) or p53 expression vector (PRK5‐flag p53) for 48 h. Renilla vector pRL‐CMV was used as a transfection internal control. Relative levels of luciferase are shown. Protein expression is shown.
- Luciferase reporter constructs containing RE2 were transfected into HEK293T cells together with control, wild‐type p53, or p53 R175H expression vector for 48 h. Renilla vector pRL‐CMV was used as a transfection internal control. Relative levels of luciferase are shown.
- Luciferase reporter assay with indicated response element constructs in human HEK293T cells co‐transfected with or without p53 expression vector.
- Luciferase reporter constructs containing RE2 were transfected into HEK293T cells treated with or without 20 μm PFTα for 24 h. Renilla vector pRL‐CMV was used as a transfection internal control. Relative levels of luciferase are shown.
Data information: In (B, C, D, F, G, H, I, J), bars represent mean ± s.d., *P < 0.05; **P < 0.01; ***P < 0.001; ****P < 0.0001; n = 3 biologically independent samples; statistical significance was determined by two‐tailed unpaired t‐test.
In reporter assays, only SQLE response element 2 (RE2) induced luciferase expression in response to p53 overexpression both in HCT116 (p53 −/−) cells and 293T cells, whereas mutant response element (RE2 mut) reversed it (Fig 3F and G). Luciferase expression driven by genomic regions of p53‐suppressive target genes could be either repressed (for example, ME1 (Jiang et al, 2013) and PDK2 (Contractor & Harris, 2012) response elements) or promoted (for example, EPCAM (Sankpal et al, 2009) response element) by p53. To confirm this, we performed luciferase assay using the genomic p53 response elements of ME1, EPCAM, or PDK genes, of which all are p53‐suppressive target genes. Similar to the EPCAM response element, SQLE response element (RE2) increased luciferase expression in response to p53 (Fig 3H). This may be due to an unknown enhancer element is involved in p53‐mediated SQLE inhibition. However, the tumor‐associated p53 mutant (p53R175H) which lost the transcriptional activity failed to active SQLE‐RE2 luciferase expression (Fig 3I). Moreover, PFTα, which impeded p53 transcriptional activity, abolished p53‐induced SQLE‐RE2 luciferase expression (Fig 3J). These results indicate that p53‐induced SQLE‐RE2 luciferase expression is dependent on p53 transcriptional activity. Together with previous EMSA and ChIP data, these results suggest that SQLE is a p53 transcriptional target.
Next, we analyzed the mouse SQLE gene sequences and identified two putative p53 response elements (BS1 and BS2) (Fig EV3D). Chromatin immunoprecipitation assay using liver tissues from p53 WT and KO mice revealed that murine p53 bound to BS2, but not BS1 (Fig EV3E). And a high‐fat diet was unable to increase the amount of p53 bound to BS2 (Fig EV3F). In keeping with this, p53 activated the luciferase gene expression driven by the genomic fragment containing BS2, but not BS1 (Fig EV3G), whereas mutant response element (BS2 mut) reversed it (Fig EV3H). These data suggest that the function of p53 transcriptionally regulates SQLE gene also exists in mouse.
p53 inhibits cholesterol metabolism through SQLE
SQLE catalyzes a rate‐limiting reaction converting squalene to 2,3(S)‐monooxidosqualene (MOS) in cholesterol biosynthesis. We next investigated the effect of p53‐SQLE axis on cholesterol biosynthesis. Metabolomics analysis revealed that p53 deficiency led to a decrease in squalene levels, correlating with increased expression of SQLE (Fig 4A). Notably, silencing of SQLE resulted in squalene accumulation and minimalized the difference between p53 +/+ and p53 −/− cells (Fig 4A). Concordance with previously published work (Moon et al, 2019), we observed a marked increase in lanosterol levels in p53 −/− cells compared to parental (p53 +/+) cells. SQLE knockdown partially reversed it (Fig 4B). Consistently, cholesterol levels increased in p53 −/− cells compared to p53 +/+ cells. This increase was partially but significantly reversed by SQLE silencing (Fig 4C). Similar results were observed in HCT116 cells (Fig 4D). Next, we treated cells with terbinafine, a pharmacological inhibitor of SQLE (Abdel‐Rahman & Nahata, 1997; Nowosielski et al, 2011). Terbinafine suppressed cholesterol accumulation in both p53 +/+ and p53 −/− HCT16 cells and HepG2 cells, with a more profound effect on p53 −/− cells (Fig 4E and F). Furthermore, knocking down of SQLE also decreased cellular triglyceride concentration in p53‐depleted cells (Fig 4G and H). These results indicate that p53 represses cholesterol accumulation at least partially through SQLE.
Figure 4. p53 inhibits cholesterol metabolism through SQLE.
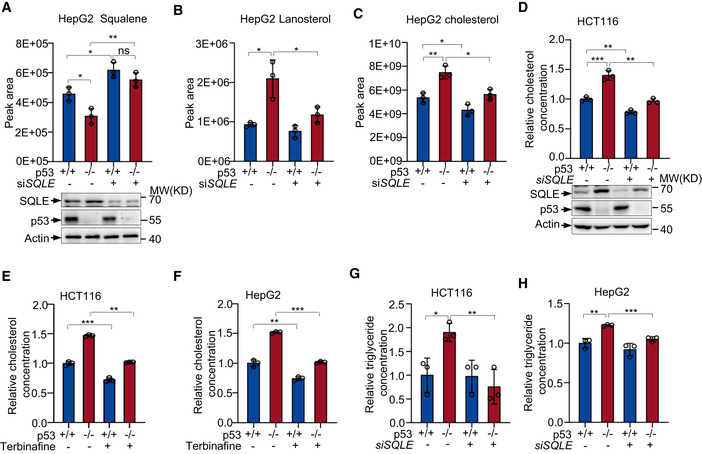
-
A–CSqualene (A), lanosterol (B), and cholesterol (C) abundance in p53 +/+ and p53 −/− HepG2 cells transfected with control or SQLE siRNA for 48 h were determined via ultra‐high pressure liquid chromatography coupled to mass spectrometry (UHPLC‐MS). Protein levels were analyzed by Western blotting with specific antibodies (A bottom panel).
-
Dp53+/+ and p53−/− HCT116 cells were transfected with control or SQLE siRNA for 48 h as indicated. Relative cholesterol concentrations were examined as described in methods. Protein expression was determined by Western blot.
-
E, FCholesterol levels of HCT116 cells (E) and HepG2 cells (F) treated with or without 30 μm terbinafine for 72 h.
-
G, HTriglyceride levels in p53 +/+ and p53 −/− HCT116 cells (G) and HepG2 cells (H) treated with SQLE siRNA or control siRNA for 48 h.
Data information: (A–H), bars represent mean ± s.d., *P < 0.05; **P < 0.01; ***P < 0.001; n = 3 biologically independent samples; statistical significance was determined by two‐tailed unpaired t‐test.
SQLE supports tumor growth through cholesterol biosynthesis
To evaluate the role of SQLE in tumor, we first examined SQLE expression in 13 paired HCC tumors and adjacent normal tissues. SQLE protein levels markedly increased in HCC tissues (Fig 5A). In addition, we analyzed mRNA expression of SQLE in HCC using two different public gene expression databases (TCGA and Oncomine). SQLE expression increased in HCC compared with adjacent normal tissues (Figs 5B and EV4A left panel). Furthermore, SQLE expression was also augmented in human colon cancer, breast cancers, and esophagus cancers (Figs 5C and EV4A right panel and EV4B). To examine whether tumor growth benefited from highly expressing of SQLE, we stably overexpressed SQLE in HepG2 and MCF‐7 cells. Overexpression of SQLE enhanced cell proliferation and colony formation (Figs 5D and E, and EV4C). Coordinately, stably expressing SQLE raised cholesterol accumulation (Figs 5F and EV4D). To further determine the role of cholesterol in SQLE‐mediated cell growth, we cultured p53 +/+ HepG2 cells in medium containing lipoprotein‐deficient serum (LPDS) with or without supplemental exogenous cholesterol. Importantly, cholesterol addition reversed the decreased cell growth induced by SQLE depletion (Fig 5G). Simultaneously, cholesterol supplementation increased cellular cholesterol levels (Fig 5H). Similar results were also observed in p53 +/+ HCT116 cells and SK‐HEP‐1 cells (Figs 5I and EV4E). Moreover, to exclude the off‐target effect of SQLE siRNA, we performed rescue experiments using RNAi‐resistant SQLE cDNA. Enforced expression of RNAi‐resistant SQLE restored the SQLE expression in siRNA‐treated cells, also increased cellular cholesterol levels and cell proliferation (Fig 5J–M). Taken together, these results suggest SQLE promotes cell proliferation through stimulating cholesterol synthesis.
Figure 5. SQLE supports tumor growth through cholesterol.
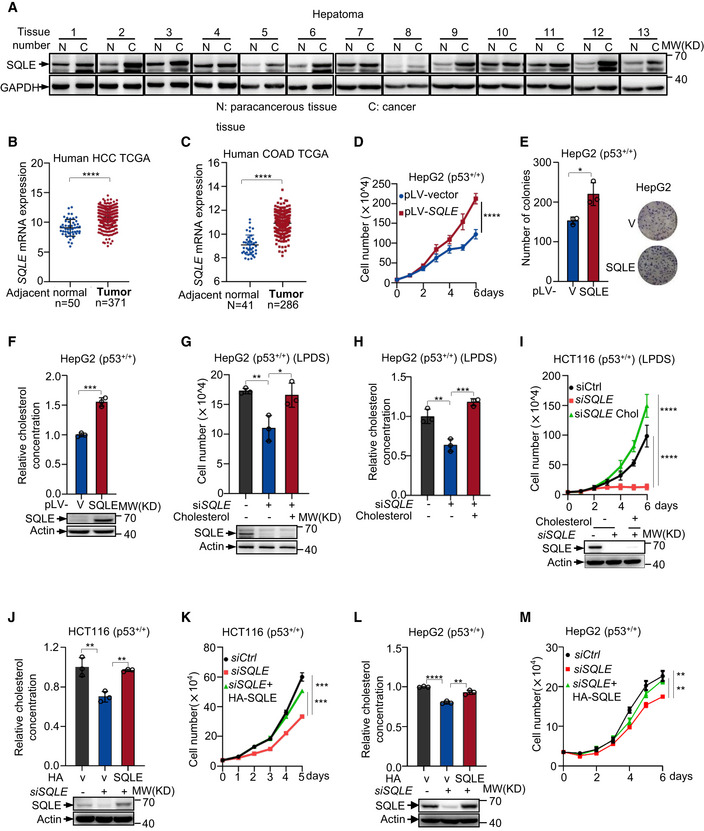
-
AProtein expression of SQLE in human liver tumors (C) and non‐cancerous adjacent tissue (N) were analyzed by Western blotting.
-
BSQLE gene expression in HCC and adjacent normal tissue was analyzed in TCGA liver hepatocellular carcinoma (normal [n = 50] versus tumors [n = 371]).
-
CSQLE gene expression in COAD and adjacent normal tissue was analyzed in TCGA colon cancer (normal [n = 41] versus tumors [n = 286]).
-
D–Fp53+/+ HepG2 cells were stably overexpressed SQLE or vector control. Cell proliferation (D), number of colonies (E), and cholesterol concentration (F) are shown, respectively. Protein expression was analyzed using Western blotting (F bottom panel).
-
G, Hp53+/+ HepG2 cells transfected with control siRNA or SQLE siRNA were cultured in LPDS medium containing 5 μg cholesterol for six days as indicated. Cell number (G) and cholesterol concentration (H) were determined. Protein expression was analyzed by Western blotting after siRNA transfection 48 h (G bottom panel).
-
Ip53+/+ HCT116 cells transfected with control siRNA or SQLE siRNA for 48 h and then cells were cultured in LPDS medium containing 5 μg cholesterol for 6 days as indicated. Cell proliferation is shown. Protein expression was analyzed by Western blotting after siRNA transfection 48 h (bottom panel).
-
J–Mp53+/+ HCT116 cells (J and K) and p53 +/+ HepG2 cells (L and M) were transfected with SQLE siRNA or control siRNA in the presence or absence of exogenous SQLE cDNA for 48 h. Cholesterol concentration (upper panel) and protein expression (bottom panel) were determined (J and L). Cell proliferation is shown (K and M).
Data information: (B, C, D‐M), bars represent mean ± s.d., *P < 0.05; **P < 0.01; ***P < 0.001; ****P < 0.0001; n = 3 biologically independent samples; statistical significance was determined by two‐tailed unpaired t‐test.
Figure EV4. SQLE is critical for tumor cell growth.
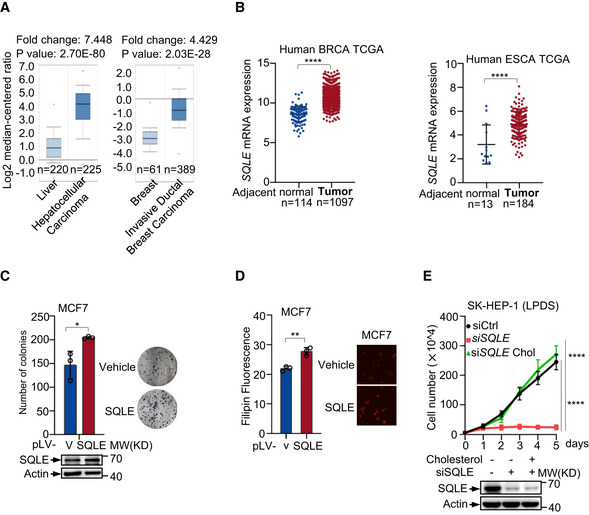
- Box plot comparing SQLE transcript levels in hepatocellular carcinoma, invasive ductal breast carcinoma, and their normal counterparts. The graphs were derived from ONCOMINE database. The differential expression data are centered on the median of expression levels and plotted on a log2 scale. Whiskers indicate minimum and maximum data values that are not outliers. The P value was calculated using a two‐sample t‐test. The number of samples (n) in each class is shown in below.
- SQLE gene expression in breast cancer (BRCA) and esophageal cancer (ESCA) were compared with adjacent normal tissue. Data were derived from TCGA‐Breast cancer and TCGA‐Esophageal cancer. Number of each sample (n, biological replicates) is shown. Bars represent mean ± s.d.
- Colony formation assay of MCF‐7 cells stably overexpressing SQLE (pLV‐SQLE) or control vector (pLV‐v) as indicated (left). Representative images of stained colonies were shown (right). Protein expressions are shown by Western blotting.
- Cholesterol concentrations of stably overexpressing SQLE or control vector MCF‐7 cells were determined by Filipin III staining.
- SK‐HEP‐1 cells transfected with control or SQLE siRNA were cultured in LPDS medium containing 5 μg cholesterol as indicated. Cell proliferation is shown. Protein expression was analyzed after transfection 48 h.
Data information: (C, D, E) Bars represent mean ± s.d., *P < 0.05; **P < 0.01; ****P < 0.0001; n = 3 biologically independent samples; statistical significance was determined by two‐tailed unpaired t‐test.
SQLE and cholesterol are essential for tumor cell proliferation
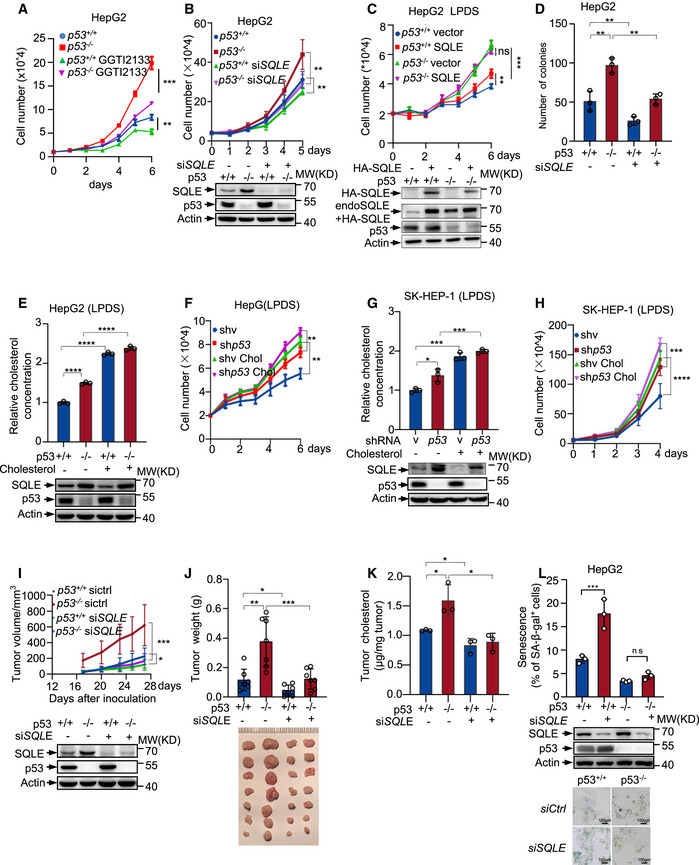
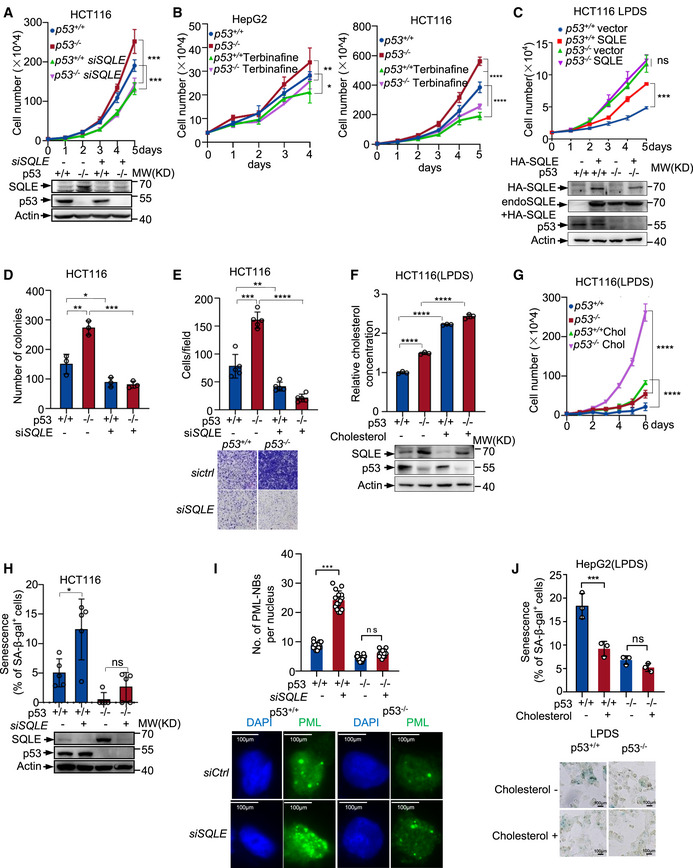
As a branch of the cholesterol synthesis pathway, geranylgeranylation of proteins is required for maintaining the stemness of breast cancer cells (Freed‐Pastor et al, 2012). To evaluate whether the effect of p53 on cell proliferation is linked to increased geranylation of proteins, we treated cells with geranylgeranyl transferase inhibitor GGTI‐2133. As shown in the Fig 6A, GGTI‐2133 treatment decreased cell proliferation in both p53+/+ and p53 −/− cells and diminished the difference between these two cell lines. These data suggest that the effect of p53 on cell growth is partially dependent on geranylation of proteins. We next assessed the role of SQLE in p53‐mediated cell growth inhibition. Depletion of SQLE using siRNA reduced the growth rate and minimized the difference between p53 +/+ and p53 −/− cells (Figs 6B and EV5A). Similar results were obtained when the cells were treated with terbinafine (Fig EV5B). Conversely, overexpression of SQLE increased p53 +/+ cell proliferation, but had minimal effect on p53 −/− cells when the cells were cultured in LPDS medium, which may be due to higher levels of endogenous SQLE in p53 −/− cells compared to p53 +/+ cells (Figs 6C and EV5C). Consistently, knockdown of SQLE led to a reduction in number of colonies, particularly when p53 was depleted (Figs 6D and EV5D). Moreover, knockdown of SQLE inhibited cell migration, especially in p53 knockout cells (Fig EV5E). These data indicate that SQLE plays an important role in p53‐mediated inhibition of cell proliferation.
Figure 6. p53 suppresses cell growth through SQLE and cholesterol.
-
ACell proliferation of p53 +/+ and p53 −/− HepG2 cells treated with DMSO or GGTI‐2133 (1 μm).
-
BProliferation of p53 +/+ and p53 −/− HepG2 cells treated with control or SQLE siRNA. Protein expression was examined after transfection 48 h.
-
CGrowth of p53 +/+ and p53 −/− HepG2 cells transfected with and without exogenous SQLE (HA‐SQLE) in LPDS medium. Protein expression is assayed after transfection 24 h.
-
DColonies number of p53 +/+ and p53 −/− HepG2 cells expressing control or SQLE siRNA. A number of colonies with a diameter greater than 10 μm were quantified.
-
E, FCholesterol concentration, protein expression (E), and cell proliferation (F) of p53 +/+ and p53 −/− HepG2 cells in LPDS medium containing with or without 5 μg cholesterol.
-
G, HCholesterol levels, protein expression (G), and cell growth (H) of SK‐HEP‐1 cells stably expressing control shRNA or p53 shRNA in LPDS medium in presence or absence of 5 μg cholesterol.
-
I–Kp53+/+ and p53 −/− HCT116 cells transfected with control or SQLE siRNA for 48 h were injected into nude mice separately. (I) Tumor volume was recorded after inoculation (top). Western blot was performed using lysates of xenograft tumors (bottom). (J) Average tumor weights (top) and images (bottom) of xenograft tumors (3 weeks, means ± s.d., n = 7) are shown. (K) Cholesterol concentrations of xenograft tumors were examined.
-
LPercentage of SA‐β‐gal‐positive cells of p53 +/+ and p53 −/− HepG2 cells expressing SQLE siRNA or control siRNA (upper panel). Protein expression (middle panel) and representative images (lower panel) are shown. Scale bar, 100 μm.
Data information: (A‐H, I, J, K, L), bars represent mean ± s.d., *P < 0.05; **P < 0.01; ***P < 0.001; ****P < 0.0001; (A‐H, K, L), n = 3 biological replicates; (J), n = 7 biological replicates; statistical significance was determined by two‐tailed unpaired t‐test.
Figure EV5. p53 modulates tumor cell growth through SQLE and cholesterol.
-
AProliferation of p53 +/+ and p53 −/− HCT116 cells treated with control or SQLE siRNA. Protein expression was examined after transfection 48 h.
-
BGrowth of p53 +/+ and p53 −/− HepG2 cells (left panel) and HCT116 cells (right panel) treated with DMSO or 30 μm Terbinafine.
-
CGrowth of p53 +/+ and p53 −/− HCT116 cells transfected with or without exogenous SQLE (HA‐SQLE) in the LPDS medium. Protein expression is shown.
-
DColonies number of p53 +/+ and p53 −/− HCT116 cells expressing control or SQLE siRNA. A number of colonies with a diameter greater than 10 μm were quantified.
-
ECell migration of p53 +/+ and p53 −/− HCT116 cells expressing control or SQLE siRNA for 48 h.
-
F, GCholesterol concentration, protein expression (F), and cell proliferation (G) of p53 +/+ and p53 −/− HCT116 cells in LPDS medium in presence or absence of 5 μg cholesterol.
-
HPercentage of senescence‐associated β‐galactosidase (SA‐β‐gal)‐positive cells of p53 +/+ and p53 −/− HCT116 cells expressing control or SQLE siRNA for 48 h. Protein expression is shown below.
-
INumbers of Promyelocytic leukemia nuclear bodies (PML‐NBs) in p53 +/+ and p53 −/− HepG2 cells treated with control or SQLE siRNA for 48 h (top). Representative images are shown (bottom). Scale bar, 100 μm.
-
JPercentage of SA‐β‐gal‐positive cells of p53 +/+ and p53 −/− HepG2 cells cultured in LPDS medium in the presence or absence of cholesterol (top). Representative images are shown (bottom). Scale bar, 100 μm.
Data information: (A–J) Bars represent mean ± s.d., *P < 0.05; **P < 0.01; ***P < 0.001; ****P < 0.0001; (A–D, F, G, I, J) n = 3 biologically independent samples; (E, H) n = 5 biologically independent samples; statistical significance was determined by two‐tailed unpaired t‐test.
Furthermore, when cells were cultured in LPDS medium, supplementation of cholesterol increased cellular cholesterol concentration (Figs 6E and G and EV5F) and correspondingly enhanced proliferation of both p53 +/+ and p53 −/− cells (Figs 6F and H and EV5G). To evaluate the role of SQLE in tumor formation, we injected immuno‐compromised mice with p53 +/+ and p53 −/− HCT116 cells expressing SQLE siRNA or control siRNA. SQLE depletion suppressed the tumor growth in terms of both tumor size and tumor weight, particularly for p53 −/− cells generated tumors (Fig 6I and J). Consistent with the above‐mentioned findings, p53 −/− HCT116 tumors had higher cholesterol concentration compared to the p53 +/+ HCT116 tumors, and the cholesterol levels decreased in SQLE‐depleted tumors (Fig 6K). Together, these data suggest that p53 inhibits cell growth and reduces cholesterol synthesis at least partially through repressing SQLE.
Moreover, p53 is important for senescence induction and maintenance (Ben‐Porath & Weinberg, 2005; Vousden & Prives, 2009), we next evaluated the role of SQLE in p53‐induced cell senescence. Knockdown of SQLE increased the number of senescent cells associated β‐galactosidase in p53 wild‐type cells (Figs 6L and EV5H). The induction of senescence in SQLE knockdown cells was also indicated by the marked accumulation of the promyelocytic leukemia protein nuclear bodies (PML‐NBs) (Ferbeyre et al, 2000; Pearson et al, 2000) (Fig EV5I). Notably, supplementation with cholesterol decreased p53‐induced senescence when cells were cultured in LPDS medium (Fig EV5J). In p53‐deficient cells, senescence decreased markedly and SQLE depletion lost its ability to induce this phenotype (Figs 6L and EV5H and I). Similarly, cholesterol addition failed to reduce senescence in p53 knockout cells (Fig EV5J). These data indicate that the effect of SQLE and cholesterol on cell senescence is dependent on p53.
Terbinafine inhibits HFD‐induced lipid accumulation and NAFLD‐liver cancer growth in p53 knockout mice
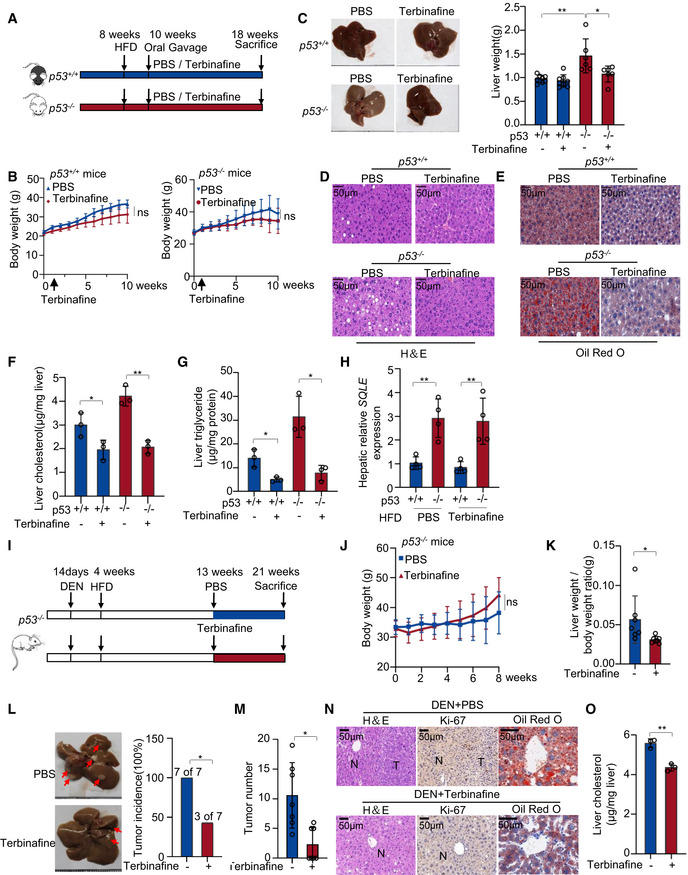
To determine the function of SQLE in HFD‐induced fat liver disease and cholesterol synthesis, we used terbinafine to inhibit SQLE in vivo. 8‐week‐old p53 +/+ and p53 −/− mice were fed with HFD. Starting at the age of 10 weeks, each genotype mice were divided into two groups which were treated with PBS or terbinafine respectively (Fig 7A). We assessed the mice's weight every week and observed terbinafine had no effect on mice body weight (Fig 7B). Mice were sacrificed at the age of 18 weeks, and the livers were analyzed. We found that terbinafine inhibited fat liver formation and decreased liver weight only in p53 −/− mice (Fig 7C). H&E staining of livers showed that terbinafine reduced the hepatic lipid accumulation in both p53 +/+ and p53 −/− mice (Fig 7D). These data were also confirmed by oil red O staining (Fig 7E). Furthermore, hepatic cholesterol accumulation and triglyceride levels were decreased with terbinafine treatment (Fig 7F and G). Consistently, p53 −/− liver tissues exhibited higher expression of SQLE (Fig 7H). Taken together, these data indicate SQLE plays a critical role in cholesterol accumulation and fat liver disease mediated by p53 loss.
Figure 7. Terbinafine inhibits HFD‐induced lipid accumulation and liver cancer growth in p53 knockout mice.
-
A–H(A) Experimental design for the mouse model in Fig 7 (A‐H). p53 +/+ and p53 −/− C57BL/6N male mice (p53 +/+ mice n = 8;p53 −/− mice n = 6) were fed with HFD diet for 10 weeks and were administered PBS or terbinafine (80 mg/kg) every day for 8 weeks. (B) Mice body weight of p53 +/+ (left) and p53 −/− (right) mice. (C) Representative liver photos of mice (left), changes in liver weight (right), H&E staining (D), and oil red staining (E) of liver tissues are shown, respectively. Total liver cholesterol concentrations (F) and triglyceride levels (G) of each group were examined. (H) SQLE mRNA expression of mice liver tissues by qRT–PCR.
-
I–O(I) Experimental design for the mouse model in Fig 7I–O. p53 −/− C57BL/6N male mice (n = 7) were injected with a single dose of diethylnitrosamine (DEN) (25 mg/kg) at 2 weeks and then fed with HFD diet at 4 weeks. Oral administration of terbinafine was given at 13 weeks old as indicated. Body weight (J) and liver/body weight ratio (K) of mice are shown. Shown are liver tumor incidence (L) and tumor numbers (M). (N) H&E (left), Ki‐67 (middle) and oil red O (right) staining of livers of mice. (O) Total liver cholesterol concentrations of mice were examined.
Data information: (B, C, F, G, H, K, L, M, O), Bars represent mean ± s.d., ns, not significant; *P < 0.05; **P < 0.01; (B, C), p53 +/+ mice (n = 8), p53 −/− mice (n‐6) biological replicates; (F, G, H, O), n = 3 biologically independent samples; (J, K, L, M), n = 7 biologically independent samples; statistical significance was determined by two‐tailed unpaired t‐test.
Next, we evaluated whether the upregulation of SQLE was required for p53 loss‐induced NAFLD‐HCC tumorigenesis. We injected p53 −/− mice with a single dose of diethylnitrosamine (DEN) at 14 days. 4‐week‐old mice were fed with HFD. Starting at the age of 13 weeks, mice were divided into two groups treated with PBS or terbinafine orally everyday (Fig 7I). Mice were sacrificed at the age of 21 weeks. Terbinafine treatment had no effect on mice body weight, while reduced liver/body weight ratio of the mice (Fig 7J and K). Importantly, terbinafine reduced liver tumor incidence [three of seven mice in terbinafine group versus seven of seven mice in PBS group; P < 0.05; Fig 7L] and tumor numbers (P < 0.01; Fig 7M). H&E and Ki‐67 staining of livers also confirmed a reduction in HCC tumorigenesis and cell proliferation by terbinafine (Fig 7N). Oli red O staining also showed that terbinafine reduced hepatic lipid levels (Fig 7N). In parallel, terbinafine decreased hepatic cholesterol accumulation (Fig 7O). Collectively, these data suggest that terbinafine inhibits the accumulation of hepatic cholesterol and the formation of NAFLD‐HCC tumors caused by p53 deficiency through inhibition of SQLE.
SQLE is critical for liver tumor development caused by p53 loss
We further investigated whether SQLE was required for p53 loss‐induced hepatic tumorigenesis by injecting p53 liver‐specific knockout mice (Alb‐cre p53 fl/fl) and control mice (p53 fl/fl) maintained on HFD from 4 weeks with a single dose of diethylnitrosamine (DEN) (Fig 8A). Starting at the age of 13 weeks, each genotype of mice was divided into two groups injected with AAV8 particles carrying control shRNA (shCtrl) or SQLE shRNA (shSQLE) (Fig 8A). Mice were sacrificed at the age of 25 weeks. Significantly, inhibition of SQLE reversed the increased liver weight caused by p53 loss (Fig 8B) and reduced tumor formation, particularly in p53 knockout mice (Fig 8C). Ki‐67 and H&E staining of livers displayed a reduction in cell proliferation and HCC tumorigenesis by SQLE knocking down (Fig 8D and E). Consistent with these, a decrease in hepatic lipid accumulation in SQLE‐depleted mice visualized by oil red O staining was found, particularly when p53 was knocked out (Fig 8E). Similar results were obtained when we examined the hepatic triglyceride levels (Fig 8F). Moreover, SQLE suppression also decreased hepatic cholesterol levels, especially in p53 knockout mice (Fig 8G). These data suggest that SQLE is important for the liver tumor development caused by p53 loss.
Figure 8. SQLE knockdown restricts liver tumor initiation by p53 loss.
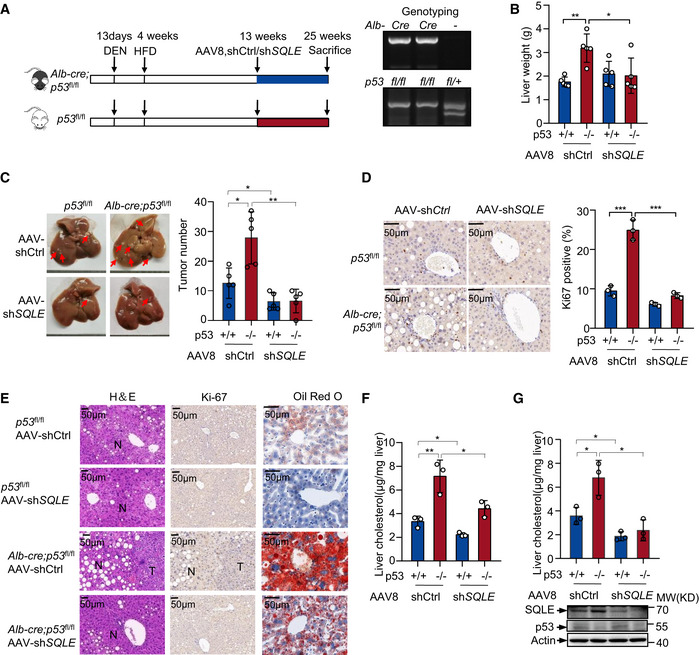
-
AExperimental design for the mouse model in Fig 8. Control mice (p53flx/flx ) and liver‐specific Alb‐Cre p53 knockout mice (Alb‐cre p53flx/flx ) (n = 5) were injected with a single dose of DEN at 13 days and then fed with HFD diet at 4 weeks. A tail vein injection of an associate adenovirus serotype 8(AAV8) expressing either control or SQLE shRNA at 13 weeks as indicated. p53flx/flx and Alb‐cre mice were examined by genotyping (right panel). p53 flx/flx product size: 370 bp. p53 +/+ product size: 288 bp. Alb‐cre product size: 385 bp.
-
B–DLiver weight (B), representative liver photos (C, left), liver tumor numbers (C, right), representative images (D, left) and quantification (D, right) of Ki‐67 staining are shown. Red arrows indicate the tumors in the liver (C).
-
EH&E (left), Ki‐67 (middle) and oil red O (right) staining of livers of mice.
-
FTotal liver triglyceride concentrations of mice were examined.
-
GTotal liver cholesterol concentrations of mice were examined. Protein levels are shown (bottom).
Data information: (B, C, D, F, G), Bars represent mean ± s.d., *P < 0.05; **P < 0.01; ***P < 0.001; (B, C), n = 5 biologically independent samples; (D, F, G), n = 3 biologically independent samples; statistical significance was determined by two‐tailed unpaired t‐test.
Discussion
In this study, we revealed a role for p53 in transcriptionally regulating SQLE, therefore controlling cholesterol synthesis and tumor growth. We identified a functional p53 binding site (RE2) in SQLE gene. Interestingly, luciferase assays using this site of p53 occupancy showed transcriptional activation rather than repression. Although this may be unexpected given that p53 transcriptionally represses SQLE expression, luciferase expression driven by p53‐repressive target genes can be promoted, for instance, EPCAM response element (Sankpal et al, 2009) and CPS‐1, OTC, ARG1 response element (Li et al, 2019). This needs to be further investigated whether an unknown enhancer element is required for p53 to have a repressive effect in vivo. Under low‐sterol stress conditions, p53 has been implicated in modulating overall mevalonate pathway and cellular cholesterol levels in a SREBP2‐dependent manner (Moon et al, 2019). Here, we discovered a SREBP2‐independent function of p53 in suppressing SQLE expression under normal‐sterol conditions. Thus, it appears that p53 is capable to control the expression of this enzyme through different mechanisms, which might be nutrient‐ and/or context‐dependent. For instance, under low‐sterol conditions, SREBP2 is essential for p53‐mediated suppression of cholesterol synthesis via participating in SQLE transcription, whereas directly binding to SQLE gene emerges as a prime mechanism for p53 to repress this metabolic pathway under normal‐sterol conditions. Nevertheless, regulation of SQLE expression through two different mechanisms confers p53 stronger capacity to control cholesterol synthesis and reveals the importance of cholesterol in supporting p53‐deficient tumor cell proliferation. Moreover, in case of the tumors carry SREBP2 mutation or occur in the lipid‐rich environment, the direct inhibition of SQLE could be an efficient way for p53‐mediated tumor suppression.
p53 is well‐known as a tumor suppressor regulating many genes involved in various metabolic processes such as glucose catabolism, glutamine metabolism, lipid synthesis, and fatty acid oxidation. However, p53 regulation of these metabolic events is genetic‐ and tissue‐specific (Kruiswijk et al, 2015; Kastenhuber & Lowe, 2017). Cholesterol is an important component of cellular membranes modulates signaling pathways involved in tumorigenesis. Cholesterol‐derived metabolites also play complex roles in supporting cancer progression and suppressing immune responses. Geranylgeranylation of proteins is a branch of the cholesterol synthesis pathway. We found the effect of p53 on cell growth is partially dependent on geranylation of proteins and suggest that cholesterol and its associated metabolic pathway are important for p53 to suppress tumor growth. SQLE catalyzes the first oxygenation and limited step of cholesterol synthesis and promotes NAFLD‐induced HCC (Liu et al, 2018). Although cholesterol is mainly synthesized by liver in human, the cholesterol metabolism is frequently reprogrammed in many cancers. In general, SQLE promotes tumorigenesis in several types of cancer including breast and liver cancers (Brown et al, 2016; Liu et al, 2018). Consistent with this, we found SQLE depletion decreased cell proliferation not only in HCC cells, but also in human colon cancer cells. Moreover, inhibition of SQLE reduced cell proliferation, particularly in p53‐deficient tumor cells. A recent study revealed a role of SQLE in colorectal cancer progression and metastasis (Jun et al, 2020). The work by Jun et al reported that reduction SQLE decreased p53 levels and promoted cell survival and invasiveness when HCT116 cells were cultured in ULA surface plates to mimic anoikis conditions. Here we found that p53 repressed SQLE expression to inhibit tumor growth, which was consistent with previous studies by Moon et al (2019). These observations may suggest that when cells are under non‐apoptotic conditions, upregulation of SQLE by p53 loss to maintain cell growth and cellular cholesterol levels. However, when cells are under anoikis conditions, cholesterol‐dependent reduction of SQLE protects cell from death through reducing p53 levels, subsequently leads to cell survival and invasiveness. The reciprocal regulation between SQLE and p53 is likely a key mechanism that modulates cell growth and invasion. Additionally, our study found that p53 repressed SQLE expression, and downregulation of SQLE induced senescence through p53. Additionally, cholesterol could reduce p53‐induced cell senescence under low‐sterol conditions. These data point at a potential feedback mechanism by which perturbations of cholesterol metabolism promote cellular senescence in a p53‐dependent manner. Therefore, together these findings, it would be greatly interesting and potentially required to evaluate the p53 status of human cancers if SQLE is selected as a potential therapeutic target.
Squalene accumulation caused by SQLE inhibition has been reported to prevent oxidative cell death in lymphomas (Garcia‐Bermudez et al, 2019). On the other hand, squalene is toxic for small cell lung cancers (Mahoney et al, 2019). It has also been reported that squalene suppresses colon carcinogenesis (Rao et al, 1998). These studies suggest that squalene has distinct effects on cell growth, which may be cancer cell type‐specific (Paolicelli & Widmann, 2019). We found that SQLE inhibition led to squalene accumulation and inhibited cell proliferation. Based on our findings, squalene likely inhibits cell growth in hepatocellular carcinoma cell line.
Although it is reported SQLE inhibitor terbinafine suppresses NAFLD‐HCC growth in mice (Liu et al, 2018), our study demonstrates that terbinafine plays a key role in inhibiting the proliferation of tumor cells, especially p53‐deficient cells. Moreover, terbinafine treatment or inhibition of SQLE represses p53 loss‐induced NAFLD‐HCC tumorigenesis in vivo. Taken together, our findings suggest that SQLE could be a potential therapeutic target and terbinafine is an anti‐tumor drug candidate for treating cancers harboring p53 mutation or deletion.
Material and Methods
Antibodies and reagents
Antibodies against the following proteins were used in this study with the indicated sources, catalog numbers, and dilutions indicated: Actin (Proteintech, Chicago, America; 66009‐1‐Ig, 1:4,000), p53 (DO‐1) (Santa Cruz Biotechnology, Dallas, TX; sc‐126, 1:1,000), p21 (BD Bioscience, San Jose, CA; 556431), SQLE (Proteintech, 12544‐1‐AP, 1:1,000), SREBP2 (Abcam, Cambridge, UK; ab30682, 1:500; BD Bioscience, San Jose, CA; 557037, 1:500). Fatostatin and cholesterol were purchased from Selleck. Crystal violet (CV) was purchased from Applygen. Filipin III, terbinafine hydrochloride, GGTI‐2133, propidium iodide (PI), N‐nitrosodiethylamine (DEN), SiO2, 2’,7’‐fichlorofluorescin diacetate (DCF) were all purchased from Sigma.
Cell culture
Cells were maintained in standard culture conditions without any antibiotic. 293T, HCT116, MCF‐7, HepG2, and H1299 were from ATCC (Manassas, VA). SK Hep1 and Bel 7402 were kindly provided by Dr. Hongbing Zhang (Chinese Academy of Medical Science, Beijing, China). SK Br3, MDA‐MB‐468, and MDA‐MB‐435S were from National infrastructure of Cell Line Resource (Beijing, China). All cells were cultured in a 5% CO2 humidified incubator (Thermo Fisher Scientific, USA) at 37°C. 293T, HCT116, MCF‐7, SK Hep1, and Bel 7402 cell lines were maintained in standard Dulbecco’s modified Eagle’s medium (DMEM, Life Technologies). HepG2 cells were cultured in minimum Eagle’s medium (EME) supplemented with nonessential amino acid (NEAA). H1299, SK Br3, and MDA‐MB‐468 were cultured in standard RPMI 1640 medium (Thermo Fisher Scientific). All mediums, if not specifically described, were supplemented with 10% fetal bovine serum (FBS). For lipoprotein‐depleted fetal bovine serum (LPDS), fumed silica powder was added to the serum and mixed thoroughly, and then shook mixtures overnight at 4°C with rotation. After centrifugation, the supernatant contains the depleted serum was collected. All cells were cultured without the addition of penicillin‐streptomycin and for no more than 2 consecutive months and were routinely examined for mycoplasma contamination. All the cell lines have been authenticated.
shRNA, siRNA, and CRISPR/Cas9‐mediated deletion of SREBP2
Expression plasmids for shRNAs were made in a pLKO.1‐puro vector. The target sequences were as follows: p53, 5′‐GACTCCAGTGGTAATCTAC‐3′. The following siRNAs were ordered from GenePharma Company (Suzhou, China): p53 #1, 5′‐GCUGUGGGUUGAUUCCACATT‐3′; p53 #2, 5′‐GCAUCUUAUCCGAGUGGAATT‐3′; SQLE, 5′‐GCAUUGCCACUUUCACCUATT‐3′; SREBP2, 5′‐GCAAGAGAAAGUGCCCAUUTT‐3′.
siRNAs were transfected into cells using Lipofectamine RNAiMAX transfection Agent (Invitrogen, Carlsbad, CA) following the manufacturer's instruction. Stable shRNA transfections were selected in medium containing 1 μg/ml puromycin (Calbiochem, San Diego, CA, catalog No: 540222) as previously described (Ayyoob et al, 2016).
To generate SREBP2‐knocknot cells, a lentiviral CRISPR/Cas9 plasmid targeting SREBP2 was created by cloning the annealed sgRNA into pLenti‐CRISPRv2 vector. The sgRNAs were designed by CRISPR Design tool (crispr.mit.cn), and the sequences were as follows: 5′‐CACCGAGTGCAACGGTCATTCACCC‐3′ and 5′‐AAACGGGTGA ATGACCGTTGCACTC‐3′.
Quantitative RT–PCR
Total RNA was isolated from cells or animal tissues by RNAsimple Total RNA Kit (TIANGEN, Beijing, China), and 1 μg RNA of each sample was reversed transcribed to cDNA by First‐strand cDNA Synthesis System (TIANGEN). 0.2 μg cDNA of each sample was used as a template to perform quantitative PCR. Quantitative PCR was performed on CFX96 Real‐Time PCR system (Bio‐Rad, USA), and the amplifications were done using the SYBR Green PCR Master Mix (ABM, China). p21 was used as a positive control for p53 transcriptional target gene.
The primer pairs for human genes were as follows: β‐actin, 5′‐GACCTGACTGACTACCTCATGAAGAT‐3′ and 5′‐GTCACACTTCATGATGGAGTTGAAGG‐3′; p53, 5′‐CAGCACATGACGGAGGTTGT‐3′ and 5′‐TCATCCAAATACTCC ACACGC‐3′; p21, 5′‐CCGGCGAGGCCGGGATGAG‐3′ and 5′‐CTTCCTCTTGGAGAAGATC‐3′; SQLE, 5′‐GATGATGCAGCTATTTTCGAGGC‐3′ and 5′‐CCTGAGCAAGGATATTCACGACA‐3′; SREBP2, 5′‐CCTGGGAGACATCGACGAGAT‐3′ and 5′‐TGAATGACCGTTGCACTGAAG‐3′.
Primers for mouse genes were as follows: GAPDH, 5′‐AGGTCGGTGTGAACGGATTTG‐3′ and 5′‐TGTAGACCATGTAGTTGAGGTCA‐3′; p53, 5′‐GAAGTCCTTTGCCCTGAAC‐3′ and 5′‐CTAGCAGTTTGGGCTTTCC‐3′; p21, 5′‐AACTTCGTCTGGGAGCGC‐3′ and 5′‐TCAGGGTTTTCTCTTGCAGA‐3′; SQLE, 5′‐AGTTCGCTGCCTTCTCGGATA‐3′ and 5′‐GCTCCTGTTAATGTCGTTTCTGA‐3′.
Chromatin immunoprecipitation (ChIP) and reporter assays
To identify potential p53 family protein response elements, we scanned the SQLE gene using the Genomatix Promoter Inspector Program (Genomatix Inc, Germany, software, http://www.genomatix.de). For ChIP assays, cells were cross‐linked with 1% formaldehyde for 10 min at room temperature. Cross‐linking was stopped by the addition of 125 nM glycine (final concentration). Cell lysates were digested to generate DNA fragments with an average size between 200 bp and 1,000 bp and immunoprecipitated with indicated antibodies. Bound DNA fragments were eluted and amplified by PCR. Primers for human SQLE gene were as follows: RE1, 5′‐TACTCTACTGATCAGGCTCTGC‐3′ and 5′‐ATTACTGTAGGGGGCAAGACAAG‐3′; RE2, 5′‐CAACATGGAGAAGCCCAGT‐3′ and 5′‐TGTTACAAACTATTCGGCA‐3′. Primers for mouse SQLE gene were as follows: BS1, 5′‐ ATGACAGGCTTACGTTAGAGA‐3′ and 5′‐ACGGCTGTGTACTGCAATGTA‐3′; BS2, 5′‐CCTGGAGGAAAAACACGCAT‐3′ and 5′‐TGAGCAGCAAGTGTAGCAATG‐3′.
For reporter assay, the SQLE genomic fragments were cloned into pGL3‐basic vector (Promega, Madison, WI, USA, catalog No: E1751). Luciferase reporter assay was performed as described previously (Du et al, 2013; Jiang et al, 2013). Briefly, the reporter plasmids were transfected into 293T cells or p53−/− HCT116 cells together with a Renilla luciferase plasmid and the indicated amount of the p53 plasmid using Lipofectamine 3000 (Invitrogen). The luciferase activity was determined according to the manufacturer’s instructions (Promega). Transfection efficiency was normalized on the basis of the Renilla luciferase activity.
Western blotting
Whole cell or mouse tissue lysates were made in modified RIPA lysis buffer (50 mM Tris–HCl (pH 7.4), 150 Mm NaCl, 1% NP‐40, 0.1% SDS and complete protease cocktail) for 30 min on ice, and boiled in 2× loading buffer. Protein samples were resolved by SDS–PAGE and transferred onto nitrocellulose membrane, which was blocked in 5% skimmed milk in TBST and probed with the indicated antibodies.
Xenograft tumor models
Xenograft study was performed as described previously (Du et al, 2013). Briefly, cells were injected subcutaneously into the flanks of 4‐week‐old athymic Balb‐c nu/nu male mice (Beijing Vital River Laboratory Animal Technology Co. Ltd). Seven mice were in each cohort. Tumor growth was evaluated at 2‐ or 3‐week post‐injection as indicated. After inoculation, mice were euthanized or plotted as dead when tumor size was > 1,000 mm3.
Animal studies
Wild‐type C57BL/6 mice were purchased from Vital River company (Beijing, China). The p53 −/− mice and were generated by Beijing Biocytogen Co., Ltd (China) and were previously described (Li et al, 2019). p53 fl/fl mice were produced from C57BL/6 embryonic stem cells with loxP sites flanking exon 2 to exon 10 (Beijing Biocytogen Co., Ltd.). All the mice were housed in air‐conditioned rooms (22–24°C) under a 12:12 h light/dark cycle. For mice models, at least 6–10 male mice were randomly allocated into different groups. For HFD‐induced obese mice model, six‐week‐old p53 +/+ and p53 −/− male mice were both fed with a normal diet (Normal) and high‐fat diet (HFD, Research Diet, #D12492; 60% kcal from fat, 5.24 kcal/g) for 8 weeks. For terbinafine treatment mice model, p53 +/+ and p53 −/− male mice were divided into vehicle group (PBS, oral) and terbinafine group (80 mg/kg, oral) after 10 days of HFD diets. For DEN‐induced HCC development models, a single injection of DEN (25 mg/kg) intraperitoneally was applied at age of 14 days. After weaning, p53 −/− male mice were fed HFD diet and received vehicle (PBS) or terbinafine treatment after 13 weeks. Mice were kept on the treatment for 9 weeks. Weekly body weight was measured throughout all the experiment periods. For Alb‐cre p53 fl/fl mice, p53 fl/fl mice were crossed with Alb‐Cre mice to generate p53 liver‐specific knockout mice (Alb‐cre p53 fl/fl) and control mice (p53 fl/fl). Mice were intraperitoneally injected with a single injection of DEN (25 mg/kg) at age of 13 days, fed with HFD diet from 4 weeks old. At the age of 13 weeks, each genotype of mice was divided into two groups, 5 × 10¹¹v.g. AAV8‐SQLE shRNA or AAV8‐Ctrl shRNA in total volume of 100 μl PBS was administered by tail vein injection. Mice were sacrificed at the age of 25 weeks. At the end of the experiment, all the mice were anesthetized. Whole trunk blood was collected, and serum cholesterol was examined in the department of laboratory medicine of Peking Union Medical College Hospital. All the animal tissues were removed rapidly and immediately frozen at −80°C until their analysis. All animal experiments and euthanasia were approved and performed in accordance with the guidelines of Animal Care and Use Committee of IBMS/PUMC.
Human HCC cancer sample assessment
Human HCC specimens were obtained from patients who underwent surgery at Peking Union Medical College Hospital (Beijing, China). Tumor tissues were extracted with lysis buffer and then subjected to immunoblotting. All the patients provided written informed consent. All the procedures were performed under the permission of the Peking Union Medical College Hospital Ethics Board.
Immunohistochemistry (IHC) analysis
Immunohistochemical staining was performed as described previously (Peng et al, 2013). In brief, liver tissues or tumor tissues were fixed in 4% paraformaldehyde and embedded in paraffin for H&E staining, oil red staining, and immunohistochemical analysis of Ki‐67.
Cell proliferation assay and CV staining of cells
Cell proliferation assay was performed as described previously (Jiang et al, 2013). Briefly, cells were transfected with siRNAs for 48 h and seeded in 6‐well cell culture dishes in triplicate at a density of 40,000 cells as indicated per well in 2 ml of medium supplemented with 10% FBS or LPDS medium. The medium was changed every day. Cell number at the indicated time points was determined by counting. For CV staining, cells were fixed with methanol for 15 min and stained with 0.05% CV for 15 min. After being washed with distilled water, the cells were photographed.
Senescence‐associated SA‐β‐gal activity
The SA‐β‐gal activity in cultured cells was determined using a Senescence Detection Kit (BioVision) following the manufacturer’s instructions. Percentages of cells that stained positive were calculated by counting 5 fields in random per cell line.
Cholesterol concentrations
Cells (106) or tissues (20 mg) were harvested, and cholesterol concentrations were detected by Cholesterol/Cholesterol Ester Quantification kit (Abcam) according to the manufacturer’s instructions.
Triglyceride concentrations
Cells (106) or tissues (20 mg) were harvested, and cholesterol concentrations were detected by Triglyceride Quantification Colorimetric/Fluorometric Kit (BioVision) according to the manufacturer’s instructions.
Filipin III staining
Filipin III was dissolved in DMSO to reach final concentration of 5 mg/ml. Cells were fixed with 4% paraformaldehyde and stained with 50 μg/ml Filipin III for 30 min at room temperature. Images were photographed and analyzed using Image‐Pro Plus 6.0 software (Media Cybernetics, America).
Liquid Chromatography coupled to Mass Spectrometry (LC‐MS)
HepG2 cells cultured on 10‐cm dishes were washed 3 times with 5 ml PBS. Cell pellets were resuspended in 1 ml cold PBS and then added 4 ml cold CH2Cl2: MeOH (2:1 v/v). After extraction by vortexing for 3 times and centrifugation for 15 min at 1,000 g at 4°C, the lower lipid‐containing layer was carefully collected and dried under nitrogen. Dried lipid extracts were stored at −80°C until LC/MS analysis.
The UPLC system was coupled to a Q Exactive Orbitrap mass spectrometer (Thermo Fisher, CA) equipped with an APCI probe. Extracts were separated by a Biphenyl 150 × 2.1 mm column. A binary solvent system was used, in which mobile phase A consisted of 100% H2O, 0.1% formic acid, and mobile phase B of 100% acetonitrile containing 0.1% formic acid. A 12‐min gradient with flow rate of 300 μl/min was used. Column chamber and sample tray were held at 40°C and 10°C, respectively. Data with mass ranges of m/z 300–500 were acquired in positive ion mode. The full scan was collected with resolution of 70,000. The source parameters are as follows: Discharge current 8 μA; capillary temperature: 320°C; heater temperature: 400°C; sheath gas flow rate: 45 Arb; auxiliary gas flow rate: 10 Arb.
Statistical analysis
No statistical methods were used to predetermine sample size. For animal experiments, the authors who did the experiments were blinded to group allocation during data collection and/or analysis. Results are shown as mean ± s.d. All statistical methods used were specified in the figure legends. All statistical analyses were performed, and P values were obtained using GraphPad Prism software 7.0. When P value < 0.05, differences were considered significant. Statistical significance is shown as *P < 0.05, **P < 0.01, ***P < 0.001, ****P < 0.0001.
Author contribution
HS, LL, and WL performed all experiments and analyzed the data. FY, ZZ, and ZL helped with animal experiments. WD conceived, designed, and supervised the research. WD wrote the manuscript. All authors commented on the manuscript.
Conflict of interest
The authors declare that they have no conflict of interest.
Supporting information
Expanded View Figures PDF
Acknowledgments
We thank B. Vogelstein for HCT116 cells; D. Wang for the plasmid Flag‐mouse p53; H. Zhang for p53 fl/fl mice and Alb‐cre mice. This work was supported by CAMS Innovation Fund for Medical Sciences (CIFMS)(2016‐I2M‐4‐002), the National Key Research and Development Program of China (2019YFA0802600), the National Natural Science Foundation of China (81672766), CAMS Basic Research Fund (2019‐RC‐HL‐007), State Key Laboratory Special Fund (2060204) to W.D.
EMBO reports (2021) 22: e52537.
Data availability
The RNA‐seq data have been deposited in the Gene Expression Omnibus under accession GSE176112 (http://www.ncbi.nlm.nih.gov/geo/query/acc.cgi?acc=GSE176112). The remaining data that support the findings of this study are available from the corresponding author upon reasonable request.
References
- Abdel‐Rahman SM, Nahata MC (1997) Oral terbinafine: a new antifungal agent. Ann Pharmacother 31: 445–456 [DOI] [PubMed] [Google Scholar]
- Ayyoob K, Masoud K, Vahideh K, Jahanbakhsh A (2016) Authentication of newly established human esophageal squamous cell carcinoma cell line (YM‐1) using short tandem repeat (STR) profiling method. Tumour Biol 37: 3197–3204 [DOI] [PubMed] [Google Scholar]
- Ben‐Porath I, Weinberg RA (2005) The signals and pathways activating cellular senescence. Int J Biochem Cell Biol 37: 961–976 [DOI] [PubMed] [Google Scholar]
- Brown DN, Caffa I, Cirmena G, Piras D, Garuti A, Gallo M, Alberti S, Nencioni A, Ballestrero A, Zoppoli G (2016) Squalene epoxidase is a bona fide oncogene by amplification with clinical relevance in breast cancer. Sci Rep 6: 19435 [DOI] [PMC free article] [PubMed] [Google Scholar]
- Bunz F, Dutriaux A, Lengauer C, Waldman T, Zhou S, Brown JP, Sedivy JM, Kinzler KW, Vogelstein B (1998) Requirement for p53 and p21 to sustain G2 arrest after DNA damage. Science 282: 1497–1501 [DOI] [PubMed] [Google Scholar]
- Contractor T, Harris CR (2012) p53 negatively regulates transcription of the pyruvate dehydrogenase kinase Pdk2. Cancer Res 72: 560–567 [DOI] [PubMed] [Google Scholar]
- Du W, Jiang P, Mancuso A, Stonestrom A, Brewer MD, Minn AJ, Mak TW, Wu M, Yang X (2013) TAp73 enhances the pentose phosphate pathway and supports cell proliferation. Nat Cell Biol 15: 991–1000 [DOI] [PMC free article] [PubMed] [Google Scholar]
- Ferbeyre G, de Stanchina E, Querido E, Baptiste N, Prives C, Lowe SW (2000) PML is induced by oncogenic ras and promotes premature senescence. Genes Dev 14: 2015–2027 [PMC free article] [PubMed] [Google Scholar]
- Floter J, Kaymak I, Schulze A (2017) Regulation of metabolic activity by p53. Metabolites 7: 21 [DOI] [PMC free article] [PubMed] [Google Scholar]
- Foresti O, Ruggiano A, Hannibal‐Bach HK, Ejsing CS, Carvalho P (2013) Sterol homeostasis requires regulated degradation of squalene monooxygenase by the ubiquitin ligase Doa10/Teb4. eLife 2: e00953 [DOI] [PMC free article] [PubMed] [Google Scholar]
- Freed‐Pastor W, Mizuno H, Zhao Xi, Langerød A, Moon S‐H, Rodriguez‐Barrueco R, Barsotti A, Chicas A, Li W, Polotskaia Aet al (2012) Mutant p53 disrupts mammary tissue architecture via the mevalonate pathway. Cell 148: 244–258 [DOI] [PMC free article] [PubMed] [Google Scholar]
- Garcia‐Bermudez J, Baudrier L, Bayraktar EC, Shen Y, La K, Guarecuco R, Yucel B, Fiore D, Tavora B, Freinkman Eet al (2019) Squalene accumulation in cholesterol auxotrophic lymphomas prevents oxidative cell death. Nature 567: 118–122 [DOI] [PMC free article] [PubMed] [Google Scholar]
- Gill S, Stevenson J, Kristiana I, Brown AJ (2011) Cholesterol‐dependent degradation of squalene monooxygenase, a control point in cholesterol synthesis beyond HMG‐CoA reductase. Cell Metab 13: 260–273 [DOI] [PubMed] [Google Scholar]
- Helms MW, Kemming D, Pospisil H, Vogt U, Buerger H, Korsching E, Liedtke C, Schlotter CM, Wang A, Chan SYet al (2008) Squalene epoxidase, located on chromosome 8q24.1, is upregulated in 8q+ breast cancer and indicates poor clinical outcome in stage I and II disease. Br J Cancer 99: 774–780 [DOI] [PMC free article] [PubMed] [Google Scholar]
- Hidaka Y, Satoh T, Kamei T (1990) Regulation of squalene epoxidase in HepG2 cells. J Lipid Res 31: 2087–2094 [PubMed] [Google Scholar]
- Jiang P, Du W, Mancuso A, Wellen KE, Yang X (2013) Reciprocal regulation of p53 and malic enzymes modulates metabolism and senescence. Nature 493: 689–693 [DOI] [PMC free article] [PubMed] [Google Scholar]
- Jun SY, Brown AJ, Chua NK, Yoon JY, Lee JJ, Yang JO, Jang I, Jeon SJ, Choi TI, Kim CHet al (2020) Reduction of squalene epoxidase by cholesterol accumulation accelerates colorectal cancer progression and metastasis. Gastroenterology 160: 1194–1207 [DOI] [PubMed] [Google Scholar]
- Kamisuki S, Mao Q, Abu‐Elheiga L, Gu Z, Kugimiya A, Kwon Y, Shinohara T, Kawazoe Y, Sato S‐I, Asakura Ket al (2009) A small molecule that blocks fat synthesis by inhibiting the activation of SREBP. Chem Biol 16: 882–892 [DOI] [PubMed] [Google Scholar]
- Kastenhuber ER, Lowe SW (2017) Putting p53 in context. Cell 170: 1062–1078 [DOI] [PMC free article] [PubMed] [Google Scholar]
- Kim J, Yu L, Chen W, Xu Y, Wu M, Todorova D, Tang Q, Feng B, Jiang L, He Jet al (2019) Wild‐type p53 promotes cancer metabolic switch by inducing PUMA‐dependent suppression of oxidative phosphorylation. Cancer Cell 35: 191–203.e198 [DOI] [PubMed] [Google Scholar]
- Komarov PG, Komarova EA, Kondratov RV, Christov‐Tselkov K, Coon JS, Chernov MV, Gudkov AV (1999) A chemical inhibitor of p53 that protects mice from the side effects of cancer therapy. Science 285: 1733–1737 [DOI] [PubMed] [Google Scholar]
- Krstic J, Galhuber M, Schulz TJ, Schupp M, Prokesch A (2018) p53 as a dichotomous regulator of liver disease: the dose makes the medicine. Int J Mol Sci 19: 921 [DOI] [PMC free article] [PubMed] [Google Scholar]
- Kruiswijk F, Labuschagne CF, Vousden KH (2015) p53 in survival, death and metabolic health: a lifeguard with a licence to kill. Nat Rev Mol Cell Biol 16: 393–405 [DOI] [PubMed] [Google Scholar]
- Lahalle A, Lacroix M, De Blasio C, Cisse MY, Linares LK, Le Cam L (2021) The p53 pathway and metabolism: the tree that hides the forest. Cancers (Basel) 13: 133 [DOI] [PMC free article] [PubMed] [Google Scholar]
- Li L, Mao Y, Zhao L, Li L, Wu J, Zhao M, Du W, Yu L, Jiang P (2019) p53 regulation of ammonia metabolism through urea cycle controls polyamine biosynthesis. Nature 567: 253–256 [DOI] [PubMed] [Google Scholar]
- Li T, Kon N, Jiang L, Tan M, Ludwig T, Zhao Y, Baer R, Gu W (2012) Tumor suppression in the absence of p53‐mediated cell‐cycle arrest, apoptosis, and senescence. Cell 149: 1269–1283 [DOI] [PMC free article] [PubMed] [Google Scholar]
- Liu D, Wong CC, Fu Li, Chen H, Zhao L, Li C, Zhou Y, Zhang Y, Xu W, Yang Yet al (2018) Squalene epoxidase drives NAFLD‐induced hepatocellular carcinoma and is a pharmaceutical target. Sci Transl Med 10: eaap9840 [DOI] [PubMed] [Google Scholar]
- Liu J, Zhang C, Hu W, Feng Z (2019) Tumor suppressor p53 and metabolism. J Mol Cell Biol 11: 284–292 [DOI] [PMC free article] [PubMed] [Google Scholar]
- Liu Y, Gu W (2021) The complexity of p53‐mediated metabolic regulation in tumor suppression. Semin Cancer Biol 10.1016/j.semcancer.2021.03.010 [DOI] [PMC free article] [PubMed] [Google Scholar]
- Mahoney CE, Pirman D, Chubukov V, Sleger T, Hayes S, Fan ZP, Allen EL, Chen Y, Huang L, Liu Met al (2019) A chemical biology screen identifies a vulnerability of neuroendocrine cancer cells to SQLE inhibition. Nat Commun 10: 96 [DOI] [PMC free article] [PubMed] [Google Scholar]
- Moon S‐H, Huang C‐H, Houlihan SL, Regunath K, Freed‐Pastor WA, Morris JP, Tschaharganeh DF, Kastenhuber ER, Barsotti AM, Culp‐Hill Ret al (2019) p53 represses the mevalonate pathway to mediate tumor suppression. Cell 176: 564–580.e19 [DOI] [PMC free article] [PubMed] [Google Scholar]
- Nagai M, Sakakibara J, Nakamura Y, Gejyo F, Ono T (2002) SREBP‐2 and NF‐Y are involved in the transcriptional regulation of squalene epoxidase. Biochem Biophys Res Comm 295: 74–80 [DOI] [PubMed] [Google Scholar]
- Nakamura Y, Sakakibara J, Izumi T, Shibata A, Ono T (1996) Transcriptional regulation of squalene epoxidase by sterols and inhibitors in HeLa cells. J Biol Chem 271: 8053–8056 [DOI] [PubMed] [Google Scholar]
- Nowosielski M, Hoffmann M, Wyrwicz LS, Stepniak P, Plewczynski DM, Lazniewski M, Ginalski K, Rychlewski L (2011) Detailed mechanism of squalene epoxidase inhibition by terbinafine. J Chem Inf Model 51: 455–462 [DOI] [PubMed] [Google Scholar]
- Paolicelli RC, Widmann C (2019) Squalene: friend or foe for cancers. Curr Opin Lipidol 30: 353–354 [DOI] [PubMed] [Google Scholar]
- Pearson M, Carbone R, Sebastiani C, Cioce M, Fagioli M, Saito S, Higashimoto Y, Appella E, Minucci S, Pandolfi PPet al (2000) PML regulates p53 acetylation and premature senescence induced by oncogenic Ras. Nature 406: 207–210 [DOI] [PubMed] [Google Scholar]
- Peng H, Liu J, Sun Q, Chen R, Wang Y, Duan J, Li C, Li B, Jing Y, Chen Xet al (2013) mTORC1 enhancement of STIM1‐mediated store‐operated Ca2+ entry constrains tuberous sclerosis complex‐related tumor development. Oncogene 32: 4702–4711 [DOI] [PMC free article] [PubMed] [Google Scholar]
- Rao CV, Newmark HL, Reddy BS (1998) Chemopreventive effect of squalene on colon cancer. Carcinogenesis 19: 287–290 [DOI] [PubMed] [Google Scholar]
- Riley T, Sontag E, Chen P, Levine A (2008) Transcriptional control of human p53‐regulated genes. Nat Rev Mol Cell Biol 9: 402–412 [DOI] [PubMed] [Google Scholar]
- Sankpal NV, Willman MW, Fleming TP, Mayfield JD, Gillanders WE (2009) Transcriptional repression of epithelial cell adhesion molecule contributes to p53 control of breast cancer invasion. Cancer Res 69: 753–757 [DOI] [PMC free article] [PubMed] [Google Scholar]
- Silvente‐Poirot S, Poirot M (2012) Cholesterol metabolism and cancer: the good, the bad and the ugly. Curr Opin Pharmacol 12: 673–676 [DOI] [PubMed] [Google Scholar]
- Stopsack KH, Gerke TA, Sinnott JA, Penney KL, Tyekucheva S, Sesso HD, Andersson S‐O, Andrén O, Cerhan JR, Giovannucci ELet al (2016) Cholesterol metabolism and prostate cancer lethality. Can Res 76: 4785–4790 [DOI] [PMC free article] [PubMed] [Google Scholar]
- Valente LJ, Gray DH, Michalak EM, Pinon‐Hofbauer J, Egle A, Scott CL, Janic A, Strasser A (2013) p53 efficiently suppresses tumor development in the complete absence of its cell‐cycle inhibitory and proapoptotic effectors p21, Puma, and Noxa. Cell Rep 3: 1339–1345 [DOI] [PubMed] [Google Scholar]
- Vousden KH, Prives C (2009) Blinded by the light: the growing complexity of p53. Cell 137: 413–431 [DOI] [PubMed] [Google Scholar]
- Vousden KH, Ryan KM (2009) p53 and metabolism. Nat Rev Cancer 9: 691–700 [DOI] [PubMed] [Google Scholar]
- Zelcer N, Sharpe LJ, Loregger A, Kristiana I, Cook EC, Phan L, Stevenson J, Brown AJ (2014) The E3 ubiquitin ligase MARCH6 degrades squalene monooxygenase and affects 3‐hydroxy‐3‐methyl‐glutaryl coenzyme A reductase and the cholesterol synthesis pathway. Mol Cell Biol 34: 1262–1270 [DOI] [PMC free article] [PubMed] [Google Scholar]


