

Abstract
Flexibility and efficiency in a radiotherapy department with different linear accelerators (linacs) can be improved if they are dosimetrically equivalent, and there is no need of plan or patient-specific quality assurance (PSQA) modification. From 2012 to 2017, our institution purchased three Novalis Tx and one TrueBeam STx beam-matched accelerators with the same high-resolution multileaf collimator (MLC). They are matched taking as reference dosimetric data from Novalis Tx SN-5479. We showed the importance of beam-matched dosimetric units by the use of electronic portal image device (EPID) and Delta4 PSQA. It was able to treat patients on a different machine than the machine used for PSQA. Depth dose, beam profiles, output factors, dosimetric leaf gap, and MLC transmission were compared for all energies and linacs. PSQA in all linacs for 30 volumetric-modulated arc therapy plans was also compared. Prostate, breast, and head-and-neck cases were selected to consider low, middle, and high plan complexity, respectively. The comparisons were evaluated using EPID and Delta4 phantom. Dosimetric differences between the three Novalis Tx and TrueBeam STx in all energies were lower than 1%. The only significant difference was observed in Novalis EPID in middle complexity when the criterion was tighter in distance. This result could be related with the nonsymmetric dose delivery of semi arcs. In all other cases, there were no differences in two different EPID evaluations. However, TrueBeam EPID values were slightly higher than Novalis EPID values. This could be associated with the high-resolution novel diode detector TrueBeam EPID. The dosimetric data indicated that the Novalis Tx and TrueBeam STx are equivalent. PSQA using EPID and Delta4 phantom showed that there are no dosimetric differences in any of the linacs. These results revealed the flexibility performance in PSQA by beam-matching.
Keywords: Beam-matching, patient-specific quality assurance, portal dosimetry, TrueBeam STx
INTRODUCTION
Treatment flexibility and efficiency of a radiotherapy department bear particular significance. It can be greatly improved if several linear accelerators (linacs) are considered dosimetrically equivalent, and patients can undergo treatment using any linac without the need of treatment plan or patient-specific quality assurance (PSQA) adjustment.[1] To make this possible, the dosimetric characteristics of the various accelerators must be similar under clinical tolerance limits.[2]
At present, many radiation therapy centers are equipped with two or more linear accelerators.[3] If they were bought from the same vendor with the same specifications, it would be ideal and convenient for the accelerators to be “beam-matched.” In beam-matching approach, treatment beams of the accelerator being installed are tuned in such a way that the dosimetric characteristics meet the reference values within a specified interval.[3] The dosimetric and mechanical measurements done during commissioning of the first unit are taken as baseline values[4] and other units are tuned with it. Beam-matching reduces the need for the remeasurement of dosimetric data for the treatment planning systems (TPSs).
The Novalis Tx® and TrueBeam STx® are both high-precision linear accelerator systems designed for image-guided stereotactic treatment delivery to the brain and body. Both systems have multiple photon energies, 1 or more high-dose rate, high-definition multileaf collimator (HDMLC). The HDMLC HD120® has 120 leaves with 60 central leaf pairs of 2.5 mm width at isocenter,[5] MV portal imaging, kV planar imaging, cone beam computed tomography, ExacTrac™ (Brainlab AG, Munchen, Germany), and a robotic couch top.[6] Both systems include software for automatic image registration, remote patient positioning, motion tracking, and gated delivery.
From 2012 to 2017, our institution acquired three Novalis Tx® and 1 TrueBeam STx®(Varian Medical Systems, Palo Alto, CA-Brainlab AG, Munchen, Germany). They are beam-matched taking the dosimetric data from the Novalis Tx SN-5479 (installed in 2013) as the reference.
The purpose of this work is to show that different linacs (Novalis Tx and TrueBeam STx) can be beam-matched and its importance on flexibility pretreatment PSQA by the use of electronic portal image device (EPID) and Delta4 phantom.
Beam-matching is possible although there are a number of reasons why it is not recommended to create equivalent machines. First, the collimators are different and the resulting diagonal profiles can differ. Second, differences in the multileaf collimator (MLC) calibration procedure mean that the dosimetric leaf gap (DLG) values for the same MLC type will not match between TrueBeam STx and the linac C-series. Third, differences in gantry configuration imply variations in the electron output between TrueBeam STx and C-series machines. Finally, the TrueBeam STx and C-series machines use and recognize a completely different set of codes and cannot be overridden.
MATERIALS AND METHODS
Three linacs (energies) were used: Novalis Tx SN-5445 (6-MV, SRS-6 MV), SN-5479 and SN-6140 (6-MV, SRS-6 MV, 10-MV) and TrueBeam STx SN3169 (6-MV, 10-MV). Novalis Tx SN-5479 dosimetric parameters were used as reference for tuning all linacs. All linear accelerators were beam-matched and equipped with HDMLC. A single model was used to generate all plans for all linacs in the TPS with an analytical anisotropic algorithm.
Depth dose, beam profiles, output factors, DLG, and MLC transmission were compared for all energies in the four linear accelerators.
RapidArc™ is a radiation technique that delivers highly conformal dose distributions through the complete rotation (360°) and speed variation of the linac gantry. This technique, called volumetric modulated arc therapy (VMAT), delivers precise dose distribution and conformity similar to or greater than intensity-modulated radiation therapy in a short time, to which image-guided radiation therapy is added.[7]
Pretreatment PSQA in all linacs for 30 VMAT plans was compared. To consider the low, middle, or high plan complexity, 10 prostate (1 arc, 10-MV), 10 breast (2 semi-arcs, 6-MV), and 10 head-and-neck (H&N) plans were selected (1 arc, 6MV), respectively. The comparisons were evaluated using two-dimensional dosimetry by EPID and three-dimensional (3D) dosimetry by Delta4 phantom.
Dosimetric parameters
Percentage depth dose (PDD) was compared for squared field sizes: 3 cm × 3 cm, 10 cm × 10 cm, and 30 cm × 30 cm for 6-MV; 3 cm × 3 cm, 10 cm × 10 cm, and 15 cm × 15 cm for SRS-6 MV (high-dose rate 6-MV); and 6 cm × 6 cm, 10 cm × 10 cm, and 30 cm × 30 cm for 10-MV. Local differences were evaluated as well.
Beam profiles were compared for square field sizes defined by MLC: 10 cm × 10 cm and 22 cm × 22 cm for 6-MV (at 15 mm depth), 10-MV (at 25-mm depth). Beam profiles were acquired with a CC04 ionization chamber (IC) on vertical orientation and CC04 IC as reference. The same protocol was done for all linacs using 5.0 mm/s scan speed. Postprocessing protocol was established as CAX centering, filtering by median filter sliding window size 5 mm/resolution 0.5 mm, and normalizing on the central axis. Global differences were evaluated. Profile comparisons were considered for high-dose low-gradient region within 90% of the central axis dose, for low-dose low-gradient region within 10% and the penumbra region.
Output factors were measured and compared for a MLC (10 mm × 10 mm, 20 mm × 20 mm, 30 mm × 30 mm, 40 mm × 40 mm, 60 mm × 60 mm, 80 mm × 80 mm, 100 mm × 100 mm, 140 mm × 140 mm, 200 mm × 200 mm, 300 mm × 300 mm) and jaws (12 mm × 12 mm, 22 mm × 22 mm, 32 mm × 32 mm, 42 mm × 42 mm, 60 mm × 60 mm, 80 mm × 80 mm, 100 mm × 100 mm, 140 mm × 140 mm, 200 mm × 200 mm, 300 mm × 300 mm) combination following the treatment planning software recommendation.[8] For each jaw field size, the measured MLC field size range must be larger than or equal to the jaw field size. For each jaw field size, the output factors for MLC field sizes larger than the jaw field size may be set to the value measured for the smallest MLC size that is larger than (or equal to) the jaw field size. Output factors were measured (source-surface distance [SSD], depth) for 6-MV and SRS-6 MV (95 cm, 5 cm) and for 10-MV (90 cm, 10 cm).
DLG and transmission for open field and MLC were compared for all linacs. DLG measurement was done followed the method described by Kim et al.[9] It was required to measure an open field for detector alignment and warm-up, for fields blocked by MLC leaves to measure transmission for bank A and B and for fields with sliding MLC gap from 2 to 100 mm gap sizes with constant speed with respect to UM. The transmission to gap reading was defined as Equation 1:
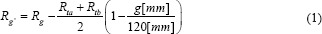
where Rg' is the corrected gap reading, Rg is the gap measurement, Rta and Rtb are MLC transmission reading for MLC bank A, B, respectively, and g is the gap.
An offset of 0.3 mm was introduced to the TrueBeam STx MLC to have DLG agreement with Novalis Tx. DLG offset was introduced iteratively making adjustments to the gap and remeasured the DLG value until it was within tolerance of the target value. DLG and transmission were measured at SSD 100 cm and 10 cm depth.
The centerline gap is used to adjust the gap between the leaves of opposite banks. This procedure assumes that a correct leaf gap value has been identified from the results of a dose dynamic plan for leaf gap verification. The correction value is equal to the desired change of gap size at the isocenter.[10]
Patient-specific quality assurance
Delta4 phantom
Delta4 phantom (ScandiDos, Uppsala, Sweden) consists of a matrix of 1069 P-type Si diodes distributed on coronal and sagittal planes inserted in a 22 cm diameter, 40 cm length cylindrical acrylic phantom. Detector planes subtend angles of 50° clockwise and 40° counter-clockwise with respect to the vertical axis. Each p-Si diode has a cylindrical sensitive volume with a 0.78 mm2 area and a thickness of 0.05 mm. The detectors are spaced at 0.5 cm intervals in the central 6 cm × 6 cm area and at 1 cm intervals outside of this area, covering an area of 20 cm × 20 cm.[11]
Multichannel electrometers are located at the ends of the detector planes in an integrated module. Although the system has detectors along two orthogonal planes only, the device provides a novel technique for calculating the dose in 3D by interpolation.[12]
Delta4 is a third-party dosimetric system that was used to have measurements that are independent of the linac-EPID closed system.
Electronic portal imaging devices
The Novalis Tx is equipped with an amorphous silicon EPID (aSi-1000 EPID). It has a 40 cm × 30 cm detecting surface with a matrix of 1024 × 768 pixels (0.392 mm pixel pitch). It is formed by 1.0 mm copper layer, 0.34 mm scintillator phosphor (Gd2O2S: Tb), and 1.0 mm glass layer where electronic circuits are immersed. The TrueBeam STx has the PortalVision™ aSi-1200. It is a novel and improved digital megavolt imager. PortalVision aSi1200 is used to acquire single, kinetic mode, and portal dosimetry from the beam eye view. It is formed by a 1.6 mm protective layer, 9 mm polymethacrylamide and electronic circuits, a 1.0 mm copper layer, a 0.4 mm scintillator phosphor (Gd2O2S: Tb), and 1280 × 1280 pixels matrix array (active area: 43 cm × 43 cm, pixel size: 0.34 mm × 0.34 mm). Water equivalent thickness from anterior detector surface to pixel array surface is 8.0 mm.[13,14] PortalVision aSi-1200 incorporates 3.0 mm lead layer on a posterior detector surface (ExactArm). It provides backscatter shielding and allows to measure high-dose rate beams without saturation effects (up to 3200 MU/min) due to improvements in detection electronics and processing speed (up to 20 frames per second).
EPIDs in the four linacs were adjusted by the same IsoCal calibration process. It determines the correct location and alignment between the treatment isocenter and rotation center of the kV/MV imaging system.[14] Vendor's maximum arm readout difference, detector rotation, and source angle difference tolerances were 0.5 mm, 2 degrees, and 3 degrees, respectively.[14]
Predicted images from EPID were obtained by the use of portal dose image prediction (PDIP) algorithm. PDIP is based on pencil beam convolution algorithm, the TPS theoretical photon fluence matrix, collimator positions, and total monitor units.[14,15] PDIP algorithm was configured on Eclipse®(Varian Medical Systems, Palo Alto, CA) software using AIDA test, output factors, and beam intensity profile. To establish the same predicted images, the PDIP algorithm was configured for Novalis Tx SN5479 equipped with aSi-1000 EPID. The measurements were determined on three Novalis Tx with aSi-1000 EPID and TrueBeam STx with aSi-1200, assuming that the predicted images for aSi-1000 can be performed on aSi-1200.
Beam profiles were compared on EPID for square field sizes defined by MLC: 10 cm × 10 cm for 6-MV and 10-MV. Beam profiles were acquired with EPID for all linacs at SSD 100 cm. Global differences were evaluated. Profile comparisons were considered for high-dose low-gradient region within 90% of the central axis dose, for low-dose low-gradient region within 10% and the penumbra region.
To evaluate dosimetric variation by segmented arcs on pretreatment PSQA using EPID, total and segmented arcs (120° segmented arcs) were measured and compared in all linacs for VMAT treatments. Three gamma indices were evaluated (3%/2 mm, 3%/1 mm, and 2%/2 mm). Total and segmented measurements were compared by each linac. On the other hand, to evaluate dosimetric variation between “beam-matched” linacs, the total arcs measured in the four accelerators were compared by taking Novalis Tx SN-5479 as reference.
RESULTS
Dosimetric parameters
Local dosimetric parameter differences were evaluated as followed in Equation 2. The variable X represents PDD or output factor at the same point for both linacs.

Local PDD differences were < ±1% in all cases. Figures 1 and 2 show PDDs for different field size and energies for three Novalis Tx and TrueBeam STx. Table 1 shows PDD parameters and differences for all energies and linacs.
Figure 1.

Percentage dose depth for three Novalis Tx and TrueBeam STx for 6 MV for 3, 10, and 30 cm squared field sizes
Figure 2.

Percentage dose depth for three Novalis Tx and TrueBeam STx for 10-MV for 6, 10, and 30 cm squared field sizes
Table 1.
Novalis Tx and TrueBeam STx dosimetric match analysis
| Energy (MV) | Data | Field size (cm×cm) | Novalis Tx 5445 | Novalis Tx 5479 | Novalis Tx 6140 | TrueBeam STx 3169 |
|---|---|---|---|---|---|---|
| 6 | TPR | 3×3 | 0.539 | 0.535 | 0.537 | 0.535 |
| 20/10 | 10×10 | 0.578 | 0.575 | 0.571 | 0.574 | |
| 30×30 | 0.630 | 0.634 | 0.640 | 0.630 | ||
| SRS-6 | TPR | 6×6 | 0.547 | 0.542 | 0.547 | |
| 20/10 | 10×10 | 0.571 | 0.568 | 0.569 | ||
| 15×15 | 0.590 | 0.594 | 0.594 | |||
| 10 | TPR | 6×6 | 0.615 | 0.610 | 0.613 | |
| 20/10 | 10×10 | 0.632 | 0.630 | 0.633 | ||
| 30×30 | 0.674 | 0.678 | 0.671 |
TPR: Tissue-phantom ratio
Global beam profile differences were evaluated as followed in Equation 3. The variable X represents beam profile value at the same point y for both linacs and compared with the beam profile value at the central axis.

Global beam profiles dose differences for crossline and inline profiles showed agreement within ± 1%. Figure 3 shows dose profiles for different linacs for 6-MV. The shaded regions indicate the percentage difference between the compared profiles. Table 2 shows dose profile parameters for different energies for all linacs.
Figure 3.

Dose profiles for three Novalis Tx and TrueBeam STx6-MV at 22 cm squared field size defined by multileaf collimator. Shaded regions represent global percentage differences
Table 2.
Novalis Tx and TrueBeam STx beam profile match analysis
| Data | Depth (mm) | Field size (cm×cm) | Scan direction | Novalis Tx 5445 | Novalis Tx 5479 | Novalis Tx 6140 | TrueBeam STx 3169 |
|---|---|---|---|---|---|---|---|
| Energy 6 MV | |||||||
|
| |||||||
| Flatness (%) | 15 | 10×10 | Inline | 2.3 | 2.4 | 2.4 | 2.4 |
| Crossline | 0.7 | 0.6 | 0.9 | 0.6 | |||
| 22×22 | Inline | 1.6 | 1.3 | 1.4 | 1.6 | ||
| Crossline | 1.6 | 1.4 | 1.4 | 1.5 | |||
| Symmetry (%) | 15 | 10×10 | Inline | 0.1 | 0.1 | 0.0 | 0.0 |
| Crossline | 0.1 | 0.1 | 0.0 | 0.0 | |||
| 22×22 | Inline | 0.1 | 0.1 | 0.0 | 0.0 | ||
| Crossline | 0.0 | 0.0 | 0.0 | 0.0 | |||
| Penumbra (mm) | 15 | 10×10 | Inline | 5.8 | 5.7 | 5.8 | 5.6 |
| Crossline | 4.1 | 4.1 | 4.1 | 4.3 | |||
| 22×22 | Inline | 4.7 | 4.8 | 4.8 | 4.8 | ||
| Crossline | 4.3 | 4.3 | 4.3 | 4.3 | |||
|
| |||||||
| Energy 10 MV | |||||||
|
| |||||||
| Flatness (%) | 25 | 10×10 | Inline | 0.9 | 0.9 | 0.6 | |
| Crossline | 1.5 | 1.4 | 1.9 | ||||
| 22×22 | Inline | 1.4 | 1.3 | 1.7 | |||
| Crossline | 1.0 | 1.1 | 0.9 | ||||
| Symmetry (%) | 25 | 10×10 | Inline | 0.0 | 0.0 | 0.0 | |
| Crossline | 0.1 | 0.0 | 0.0 | ||||
| 22×22 | Inline | 0.1 | 0.0 | 0.0 | |||
| Crossline | 0.3 | 0.0 | 0.0 | ||||
| Penumbra (mm) | 25 | 10×10 | Inline | 5.2 | 5.2 | 5.2 | |
| Crossline | 5.3 | 5.4 | 5.2 | ||||
| 22×22 | Inline | 5.8 | 5.8 | 5.9 | |||
| Crossline | 5.0 | 5.1 | 5.0 | ||||
Local output factor differences were evaluated (taken as reference Novalis Tx SN-5470 measurements) and showed agreement within ±1% for field sizes larger than 30 mm × 30 mm defined by MLC for all energies. Local differences up to 3% were evaluated for field sizes lower than 20 mm × 20 mm. Figure 4 shows for all linacs their output factors for 6 MV with MLC field size 100 mm × 100 mm and as a function of jaws field size. Table 3 shows local output factors differences between Novalis Tx SN-5470 and TrueBeam STx SN-3169 for 6-MV mode.
Figure 4.

Output factors for three Novalis Tx and TrueBeam STx6-MV at 10 cm squared field size defined by multileaf collimator
Table 3.
Novalis Tx and TrueBeam STx dosimetric leaf gap and transmission for open field and multileaf collimator
| Energy (MV) | Data | Novalis Tx 5445 | Novalis Tx 5479 | Novalis Tx 6140 | TrueBeam STx 3169 |
|---|---|---|---|---|---|
| 6 | DLG (mm) | 0.854 | 0.901 | 0.872 | 0.866 |
| Transmission for open field (%) | 1.25 | 1.27 | 1.20 | 1.17 | |
| Transmission for MLC (%) | 1.27 | 1.18 | 1.20 | 1.17 | |
| SRS-6 | DLG (mm) | 0.815 | 0.901 | 0.864 | |
| Transmission for open field (%) | 1.12 | 1.17 | 1.14 | ||
| Transmission for MLC (%) | 1.16 | 1.18 | 1.14 | ||
| 10 | DLG (mm) | 0.932 | 0.957 | 0.908 | |
| Transmission for open field (%) | 1.37 | 1.37 | 1.40 | ||
| Transmission for MLC (%) | 1.46 | 1.37 | 1.40 |
Novalis Tx 5479 measurements were taken as reference. DLG: Dosimetric leaf gap, MLC: Multileaf collimator
The HDMLC DLG, transmission for open field, and transmission for MLC differences (taken as reference Novalis Tx SN-5470 measurements) showed agreement within 0.086 mm, 0.10%, and 0.09%, respectively, for all energies and linacs. Figures 5-7 show for all energies the DLG values and the corresponding linear regression. Table 4 shows DLG and transmission measurements for different energies and linacs.
Figure 5.

Representation of dosimetric leaf gap for 6 MV for Novalis Tx and TrueBeam STx
Figure 7.

Representation of dosimetric leaf gap for 10 MV for Novalis Tx and TrueBeam STx
Table 4.
Novalis Tx SN-5479 and TrueBeam STx SN-3169 output factor local differences for 6-MV mode
| M | Jaw field size | |||||||||||
|---|---|---|---|---|---|---|---|---|---|---|---|---|
|
| ||||||||||||
| mm | 8 | 12 | 22 | 32 | 42 | 60 | 80 | 100 | 140 | 220 | 254 | |
| L | 5 | 2.3% | 2.0% | 2.1% | 2.2% | 2.3% | 2.2% | 2.3% | 2.5% | 2.4% | 2.7% | 2.7% |
| C | 10 | −2.4% | −1.1% | −1.1% | −1.1% | −1.2% | −1.1% | −0.9% | −0.9% | −0.8% | −0.5% | −0.5% |
| F | 20 | −2.6% | −1.6% | −1.2% | −1.1% | −0.9% | −0.9% | −0.9% | −0.7% | −0.5% | −0.3% | |
| I | 30 | −1.2% | −0.7% | −0.6% | −0.5% | −0.4% | −0.3% | −0.2% | −0.1% | −0.1% | ||
| E | 40 | −0.7% | −0.3% | −2.0% | −1.4% | −0.6% | −0.4% | −0.4% | 0.1% | |||
| L | 60 | −0.7% | −0.4% | −0.5% | −0.2% | 0.0% | 0.3% | 0.3% | ||||
| D | 80 | −0.1% | 0.0% | 0.1% | 0.4% | 0.4% | ||||||
| S | 100 | 0.0% | 0.1% | 0.4% | 0.3% | |||||||
| I | 140 | 0.4% | 0.4% | 0.3% | ||||||||
| Z | 220 | 0.7% | 0.7% | |||||||||
| E | 254 | 1.2% | ||||||||||
Figure 6.

Representation of dosimetric leaf gap for SRS-6 MV for Novalis Tx
EPID beam profiles dose differences showed agreement within ± 1.5%. Figures 8 and 9 show dose profiles for different linacs for 6-MV and 10-MV for crossline and inline profiles. The error bars indicate the percentage difference between the compared profiles.
Figure 8.

Dose profiles measured by electronic portal image device for three Novalis Tx and TrueBeam STx6-MV at 10 cm squared field size defined by multileaf collimator. Shaded regions represent global percentage differences
Figure 9.

Dose profiles measured by electronic portal image device for three Novalis Tx and TrueBeam STx10-MV at 10 cm squared field size defined by multileaf collimator. Shaded regions represent global percentage differences
Patient-specific QA
For prostate (low complexity) and H&N (high complexity) PSQA, the Delta4 phantom was irradiated on the Novalis Tx SN-6140 and TrueBeam STx SN-3169 machines, and the results were evaluated using different gamma-index criteria. The measurements obtained are given in Table 5.
Table 5.
Delta4 gamma index comparison between Novalis Tx and TrueBeam STx “beam-matched”
| Case | Criteria (%/mm) | Gamma index Novalis Tx 6140 (%) | Gamma index TrueBeam STx 3169 (%) | P |
|---|---|---|---|---|
| Prostate | 3/2 | 98.9 (0.8) | 99.5 (0.7) | 0.086 |
| 3/1 | 94.4 (2.0) | 96.1 (2.5) | 0.104 | |
| 2/2 | 97.0 (1.4) | 98.1 (1.0) | 0.060 | |
| H&N | 3/2 | 98.5 (1.4) | 98.4 (2.1) | 0.889 |
| 3/1 | 93.9 (3.7) | 96.2 (4.1) | 0.270 | |
| 2/2 | 95.0 (3.0) | 95.4 (4.7) | 0.877 |
H and N: Head-and-neck
Table 6 shows the comparisons between measured portal dosimetry total arcs in the four accelerators. No statistically significant differences were found between the three Novalis Tx (P > 0.05). TrueBeam EPID results showed higher gamma index criteria in all cases, an outcome which could be associated with the electronic improvements in a-Si 1200 EPID with respect to a-Si 1000.
Table 6.
Electronic portal image device gamma index comparison total arcs in Novalis Tx and TrueBeam STx “beam-matched”
| Criteria (%/mm) | Novalis Tx 5445 (%) | Novalis Tx 5479 (%) | Novalis Tx 6140 (%) | TrueBeam STx 3169 (%) |
|---|---|---|---|---|
| Prostate | ||||
| 3/2 | 97.1 (3.0) | 97.8 (1.3) | 99.4 (0.6) | |
| P | 0.143 | 0.027 | ||
| 3/1 | 92.9 (7.1) | 96.3 (1.6) | 99.2 (0.7) | |
| P | 0.123 | 0.012 | ||
| 2/2 | 95.3 (3.6) | 95.9 (1.2) | 98.4 (1.7) | |
| P | 0.164 | 0.019 | ||
| Breast | ||||
| 3/2 | 98.4 (0.6) | 98.8 (0.4) | 98.6 (0.6) | 99.4 (0.4) |
| P | 0.119 | 0.571 | 0.001 | |
| 3/1 | 94.3 (1.9) | 95.6 (1.0) | 94.9 (1.6) | 97.7 (0.9) |
| P | 0.119 | 0.150 | 0.008 | |
| 2/2 | 96.5 (0.9) | 97.0 (0.6) | 96.3 (1.3) | 98.0 (0.8) |
| P | 0.065 | 0.269 | 0.0001 | |
| H&N | ||||
| 3/2 | 96.0 (2.5) | 97.1 (1.8) | 97.0 (1.5) | 98.0 (1.9) |
| P | 0.279 | 0.911 | 0.306 | |
| 3/1 | 89.6 (5.4) | 93.4 (3.3) | 93.2 (2.6) | 95.2 (3.6) |
| P | 0.169 | 0.421 | 0.508 | |
| 2/2 | 92.5 (3.9) | 94.6 (2.3) | 93.8 (2.0) | 95.5 (3.5) |
| P | 0.073 | 0.888 | 0.283 |
H and N: Head-and-neck
Table 7 summarizes differences between segmented and total arcs for all linacs. No significant statistically differences were found between the three Novalis Tx (P > 0.05).
Table 7.
Electronic portal image device gamma index comparison total and segmented arcs in Novalis Tx and TrueBeam STx “beam-matched”
| Criteria (%/mm) | Arcs | Novalis Tx 5445 (%) | Novalis Tx 5479 (%) | Novalis Tx 6140 (%) | TrueBeam STx 3169 (%) |
|---|---|---|---|---|---|
| Prostate | |||||
| 3/2 | 1 | 97.1 (3.0) | 97.8 (1.3) | 99.4 (0.6) | |
| 3 | 97.8 (1.4) | 98.7 (0.7) | 99.7 (0.4) | ||
| P | 0.574 | 0.066 | 0.334 | ||
| 3/1 | 1 | 92.9 (7.1) | 96.3 (1.6) | 99.2 (0.7) | |
| 3 | 94.8 (2.1) | 94.8 (1.8) | 98.7 (1.1) | ||
| P | 0.423 | 0.063 | 0.267 | ||
| 2/2 | 1 | 95.3 (3.6) | 95.9 (1.2) | 98.4 (1.7) | |
| 3 | 95.8 (2.0) | 97.3 (1.0) | 98.9 (1.0) | ||
| P | 0.705 | 0.061 | 0.458 | ||
| Breast (mm) | |||||
| 3/2 | 1 | 98.4 (0.6) | 98.8 (0.4) | 98.6 (0.6) | 99.4 (0.4) |
| 2 | 98.9 (0.4) | 99.0 (0.3) | 98.8 (0.4) | 99.6 (0.3) | |
| P | 0.061 | 0.101 | 0.542 | 0.285 | |
| 3/1 | 1 | 94.3 (1.9) | 95.6 (1.0) | 94.9 (1.6) | 97.7 (0.9) |
| 2 | 96.4 (1.1) | 97.1 (0.6) | 96.5 (0.7) | 98.3 (0.8) | |
| P | 0.006 | 0.0007 | 0.015 | 0.159 | |
| 2/2 | 1 | 96.5 (0.9) | 97.0 (0.6) | 96.3 (1.3) | 98.0 (0.8) |
| 2 | 97.0 (0.8) | 97.3 (0.7) | 96.6 (0.8) | 98.5 (0.7) | |
| P | 0.167 | 0.391 | 0.635 | 0.124 | |
| H&N (mm) | |||||
| 3/2 | 1 | 96.0 (2.5) | 97.1 (1.8) | 97.0 (1.5) | 98.0 (1.9) |
| 3 | 96.4 (1.6) | 97.3 (1.0) | 97.5 (0.6) | 98.6 (1.2) | |
| P | 0.674 | 0.720 | 0.343 | 0.501 | |
| 3/1 | 1 | 89.6 (5.4) | 93.4 (3.3) | 93.2 (2.6) | 95.2 (3.6) |
| 3 | 90.3 (3.9) | 93.8 (1.9) | 94.3 (1.0) | 96.7 (2.2) | |
| P | 0.747 | 0.795 | 0.247 | 0.409 | |
| 2/2 | 1 | 92.5 (3.9) | 94.6 (2.3) | 93.8 (2.0) | 95.5 (3.5) |
| 3 | 93.4 (2.1) | 94.8 (1.4) | 94.4 (1.3) | 97.0 (1.6) | |
| P | 0.534 | 0.775 | 0.450 | 0.352 |
H and N: Head-and-neck
DISCUSSION
Dosimetric differences between the three Novalis Tx and TrueBeam STx in all energies we lower than 1%. These results are in concordance with different authors reporting a “beam-match” criterion of 1%.[1,2,3,16]
Dosimetric variations on beam profiles measured by EPID were found between a-Si 1000 and a-Si 1200 EPID for low-dose low gradient region. Variations were defined for inline profile and it was associated with the electronic improvements of PortalVision aSi-1200 where it provided backscatter shielding.
We did not find statistically significant differences between two “beam-matched” linacs (P > 0.05) in pretreatment PSQA using Delta4 phantom for all complexity plan levels. However, gamma index was slightly higher for TrueBeam STx than for Novalis Tx. This result showed that pretreatment PSQA performed in linacs under beam-matching tolerance limits (±1%) and measured with a linac-independent dosimetry system is the same.
In pretreatment PSQA for all linacs using EPID by total arcs, gamma passing rate (%) for all measurements was better than 90% (passing/fail criteria of 3%/2 mm, 3%/1 mm, and 2%/2 mm), thus showing there were no differences. This result allows having the same values in PSQA using both EPID types.
In PSQA by segmented arcs, all measurements were within the passing/fail criteria. The only significant difference was observed in aSi-1000 in middle complexity (breast) when the criterion was tighter in distance. This result could be related with the nonsymmetric dose delivery of semi arcs. In all other cases, there we no differences in two different portal dosimetry evaluation. However, aSi-1200 values we slightly higher than aSi-1000, which could be associated with the use of high-resolution novel diode detector aSi-1200. Probably, if an specific fluence prediction model is used for aSi-1200 EPID, the passing rate would improve even more.
CONCLUSIONS
The agreement of the dosimetric data between the Novalis Tx and TrueBeam STx allows us to confirm that a single beam model could be used for all equipment.
Pretreatment PSQA could be performed in any of the beam-matched linacs. This dosimetric equivalent characteristic improved the efficiency and workflow in the radiotherapy department. It also allows the capability of treatments in the beam-matched linacs.
Financial support and sponsorship
Nil.
Conflicts of interest
There are no conflicts of interest.
REFERENCES
- 1.Beyer GP. Commissioning measurements for photon beam data on three TrueBeam linear accelerators, and comparison with Trilogy and Clinac 2100 linear accelerators. J Appl Clin Med Phys. 2013;14:4077. doi: 10.1120/jacmp.v14i1.4077. [DOI] [PMC free article] [PubMed] [Google Scholar]
- 2.Sjöström D, Bjelkengren U, Ottosson W, Behrens CF. A beam-matching concept for medical linear accelerators. Acta Oncol. 2009;48:192–200. doi: 10.1080/02841860802258794. [DOI] [PubMed] [Google Scholar]
- 3.Hrbacek J, Depuydt T, Nulens A, Swinnen A, Van den Heuvel F. Quantitative evaluation of a beam-matching procedure using one-dimensional gamma analysis. Med Phys. 2007;34:2917–27. doi: 10.1118/1.2745239. [DOI] [PubMed] [Google Scholar]
- 4.Klein EE, Hanley J, Bayouth J, Yin FF, Simon W, Dresser S, et al. Task Group 142 report: Quality assurance of medical accelerators. Med Phys. 2009;36:4197–212. doi: 10.1118/1.3190392. [DOI] [PubMed] [Google Scholar]
- 5.Medical Physics. Institute of Radiooncology, KFJ Hospital Vienna. Dosimetric Parameters of the HD120 MLC. [Last accessed 20 2020 Jul 10]. Available from: https://www.wienkav.at/kav/kfj/91033454/physik/tb/tb_hd120.htm .
- 6.Lo SS, Teh BS, Lu JJ, Schefter TE. Stereotactic body radiation therapy, medical radiology. Radiat Oncol. (1st Ed) 2012;(4):53–65. doi: 10.1007/174_2012_635. [Google Scholar]
- 7.Infusino E. Clinical utility of RapidArc™ radiotherapy technology. Cancer Manag Res. 2015;7:345–56. doi: 10.2147/CMAR.S72775. [DOI] [PMC free article] [PubMed] [Google Scholar]
- 8.BrainLab. 1.8th ed. 1-2. Germany: Brainlab AG; 2015. BrainLab Physics, Technical Manual. [Google Scholar]
- 9.Kim J, Han JS, Hsia AT, Li S, Xu Z, Ryu S. Relationship between dosimetric leaf gap and dose calculation errors for high definition multi-leaf collimators in radiotherapy. Phys Imaging Radiat Oncol. 2018;5:31–6. doi: 10.1016/j.phro.2018.01.003. [DOI] [PMC free article] [PubMed] [Google Scholar]
- 10.Electronic Document P-1005924002-B, Varian Medical System. Palo Alto, USA: 2016. TrueBeam Technical Reference Guide: Volumen 2 -Imaging. [Google Scholar]
- 11.Scandidos. Delta4 by Scandidos. 2020. [Last accesed on 2020 Jul 01]. Available from: https://delta4family.com/products .
- 12.Sadagopan R, Bencomo JA, Martin RL, Nilsson G, Matzen T, Balter PA. Characterization and clinical evaluation of a novel IMRT quality assurance system. J Appl Clin Med Phys. 2009;10:104–19. doi: 10.1120/jacmp.v10i2.2928. [DOI] [PMC free article] [PubMed] [Google Scholar]
- 13.Mahtre V, Pilakkal S, Chadha P, Talpatra K. Dosimetric comparison of a-Si 1200 and a-Si 1000 electronic portal imager for intensity modulated radiation therapy (IMRT)? J Nucl Med Radiat Ther. 2018;9:1. DOI: 10.4172/2155-9619.1000354. [Google Scholar]
- 14.On-Board Imager (OBI) Advanced Imaging Maintenance Manual, Electronic Document AQ9 40 B505010R01B, Varian Medical System. Palo Alto, USA: 2015. [Google Scholar]
- 15.Van Esch A, Huyskens DP, Hirschi L, Baltes C. Optimized Varian aSi portal dosimetry: Development of datasets for collective use. J Appl Clin Med Phys. 2013;14:4286. doi: 10.1120/jacmp.v14i6.4286. [DOI] [PMC free article] [PubMed] [Google Scholar]
- 16.Bhangle JR, Narayanan VK, Kumar NK, Vaitheeswaran R. Dosimetric analysis of beam-matching procedure of two similar linear accelerators. J Med Phys. 2011;36:176–80. doi: 10.4103/0971-6203.83497. [DOI] [PMC free article] [PubMed] [Google Scholar]