

Abstract
Background:
Orthodontic science centers primarily on the growth, development and advancement of the craniofacial structures. Geometric morphometrics (GMM) is a new approach for shape identification in forensic sciences.
Purpose:
The aim of this study was to examine the shape variation in the Indian sample in order to assess sexual dimorphism by application of two-dimensional GMM.
Materials and Methods:
The sample comprised a total of 105 lateral cephalograms (54 males–51 females) of Angle's Class I malocclusion patients that were later subjected to principal component (PC) analysis and discriminant analysis.
Results:
The PC analysis showed over 96% of shape variation. The initial three PCs were statistically significant that depicted as 58.37% of total shape variability, with PC1 represent for the most significant variance 28.48%, PC2 described 18.83% and PC3 11.06%.
Conclusion:
Sex of an individual was clearly associated with occlusion of teeth and showed considerable variation. GMM is an alternative research tool and can be utilized for diagnosing individual characterization and classification of malocclusion.
Keywords: Craniofacial shape, forensic odontology, geometric morphometrics, human identification, lateral cephalogram
INTRODUCTION
Identification of an individual is one of the most ordinarily confronted challenges in the field of forensic investigations. Forensic and anthropological research is focused on a set of physical characteristics that are unique to each individual.[1] Sex determination is one of the initial characteristics examined by forensic specialist, the aim of which is to create a biologic profile that enables the person to be identified.[2] The skull is one of the parts of the skeleton most widely used for sex determination and analyses give varying degrees of accuracy by morphological features.[3,4] Studies have likewise demonstrated that determination of sex of an individual utilizing skull radiograph claims to have an accuracy of 80%–100%.[5,6,7]
Lateral cephalogram is an effectively accessible, cost-effective radiograph for measuring linear and angular dimensions that could offer detailed information on the morphological features of the skull in a single radiograph.[5,6] However, the conventional approach that involves only landmarks and straight lines, fails to capture proper changes in form, curvature and misinterprets actual growth and shows a vector displacement rather than a general distortion. To add to this, it may also create an error in the characterization of shape and size and could challenge the reliability of the interpreted result.[8,9,10] Therefore, in order to address these obstacles, our study focuses on geometric morphometric analysis.
Geometric morphometrics (GMM) is a mathematical shape study focused on Cartesian landmark coordinates for particular areas of structural, functional and development relevance.[11] The research paper focuses on the assessment of sexual dimorphism in skeletal Class I patients using GMM and the creation of a rigorous framework for the identification of sexual dimorphism.
MATERIALS AND METHODS
The present study is a retrospective quantitative analytical study wherein 105 lateral cephalograms were collected from the archive of Radiology Centre, Gujarat, India. The study was approved by the ethical committee of the institute. The samples were derived from a clinical Indian population (54 males–51 females; age range 18–50 years). Inclusion criteria embraced complete permanent dentitions without consideration of third molars. Exclusion criteria were dental agenesis except third molars, cleft palate, craniofacial syndrome, former orthodontic treatment and prosthetic therapy.
Nine anatomical landmarks were digitized using the TPSUtil and TPSdig 2.0 software (James Rohlf, State University of New York, Stony Brook, NY, USA), respectively [Table 1 and Figure 1]. The analysis of the 2D coordinates of landmarks was done in MorphJ (version 1.07a) software : (University of Manchester, Manchester M13 9PT, UK - http://www.flywings.org.uk/MorphoJ_page.htm). Partial Procustus Superimposition was performed to achieve a concensus configuration that provided a reference for the quantification of changes in shape, centroid size, and shape independent size measurement. Eventually, classifier for sex was added to the dataset to generate co-variance matrix which was then projected into the principal component (PC) analysis. PC analysis was performed to investigate patterns of shape variation between two classes. Procustus ANOVA was used to test the difference between individuals and also to calculate the error in the samples. Discriminant function analysis, along with cross-validation, was conducted to determine the consistency of the classification (morphological differences consistent with sex).
Table 1.
Definition of landmarks
| Landmark number | Landmark | Definition |
|---|---|---|
| 1 | Nasion | The most anterior point which midway in between the frontal and nasal bones on the fronto-nasal suture |
| 2 | ANS | The most anterior point on the maxilla at the level of the palate |
| 3 | A-point | The most posterior point on the curve between ANS and superior prosthion |
| 4 | B-point | The most posterior point of the bony curvature of the mandible below infradentale and above pogonion |
| 5 | Menton | The lowest point on the symphyseal outline of the chin |
| 6 | Gonion | The most posteroinferior point at the angle of the mandible |
| 7 | Porion | The highest bony point on the upper margin of the external auditory meatus |
| 8 | Sella | The point representing the midpoint of sella tursica or pituitary fossa |
| 9 | Posterior nasal spine | The most posterior point on the bony hard palate in the sagittal plane |
ANS: Anterior nasal spine
Figure 1.

Lateral radiograph with digitizing of the landmarks
RESULTS
Generalized procrustes analysis was performed to generate a matrix of coordinates of Procrustes, which superimposed landmarks accompanied by rescaling and rotating to the centroid size. Figure 2 shows scatterplot of the superimposed landmark configurations from Generalized procrustes analysis (GPA) that represented the morphological shapes of nine landmarks on all 105 lateral cephalogram radiographs.
Figure 2.
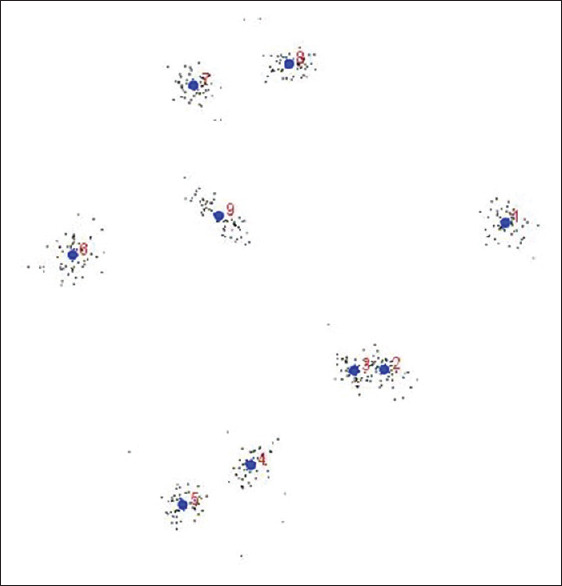
Generalized procrustes analysis of nine defined landmarks consisting of scatterplot of the superimposed landmark configurations
PC analysis displayed multivariate analysis and major features of shape variation in a data set. The initial ten PCs accounted for over 96% of shape variation [Table 2]. The first three PCs were statistically meaningful and portrayed as 58.37% of total shape variability, with PC1 account for the most significant variance 28.48%, PC2 described 18.83% and PC3 11.06% [Figure 3]. The lollipop graph with shape changes and percent variance of the first-three PC accounts for the most variance in the entire sample generated by MorphoJ. The lollipop graph represents the changes of its mean shape and its variation attributed to PC1 to PC3. All nine landmarks exhibited some level of variation with B-point, menton, gonion and porion, being the most prominent. Sella and posterior nasal spine showed little or no variance in the population, while the remaining landmarks exhibited moderate variance.
Table 2.
Eigenvalue and cumulative variance contribution of first 10 PCs
| Eigenvalue | Percentage variance | Percentage cumulative | |
|---|---|---|---|
| PC1 | 0.00248221 | 28.482 | 28.482 |
| PC2 | 0.00164153 | 18.835 | 47.317 |
| PC3 | 0.00096392 | 11.060 | 58.377 |
| PC4 | 0.00089329 | 10.250 | 68.627 |
| PC5 | 0.00068952 | 7.912 | 76.539 |
| PC6 | 0.00043450 | 4.986 | 81.524 |
| PC7 | 0.00040626 | 4.662 | 86.186 |
| PC8 | 0.00033301 | 3.821 | 90.007 |
| PC9 | 0.00030878 | 3.543 | 93.550 |
| PC10 | 0.00024020 | 2.756 | 96.306 |
Figure 3.

Graph showing first three principal components PC1 (a), PC2 (b) and PC3 (c) and the corresponding shape changes
The outputs of Procustus ANNOVA analysis were presented in separate ANOVA tables for centroid size and shape [Table 3]. In this study, there was significant differences in terms of centroid size (P = 0.5920), while the Goodall's F statistic (F) showed a difference in centroid size (F = 0.29). Significant differences in shape (P < 0.001) with a high F value of (F = 11.84) were also obtained. Discriminant analysis offered a correctly classified 84%value. The results showed that genetically modified can correctly classify male and female with an accuracy of 83.3%–86% respectively [Table 4]. It has been observed that maximum difference was seen in the nasion, posterior nasal spine, menton, gonion and the ramus region of the mandible.
Table 3.
Centroid size and shape
| Effect | Mean squares | Degree of freedom | Goodall’s F statistic | P |
|---|---|---|---|---|
| Centroid size | 5533.134809 | 1 | 0.29 | 0.5920 |
| Shape | 0.0066742508 | 14 | 11.84 | 0.0001* |
Table 4.
Cross classification result for gender assessment for total 105 lateral cephalogram with 9 landmarks
| Predicted as male | Predicted as female | Total | |
|---|---|---|---|
| Known male | 45 | 9 | 54 |
| Known female | 7 | 44 | 51 |
DISCUSSION
Sex estimation within human identification process is supported by the most dimorphic characteristics of certain osseous zones. On given occasions, however, morphological traits serve to support subjective determinations by the investigator when applying qualitative method. Craniofacial difference is contributed by variation in shape, size and inclination of the maxilla.[12] Geometric morphometric analysis is more reliable than conventional cephalometry as it provides visual morphology differences at the actual sites and does not require conventional reference lines.[13]
This current research found that the occlusion is a region of sexual determination when viewed using GMM. In this study, geometric morphometric method was used to assess the relative skeletal and dental shape components in the morphometric space using lateral cephalograms in skeletal Class I in adult Indian population. Determination of sex is significant in our study, suggesting a close correlation between craniofacial morphology and its occlusion. The present study classifies males and females 85% accurately. Discriminant function analysis is useful in identifying if the plot of landmarks is effective in category prediction.[14] A study conducted by Rajkumar et al. using same functions attained overall accuracy to be 70.83%, whereas for determining male and female, the accuracy was 75%–66.7%.
A similar study by Binnal and Devi in Indian population used cephalofacial parameters for identification of sex in lateral cephalogram that classified 88% as males and 84% as females using discriminant analysis.[15] Missier et al. in a study done on south Indian population on facial indices in lateral cephalogram obtained statistical significance with highest sex determining dependability of 78%.[16]
Although the abovementioned studies show large correlation to the present study, geometric morphometric analysis is more reliable than conventional cephalometric analysis. The limitations of our study include gender determination limited to one type of occlusion and the use of 2D data; despite this limitation, the study provides highly valuable result with gender dimorphism of overall 85% accuracy. The higher classification success of the concept can further be applied in other type of malocclusion (Class 2, Class 3) to determine gender dimorphism in larger population size. The same can be extended to perform population-based study as well. A suggestive study on computed tomography images can be preferred to examine the further accuracy on the defined data set.
CONCLUSION
Craniofacial shape can be correlated with occlusion of teeth for sexual dimorphism. The present results indicate the importance of using landmarks and multivariate analysis through the GMM on morphoscopic traits and traditional craniometry. Besides, it reaffirms that, using few landmarks, with correct anatomic location in the skull, permit detecting differences as predictors of sexual dimorphism even when only relatively small portions of the skeleton are available for study.
Financial support and sponsorship
Nil.
Conflicts of interest
There are no conflicts of interest.
Acknowledgment
The corresponding author would like to thank Dr. J. M. Vyas, Vice Chancellor, National Forensic Sciences University, for his consistent support and encouragement for the works conducted at Laboratory of Forensic Odontology, as well as Prof. S. O. Junare, Campus Director, and Dr. Dharmesh Silajiya, Dean, School of Forensic Science, for their immense administrative support and granting permission to conduct the research.
REFERENCES
- 1.Sassouni V. Dentofacial radiography in forensic dentistry. J DentRes. 1963;42:274–302. [Google Scholar]
- 2.Scheuer L. Application of osteology to forensic medicine. Clin Anat. 2002;15:297–312. doi: 10.1002/ca.10028. [DOI] [PubMed] [Google Scholar]
- 3.Walrath DE, Turner P, Bruzek J. Reliability test of the visual assessment of cranial traits for sex determination. Am J Phys Anthropol. 2004;125:132–7. doi: 10.1002/ajpa.10373. [DOI] [PubMed] [Google Scholar]
- 4.Williams BA, Rogers T. Evaluating the accuracy and precision of cranial morphological traits for sex determination. J Forensic Sci. 2006;51:729–35. doi: 10.1111/j.1556-4029.2006.00177.x. [DOI] [PubMed] [Google Scholar]
- 5.Patil KR, Mody RN. Determination of sex by discriminant function analysis and stature by regression analysis: A lateral cephalometric study. Forensic Sci Int. 2005;147:175–80. doi: 10.1016/j.forsciint.2004.09.071. [DOI] [PubMed] [Google Scholar]
- 6.Naikmasur VG, Shrivastava R, Mutalik S. Determination of sex in South Indians and immigrant Tibetans from cephalometric analysis and discriminant functions. Forensic Sci Int. 2010;197:6.e1–6. doi: 10.1016/j.forsciint.2009.12.052. [DOI] [PubMed] [Google Scholar]
- 7.Jaja BN, Ajua CO, Didia BC. Mastoid triangle for sex determination in adult Nigerian Population: A validation study. J Forensic Sci. 2013;58:1575–8. doi: 10.1111/1556-4029.12299. [DOI] [PubMed] [Google Scholar]
- 8.McIntyre GT, Mossey PA. Size and shape measurement in contemporary cephalometrics. Eur J Orthod. 2003;25:231–42. doi: 10.1093/ejo/25.3.231. [DOI] [PubMed] [Google Scholar]
- 9.Moyers RE, Bookstein FL. The inappropriateness of conventional cephalometrics. Am J Orthod. 1979;75:599–617. doi: 10.1016/0002-9416(79)90093-9. [DOI] [PubMed] [Google Scholar]
- 10.Bookstein FL. Reconsidering “The inappropriateness of conventional cephalometrics”. Am J Orthod Dentofacial Orthop. 2016;149:784–97. doi: 10.1016/j.ajodo.2015.12.011. [DOI] [PMC free article] [PubMed] [Google Scholar]
- 11.Cooke SB, Terhune CE. Form, function, and geometric morphometrics. Anat Rec (Hoboken) 2015;298:5–28. doi: 10.1002/ar.23065. [DOI] [PubMed] [Google Scholar]
- 12.Enlow DH, Kuroda T, Lewis AB. The morphological and morphogenetic basis for craniofacial form and pattern. Angle Orthod. 1971;41:161–88. doi: 10.1043/0003-3219(1971)041<0161:TMAMBF>2.0.CO;2. [DOI] [PubMed] [Google Scholar]
- 13.Franchi L, Baccetti T, McNamara JA., Jr Thin-plate spline analysis of mandibular growth. Angle Orthod. 2001;71:83–9. doi: 10.1043/0003-3219(2001)071<0083:TPSAOM>2.0.CO;2. [DOI] [PubMed] [Google Scholar]
- 14.Ousley SD. Forensic classification and biodistance in the 21st century: The rise of learning machines. In: Pilloud MA, Hefner JT, editors. Biological Distance Analysis: Forensic and Bioarchae-ological Perstpectives. San Diego, CA: Academic Press; 2016. pp. 197–212. [Google Scholar]
- 15.Binnal A, Devi BY. Identification of sex using lateral cephalogram: Role of cephalofacial parameters. J Indian Acad Oral Med Radiol. 2012;24:280–3. [Google Scholar]
- 16.Missier MS, Samuel SG, George AM. Facial indices in lateral cephalogram for sex prediction in Chennai population - A semi-novel study. J Forensic Dent Sci. 2018;10:151–7. doi: 10.4103/jfo.jfds_81_18. [DOI] [PMC free article] [PubMed] [Google Scholar]