Abstract
Background:
Smartphones provide a low-cost and efficient means to collect population level data. Several small studies have shown promise in predicting mood variability from smartphone-based sensor and usage data, but have not been generalized to nationally recruited samples. This study used passive smartphone data, demographic characteristics, and baseline depressive symptoms to predict prospective daily mood.
Method:
Daily phone usage data were collected passively from 271 Android phone users participating in a fully remote randomized controlled trial of depression treatment (BRIGHTEN). Participants completed daily Patient Health Questionnaire-2. A machine learning approach was used to predict daily mood for the entire sample and individual participants.
Results:
Sample-wide estimates showed a marginally significant association between physical mobility and self-reported daily mood (B = ‒0.04, P < 0.05), but the predictive models performed poorly for the sample as a whole (median R2 ~ 0). Focusing on individuals, 13.9% of participants showed significant association (FDR < 0.10) between a passive feature and daily mood. Personalized models combining features provided better prediction performance (median area under the curve [AUC] > 0.50) for 80.6% of participants and very strong prediction in a subset (median AUC > 0.80) for 11.8% of participants.
Conclusions:
Passive smartphone data with current features may not be suited for predicting daily mood at a population level because of the high degree of intra- and interindividual variation in phone usage patterns and daily mood ratings. Personalized models show encouraging early signs for predicting an individual's mood state changes, with GPS-derived mobility being the top most important feature in the present sample.
Keywords: ambulatory, classification, depression, geographic positioning systems, mobile health (mHealth), monitoring, passive data collection, smartphones
1 |. THE ACCURACY OF PASSIVE PHONE SENSORS IN PREDICTING DAILY MOOD
Depressive disorders are among the leading causes of disability and mortality globally (Whiteford et al., 2013). Although effective depression treatments exist (National Institute of Mental Health, 2018), the sequelae of depressive disorders continue to rise: 10 years ago, depression was the fifth leading cause of morbidity; now, it is the leading cause (World Health Organization, 2012). One factor complicating the detection and treatment of depression is the use of sporadically collected self-report assessments. Although validated measures like the Patient Health Questionnaire (PHQ)-9 are useful tools for measurement-based care, they only reflect perceived mood over the past 2 weeks, which is subject to temporal bias, and they typically only assess mood symptoms, not functional symptoms (Areàn, Hoa Ly, & Andersson, 2016). Health care organizations and clinicians face an additional challenge when patients fail to return for appointments: Is this because their condition has worsened or because it has improved substantially and there is no need for further treatment? As one recent study (Simon et al., 2013) found, both scenarios are true: some patients do not return because they are not responding to treatment and their condition is worsening; others do not return because they no longer have the need.
A partial solution to these problems is ecological momentary assessment (EMA; Passini, Pihet, Favez, & Schoebi, 2013), which may leverage smartphone data to enhance clinical decision-making for depression. By collecting information about mood and function as it occurs in real time, EMA captures continuous data regarding symptoms and behavior, which can create a more accurate and complete picture of treatment response. Mobile technology can serve as an acceptable, low-cost, and efficient means of collecting this information. These technologies have long supported active data capture, such as in the form of smartphone-based questionnaires, but in recent years, mobile health (mHealth) developers have turned to passive data collection via the use of device sensors, information from online calendars, and number of people contacted via telecommunication technologies (Onnela & Rauch, 2016; Torous, Kiang, Lorme, & Onnela, 2016). Use of text messages and email may serve as a proxy for engagement and social connectedness (Haftor & Mirijamdotter, 2010), an important measure of functioning and treatment response in depression. Several small studies have found preliminary evidence that activity based on smartphone global positioning system (GPS) and accelerometry can predict depressed mood (Burns et al., 2011; Canzian & Musolesi, 2015; Saeb et al., 2015). However, most recently, Saeb, Lattie, Kording, and Mohr (2017) found weak and inconsistent relationships between specific location data derived from location data (e.g., work, home, shopping, and place of worship) and symptoms of depression and anxiety. Thus, there is ongoing uncertainty regarding mobility and GPS data as predictors of mental health.
It is critical that studies of the predictive capacity of passive data move beyond small, homogeneous samples to better characterize the true potential of such assessment in the population as a whole. Our previous work demonstrated the feasibility and cost effectiveness of a large, fully remote randomized controlled trial (RCT) of depression intervention (Anguera, Jordan, Castaneda, Gazzaley, & Areán, 2016). This secondary analysis of the BRIGHTEN study examined whether features of typical smartphone usage (e.g., texts and calls) and sensor data (e.g., mobility based on GPS) predicted mood beyond the variance explained by demographics and baseline depressive symptoms. We used machine learning to predict future self-reported daily mood from passive data both within the entire sample and systematically examined interindividual heterogeneity using personalized N-of-1 models for predicting an individual's daily mood.
2 |. MATERIALS AND METHODS
2.1 |. Participants
Ethical approval for the BRIGHTEN study was given by the University of California, San Francisco (UCSF) Committee for Human Research. Participants were recruited across all 50 U.S. states via Craigslist, Google AdWords™, and Twitter™, as well as shuttle advertisements in the San Francisco Bay Area. Eligible participants were 18 years or older, able to read English, had a smartphone (Android or iPhone) with WiFi or 3G/4G capabilities, and obtained a score of five or more on the Patient Health Questionnaire-9 (PHQ-9; Kroenke, Spitzer, & Williams, 2001), and/or indicated that their depressive symptoms made it “very” or “extremely” difficult to function at work, home, or socially.
2.2 |. Procedures
A full description of the procedures for the BRIGHTEN can be found in (Anguera et al., 2016). Briefly, BRIGHTEN was a large, fully remote RCT of depression treatment. Interested participants were directed to an online portal where they watched an informational video describing the study and provided informed consent. Eligible participants were randomized to one of three apps. Treatment and assessment for the parent trial was delivered via participants’ smartphones. In addition to completing a demographics questionnaire and baseline PHQ-9, participants reported daily mood through an assessment app, and passive data were captured through Ginger.io app™. Participants engaged in treatment for the first month of the study, and continued follow-up assessments for 2 months posttreatment. Participants were paid $20 for each assessment at 4, 8, and 12 weeks.
2.3 |. Measures
Participants were prompted to complete a daily two-item Patient Health Questionnaire (PHQ-2; Löwe, Kroenke, & Gräfe, 2005) assessing depressive symptoms of mood (“Feeling down, depressed, or hopeless”) and anhedonia (“Little interest or pleasure in doing things”). The PHQ-2 items were modified to inquire about symptoms over the past 24 hr using a modified five-point rating scale (1 = not at all; 5 = most of the day; possible scores ranging from 2–10). Participants gave permission to have some measures of typical phone usage collected passively (i.e., collected in the background without user involvement). From the collected raw phone usage and sensor data, passive features (see Table 1) were generated by Ginger.io. Phone-based variables were aggregated into 24-hr periods. For each passive feature, we also computed the daily deviation from an individual’s median value of that feature.
TABLE 1.
Passive features generated from phone usage data by Ginger.io app
| Passive feature | Description |
|---|---|
| Mobility distance | Approximate distance in miles covered by the user by foot or by bike on a particular day as determined from location data |
| Mobility radius | Approximate radius of an imaginary circle encompassing the various locations that a user has traveled across on a particular day, in miles |
| Call duration | Total duration of all calls in seconds |
| SMS count | Number of SMS messages sent and received |
| SMS length | Total length of all SMS messages in characters |
| Aggregate communication | Total number of calls and total number of SMS messages on a particular day |
| Interaction diversity | Total number of unique individuals with whom a participant interacted through phone calls or SMS messages on a particular day |
| Missed interactions | Total number of calls unanswered for a user on a particular day |
| Unreturned calls | The number of missed calls without an associated call back |
2.4 |. Data analyses
Prior to the analysis, any missing passive or self-reported mood data were imputed using a participant's median weekly value per feature. PHQ-2 scores were aligned to the passive data so that they referred to the same 24-hr period. We used generalized estimating equations (GEEs; Liang & Zeger, 1986) to assess the marginal association between longitudinal daily mood and passive phone data in the sample. GEE models extend generalized linear models to longitudinal or clustered data using a working correlation structure that accounts for within-subject correlations of daily responses, thereby estimating robust and unbiased standard errors compared to ordinary least squares regression (Ballinger, 2004; Liang & Zeger, 1986). For machine learning analyses predicting daily mood from phone-based features, we used an ensemble-based method called random forests (Breiman, 2001), which show robust and strong prediction across many types of data, particularly in the biomedical domain (Boulesteix, Janitza, Kruppa, & König, 2012; Chen & Ishwaran, 2012). A random forest model bootstraps many versions of the data via sampling with replacement, and then on each new dataset, the model fits a shallow decision tree, which is an alternative form of regression that allows nonlinear associations and complex interactions. It is an ensemble method because the decision tree models across many bootstrapped datasets are combined into a final prediction model. In our analyses, three classes of predictors were included in the models: (a) baseline demographics (gender, age, marital status, and race/ethnicity), (b) baseline PHQ-9 score, and (c) daily phone usage features. These predictor classes were added sequentially across three models.
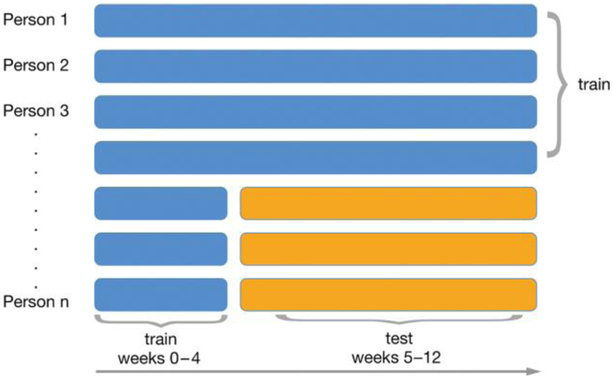
We predicted daily PHQ-2 score for both the whole sample and each individual. In each case, models were trained to predict a person’s daily mood based on the passive data from the previous 24 hr’ phone usage and the available demographic variables for the cohort. The primary statistic of interest for the marginal model was R2, assessing how close the model predictions are to the true values in the test data. Given that the PHQ-2 response scale was modified for daily responding in this study, there are no established clinical cutoffs. Therefore, for these exploratory person-specific models, we predicted two discrete mood state groups: those with no symptomatology (PHQ-2 = 2) and those reporting symptoms (PHQ-2 ≥ 3). Person-specific classification models were evaluated using an AUC statistic (Beck & Shultz, 1986). To assess the robustness of the predictions, we used a repeated sampling approach (100 random training-test data splits), where each sample included a 70/30 split of training and test data. For the marginal model (whole sample), train/test splits used subject-wise data splitting (Neto et al., 2017; Saeb et al, 2017) to avoid overestimating model performance. We also investigated if the algorithm performance improved by learning from early weeks in the “test data”; that is, participant phone usage pattern for early treatment (1–4 weeks) before it began predicting future mood (5–12 weeks) for the marginal model including the entire sample. The basic train/test approach of the analyses is shown in Figure 1. All analyses were done using R (R Core Team, 2017) and made use of the ranger package (Wright & Ziegler, 2017) for random forests models.
FIGURE 1.
Schematic diagram showing the overall data analysis strategy. For 70% of users, all data were used for training, whereas in the 30% of users in the test set, a variable amount of initial weekly data was also used for training, and the latter data (yellow) was used to test the model predictions
3 |. RESULTS
3.1 |. Data summary
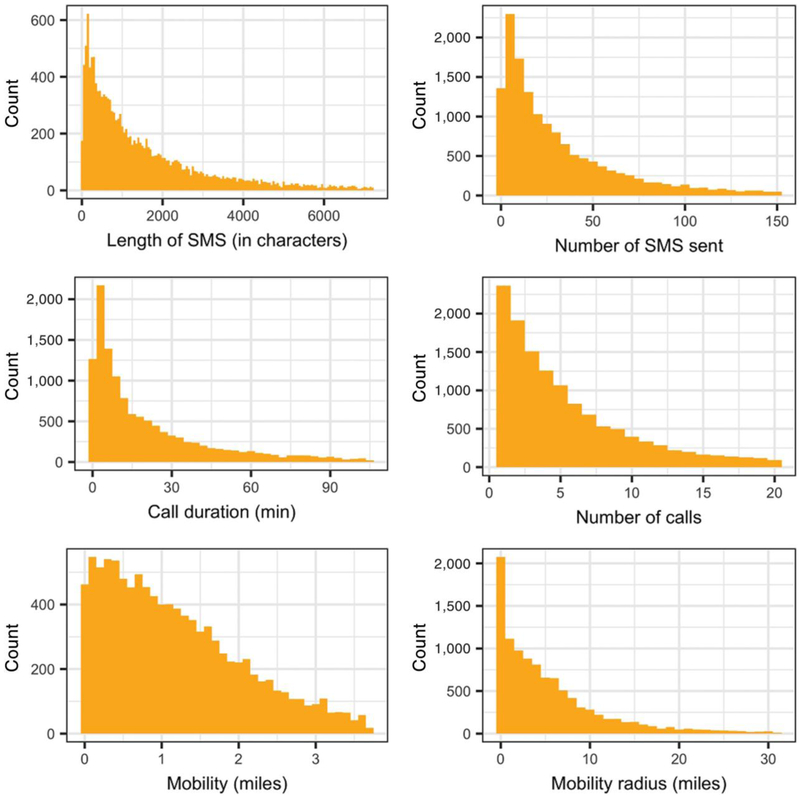
The present sample includes a subset of participants from the original BRIGHTEN sample with Android phones (N = 271) that allowed broader array of passive features (calls, messages, and GPS) to be compared with PHQ-2. Figure 2 shows the summary distribution of select few passive features, and Table 2 shows the summary statistics for all collected passive features.
FIGURE 2.
Aggregate per-day histograms of select passive features as collected from the BRIGHTEN cohort. For plotting purposes, the data from lower and upper 5% quantile tails were filtered
TABLE 2.
Passive data summary statistics
| Statistic | Mean | SD | Minimum | 25th percentile |
Median | 75th percentile |
Maximum |
|---|---|---|---|---|---|---|---|
| Unreturned calls | 0.88 | 1.62 | 0 | 0 | 0 | 1 | 27 |
| Missed interactions | 1.31 | 2.36 | 0 | 0 | 1 | 2 | 76 |
| Mobility (miles) | 1.32 | 1.34 | 0.00 | 0.39 | 1.00 | 1.84 | 18.28 |
| Call count | 5.59 | 7.81 | 0 | 1 | 3 | 7 | 97 |
| Interaction diversity | 5.99 | 4.97 | 0 | 3 | 5 | 8 | 52 |
| Mobility radius (miles) | 14.18 | 111.83 | 0.00 | 0.64 | 3.59 | 8.22 | 7,012.50 |
| SMS count | 38.58 | 66.33 | 0 | 4 | 17 | 45 | 1,507 |
| Aggregate communication | 44.21 | 68.06 | 0 | 8 | 23 | 53 | 1,510 |
| Call duration (s) | 1,425.69 | 2,896.46 | 0 | 32 | 383 | 1,537 | 58,334 |
| SMS length (characters) | 1,872.75 | 3,139.62 | 0 | 218 | 844 | 2,170 | 47,741 |
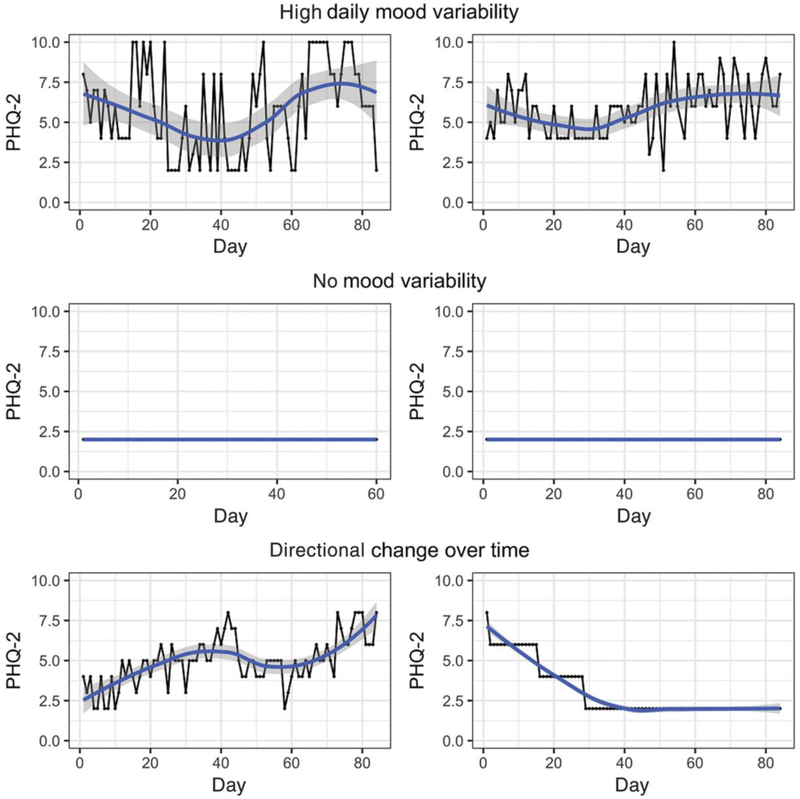
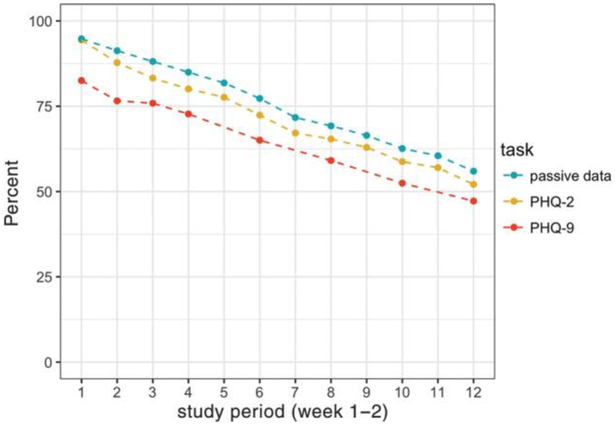
The average age of the sample was 33.4 years (SD = 10.7) and 77.8% of participants were female. The cohort was 57.5% Non-Hispanic White, 16.2% African American/Black, and 15.1% Hispanic. A significant proportion of the participants (35.2%) reported making under $30,000 annually, and a majority (54.2%) said they couldn't make ends meet with their current income. Daily reported mood using the modified PHQ-2 was 4.48 (SD = 2.3, range: 2–10), with wide variability within and between participants. Figure 3 shows three different mood trends from six select participants. Participant attrition was linear (Figure 4) over the study period. There was no direct association between attrition and assessment incentives at weeks 4, 8, and 12. We considered a participant “active” during the week if any passive or active data were recorded at least once.
FIGURE 3.
Variations in daily self-reported mood of a select few individuals
FIGURE 4.
Overall participant retention rate in the study stratified by different kinds of data collected through active tasks (self-reported Patient Health Questionnaire [PHQ]-2 and PHQ-9 surveys) and passive phone usage (passive data)
3.2 |. Association between self-reported daily mood and phone usage
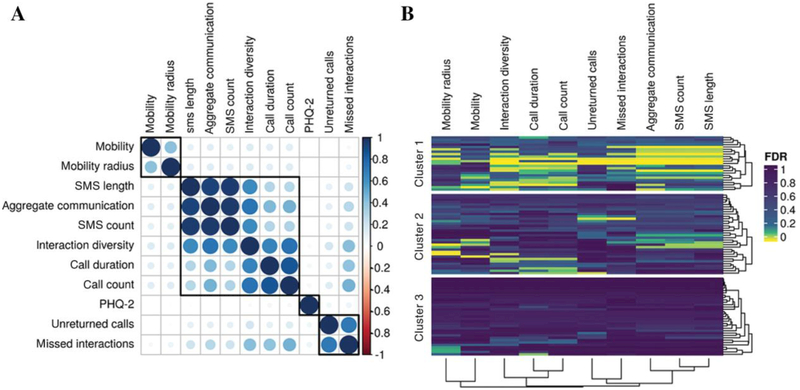
Pairwise correlations among passive features showed three clusters based on mobility, phone usage logs, and missed calls. Overall, no significant correlations were found (Figure 5) between passive features and PHQ-2. To account for within-subject correlations for longitudinal responses, we used a marginal GEE model with a first order autoregressive working correlation structure. A limited association between PHQ-2 and GPS-derived mobility was seen (P = 0.04). Call count, number of SMS sent, and other derived features showed nonsignificant borderline association (P < 0.10) with PHQ-2 (see Table 3).
FIGURE 5.
(a) A correlation plot of pairwise Spearman correlations between passive features and self-reported mood (PHQ-2) at the cohort level. (b) Personalized (N-of-1) Spearman correlations P-values (FDR corrected) between self-reported mood (PHQ-2) and passive features. Cluster 1 shows individuals that have a broad association between the majority of the passive features and daily mood, cluster 2 highlights a subset of individuals that show a weaker, nonuniform association between passive features and daily mood, and cluster 3 demarcates a subgroup of individuals that show no relationship between daily mood and passive tracking of phone usage
TABLE 3.
Model estimates and standard error of passive data features using a GEE model
| Model estimates (SE) | |
|---|---|
| (Intercept) | 4.36 (0.38)*** |
| Unreturned calls | −0.01 (0.02) |
| Mobility | −0.04 (0.02)* |
| SMS length | 0.00 (0.00) |
| Call duration | 0.00 (0.00) |
| Interaction diversity | −0.01 (0.01)† |
| Missed interactions | 0.02 (0.01)† |
| Aggregate communication | −0.05 (0.03)† |
| SMS count | −0.06 (0.03)† |
| Mobility radius | 0.00 (0.00) |
| Call count | 0.06 (0.03)† |
| Age | 0.01 (0.01) |
| Gender: Male | −0.06 (0.25) |
p < .001,
p < .01,
p < .05,
P < .1.
3.3 |. Predicting daily mood (PHQ-2) from daily phone usage
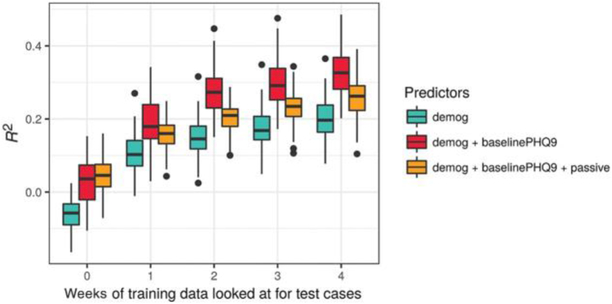
Using the random forest approach, three models were fit utilizing demographics, baseline PHQ-9, and passive phone usage features additively. Prediction results are shown in Figure 6 for the three models by number of weeks of additional training data on the test set. Several interesting patterns appear. First, the results at week 0 reflect models developed on 70% of participants, which are then tested on the remaining 30% of participants, without any additional training on this 30%. These models are uniformly poor with median R2 close to zero. Second, all models get progressively better (i.e., increasing R2) with additional weeks of preliminary data from test set data. Note that this pattern is also true for models including only baseline covariates, which may indicate that these models are more accurately learning an individual’s stable (i.e., mean) mood with additional weeks of training data. Taken together, these results suggest that whatever associations there are between predictors and mood, they tend to be fairly unique to individuals. Finally, contrary to hypothesis, the passive phone features do not enhance prediction, over and above demographics and baseline PHQ-9. For these marginal results, the passive phone features appear to worsen prediction.
FIGURE 6.
Comparison of random forest prediction models based on R2 for different feature sets. The x-axis shows the performance of iterative model retraining using the data from test users for week 0 (no test data used for training) to 1–4
3.4 |. Personalized mood prediction
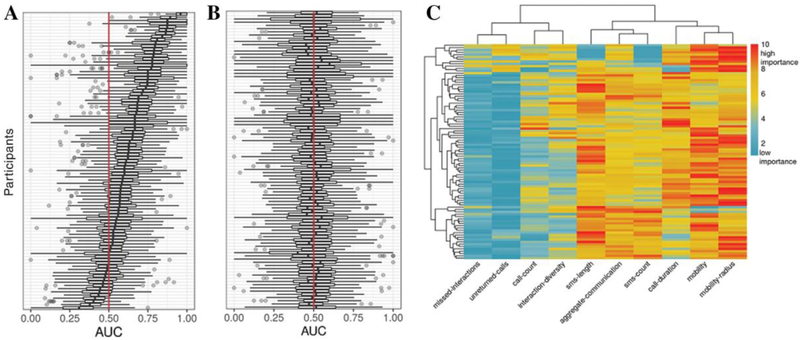
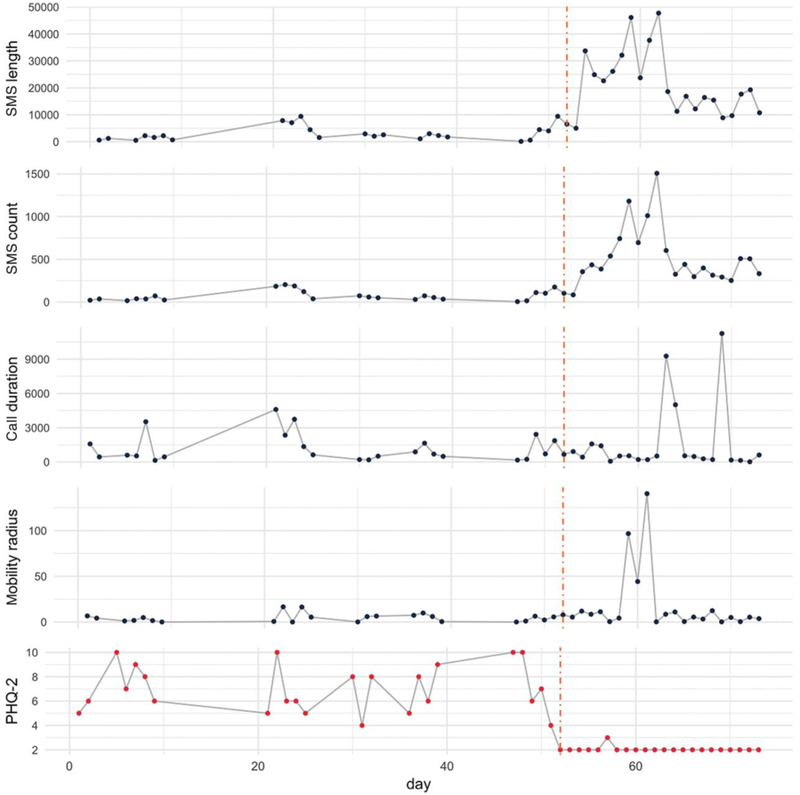
A subset of 93 participants was selected for individual prediction models based on the following criteria: (a) variability in daily mood (an interquartile difference in PHQ-2 of at least 1), (b) distribution of class labels (minimum of 20% in mild or severe state), and (c) at least 15 days of longitudinal data. These individual-level correlations showed significant heterogeneity between passive features and daily mood (Figure 5b). A subset of 13.9% of these participants showed significant association (FDR < 0.10) between one of the passive features and daily mood. The random forest based classification was able to predict PHQ-2 state better than chance for 80.6% of individuals (75 out of 93; median AUC > 0.50, 100 random splits) from passive features alone. Eleven individuals had median AUC greater than 0.80, demonstrating high predictive power in inferring daily mood from phone usage patterns. To assess the sensitivity of our predictions, we shuffled true PHQ-2 state labels. The overall trend between true and shuffled response (Figures 7b and 7c, respectively) shows a viable signal in the passive data for predicting PHQ-2. However, power is greatly reduced by running individual prediction models, as seen in permutation-based tests (see Supporting Information). Ensemble methods like random forests do not lend themselves to straightforward interpretation of predictors (e.g., there are no regression coefficients), but it is possible to examine which predictors appear most “important” in the prediction, using the Gini index (Strobl, Boulesteix, & Augustin, 2007). Although no passive feature uniformly stood out, GPS-based mobility distance and mobility radius were the top two predictors of daily PHQ-2. The heatmap display of predictor importance (Figure 7d) highlights the heterogeneity of passive features for predicting PHQ-2 across individuals. For illustrative purposes, Figure 8 shows daily PHQ-2 and passive data for a select individual with >0.9 median AUC score.
FIGURE 7.
(a) Distribution of area under the curve (AUC) scores for an individual’s daily mood prediction (low/high) based on random forest models (N = 93). (b) Null distribution for AUC scores based on shuffled daily mood labels. Red line indicates AUC = 0.50 (equivalent to a probability of random coin toss). (c) Top predictive features based on average ranks (1 = low importance and 10 = high importance) of variable importance derived using Gini index impurity scores from personalized random forest models
FIGURE 8.
Twelve weeks self-reported daily mood (Patient Health Questionnaire [PHQ]-2) score and a select few passive features of an individual participant in the BRIGHTEN study
4 |. DISCUSSION
Our findings are particularly relevant given the upsurge of interest in using digital technologies to augment the clinical care of depression. Specifically, our study shows that passive data offer the most promise in predicting depressive symptoms at an individual level, whereas there is little evidence for an overarching prediction algorithm that is applicable to a wide variety of individuals. Although some smaller studies (Ghandeharioun et al., 2017, Saeb et al., 2015, Wahle, Kowatsch, Fleisch, Rufer, & Weidt, 2016, Wang et al., 2014) have found associations between passive mobility data and severity of depressive symptoms, our examination of a large, nationally recruited sample of individuals with depressive symptoms did not show a meaningful relationship between phone usage features and daily mood at the cohort level. We believe further large-scale studies (N > 10,000) and longer data collection (>12 weeks) are needed to stratify robust signatures of digital phenotypes from passive data and contextualize their association to mood. Our findings indicate GPS mobility may have the greatest potential to harness mobile technology to infer mood. Previous demonstrations (Canzian & Musolesi, 2015; Saeb et al., 2015) used GPS data from smartphones to predict depressive symptoms based on features such as location preference and mobility patterns. However, these demonstrations were on smaller samples (<40 individuals) and represent only the first steps in understanding the ability of passive mobility data to make inferences about depressive symptoms.
In the context of these mixed findings, our results shed light on the potential for smartphones in measurement-based care for depression. Notably, our data highlight that mood states are best predicted at an individualized level by looking at one's own deviation than by comparing one against a population norm. We also observed a high degree of intra- and interindividual variance in daily phone usage and mood ratings. This reinforces the notion that optimal clinical decision-making for depression should be based on more regular monitoring of symptoms and treatment outcomes, rather than infrequent self-reports obtained at clinic visits. Measurement-based care is intended to provide feedback to both patients and providers about treatment response and navigate treatment goals accordingly; when done well, such measurement may facilitate patient-provider communication and shared decision-making (Scott & Lewis, 2015). Future trials may consider the relative importance of various types of passively collected data for depression care; for example, the role of both overall mobility and specific location (e.g., home, work, and recreation) for behavioral activation and the importance of phone usage to monitor social engagement. Moreover, measurement-based care is best integrated with existing clinic infrastructures (e.g., electronic health records) to alleviate the burden of routine collection and supplement clinical decision-making. Although smartphone technology may allow for novel methods of data collection, future research is needed to better integrate such passive data collection into existing clinic structures and processes (Hallgren, Bauer, & Atkins, 2017).
Despite the promise, the clinical utility of passive sensing to predict a person's mood and overall behavioral health has a long way to go (Renn, Pratap, Atkins, Mooney, & Areán, 2018). There are several constraints that mHealth researchers should be aware of: (1) Learning robust, generalizable behavior patterns from data: With intensive longitudinal data from phone usage, a risk is that we learn highly idiographic associations between passive phone features and daily mood, whereas the overarching research goal is to learn about generalizable patterns that are applicable to populations of individuals. Care is needed in running and evaluating machine learning models to avoid learning idiosyncratic digital fingerprints rather than broadly applicable associations of the passive features with mood fluctuations (Neto et al., 2017, Saeb et al, 2017). (2) Platform heterogeneity—Significant differences between iOS and Android platforms impact passive data features, granularity, and sampling rate. iOS, for example, restricts acquisition of phone and messaging logs. (3) Passive data—Until we are able to reliably infer behavior patterns from passive data features, raw data sampled at high frequency should be stored and analyzed, rather than proprietary summary statistics from apps. Further work is needed to explore new passive features such as number of notifications accepted, screen usage, mobile apps used in a day, total keyboard strokes, reaction time, etc. (Mehrotra et al., 2017). The interplay of these features may help build robust digital phenotypes of mood. (4) Data contextuality—Context, quality, and quantity of user interaction with smartphones may be meaningful. Saeb et al., 2017 recently showed the importance of the nature of an individual's location (e.g., house of worship and recreation) to better understand how the contexts of physical locations relate to depression. Similarly, missed and unreturned calls from friends and family should be weighted more heavily in comparison to missed calls from unknown numbers. (5) User engagement—To enable robust learning from the rich but noisy continuous passive data streams, it requires both deep (e.g., number of days) and large (e.g., number of users) data. Although large mHealth (Dorsey et al., 2017) studies can provide powerful means to recruit a large number of individuals, there are significant challenges in user retention and compliance with study protocols that often result in sparse data collection. We believe mHealth apps that empathize with users address their daily needs and clearly articulate data security; sharing and research usage policy will help gain long-term user trust and engagement.
Strengths of the present study leverage those of the BRIGHTEN parent study. We recruited one of the largest samples to date investigating passive phone data and mood. Furthermore, the present analysis applied machine learning to learn nonlinear behavior patterns from phone data to predict daily mood. Nonetheless, our findings must be considered in light of limitations. Smartphone-specific operating system limitations restricted our analyses to Android users only. We found that data acquisition was easier than the analysis and, in some cases, analysis was prohibited due to data sparsity. The average participant retention rate (51.74% after 12 weeks of study completion) was significantly higher than other recent mHealth studies (7–15%; Chan et al., 2017; Dorsey et al., 2017; McConnell et al., 2017). However, the present study offered financial incentives to participants for each completed assessment, which is not typical of these other studies and likely influenced engagement and retention in the study. Finally, the present sample is not necessarily representative of the underlying population of adults with mild-to-moderate depressive symptoms. Notably, our study was majority female, although this corresponds to the greater prevalence of depressive disorders in women relative to men (Kessler et al., 2003).
5 |. CONCLUSION
Passive data streams from phones offer a potentially unobtrusive way to facilitate clinical care for depression by assessing treatment response and triggering follow-up assessment and treatment modification. Ubiquitous smartphone technology facilitates the scalability of such approaches at a fraction of the cost of in-clinic visits. There is growing preliminary evidence that daily mobility patterns obtained from phone sensors are associated with depressive symptom severity, although this is most salient when assessing individual change over a course of treatment. Additional large-scale studies (N > 10,000) with long-term user engagement are needed to uncover the passive features best suited to detecting and monitoring changes in depressive symptoms and related functioning.
Supplementary Material
Acknowledgments
Funding information
This research was supported by grants (R34MH100466 and T32MH073553) from the National Institute of Mental Health.
Footnotes
SUPPORTING INFORMATION
Additional supporting information may be found online in the Supporting Information section at the end of the article.
DISCLOSURES
Mr. Pratap has nothing to disclose. Dr. Atkins reports being a co-founder of Lyssn.io, a business, which is commercializing spoken language technologies for psychotherapy. There is no direct connection between this company and the work presented here. Dr. Renn reports a training grant from National Institute of Mental Health (NIMH), during the conduct of the study; Dr. Tanana reports being a co-founder of Lyssn.io. There is no direct connection between this company and the work presented here. Dr. Mooney has nothing to disclose. Dr. Anguera has nothing to disclose. Dr. Areán reports consulting with Verily on mental health and technology projects. All the data in this study were collected before she worked with Verily.
REFERENCES
- Anguera JA, Jordan JT, Castaneda D, Gazzaley A, & Areán PA (2016). Conducting a fully mobile and randomised clinical trial for depression: Access, engagement and expense. BMJ Innovations, 2(1)14–21. [DOI] [PMC free article] [PubMed] [Google Scholar]
- Areàn PA, Hoa Ly K, & Andersson G (2016). Mobile technology for mental health assessment. Dialogues in Clinical Neuroscience, 18(2), 163–169. [DOI] [PMC free article] [PubMed] [Google Scholar]
- Ballinger GA (2004). Using generalized estimating equations for longitudinal data analysis. Organizational Research Methods, 7(2), 127–150. [Google Scholar]
- Beck JR, & Shultz EK (1986). The use of relative operating characteristic (ROC) curves in test performance evaluation. Archives of Pathology & Laboratory Medicine, 110(1), 13–20. [PubMed] [Google Scholar]
- Boulesteix A-L, Janitza S, Kruppa J, & König IR (2012). Overview of random forest methodology and practical guidance with emphasis on computational biology and bioinformatics. Wiley Interdisciplinary Reviews. Data Mining and Knowledge Discovery, 2(6), 493–507. [Google Scholar]
- Breiman L (2001). Random forests. Machine Learning, 45(1), 5–32. [Google Scholar]
- Burns MN, Begale M, Duffecy J, Gergle D, Karr CJ, Giangrande E, & Mohr DC (2011). Harnessing context sensing to develop a mobile intervention for depression. Journal of Medical Internet Research, 13(3), e55. [DOI] [PMC free article] [PubMed] [Google Scholar]
- Canzian L & Musolesi M (2015). Trajectories of depression: Unobtrusive monitoring of depressive states by means of smartphone mobility traces analysis. Proceedings of the 2015 ACM International Joint Conference on Pervasive and Ubiquitous Computing—UbiComp ‘15, Osaka, Japan, 1293–1304. 10.1145/2750858.2805845 [DOI] [Google Scholar]
- Chan Y-FY, Wang P, Rogers L, Tignor N, Zweig M, Hershman SG, … Schadt EE (2017). The Asthma Mobile Health Study, a large-scale clinical observational study using Research Kit. Nature Biotechnology, 35(4), 354–362. [DOI] [PMC free article] [PubMed] [Google Scholar]
- Chen X, & Ishwaran H (2012). Random forests for genomic data analysis. Genomics, 99(6), 323–329. [DOI] [PMC free article] [PubMed] [Google Scholar]
- Dorsey ER, Ray Dorsey E, Yvonne C han Y-F, McConnell MV, Shaw SY, Trister AD, & Friend SH (2017). The use of smartphones for health research. Academic Medicine: Journal of the Association of American Medical Colleges, 92(2), 157–160. [DOI] [PubMed] [Google Scholar]
- Neto EC, Pratap A, Perumal TM, Tummalacherla M, Bot BM, Mangravite L, & Omberg L (2017). Detecting confounding due to subject identification in clinical machine learning diagnostic applications: A permutation test approach. arXiv, Retrieved from https://arxiv.org/abs/1712.03120 [Google Scholar]
- Ghandeharioun A, Fedor S, Sangermano L, Ionescu D, Alpert J, Dale C,… Picard R (2017). Objective assessment of depressive symptoms with machine learning and wearable sensors data. ACII2017, Retrieved from https://affect.media.mit.edu/pdfs/17.ghandeharioun_etal_objective_ACII.pdf [Google Scholar]
- Haftor D, & Mirijamdotter A (2010). Information and communication technologies, society and human beings: Theory and framework. Hershey, PA: IGI Global. [Google Scholar]
- Hallgren KA, Bauer AM, & Atkins DC (2017). Digital technology and clinical decision making in depression treatment: Current findings and future opportunities. Depression and Anxiety, 34(6), 494–501. [DOI] [PMC free article] [PubMed] [Google Scholar]
- Kessler RC, Berglund P, Demler O, Jin R, Koretz D, Merikangas KR… National Comorbidity Survey Replication. (2003). The epidemiology of major depressive disorder: Results from the National Comorbidity Survey Replication (NCS-R). JAMA: The Journal of the American Medical Association, 289(23), 3095–3105. [DOI] [PubMed] [Google Scholar]
- Kroenke K, Spitzer RL, & Williams JB (2001). The PHQ-9: Validity of a brief depression severity measure. Journal of General Internal Medicine, 16(9), 606–613. [DOI] [PMC free article] [PubMed] [Google Scholar]
- Liang K-Y, & Zeger SL (1986). Longitudinal data analysis using generalized linear models. Biometrika, 73(1), 13–22. [Google Scholar]
- Löwe B, Kroenke K, & Gräfe K (2005). Detecting and monitoring depression with a two-item questionnaire (PHQ-2). Journal of Psychosomatic Research, 58(2), 163–171. [DOI] [PubMed] [Google Scholar]
- McConnell MV, Shcherbina A, Pavlovic A, Homburger JR, Goldfeder RL, Waggot D, ⋯ Ashley EA (2017). Feasibility of obtaining measures of lifestyle from a smartphone app: The myheart counts cardiovascular health study. JAMA Cardiology, 2(1), 67–76. [DOI] [PubMed] [Google Scholar]
- Mehrotra A, Müller SR, Harari GM, Gosling SD, Mascolo C, Musolesi M, & Rentfrow PJ (2017). Understanding the role of places and activities on mobile phone interaction and usage patterns. Proceedings of the ACM on Interactive, Mobile, Wearable and Ubiquitous Technologies, 1(3), 1–22. [Google Scholar]
- National Institute of Mental Health. (2018). Depression. Retrieved from https://www.nimh.nih.gov/health/topics/depression/index.shtml
- World Health Organization. (2012). Depression: A global crisis. Retrieved from https://www.who.int/mental_health/management/depression/wfmh_paper_depression_wmhd_2012.pdf
- Onnela J-P, & Rauch SL (2016). Harnessing smartphone-based digital phenotyping to enhance behavioral and mental health. Neuropsychopharmacology: Official Publication of the American College of Neuropsychopharmacology, 41(7), 1691–1696. [DOI] [PMC free article] [PubMed] [Google Scholar]
- Passini CM, Pihet S, Favez N, & Schoebi D (2013). Ecological momen-tary assessment parenting scale. PsycTESTS Dataset. 10.1037/t38554-000 [DOI] [Google Scholar]
- Saeb S, Lattie EG, Kording KP, & Mohr DC (2017). Mobile phone detection of semantic location and its relationship to depression and anxiety. JMIR mHealth and uHealth, 5(8), e112. [DOI] [PMC free article] [PubMed] [Google Scholar]
- Saeb S, Lonini L, Jayaraman A, Mohr DC, & Kording KP (2017). The need to approximate the use-case in clinical machine learning. Giga-Science, 6(5), 1–9. [DOI] [PMC free article] [PubMed] [Google Scholar]
- Saeb S, Zhang M, Karr CJ, Schueller SM, Corden ME, Kording KP, & Mohr DC (2015). Mobile phone sensor correlates of depressive symptom severity in daily-life behavior: An exploratory study. Journal of Medical Internet Research, 17(7), e175. [DOI] [PMC free article] [PubMed] [Google Scholar]
- Scott K, & Lewis CC (2015). Using measurement-based care to enhance any treatment. Cognitive and Behavioral Practice, 22(1), 49–59. [DOI] [PMC free article] [PubMed] [Google Scholar]
- Simon GE, Rutter CM, Peterson D, Oliver M, Whiteside U, Operskalski B, & Ludman EJ (2013). Does response on the PHQ-9 depression questionnaire predict subsequent suicide attempt or suicide death? Psychiatric Services, 64(12), 1195–1202. [DOI] [PMC free article] [PubMed] [Google Scholar]
- Strobl C, Boulesteix A-L, & Augustin T (2007). Unbiased split selection for classification trees based on the Gini Index. Computational Statistics & Data Analysis, 52(1), 483–501. [Google Scholar]
- Torous J, Kiang MV, Lorme J, & Onnela J-P (2016). New tools for new research in psychiatry: A scalable and customizable platform to empower data driven smartphone research. JMIR Mental Health, 3(2), e16. [DOI] [PMC free article] [PubMed] [Google Scholar]
- Wahle F, Kowatsch T, Fleisch E, Rufer M, & Weidt S (2016). Mobile sensing and support for people with depression: A pilot trial in the wild. JMIR mHealth and uHealth, 4(3), e111. [DOI] [PMC free article] [PubMed] [Google Scholar]
- Wang R, Chen F, Chen Z, Li T, Harari G, Tignor S, ⋯ Campbell AT (2014). StudentLife: Assessing mental health, academic performance and behavioral trends of college students using smartphones. Proceedings of the 2014 ACM International Joint Conference on Pervasive and Ubiquitous Computing - UbiComp ‘14 Adjunct, Osaka, Japan, 3–14. 10.1007/978-3-319-51394-2_2 [DOI] [Google Scholar]
- R Core Team. (2017). R: A language and environment for statistical computing. Vienna, Austria: R Foundation for Statistical Computing. Retrieved from https://www.R-project.org/ [Google Scholar]
- Whiteford HA, Degenhardt L, Rehm J, Baxter AJ, Ferrari AJ, Erskine HE, … Vos T (2013). Global burden of disease attributable to mental and substance use disorders: Findings from the Global Burden of Disease Study 2010. The Lancet, 382(9904), 1575–1586. [DOI] [PubMed] [Google Scholar]
- Wright MN, & Ziegler A (2017). ranger: A fast implementation of random forests for high dimensional data in C and R. Journal of Statistical Software, 77, 1–17. 10.18637/jss.v077.i01 [DOI] [Google Scholar]
- Renn BN, Pratap A, Atkins DC, Mooney SD, & Areán PA (2018). Smartphone-based passive assessment of mobility in depression: Challenges and opportunities. Mental Health and Physical Activity, 14, 136–139. 10.1016/j.mhpa.2018.04.003 [DOI] [PMC free article] [PubMed] [Google Scholar]
Associated Data
This section collects any data citations, data availability statements, or supplementary materials included in this article.


