

Abstract
Despite the high mortality from metastatic cancer, therapeutic targets to prevent metastasis are limited. Efforts to identify genetic aberrations that predispose tumors to metastasis have been unsuccessful. To understand the nature of a target for this disease, we performed an in silico screen and found drugs that can inhibit a gene expression profile for an epithelial-mesenchymal transition. We discovered that these, as well as previously discovered compounds, restrict metastatic capacity through a common mechanism—the ability to change the fluidity of the membranes of the cells. Reduced fluidity can decrease cell motility, stem cell properties, and the epithelial-mesenchymal transition in vitro, and can inhibit spontaneous metastasis in vivo. With no change in fluidity, anti-metastasis compounds can no longer restrict metastasis, indicating a causal association between fluidity and metastasis. This requirement for fluidity is supported in human breast cancers, as a fluidity increasing cholesterol efflux channel, ABCA1, is over-expressed in 41% of metastatic tumors, reducing time to metastasis by nine years. The facts that increased membrane fluidity is a necessary state that is leveraged by metastatic tumors, and can be controlled by many currently available drugs, suggest that membrane fluidity may be a viable therapeutic target for the prevention of cancer metastasis.
Introduction
To metastasize, a cancer cell must acquire a set of capabilities that are distinct from and potentially incompatible with its ability to flourish in the primary tumor (1). One explanation for how cells can acquire metastatic capacity is that they activate a latent epithelial-mesenchymal transition (EMT) program, which provides cancer cells with increased motility and stem cell properties (2,3). Regardless of mechanism, the diversity of signals that can activate the metastatic cascade (4–6) poses a challenge in developing therapeutic strategies. A model that explains the acquisition of metastatic traits using a more limited set of targetable cellular events would help in the development of broadly applicable treatments.
Despite the wealth of signals known to promote metastasis, the search for small molecules to target this fatal process has been hampered by a lack of knowledge of a targetable addiction of metastatic cells. Efforts to identify genetic alterations that predispose tumors to metastasis have thus far been unsuccessful (7). To address this deficiency, unbiased in vitro screens for drugs have focused on the stem cell phenotype because metastasis requires the ability to recapitulate a primary tumor in a distant site with the same hierarchy of cell types. Recent screens against stem cells have identified two leading candidates, salinomycin, a potassium channel ionophore; and thioridazine, a dopamine receptor antagonist (8,9). In both cases, their primary targets have little known bearing on the known biology of metastasis. However, salinomycin has later been shown to inhibit Wnt signaling through an unknown mechanism dependent upon a transmembrane receptor (10). For thioridazine, an association between dopamine receptor activation and stem cells was originally suggested, but an independent screen recovered both dopamine receptor agonists and antagonists, suggesting that the compound likely works through an alternative mechanism (11). Given these results, the only apparent similarity in targets is the dependence upon membrane associated receptors. The lack of a deeper explanation for how these compounds work reveals a limitation in our understanding of the important determinants of metastatic capacity.
To better understand the targets and dependencies of metastasis, our study demonstrates that the fluidity of cell membranes, whether changed by pharmacological or genetic inducers, controls metastatic capacity. Decreasing fluidity prevents and reverses an EMT, and inhibits metastasis in mouse models. In human breast cancers, over-expression of ABCA1, a regulator of membrane cholesterol and fluidity, is associated with increased metastasis. Taken together, these disparate lines of evidence indicate that membrane fluidity is a critical determinant of metastatic capacity and suggest that it may be a viable therapeutic target.
Materials and Methods
Cell Culture
T47D, MCF7, AU565, MDA-MB-231, MDA-MB-361, and ZR-75-1 cell lines were purchased from ATCC (American Type Culture Collection) in 2011. 4T1 cells were purchased from ATCC in 2013. SUM-159 were obtained from Dr. Jeffrey A. Frost (University of Texas Health Science Center at Houston), human mammary epithelial (HMLE) and HMLE ER-Twist cells were kindly provided by Dr. Sendurai A. Mani (University of Texas MD Anderson Cancer Center) in 2013. All cell lines used in this study were used at low passage and shown to be free of mycoplasma (MycoAlert Mycoplasma Detection Kit, Lonza #LT37-618). Except for SUM-159, all cell lines were obtained either from ATCC or the original source (HMLE). We did no further authentication on the SUM-159 cell line.
Additional procedures are described in Supplementary Materials and Methods.
Results
An in silico phenotype screen predicts small molecules that repress metastatic capacity.
We searched for compounds that can repress a metastatic phenotype (i.e. the set of cellular characteristics associated with metastasis), even if they do not lead to death as in prior screens (8,9), using an EMT gene expression signature as a model (Figure 1A). We created a signature based on embryonic development using an approach we previously described (12), although other signatures have been developed (13,14). Noticing that EMT inducers TWIST1 and ZEB1 (6,15) are upregulated at day 9.5 (Supplementary Figure S1A), we selected for our signature the 219 genes that are either induced or repressed at this time (Figure 1B, Supplementary Table S1). We found that the scores from this signature are significantly higher in cells after undergoing an EMT (across six gene expression data sets) (Figure 1C). To further characterize the signature, we performed pathway analysis using GATHER (16) and found 67 significant processes (FDR < 0.05) including many associated with differentiation, development, and motility (Supplementary Figure S1B). We also generated a network of the altered pathways (17–19) and saw that the signature is associated with upregulation of Wnt signaling, which is an inducer of Snail and EMT (20) (Supplementary Figure S1C). These results indicate that our EMT signature captures the distinction between the epithelial and mesenchymal phenotypes in cancer.
Figure 1.

An in silico screen identifies small molecule compounds that inhibit metastatic phenotypes and EMT in vitro.
A) We generated an EMT gene expression signature to represent a metastatic phenotype. Then, we used the Connectivity Map to predict drugs that can repress this signature and metastatic capacity.
B) These heatmaps show the expression profiles of genes in the EMT signature across day e6.5 to e10.5 (left) and adult tissues (right).
C) These plots show (y-axis) the gene expression of GAPDH (top) or the scores of the EMT signature (bottom) in cells undergoing an EMT. Each dot represents a cell that is either epithelial (EPI) or mesenchymal (MES).
D) This diagram shows an example of the gene expression profiles of the anti-metastasis drugs.
E) The Connectivity Map analyzes a library of compounds and generates a Connectivity Score (x-axis). In this volcano plot, each point is a compound. The ones with the negative Connectivity Scores (towards the left) are predicted to repress metastatic phenotypes. Compounds studied in this manuscript are highlighted, where blue are controls, and green are predicted anti-metastasis drugs.
With the validated EMT signature, we identified drugs that can perturb it using the Connectivity Map, a database of gene expression changes triggered by pharmacologic compounds (Figure 1D) (21). Analysis of 1,309 compounds, including FDA-approved drugs and other bioactive molecules, yielded predictions of drugs that repress an EMT gene expression signature (anti-metastasis drugs) (Figure 1E, Supplementary Table S2). The top scoring anti-metastasis drugs are inhibitors of known EMT pathways, such as vimentin expression (withaferin A) (22), HDAC dependency (vorinostat, trichostatin A) (23), HSP90 response (tanespimycin, geldanamycin) (24), or PI3K activation (LY294002) (25). Furthermore, one of the compounds identified in a prior screen, thioridazine, is also predicted to be anti-metastasis. The other, salinomycin, was not profiled in this database. To validate the robustness of the results, we found a statistically significant overlap (p=0.0004) with the Connectivity Scores obtained using a previously published EMT signature (13). All but thioridazine were confirmed by the core EMT signature to be anti-metastatic (p=0.007) (Supplementary Figure S1D).
Predicted anti-metastasis drugs inhibit cell motility, mammosphere formation, and the EMT.
To test whether the drugs predicted in silico can alter metastatic phenotypes in vitro, we focused on four with a range of mechanisms: alprostadil (prostaglandin agonist), amitriptyline (tricyclic antidepressant), haloperidol (dopamine receptor antagonist), and maprotiline (tetracyclic antidepressant); as well as two previously identified drugs, salinomycin and thioridazine.
To validate whether the predicted drugs can affect metastatic capacity, we tested whether they impact cell motility or mammosphere formation, cellular characteristics that are necessary for metastasis. To measure motility, we performed transwell migration and wound healing assays and found that the drugs significantly decreased the motility of cells (Figure 2A-C, Supplementary Figure S2A-C). In addition, the drugs could also repress the ability of the cells to form mammospheres, an in vitro assay for early progenitor stem cell characteristics in breast cancer cells (26) (Figure 2D, Supplementary Figure S2D). The drug concentrations used varied from 1 to 20 μM (see Supplementary Materials and Methods).
Figure 2.
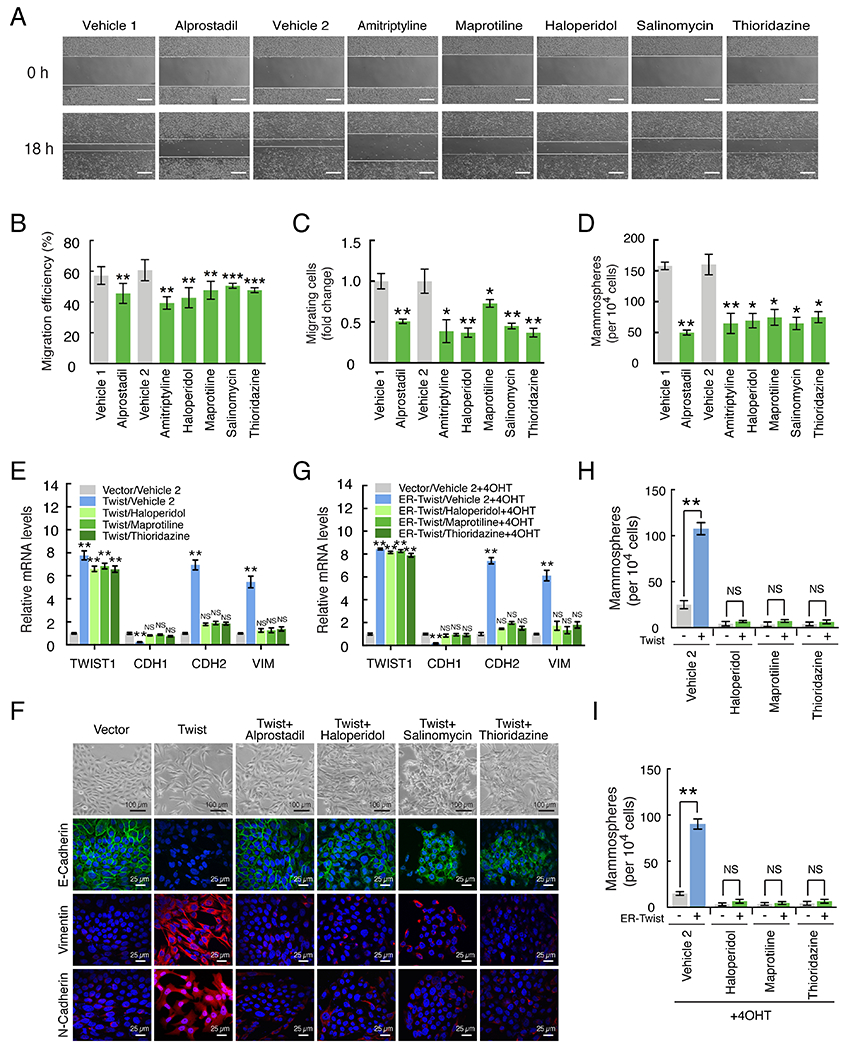
Drugs inhibit metastatic phenotypes and EMT in vitro.
A) These are representative images from a scratch-wound migration assay performed on MDA-MB-231 cells after treatment with vehicle or anti-metastasis drugs. Scale bars represent 300 μm.
B) The relative number of migrating cells (y-axis) from a scratch-wound migration assay is shown for MDA-MB-231 cells treated with anti-metastasis drugs (green bars).
C) The relative number of migrating cells (y-axis) in a transwell migration assay is shown for MDA-MB-231 cells.
D) This shows the number of mammospheres (y-axis) formed by MDA-MB-231 cells after treatment with anti-metastasis drugs (green bars).
E) The normalized gene expression levels of Twist (TWIST1), E-cadherin (CDH1), N-cadherin (CDH2), and Vimentin (VIM) are shown on the y-axis. HMLE cells expressing a vector control or Twist were treated with either with vehicle or anti-metastasis drugs for five days.
F) HMLE cells induced to undergo an EMT via ectopic expression of Twist are treated with anti-metastasis drugs alprostadil, haloperidol, salinomycin, and thioridazine. The top row shows brightfield images of cells, and the remaining ones show confocal images for an epithelial marker (E-cadherin) or mesenchymal ones (vimentin, N-cadherin).
G) Here, the HMLE cells were expressing an ER-inducible Twist. These cells were first treated with drugs, and then Twist was activated with tamoxifen.
H-I) These plots show the number of mammospheres formed by cells under the conditions described in panels E and G, respectively.
p-values are indicated: * p<0.05, ** p<0.01, *** p<0.001, **** p<0.0001, NS p≥0.05.
To evaluate whether the assays were confounded by an impact on cell proliferation or death, we measured the impact of the drugs on cell number. At seven days, the maximum duration of the prior assays, drug treatment minimally impacted the cells, leading to a 17-18% decrease that cannot explain the magnitude of the changes in the metastatic phenotypes (Supplementary Figure S2E). One exception is alprostadil, which showed a maximum of 50% decrease (one cell division) at seven days. However, even this drug had no impact after one day, indicating that the changes in the short term motility assays also cannot be explained by a change in cell number.
The prior experiments demonstrated that anti-metastasis drugs could decrease metastatic phenotypes. However, in tumors, a metastatic phenotype may be maintained by signaling sustained via genetic or epigenetic changes, or from extracellular sources. To see whether the target of the drugs is dominant over the presence of a continuous metastasis-inducing signal, we next tested whether anti-metastasis drugs can reverse an EMT in cells that have undergone the transition, or prevent cells from entering one. For the first experiment, we used HMLE cells (non-tumorigenic immortalized human mammary epithelial cells) (27) that stably express Twist, which forced the cells to undergo an EMT as seen by loss of the E-cadherin epithelial marker and gain of mesenchymal ones (Figure 2E-F). In these cells, five days of anti-metastasis drug treatment resulted in reassertion of E-cadherin and loss of mesenchymal markers, even under continued Twist expression, showing that the cells reverted to an epithelial state despite continued expression of a potent EMT inducer.
To test whether the drugs can prevent an EMT, we used an inducible EMT system comprised of HMLE cells carrying tamoxifen-inducible Twist (2). We treated cells with anti-metastasis drugs for seven days and then activated Twist with tamoxifen. While untreated cells underwent an EMT, cells treated with anti-metastasis drugs did not undergo the same change (Figure 2G). This shows that anti-metastasis drugs can prevent the EMT despite the presence of an EMT-inducing signal. We confirmed that a stem cell phenotype was also reverted in a mammosphere assay (Figure 2H-I). Similar results could also be seen in T47D cells using the EMT inducer Snail (Supplementary Figure S2F-G).
Taken together, these experiments demonstrate that drugs with a broad range of established targets can inhibit both metastatic phenotypes and EMT across a range of breast cancer cell lines (T47D, non-metastatic, luminal; MCF7, non-metastatic, luminal; MDA-MB-231, metastatic, claudin-low; and SUM-159, metastatic, claudin-low) (28). Combined with the observation that the they can inhibit an EMT suggests that they affect a target that is necessary for an EMT, but also has a general capacity to tune metastatic phenotypes across cell states.
Anti-metastasis drugs reduce plasma membrane fluidity.
Due to the large number of pathways and the breadth of drugs that can reduce metastatic phenotypes, we surmised that they may be controlled by a broad cellular characteristic. To identify it, we examined the drugs found in our in silico screen, and noticed a strong correlation between the induction of an EMT signature and a reported ability to alter plasma membrane fluidity (defined as the rate that a molecule can diffuse laterally across the membrane) (Figure 3A). This mechanism is supported by prior studies showing that cell lines from lung (29), sarcoma (30), and breast tumors (31) that metastasize have higher fluidity. Based on these results, we asked whether the observed fluidity change is a correlated byproduct of, or a requirement for, EMT and metastasis.
Figure 3.

Predicted drugs induce changes in membrane fluidity.
A) This shows the Connectivity Score (x-axis) of each drug (dots) separated into those that increase (+) or decrease (–) membrane fluidity based on prior reports in the literature.
B) These confocal images from a FRAP assay show plasma membrane fluidity changes in cells treated with either vehicle (left column) or haloperidol (right). In the top row, we focused on 1 μm2 areas of the plasma membrane stained with a lipophilic dye. The subsequent rows, at higher magnification, show the remaining phases of the assay: (A)cquiring the baseline intensity level for 30 s, (P)hotobleaching the area for 30 s, and then measuring the (R)ecovery of the fluorescence for two minutes.
C) This plot shows the fluorescence recovery for MDA-MB-231 cells in a FRAP assay after treatment with the anti-metastasis drug haloperidol for three days. The x-axis shows time since the beginning of the recovery period, and y-axis the relative fluorescence intensity.
D) For the recovery plot, we calculated the Mobile fraction (the fraction of fluorescent molecules that can diffuse back into the section) and the Diffusion constant (the rate at which molecules diffuse back into the section).
E) A pyrene assay shows the relative fluidity of MDA-MB-231 cells grown in monolayer culture either expressing EMT inducers (red bars), treated with anti-metastasis drugs (green bars), or treated with a membrane fluidizer oleic acid (blue bars). The fluidity is the ratio of the fluorescence intensity of excimers to monomers (IE/IM), and then normalized to the appropriate control.
F) We cultured MDA-MB-231 cells in monolayer and 3D culture (2% matrigel). This compares the membrane fluidity (y-axis) of MDA-MB-231 cells in the two conditions.
G) This plot shows the relative fluidity of MDA-MB-231 cells grown in 3D culture, after treatment with two drugs.
H) This shows the membrane fluidity (y-axis) of MDA-MB-231 cells after treatment with drugs, with and without oleic acid. Blue bars are treated with oleic acid, green with drugs, and yellow with a combination of drugs and oleic acid
I) The number of migrating cells from a transwell assay, normalized to vehicle, is shown (y-axis).
J) The number of mammospheres formed is shown on the y-axis.
p-values are annotated as in Figure 2.
To test whether our predicted anti-metastasis drugs can alter plasma membrane fluidity, we used a FRAP (fluorescence recovery after photobleaching) assay (Figure 3B). After treating cells, we found that haloperidol decreases the fluidity of the plasma membrane (Figure 3C), showing a lower number of mobile molecules as well as an decreased rate of diffusion (Figure 3D).
To test a broader range of molecules, we switched to a more tractable pyrene fluidity assay. As a control, we included oleic acid, an 18 chain monounsaturated fatty acid that fluidizes membranes by disrupting lipid packing (32). Using this approach, we confirmed that EMT inducers and oleic acid increase fluidity, while anti-metastasis drugs decrease it across a range of cell lines (Figure 3E, Supplementary Figure S3A).
The prior experiments were performed in a monolayer culture that lacks the 3D organization of the in vivo state, which has been seen to alter the response of cells to drugs such as chemotherapies (33). Therefore, to determine whether 3D organization impacts the ability of drugs to alter fluidity, we cultured MDA-MB-231 and T47D cells in 3D, where they assumed stellate (characterized by invasive projections) and mass (with disorganized nuclei and robust cell-cell adhesions) morphologies, respectively (34) (Supplementary Figure S3B). While cells in 3D culture exhibit higher fluidity than in 2D, the drugs could nevertheless reduce fluidity similar to that seen in 2D (Figure 3F-G, Supplementary Figure S3C-D).
Next, to distinguish whether fluidity is correlated with, or causally represses, metastatic phenotypes, we isolated the molecular targets of the drugs from fluidity by treating cells concurrently with both an anti-metastasis drug (that decreases fluidity) and oleic acid (that increases fluidity), resulting in no net change (Figure 3H; Supplementary Figure S3E). When fluidity was unchanged, anti-metastasis drugs could no longer decrease either cell migration or mammosphere formation in MDA-MB-231 or T47D cells (Figure 3I-J, Supplementary Figure S3F-G). This demonstrates that anti-metastasis drugs decrease metastatic phenotypes through a fluidity dependent mechanism.
Anti-metastasis drugs decrease membrane fluidity and prevent metastasis in vivo.
Metastasis is comprised of complex physiological events that are not present in vitro, including influences from the microenvironment and immune system. To model these factors, we tested our anti-metastasis drugs in a syngeneic immunocompetent mouse model of metastasis. We injected 4T1 cells orthotopically into the mammary fat pads, a model of the stroma of normal mammary glands, of BALB/c mice. Once a day, we injected mice intraperitoneally with saline, alprostadil, or haloperidol at doses analogous to those given to humans clinically. To isolate fluidity from other targets of the drugs, we also treated with a combination of the drugs and oleic acid. During the course of the experiment, all mice developed primary tumors in the mammary gland and were sacrificed after 31 days. The haloperidol treated mice exhibited lethargy, a well-known side effect of the drug, immediately after injections, which diminished over the next hours; while the alprostadil treated mice showed no obvious changes in behavior or weight. The sizes of the primary tumors were similar across all groups, indicating that the drugs had little or no impact on tumor growth (Figure 4A). However, the fluidity of the tumors treated with drugs decreased, showing that the drugs affected the tumors, except when balanced by oleic acid injections (Figure 4B). Further, drug treatment led to significantly fewer metastatic nodules on the surface of the lung, which was reversed when fluidity was restored with oleic acid (Figure 4C-D). The tumors treated with oleic acid showed an increased number nodules that did not achieve statistical significance. However, half these lungs were permeated with metastatic growth such that nodules could not be counted accurately, exceeding the limits of the assay. To more sensitively measure tumor burden, we sectioned the lungs, stained with hematoxylin and eosin (H&E), and calculated the metastatic burden as the fraction of cells that were cancerous. This revealed that oleic acid does significantly increase metastatic burden (Figure 4E-F). Finally, to check if the anti-metastasis drugs can affect the mesenchymal status of the tumors, we stained for the expression of vimentin, revealing that the anti-metastasis drugs resulted in tumors with decreased vimentin expression, while oleic acid had the opposite effect (Figure 4G-H). Taken together, these results demonstrate that anti-metastasis drugs significantly reduced breast cancer metastasis, dependent upon a decrease in the membrane fluidity of the primary tumor.
Figure 4.

Anti-metastasis drugs decrease fluidity and prevent metastasis in vivo.
A) We injected mouse breast cancer cells orthotopically and measured the volume of the primary tumors (y-axis) after sacrifice. Treatments (saline or drugs, with and without oleic acid) are shown on the x-axis (beneath panel E), and each point represents the primary tumor from a mouse in the study. Each condition is compared to the saline group with no oleic acid.
B) The y-axis shows the membrane fluidity of the primary tumor from each mouse.
C) Here, the y-axis shows the number of metastatic nodules seen in the lungs from each mouse.
D) A representative lung (the one with the median number of nodules) from each treatment group is shown. The top row shows the anterior, and the bottom row shows the posterior surface.
E) The metastatic burden, the percent of lung sections that are comprised of tumor tissue, is shown on the y-axis.
F) H&E staining for a representative lung from each treatment group is shown. Arrows indicate colonies of metastatic cells.
G) The percent of tumor cells in the lung metastasis that are vimentin positive are shown on the y-axis.
H) Shown are representative fields of lung metastases stained for the EMT marker vimentin and counterstained with hematoxylin.
p-values are annotated as in Figure 2.
Cellular cholesterol alters membrane fluidity and metastatic phenotypes.
Since a more fluid membrane is required for metastasis, we reasoned that metastatic tumor cells must somehow increase their fluidity. One possible mechanism is an alteration in cellular cholesterol, a determinant of membrane fluidity (35), which we confirmed by titrating cholesterol in MDA-MB-231 cells (Figure 5A-B). We treated MDA-MB-231 cells with our anti-metastasis drugs and found that they increased cholesterol levels (Figure 5C), consistent with the decrease in fluidity. Further, cholesterol also leads to a loss of metastatic phenotypes, as measured by migration and mammosphere formation (Figure 5D-G). Indeed, the total cellular cholesterol levels are inversely correlated with membrane fluidity and metastatic phenotypes.
Figure 5.

Cholesterol inhibits metastatic phenotypes.
A) This bar plot shows the cholesterol content (y-axis) in MDA-MB-231 cells after the addition of water-soluble cholesterol (x-axis). Free cholesterol is shown in solid colors and esterified is hashed. The p-values are computed for total cholesterol levels.
B) This plot shows the membrane fluidity (y-axis) after addition of water-soluble cholesterol (x-axis).
C) This shows the cholesterol (y-axis) after treatment of anti-metastasis drugs. The p-values are computed for total cholesterol levels.
D) These bars show the migration efficiency (y-axis) from a scratch-wound assay after treatment across a range of concentrations of cholesterol.
E) These are representative wounds from a scratch-wound assay after treatment with cholesterol. Scale bar represents 300 μm.
F) This shows the relative number of migrating cells from a transwell migration assay after treatment across a range of concentrations of cholesterol.
G) This shows the number of mammospheres formed (y-axis) after treatment with a range of concentrations of cholesterol (x-axis).
p-values are annotated as in Figure 2.
The cholesterol efflux channel ABCA1 drives metastasis in human breast cancer.
Since cholesterol is a potent inhibitor of metastatic phenotypes, we predicted that the EMT program may increase metastatic capacity by reducing cholesterol. To identify this mechanism, we searched for changes in the expression of genes that control cellular cholesterol levels across an EMT (36). This bioinformatic analysis revealed that an ATP-binding cassette transporter ABCA1, which functions as a cholesterol reverse transporter (37), is significantly up-regulated in an EMT (Figure 6A). To confirm this, we expressed Snail or Twist in HMLE cells and a range of luminal breast cancer cell lines and measured ABCA1 gene expression. In these conditions, the expression of ABCA1 was increased 4–12 fold (Figure 6B).
Figure 6.

ABCA1 is increased in an EMT and decreased upon treatment with antimetastasis drugs.
A) These plots show the expression of cholesterol regulatory genes in cells before and after an EMT, as in Figure 1C. Four groups of genes are shown: EMT markers (controls); Synthesis, cholesterol synthesis; Import, cholesterol import; and Export, cholesterol export.
B) This shows the relative gene expression of ABCA1 (y-axis), measured by RT-qPCR, before and after induction of EMT in HMLE and a range of luminal breast cancer cells by ectopic expression of Snail or Twist.
C) The gene expression (y-axis) of ABCA1 in T47D cells via ectopic expression of Snail or Twist is shown after treatment with a range of anti-metastasis drugs or vehicle controls (x-axis).
D) The gene expression (y-axis; bar plot) and protein expression (immunoblots) of ABCA1 in MDA-MB-231 cells are shown after treatment with a range of anti-metastasis drugs or vehicle controls (x-axis).
E) We stained the sections from the lung metastases of mice treated with anti-metastasis drugs for the presence of ABCA1. The percent of tumor cells that are positive for ABCA1 are shown (y-axis).
F) These are representative sections from lung metastases stained for ABCA1 and counterstained with hematoxylin. The red arrows show positively stained cells.
p-values are annotated as in Figure 2.
As a potential mechanism to explain their activity, we tested whether the anti-metastasis drugs reduce ABCA1 expression. We treated T47D cells induced to undergo an EMT and MDA-MB-231 cells with a range of anti-metastasis drugs and found that ABCA1 gene and protein expression was significantly decreased (Figure 6C-D). Further, in sections from lung metastases, the tumors from mice treated with anti-metastasis drugs had significantly fewer cells with high ABCA1 expression (Figure 6E-F). Thus, ABCA1 is an EMT-responsive gene that can be inhibited by the treatment of anti-metastasis drugs.
While ABCA1 was previously found to decrease cell proliferation, its relationship with metastasis is still unknown (38). To determine whether ABCA1-regulated cholesterol levels control metastatic capacity, we used an RNAi strategy and knocked down ABCA1 in MDA-MB-231 cells (Supplementary Figure S4A). This led to an increase in cellular free cholesterol, consistent with a diminished ability of the cells to efflux cholesterol (Figure 7A). The cholesterol levels were also inversely correlated with changes in membrane fluidity (Figure 7B). We measured cell proliferation for one week and observed no change (Supplementary Figure S4B). As our model would predict, we also observed in these cells a decreased cell motility (Figure 7C-D, Supplementary Figure S4C). In each of these experiments, we could rescue the phenotype by restoring cellular cholesterol with MβCD, a compound that extracts cholesterol from cell membranes (39). This demonstrates that the changes in phenotype were dependent upon its impact on cholesterol and not another function of ABCA1. Taken together, these results show that ABCA1 determines cell migration through regulation of cholesterol levels.
Figure 7.

ABCA1-driven reduction of cholesterol and metastasis in human breast cancer.
A) This shows the free cholesterol level (y-axis) in MDA-MB-231 cells. The cells with a grey bar express a control shRNA, green express shRNAs targeting ABCA1, and yellow express both ABCA1-targeting shRNAs and MβCD (2 mM).
B-C) The fluidity and migration efficiency (y-axis) are shown under the same conditions.
D) Representative images show the impact of control shRNA, shABCA1, or shABCA1+MβCD treatment on cell migration. Scale bar represents 300 μm.
E) Each point represents the number of metastatic nodules found on the lung (y-axis) after injections of MDA-MB-231 cells transfected with control shRNA and shRNAs targeting ABCA1 (x-axis) in a mouse lung colonization assay.
F) Representative lungs (the one with the median number of nodules) from each group are shown. The top row shows the anterior, and the bottom row shows the posterior surface.
G) These images show the representative lung from each treatment group. The lungs were stained with H&E, and colonies of metastatic cells are indicated with arrows. Rectangles highlight the area shown at higher magnification (on right).
H) These Kaplan-Meier plots show the percentage of human breast cancer patients (y-axis) that are free of distant metastasis over time (x-axis) across four independent data sets. The patients are discretized into normal or high ABCA1 groups. Hash marks indicate censored patients.
I) Model: Metastasis is driven by increased membrane fluidity due to the aberrant regulation of cholesterol levels.
p-values are annotated as in Figure 2.
Seeing that knockdown of ABCA1 can alter metastatic phenotypes, we next tested whether cyclosporin A, an ABCA1 inhibitor, has similar effects (40). Treatment of MDA-MB-231 cells with this compound led to a significant increase in cellular cholesterol concomitant with a reduction in fluidity (Supplementary Figure S4D-E). Consistent with this result, we also observed a decrease in migration and mammosphere formation (Supplementary Figure S4F-H). Finally, we tested whether cyclosporin A can inhibit an EMT in a T47D model. We induced an EMT by ectopic expression of Snail, and found that it can restore epithelial transcriptional markers, along with a reduction in mammosphere forming ability (Supplementary Figure S4I-J). These results confirm that inhibition of ABCA1 function decreases metastatic phenotypes.
Having seen the importance of ABCA1 in vitro, we tested whether it drives metastasis in vivo. We injected the control and MDA-MB-231/shABCA1 cells (with two different shRNAs) into the tail veins of immunocompromised NOD/SCID mice and sacrificed them after 49 days. We stained the lungs for expression of ABCA1 and confirmed that the tumors from ABCA1 knockdown had lower ABCA1 expression (Supplementary Figure S5A-B). At that time, they had significantly more metastatic nodules both on the surface (Figure 7E-F) and in the interior of the lungs (Figure 7G). To check the growth rate of the cells in vivo, we injected MDA-MB-231/Control and MDA-MB-231/shABCA1–3 cells orthotopically into the mammary fat pads of NOD/SCID mice and saw no difference in the size of the resultant tumors, in contrast to a prior report, potentially because in the prior study, ABCA1 was ectopically overexpressed in a genetic background where it promotes apoptosis (Supplementary Figure S5C) (38). In any case, our results demonstrate that ABCA1 significantly enhances metastatic colonization in vivo.
Given that ABCA1 is expressed during EMT and can drive metastatic properties in vitro and metastasis in vivo, we predicted that it may be a mechanism used by human tumors to increase metastatic capacity. To test this, we examined ABCA1 expression across four publicly available data sets of breast cancer patients that were monitored for distant metastases (Supplementary Figure S5D). Among tumors that metastasized within five years, 41%±28% had high ABCA1 expression (Figure 7H). Those patients acquired metastases significantly earlier than those with normal ABCA1 expression. The time required for 25% of the tumors to metastasize was 9±4 years shorter when ABCA1 was high. 100% of patients with high ABCA1 had metastases by 12.5 years, compared with only 28% of patients with normal ABCA1. The strong association between ABCA1 and distant metastases in human breast cancers, coupled with the preclinical evidence revealing the mechanism, shows that ABCA1 is a potent inducer of metastatic capacity in human breast cancers. This demonstrates a novel strategy for human tumors to acquire metastatic capacity, namely the regulation of fluidity through alteration in cellular cholesterol homeostasis.
Discussion
Our investigations revealed that membrane fluidity is causally associated with metastasis, provides a mechanism that explains the efficacy of previously and newly identified anti-metastasis drugs, and shows that breast tumors have altered cholesterol efflux associated with metastasis (Figure 7I). The fact that the efficacy of anti-metastasis drugs depends on their ability to reduce fluidity enables the search for more potent therapeutics.
The unexpected alterations of cholesterol efflux in breast cancer raises the possibility that systemic cholesterol levels may affect metastasis. This question has been addressed with epidemiological studies starting 85 years ago with the observation that cancer patients have less heart disease, initiating investigations that continue almost a century later (41). A range of studies found a correlation between low levels of plasma cholesterol and increased mortality from cancer, although a minority saw no significant effect (Table S3). One explanation for the correlation is that some patients may harbor undiagnosed tumors that are metabolizing cholesterol, leading to lower plasma cholesterol levels (42). This is supported by data showing that cholesterol and its metabolites can promote tumor initiation (43). However, even after controlling for this by lag-time analyses, the association remains.
The conflicting interpretations of the association between cholesterol and cancer suggest a complex relationship between cholesterol and disease that is not yet fully understood. Since cholesterol affects tumor initiation, proliferation, and metastasis through a range of mechanisms, it is likely that cholesterol plays both promoting and inhibiting roles throughout tumor development. To better understand it, studies must be carried out that carefully isolate the contribution of cholesterol to different hallmarks of the cancer phenotype. This study reveals the impact of fluidity and cholesterol specifically on metastasis. While cells may utilize ABCA1 to promote metastasis, the same gene may also inhibit the development of tumors by inhibiting cellular proliferation (38). Similarly, as inhibitors of cholesterol synthesis, one would predict that statins would promote metastasis. However, the literature on statins is ambiguous, showing both tumorigenic and anti-tumorigenic effects, potentially due to pleiotropic effects of the drug.
Finally, the ability of fluidity to inhibit metastasis has implications for therapy. Nearly all the anti-metastasis drugs we identified are FDA-approved. These drugs were able to reduce the fluidity of primary tumors and decrease metastatic capacity in vivo at dosages analogous to those given to humans with no obvious additional systemic toxicity. However, this raises questions regarding the impact of long-term non-specific decrease of fluidity across an organism. Suggesting that the treatment is not evidently toxic is the fact that one of the drugs, haloperidol, is used to treat chronic psychiatric disorders. Thus, the apparent wealth in available drugs that can affect membrane fluidity, observed by others and ourselves, suggests that a viable anti-metastatic therapy may already exist.
Supplementary Material
Acknowledgments
We thank Drs. Jeff Frost, Guangwei Du, Ilya Levental, Jaime Rodriguez Canales, and Jeff Rosen for reagents, technical assistance, and insights.
Financial Support
This work was supported by grant R1006 from the Cancer Prevention and Research Institute of Texas to J.T. Chang, NIH/NCI CA155243 to S.A. Mani; and UTHealth Innovation in Cancer Prevention Research Training Program Postdoctoral Fellowship from CPRIT grant RP140103 to S. Prijic.
Footnotes
Disclosure of Potential Conflicts of Interest
No potential conflicts of interest were disclosed.
References
- 1.Chaffer CL, Weinberg RA. A perspective on cancer cell metastasis. Science 2011;331(6024):1559–64. [DOI] [PubMed] [Google Scholar]
- 2.Mani SA, Guo W, Liao MJ, Eaton EN, Ayyanan A, Zhou AY, et al. The epithelial-mesenchymal transition generates cells with properties of stem cells. Cell 2008;133(4):704–15. [DOI] [PMC free article] [PubMed] [Google Scholar]
- 3.Morel AP, Lievre M, Thomas C, Hinkal G, Ansieau S, Puisieux A. Generation of breast cancer stem cells through epithelial-mesenchymal transition. PLoS One 2008;3(8):e2888. [DOI] [PMC free article] [PubMed] [Google Scholar]
- 4.Oft M, Heider KH, Beug H. TGFbeta signaling is necessary for carcinoma cell invasiveness and metastasis. Curr Biol 1998;8(23):1243–52. [DOI] [PubMed] [Google Scholar]
- 5.Cano A, Perez-Moreno MA, Rodrigo I, Locascio A, Blanco MJ, del Barrio MG, et al. The transcription factor snail controls epithelial-mesenchymal transitions by repressing E-cadherin expression. Nat Cell Biol 2000;2(2):76–83. [DOI] [PubMed] [Google Scholar]
- 6.Yang J, Mani SA, Donaher JL, Ramaswamy S, Itzykson RA, Come C, et al. Twist, a master regulator of morphogenesis, plays an essential role in tumor metastasis. Cell 2004;117(7):927–39. [DOI] [PubMed] [Google Scholar]
- 7.Vogelstein B, Papadopoulos N, Velculescu VE, Zhou S, Diaz LA Jr., Kinzler KW. Cancer genome landscapes. Science 2013;339(6127):1546–58. [DOI] [PMC free article] [PubMed] [Google Scholar]
- 8.Gupta PB, Onder TT, Jiang G, Tao K, Kuperwasser C, Weinberg RA, et al. Identification of selective inhibitors of cancer stem cells by high-throughput screening. Cell 2009;138(4):645–59. [DOI] [PMC free article] [PubMed] [Google Scholar]
- 9.Sachlos E, Risueno RM, Laronde S, Shapovalova Z, Lee JH, Russell J, et al. Identification of drugs including a dopamine receptor antagonist that selectively target cancer stem cells. Cell 2012;149(6):1284–97. [DOI] [PubMed] [Google Scholar]
- 10.Lu D, Choi MY, Yu J, Castro JE, Kipps TJ, Carson DA. Salinomycin inhibits Wnt signaling and selectively induces apoptosis in chronic lymphocytic leukemia cells. Proc Natl Acad Sci U S A 2011;108(32):13253–7. [DOI] [PMC free article] [PubMed] [Google Scholar]
- 11.Diamandis P, Wildenhain J, Clarke ID, Sacher AG, Graham J, Bellows DS, et al. Chemical genetics reveals a complex functional ground state of neural stem cells. Nature chemical biology 2007;3(5):268–73. [DOI] [PubMed] [Google Scholar]
- 12.Soundararajan R, Paranjape AN, Barsan V, Chang JT, Mani SA. A novel embryonic plasticity gene signature that predicts metastatic competence and clinical outcome. Scientific Reports 2015. [DOI] [PMC free article] [PubMed] [Google Scholar]
- 13.Taube JH, Herschkowitz JI, Komurov K, Zhou AY, Gupta S, Yang J, et al. Core epithelial-to-mesenchymal transition interactome gene-expression signature is associated with claudin-low and metaplastic breast cancer subtypes. Proc Natl Acad Sci U S A 2010;107(35):15449–54. [DOI] [PMC free article] [PubMed] [Google Scholar]
- 14.Groger CJ, Grubinger M, Waldhor T, Vierlinger K, Mikulits W. Meta-analysis of gene expression signatures defining the epithelial to mesenchymal transition during cancer progression. PLoS One 2012;7(12):e51136. [DOI] [PMC free article] [PubMed] [Google Scholar]
- 15.Spaderna S, Schmalhofer O, Hlubek F, Berx G, Eger A, Merkel S, et al. A transient, EMT-linked loss of basement membranes indicates metastasis and poor survival in colorectal cancer. Gastroenterology 2006;131(3):830–40. [DOI] [PubMed] [Google Scholar]
- 16.Chang JT, Nevins JR. GATHER: a systems approach to interpreting genomic signatures. Bioinformatics 2006;22(23):2926–33. [DOI] [PubMed] [Google Scholar]
- 17.Kanehisa M, Goto S. KEGG: kyoto encyclopedia of genes and genomes. Nucleic Acids Res 2000;28(1):27–30. [DOI] [PMC free article] [PubMed] [Google Scholar]
- 18.Subramanian A, Tamayo P, Mootha VK, Mukherjee S, Ebert BL, Gillette MA, et al. Gene set enrichment analysis: a knowledge-based approach for interpreting genome-wide expression profiles. Proc Natl Acad Sci U S A 2005;102(43):15545–50. [DOI] [PMC free article] [PubMed] [Google Scholar]
- 19.Merico D, Isserlin R, Stueker O, Emili A, Bader GD. Enrichment map: a network-based method for gene-set enrichment visualization and interpretation. PLoS One 2010;5(11):e13984. [DOI] [PMC free article] [PubMed] [Google Scholar]
- 20.Yook JI, Li XY, Ota I, Fearon ER, Weiss SJ. Wnt-dependent regulation of the E-cadherin repressor snail. J Biol Chem 2005;280(12):11740–8. [DOI] [PubMed] [Google Scholar]
- 21.Lamb J, Crawford ED, Peck D, Modell JW, Blat IC, Wrobel MJ, et al. The Connectivity Map: using gene-expression signatures to connect small molecules, genes, and disease. Science 2006;313(5795):1929–35. [DOI] [PubMed] [Google Scholar]
- 22.Lee J, Hahm ER, Marcus AI, Singh SV. Withaferin A inhibits experimental epithelial-mesenchymal transition in MCF-10A cells and suppresses vimentin protein level in vivo in breast tumors. Molecular carcinogenesis 2013. [DOI] [PMC free article] [PubMed] [Google Scholar]
- 23.Bruzzese F, Leone A, Rocco M, Carbone C, Piro G, Caraglia M, et al. HDAC inhibitor vorinostat enhances the antitumor effect of gefitinib in squamous cell carcinoma of head and neck by modulating ErbB receptor expression and reverting EMT. J Cell Physiol 2011;226(9):2378–90. [DOI] [PubMed] [Google Scholar]
- 24.Hance MW, Dole K, Gopal U, Bohonowych JE, Jezierska-Drutel A, Neumann CA, et al. Secreted Hsp90 is a novel regulator of the epithelial to mesenchymal transition (EMT) in prostate cancer. J Biol Chem 2012;287(45):37732–44. [DOI] [PMC free article] [PubMed] [Google Scholar]
- 25.Bakin AV, Tomlinson AK, Bhowmick NA, Moses HL, Arteaga CL. Phosphatidylinositol 3-kinase function is required for transforming growth factor beta-mediated epithelial to mesenchymal transition and cell migration. J Biol Chem 2000;275(47):36803–10. [DOI] [PubMed] [Google Scholar]
- 26.Shaw FL, Harrison H, Spence K, Ablett MP, Simoes BM, Farnie G, et al. A detailed mammosphere assay protocol for the quantification of breast stem cell activity. J Mammary Gland Biol Neoplasia 2012;17(2):111–7. [DOI] [PubMed] [Google Scholar]
- 27.Elenbaas B, Spirio L, Koerner F, Fleming MD, Zimonjic DB, Donaher JL, et al. Human breast cancer cells generated by oncogenic transformation of primary mammary epithelial cells. Genes Dev 2001;15(1):50–65. [DOI] [PMC free article] [PubMed] [Google Scholar]
- 28.Prat A, Parker JS, Karginova O, Fan C, Livasy C, Herschkowitz JI, et al. Phenotypic and molecular characterization of the claudin-low intrinsic subtype of breast cancer. Breast Cancer Res 2010;12(5):R68. [DOI] [PMC free article] [PubMed] [Google Scholar]
- 29.Rivnay B, Gorelik E, Segal S, Shinitzky M. Plasma membrane microviscosity of Lewis lung carcinoma cells derived from local growth and pulmonary metastases. Invasion & metastasis 1981;1(2):99–110. [PubMed] [Google Scholar]
- 30.Taraboletti G, Perin L, Bottazzi B, Mantovani A, Giavazzi R, Salmona M. Membrane fluidity affects tumor-cell motility, invasion and lung-colonizing potential. Int J Cancer 1989;44(4):707–13. [DOI] [PubMed] [Google Scholar]
- 31.Zeisig R, Koklic T, Wiesner B, Fichtner I, Sentjurc M. Increase in fluidity in the membrane of MT3 breast cancer cells correlates with enhanced cell adhesion in vitro and increased lung metastasis in NOD/SCID mice. Archives of biochemistry and biophysics 2007;459(1):98–106. [DOI] [PubMed] [Google Scholar]
- 32.Golden GM, McKie JE, Potts RO. Role of stratum corneum lipid fluidity in transdermal drug flux. Journal of pharmaceutical sciences 1987;76(1):25–8. [DOI] [PubMed] [Google Scholar]
- 33.Weaver VM, Lelievre S, Lakins JN, Chrenek MA, Jones JC, Giancotti F, et al. beta4 integrin-dependent formation of polarized three-dimensional architecture confers resistance to apoptosis in normal and malignant mammary epithelium. Cancer Cell 2002;2(3):205–16. [DOI] [PMC free article] [PubMed] [Google Scholar]
- 34.Kenny PA, Lee GY, Myers CA, Neve RM, Semeiks JR, Spellman PT, et al. The morphologies of breast cancer cell lines in three-dimensional assays correlate with their profiles of gene expression. Molecular oncology 2007;1(1):84–96. [DOI] [PMC free article] [PubMed] [Google Scholar]
- 35.van Blitterswijk WJ, van der Meer BW, Hilkmann H. Quantitative contributions of cholesterol and the individual classes of phospholipids and their degree of fatty acyl (un)saturation to membrane fluidity measured by fluorescence polarization. Biochemistry 1987;26(6):1746–56. [DOI] [PubMed] [Google Scholar]
- 36.Brown MS, Goldstein JL. A proteolytic pathway that controls the cholesterol content of membranes, cells, and blood. Proc Natl Acad Sci U S A 1999;96(20):11041–8. [DOI] [PMC free article] [PubMed] [Google Scholar]
- 37.Lawn RM, Wade DP, Garvin MR, Wang X, Schwartz K, Porter JG, et al. The Tangier disease gene product ABC1 controls the cellular apolipoprotein-mediated lipid removal pathway. J Clin Invest 1999;104(8):R25–31. [DOI] [PMC free article] [PubMed] [Google Scholar]
- 38.Smith B, Land H. Anticancer activity of the cholesterol exporter ABCA1 gene. Cell reports 2012;2(3):580–90. [DOI] [PMC free article] [PubMed] [Google Scholar]
- 39.Christian AE, Haynes MP, Phillips MC, Rothblat GH. Use of cyclodextrins for manipulating cellular cholesterol content. Journal of lipid research 1997;38(11):2264–72. [PubMed] [Google Scholar]
- 40.Le Goff W, Peng DQ, Settle M, Brubaker G, Morton RE, Smith JD. Cyclosporin A traps ABCA1 at the plasma membrane and inhibits ABCA1-mediated lipid efflux to apolipoprotein A-I. Arteriosclerosis, thrombosis, and vascular biology 2004;24(11):2155–61. [DOI] [PubMed] [Google Scholar]
- 41.Carlson HA, Bell ET. A Statistical Study of the Occurrence of Cancer and Tuberculosis in 11,195 Postmortem Examinations. Cancer Res 1929;13(126):126–35. [Google Scholar]
- 42.Ho YK, Smith RG, Brown MS, Goldstein JL. Low-density lipoprotein (LDL) receptor activity in human acute myelogenous leukemia cells. Blood 1978;52(6):1099–114. [PubMed] [Google Scholar]
- 43.Nelson ER, Wardell SE, Jasper JS, Park S, Suchindran S, Howe MK, et al. 27-Hydroxycholesterol links hypercholesterolemia and breast cancer pathophysiology. Science 2013;342(6162):1094–8. [DOI] [PMC free article] [PubMed] [Google Scholar]
Associated Data
This section collects any data citations, data availability statements, or supplementary materials included in this article.