

Abstract
In the current cultural psychology literature, it is commonly assumed that the personal self is cognitively more salient for those with an independent (vs. interdependent) self-construal (SC). So far, however, this assumption remains largely untested. Here, we drew on evidence that resting state alpha power (RSAP) reflects mental processes constituting the personal self and tested whether RSAP is positively correlated with independent (vs. interdependent) SC. Study 1 tested European Americans and Taiwanese, whereas Study 2 tested European Americans and Japanese (total N = 164). A meta-analysis performed on the combined data confirmed a reliable association between independent (vs. interdependent) SC and RSAP. However, this association was only reliable when participants had their eyes closed. Even though European Americans were consistently more independent than East Asians, RSAP was no greater for European Americans than for East Asians. Our data helps explore a missing link in the theorizing of contemporary cultural psychology.
Keywords: EEG, Alpha Power, Self-construal, Cross-cultural Neuroscience, Resting State
1. Introduction
Research in cultural psychology has suggested that the salience of the personal self varies across cultures (Markus & Kitayama, 1991; Shweder & Bourne, 1982; Triandis, 1989). Specifically, in Western cultures, the independence of the self is valued and positively sanctioned, which increases the salience of personal aspects of the self such as its desires and beliefs. In contrast, in East Asian cultures, the interdependence of the self with others is more strongly valued, which would make the personal self less salient than social norms and expectations. Researchers have used this analysis to explain various culture-specific effects in social perception (Morris & Peng, 1994), dissonance (Kitayama et al., 2004), choice (Kim & Markus, 1999; Savani et al., 2008), and wellbeing (Kitayama et al., 2006), among many others. However, the assumption that the personal self is cognitively more salient for those with an independent (vs. interdependent) self-construal (SC) has remained largely untested. Here, we tested this assumption by measuring the effect of SC on brain activity at rest, which is hypothesized to be related to the personal self (Northoff, 2016). For this purpose, we measured alpha power as it is long known to be the most prominent electroencephalography (EEG) signal observed during rest (Berger, 1929), and it is also associated with processing information related to the self (Knyazev, 2013).
1.1. Self-Construal and Culture
SC refers to the predominant mode of construing the self in relation to others (Markus & Kitayama, 1991). Independent SC implies a view of the self as separate and different from others (Kim & Markus, 1999). This SC is considered more dominant in Western cultures. In contrast, interdependent SC refers to a view of the self as connected to and embedded in relations with others. This SC is more dominant in Eastern cultures (including East Asian cultures; Kitayama et al., 2009; Markus & Kitayama, 1991).
One central feature of the two contrasting SCs lies in the salience of the personal self, which is comprised of what one thinks, feels, and wants. Those with an independent SC use the personal self to guide their behaviors. As a consequence, facets of this self, including personal beliefs, values, and attitudes should be highly salient and spontaneously accessible. In contrast, those with an interdependent SC refer to external contexts, such as social expectations and norms, to regulate their behaviors. Even though they have their personal beliefs, values, and attitudes, and thus they can report them when asked to, they may not prioritize them as strongly to guide their actions. Consequently, these individuals may not access these aspects of the personal self as frequently or spontaneously.
Examining variation in SC has proved powerful in accounting for observed psychological differences across cultures (Kitayama & Cohen, 2010). For example, compared to Asians (who are generally more interdependent), Westerners (generally more independent) are more likely to construe their actions as consistent with their preferences (Savani et al., 2008), and to feel happy when they affirm their personal features (Kitayama et al., 2006). Westerners are also more likely than Asians to focus their attention on goal-relevant objects rather than the context surrounding such objects (Kitayama et al., 2003; Masuda & Nisbett, 2001). Likewise, people from Western cultures are more likely to judge another person’s behavior as driven by the person’s internal attributes or dispositions rather than contextual constraints (Kitayama et al., 2009; Morris & Peng, 1994). When these SCs are assessed with a validated scale, they have been associated with neural correlates of these culturally variable cognitive and emotional behaviors (Kraus & Kitayama, 2019; see Kitayama & Uskul, 2011, for a review). For example, the tendency to draw inferences about the disposition of another person when judging their actions is associated with independent SC (Na & Kitayama, 2011). Moreover, when the SCs are primed, they also change culturally relevant behaviors accordingly (see Oyserman & Lee, 2008, for a review).
This body of evidence is consistent with the hypothesis that these SCs are linked to the salience of the personal self, which is deemed more salient for those with independent (vs. interdependent) SCs. Surprisingly, even though this relationship has been used extensively to explain numerous cross-cultural patterns in many studies, this hypothesis itself has remained largely untested. A direct test of the hypothesized link between SC and the salience of the personal self is complicated by the fact that regardless of SC, people can generate aspects of the personal self such as beliefs, values, and attitudes when asked to. Hence, it is crucial to test the degree of spontaneous access to the personal self in the absence of any task demands. For this purpose, we examined the resting state activity of the brain to evaluate the hypothesized link between SC and the salience of the personal self.
1.2. Neural Correlates of the Personal Self
Over the past few decades, there has been substantial progress in measuring and understanding the brain’s spontaneous activity at rest. Numerous studies using functional magnetic resonance imaging (fMRI) have shown that during rest, there is increased activity in specific brain regions, including the medial prefrontal cortex (mPFC) and posterior cingulate cortex (PCC). These regions partially comprise what is commonly referred to as the default mode network (DMN; Raichle et al., 2001). Regions of the DMN, including mPFC and PCC, show increased activity during self-referential processing versus other types of processing (Davey et al., 2016; Qin & Northoff, 2011; Whitfield-Gabrieli et al., 2011). Based on these observations, Northoff and colleagues have hypothesized that brain regions relevant to the personal self overlap with the DMN (Northoff, 2016; Qin & Northoff, 2011). This hypothesis is consistent with an additional observation that the DMN is involved in multiple mental processes, including autobiographical memory (Andrews-Hanna et al., 2014) and self-reference (Qin & Northoff, 2011), both of which contribute to the personal sense of the self. The DMN also includes additional regions, including the temporal-parietal junction (TPJ), which is implicated in more interpersonal cognitive functions such as mind-reading (DiNicola et al., 2020; Qin & Northoff, 2011). However, during rest, the only constantly available mental representation is the self. No task demands are involved, and any external objects, including social others, exist only in imagination. Taken together, these considerations suggest that DMN activity during rest should be positively associated with the salience of the personal self.
This hypothesis is also consistent with evidence from electroencephalography (EEG) research. The EEG resting state is dominated by the alpha rhythm, defined by neurons that oscillate (or “fire”) in synchrony between 8-13 Hz (Berger, 1929; Fries, 2005). Many studies have directly correlated activity in the DMN to the amplitude of the EEG alpha rhythm at rest (called “resting-state alpha power” or RSAP in short), showing a moderate positive relationship between these two measures (Jann et al., 2009, 2010; Mantini et al., 2007; Marino et al., 2019; Mo et al., 2013; Scheeringa et al., 2012; Wu et al., 2010). Moreover, while acknowledging various sensory functions, Klimesch (2012) emphasized that the functions of alpha underlie “the ability to be consciously oriented in time, space, and context (page 606).” This ability is a basis for one’s sense of personal unity or identity, and thus the self. Consistent with this line of reasoning, multiple studies have an association between alpha power and self-related ideation (Bai et al., 2016; Knyazev, 2013). This body of evidence suggests that there is a relationship between RSAP and the personal self.
1.3. Current Study
The aim of the present study was to examine the association between independent (vs. interdependent) SC and RSAP. Here, we drew on previous evidence that RSAP is related to the DMN, a correlate of mental processes such as self-reference (Davey et al., 2016), autobiographical memory (Andrews-Hanna et al., 2014), as well as the temporal and spatial unity of experience that contributes to the personal self (Peer et al., 2015). Based on this evidence, we hypothesized that RSAP would be greater for independent people who are believed to possess a more salient personal self. Moreover, we also predicted that RSAP should be greater for European Americans (who supposedly are more independent) than for East Asians (who are supposedly less independent and more interdependent). We compared European Americans with both Taiwanese (Study 1) and Japanese (Study 2).
Three critical features of our study design should be noted. First, prior evidence shows that RSAP is especially prominent when the eyes are closed, as external stimulation is reduced under these conditions (Webster & Ro, 2020). Thus, we tested whether the association between independent SC and RSAP might be moderated by this variable. Second, the DMN varies in its spatial organization across individuals (Braga et al., 2019; Braga & Buckner, 2017; DiNicola et al., 2020), and moreover EEG has generally poor spatial resolution (Luck, 2014). Hence, we did not have specific predictions for where the relationship between RSAP and SC might be localized. Thus, following past work establishing the relationship between RSAP and DMN activity, we used all available scalp electrodes in our analysis (Jann et al., 2009; Mantini et al., 2007; Scheeringa et al., 2012; Wu et al., 2010). However, for comprehensiveness we also examined the topography of the relationship between RSAP and SC. Third, in testing the effect of independent SC, we used a difference score between independent and interdependent SC scores (independent SC – interdependent SC). We also carried out subsidiary analyses based on each of the two SCs separately to explore their effects individually.
2. Study 1
2.1. Method
2.1.1. Participants
We recruited 45 Taiwanese college students at the National Cheng Kung University who participated in exchange for NT$ 420 (approximately $14). All 45 participants were right-handed, reported being of Asian descent, and were born and raised in Taiwan. Of these participants, one was excluded for reporting a current mental health diagnosis and 3 were excluded for excessive artifacts in their EEG. This left 41 participants for analysis (20 Male, 21 Female, Age: M = 21.61, SD = 2.98). We also recruited 38 American college students from the University of Michigan psychology subject pool. All participants were right-handed, reported being of European-American descent, and were born and raised in the US. One participant was excluded for not finishing the study and 2 were excluded for reporting a prior neurological issue or a current mental health diagnosis. This left 35 participants for analysis (13 Male, 22 Female, Age: M = 19, SD = 1.04).
2.1.2. Materials
To assess SC, participants completed a modified Singelis SC scale (Kitayama & Park, 2014), which is composed of two 10-item subscales, each measuring independent SC (e.g. “I always try to have my own opinions”) or interdependent SC (e.g. “I always try to have my own opinions.”). Participants rated their endorsement of the statements using a 5-point rating scale (1 = “Doesn’t describe me at all,” 5 = “Describes me very well”). The original English version was translated into Taiwanese. Back-translation was used to ensure meaning equivalence across languages. The reliabilities of the SC scale were adequate for Taiwanese (α = .77 and α = .60 for independent and interdependent SC, respectively) and for Americans (α = .74 and α = .68 for independent and interdependent SC, respectively). The interdependent SC score was subtracted from the independent SC score to yield a relative index of independent SC, which was used in the main analysis.
2.1.3. Procedure
Upon arrival, participants first completed a resting state task. Participants were seated approximately 60 cm from a color computer display while the EEG was recorded with the lights on. Participants then completed a cognitive task, the results of which are not reported here. They then completed several questionnaires, including the SC scale1.
The resting state procedure was presented using E-Prime 2.0 software (Schneider et al., 2002). Participants completed 3 minutes of eyes open resting state and 3 minutes of eyes closed resting state in alternating 1-minute blocks (six blocks total) in a counter-balanced order. Participants switched from the eyes-closed condition to the eyes-open condition, or vice versa, every minute. To cue the change, a brief tone was played and the instructions for that block (“Eyes Closed” or “Eyes Open”) were always displayed on the screen.
2.1.4. EEG Recording
For the Taiwanese data, we used a Neuroscan system in DC mode with a gain of 19 (range: 263 mV) using a 32 bit ADC and configured to the 10–20 electrode system. The EEG was recorded with 32 silver chloride scalp channels. AFz served as the ground electrode. The EEG scalp electrodes used for analysis were: Fp1, Fp2, F7, F3, Fz, F8, F4, FT7, FC3, FCz, FC4, FT8, T3, C3, Cz, C4, T4, TP7, CP3, CPz, CP4, TP8, T5, P3, Pz, P4, T6, O1, Oz, O2. An online band-pass filter was used during recording (.1-200 Hz) and the data was online referenced to the linked bilateral mastoids. The recorded EEG was digitized at 1000 Hz. The electrooculogram was monitored using bipolar VEOG and HEOG electrodes (Croft & Barry, 2000). Electrodes were also placed at the left and right mastoids. Impedances during data collection were kept under 10 kΩ.
For the US data, we used a BioSemi Active Two system (http://www.biosemi.com; BioSemi B.V., Amsterdam, Netherlands) configured to the 10–20 electrode system. The EEG was recorded with 32 silver chloride scalp channels. The EEG scalp electrodes used were: Fp1, Fp2, F7, F3, F4, F8, Fz, FC5, FC1, FCz, FC2, FC6, T7, C3, Cz, C4, T8, CP5, CP1, CPz, CP2, CP6, P7, P3, Pz, P4, P8, PO3, PO4, O1, Oz, O2. EEG data was recorded at 512 Hz. The electrooculogram was monitored using bipolar VEOG and HEOG electrodes (Croft & Barry, 2000). Electrodes were also placed at the left and right mastoids. Impedances during data collection were kept under 10 kΩ and acquired with an online reference unique to the Active Two system (see: http://www.biosemi.com). For the Active Two system, the online filter is low-pass only and performed by the ADC’s decimation filter with a 5th order sync response with a −3 dB point at 1/5th of the selected sample rate (see http://www.biosemi.com/faq/adjust_filter.htm).
2.1.5. EEG Data Processing
2.1.5.1. Data Preprocessing
All EEG pre-processing was performed using EEGLAB (Delorme & Makeig, 2004). The first step in pre-processing was to remove any EEG data recorded outside of the resting state procedure. Then for the Taiwanese data, an offline Butterworth low pass filter was applied at 20 Hz. The data were downsampled to 512 Hz, and the online left mastoid reference was removed. For the US data, a bandpass Butterworth filter was applied with cutoffs at .1 and 20 Hz. Then the data for all participants were visually inspected and large artifacts were manually removed.
Next, we performed an independent component analysis (ICA; Makeig et al., 1997). For each participant, ICA components were determined for 4 bipolar EOG electrodes and up to 30 and 32 scalp electrodes in Taiwan and the U.S., respectively. Scalp electrodes deemed unsuitable for analysis were removed before performing ICA for later interpolation. The initial learning rate for the ICA was 0.001 and the ICA converged when the weight change was smaller than 1E-7. The components were visually inspected and artifactual components were rejected. Rejected components were primarily related to eye movements captured by the EOG electrodes and muscle artifacts (McMenamin et al., 2010). Any previously removed channels were subsequently interpolated using spherical interpolation. The data were then inspected visually and any remaining artifacts were removed. Three Taiwanese participants and one American participant had less than one minute of data in either the eyes open or eyes closed condition after artifact rejection and thus they were discarded (as noted in the Participants section).
A current source density (CSD; Kayser & Tenke, 2006a) reference was then applied to the continuous data. The CSD reference acts as a spatial filter, helping to enhance the contribution of local activity and attenuate distal activity at each electrode, and it is effective with a typical 32 electrode montage (Kayser & Tenke, 2006b; Luck, 2014). This allows for both better localization of the scalp topography of RSAP and greater consistency in the distribution of RSAP across eyes open and eyes closed conditions, compared to other reference montages (Smith et al., 2017).
2.1.5.2. Estimation of Spectral Power
After applying a CSD reference, the data was segmented into 2000ms long epochs, with a 500ms overlap between adjacent epochs so that each epoch shared 75% of its timepoints with the subsequent epoch. This overlap minimizes the impact of the Hamming window used in a fast Fourier transformation (FFT) by providing closer to equal weighting for each timepoint in a recording (Smith et al., 2017). A FFT was then applied to the data with a 2000ms wide Hamming window and a 75% overlap. Each FFT was zero-padded by a factor of 2. In each FFT, 80 linear-spaced frequencies were extracted between .25 and 20 Hz in .25 Hz steps.
2.1.5.3. Estimation of Oscillatory Power
To characterize each individual’s power spectra, we utilized the fitting oscillations and one over f (FOOOF; Donoghue et al., 2020) toolkit. Unlike a typical measure of narrow band power (e.g., alpha) which includes both aperiodic (or background) power as well as oscillatory power, FOOOF attempts to model the slope of the aperiodic/background power and therefore can be used to isolate the contribution of oscillatory power (see Fig. 1 for an illustration). The use of this method also can help control for the comparison of spectral power across different EEG amplifiers, which can produce different measurements of absolute spectral power due to differences of ground electrodes, amplifier gain settings, and channel calibrations (Kayser et al., 2003; Luck, 2014)2.
Figure 1. FOOOF Decomposes the Underlying Components of Spectral Power.

Note. The estimated power spectra (via FOOOF) are shown for aperiodic power (dark grey) and oscillatory power (black) for the first 2 participants in the eyes closed condition of the Taiwanese dataset at electrode Pz. The total spectral power values from the observed signals are also shown (light grey). The alpha band (8-13 Hz) is demarcated with vertical black dotted lines. Notice that although the area under the curve (or amplitude) of the oscillatory signal (black) in the alpha band is similar in size across these 2 subjects, the amplitude of the aperiodic signal (dark grey) is much larger in subject 2. Thus, a typical spectral power measurement would erroneously conclude that the amplitude (and thus the number of neurons engaged in synchronized alpha oscillations) are greater in subject 2. By accounting for this aperiodic signal, a more accurate measurement of power from oscillatory activity in the alpha band can be obtained.
For each channel in each dataset, a FOOOF model was fit for the extracted power spectra between 1-20 Hz using the default settings. This model showed a good fit at each channel across participants (Taiwanese R2: M = .98, SD = .016, US R2: M = .99, SD = .011). From these models, an estimate of alpha power for both the aperiodic/background and oscillatory signals was obtained by averaging their log-transformed power values for 8-13 Hz. At each channel, the oscillatory (periodic) alpha power was normalized using the following formula: (Oscillatory Power – Aperiodic Power) / |Aperiodic Power|. The result of this equation was then multiplied by 100 to yield to a measure of the percent increase in oscillatory power from aperiodic power. The relative power increase in the alpha band was estimated separately for each channel and condition (eyes-closed/eyes-open) within each participant. To show the robustness of the results, we also report the final analysis with a standard measure of total spectral power in the alpha band (see Supplementary Results). In addition, we also report our results showing the effect of the slope of aperiodic power (power law exponent) as estimated by FOOOF (see Supplementary Results).
2.1.6. Data Analysis
We used linear mixed effects models (Baayen et al., 2008) to analyze the impact of SC on RSAP. These models were fit using the lme4 package in R utilizing restricted maximum likelihood to estimate the parameters (Bates et al., 2014). To fit each model, an estimate of alpha power was extracted from each electrode for each participant. Estimates from all electrodes were included in the model to estimate RSAP for each participant. SC difference scores were standardized within each culture to avoid conflating mean differences in SC scores between groups with any observed effects (Enders & Tofighi, 2007). The model was fit with the fixed effects of Condition (Eyes-Open/Eyes-Closed), Culture (US/Taiwanese), SC difference scores, and their interactions. To specify the random effects for the model, first the maximal random effects structure was fit to the data (Barr et al., 2013). This amounted to a random intercept being estimated for each participant as well as random slopes specified for each Condition (Judd et al., 2017). This model fit the data well and was used for analysis.
An omnibus type III F-test was used to determine whether any main effects or interactions were significant among the fixed effects of the model using the lmerTest package in R (Kuznetsova et al., 2017). When the fixed effects significantly differed from zero, pairwise post-hoc t-tests were used for simple effects tests using the lsmeans package in R (Lenth, 2016). When continuous variables were involved in interactions, pairwise post-hoc t-tests were used for simple slope tests of the continuous variable within each cell of the interaction. R2 values for all multilevel models were calculated using the method outlined by Nakagawa et al. (2017). Effect sizes are reported from the output of the models as Cohen’s d (Lakens, 2013)3. All relative RSAP values are reported as a percent increase in oscillatory power within the alpha band from the estimate of aperiodic power in the alpha band.
2.2. Results
2.2.1. Behavioral Results
Independent SC was significantly higher for Americans (M = 3.87, SD = .563) than for Taiwanese (M = 3.44, SD = .567), t(74) = 3.33, p = .001, ds = .76. Conversely, interdependent SC was significantly for higher for Taiwanese (M = 3.82, SD = .395) than for Americans (M = 3.50, SD = .525), t(74) = 3.03, p = .003, ds = .70. The relative independent SC score (independent SC – interdependent SC) was higher for Americans (M = .373, SD = .983) than for Taiwanese (M = −.38, SD = .765), t(74) = 3.75, p < .001, ds = .86.
2.2.2. Relative Resting-State Alpha Power (RSAP)
The linear mixed model analysis performed on relative RSAP showed that a substantial amount of the variance in relative RSAP was accounted for by the model (Marginal R2 = .24, Conditional R2 = .53). A significant main effect of Condition was observed, F(1,71,969) = 258.34, p < .001, dz = 1.87, indicating that relative RSAP was greater in the eyes-closed condition (M = 16.3, SE = .7) than in the eyes-open condition (M = 7.3, SE = .5). A significant main effect of independent (vs. interdependent) SC was also observed, F(1,71.987) = 3.98, p = .049, dz = .23, showing a positive relationship between relative RSAP and independent (vs. interdependent) SC. The interaction between Condition and independent (vs. interdependent) SC was not significant, F(1,71.968) = 2.27, p = .137, dz = .18. However, given our aim to explore the effect of SC in each of the two conditions, we tested the SC effect separately in each condition. It was significantly greater than 0 in the eyes-closed condition (β = .16, SE = .07), t(72) = 2.19, p = .032, dz = .25, but not in the eyes-open condition (β = .07, SE = .05), t(71.9) = 1.23, p = .224, dz = .14.
Of note, the main effect of Culture was not significant, F(1,71.988) = .39, p = .535, ds = .15, indicating that there was no difference in relative RSAP between groups. There was also no significant interaction between Condition and Culture (see Table 1), F(1,71.969) = 1.02, p = .316, dz = .12.
Table 1.
Mean Relative Resting-State Alpha Power (RSAP) by Culture and Condition in Study 1
| Culture | ||
|---|---|---|
|
| ||
| Condition | Taiwan | US |
| Eyes-Open | 7.3 (.7) | 7.3 (.7) |
| Eyes-Closed | 16.7 (.9) | 15.5 (1) |
Note. The mean relative RSAP (% increase in oscillatory power from the asynchronous power estimate) is shown for each culture and condition in Study 1. The standard errors for each value are displayed in parentheses
3. Study 2
3.1. Method
3.1.1. Participants
In this study, we tested both Japanese and American young adults. We recruited 43 college students from multiple universities in Tokyo in exchange for 3000 yen (equivalent of $28). They were all right-handed and reported being born and raised in Japan. Ten participants were excluded for having excessive artifacts in their EEG recordings, and another participant was excluded for reporting a current mental health diagnosis. This resulted in 32 participants with usable data (27 Female, 5 Male, Age M = 18.66, SD = 1.13). We also recruited 62 American college students at the University of Michigan, either through its psychology subject pool or in exchange for $25. They were all right-handed, reported being of European-American descent and were born, and raised in the US. Of these participants, 3 were excluded for reporting current mental health diagnoses. Three additional participants were excluded for having excessive artifacts in their EEG recordings. This left 56 participants with usable data (42 Female, 14 Male, Age M = 18.64, SD = .61).
3.1.2. Materials and Procedure
The materials and procedure in this study were nearly identical to Study 1. In this study however, the SC measure used had a scale ranging from 1-7 (in contrast with 1-5 in the first study). The reliabilities of the SC scale were adequate for both the US sample (αs = .69 and .66 for independent and interdependent SC, respectively) and the Japanese sample (αs = .75 and .75, for independent and interdependent SC, respectively). In addition, in this study participants completed 2 (rather than 3) minutes of resting state total in each condition (eyes-open, eyes-closed). As in Study 1, participants were required to have at least one minute of usable data in each condition for analysis. There were no other differences in the materials or resting state procedure from the previous study.
3.1.3. EEG Recording
In both samples, the EEG was recorded using a BioSemi Active Two system. The recording setup for both samples was almost identical to the US system described in Study 1. It was only slightly different for the Japanese sample. The channels used for the Japanese sample were: Fp1, Fp2, AF3, AF4, F7, F3, F4, F8, Fz, FC5, FC1, FCz, FC2, FC6, C3, Cz, C4, T8, CP5, CP1, CP2, CP6, P7, P3, Pz, P4, P8, PO3, PO4, O1, Oz, O2. Everything else in these recordings was identical to the US sample in Study 1.
3.1.4. EEG Data Processing and Data Analysis
The EEG data processing steps and data analysis were identical to those used for the US sample in Study 1. As in Study 1, the FOOOF model fit well at each channel across participants (Japanese R2: M = .984, SD = .019, US R2: M = .988, SD = .001).
3.2. Results
3.2.1. Behavioral Results
Independent SC was higher for Americans (M = 5.26, SD = .607) than for Japanese (M = 4.49, SD = .776), t(86) = 5.17, p < .001, ds = 1.1. The pattern was reversed for interdependent SC, with the Japanese mean (M = 4.95, SD = .696) being slightly higher than American mean (M = 4.88, SD = .605), although the difference was not significant, t(86) = .513, p = .609, ds = .11. Overall, the independent (vs. interdependent) SC score was greater for Americans (M = .385, SD = .935) than for Japanese (M = −.459, SD = 1.165), t(86) = 3.72, p < .001, ds = .79.
3.2.2. Relative Resting-State Alpha Power (RSAP)
The linear mixed model analysis performed on relative RSAP again showed that a substantial amount of variance in relative RSAP was explained by the model (Marginal R2 = .25, Conditional R2 = .53). A significant main effect of Condition was observed, F(1,84) = 386.84, p < .001, dz = 2.12, indicating that relative RSAP was greater in the eyes-closed condition (M = 17.2, SE =.6) versus the eyes-open condition (M = 8.3, SE = .5). Although the main effect of SC was not significant, F(1,83.999) = .07, p = .794, dz = .03, we found a significant interaction between Condition and SC, F(1,84) = 4.51, p = .037, dz = .23, indicating that the slope of the independent (vs. interdependent) SC score was significantly greater in the eyes-closed condition (β = .07, SE = .07) than in the eyes-open condition (β = −.04, SE = .06). However, neither of these slopes were significantly different from zero, t(84) = 1.07, p = .29, dz = .12, and t(84) = −.68, p = .496, dz = .07, respectively. This interaction was also not qualified by Culture, F(1,84) = .04, p = .836, dz = .02.
Unlike in Study 1, we found a significant main effect of Culture, F(1,83.999) = 4.19, p = .025, ds = .44, with American participants (M = 13.9, SE = .6) showing greater overall relative RSAP than Japanese participants (M = 11.6, SE = .8). This significant main effect was qualified by a significant interaction between Condition and Culture, F(1,84) = 11.01, p = .001, dz = .36 (see Table 2). Post-hoc simple effects tests showed that relative RSAP was significantly greater for Americans (M = 10.2, SE = .6) than for Japanese (M = 6.4, SE = .8) in the eyes-open condition, t(84) = 3.67, p < .001, ds = .79. However, there was no cultural difference in the eyes-closed condition, with American (M = 17.6, SE = .7) and Japanese participants (M = 16.9, SE = .9), t(84) = .67, p = .508, ds = .14. No other effects in the model were significant.
Table 2.
Mean Relative Resting-State Alpha Power (RSAP) by Culture and Condition in Study 2
| Culture | ||
|---|---|---|
|
| ||
| Condition | Japanese | US |
| Eyes Open | 6.4 (.8) | 10.2 (.6) |
| Eyes Closed | 16.9 (.9) | 17.6 (.7) |
Note. The mean relative RSAP (% increase in oscillatory power from the asynchronous power estimate) is shown for each culture and condition in Study 2. The standard errors for each value are also displayed.
4. Meta-Analysis
We subsequently integrated the data from the two studies by calculating a meta-analytic estimate of the relationship between relative RSAP and SC scores. As an exploratory analysis, we also tested whether any topographic effects for this relationship were present across all of the samples reported.
4.1. Method
4.1.1. Participants
The data from all participants reported in both studies (N = 164) are included in this meta-analysis.
4.1.2. Meta-Analysis
Each of the four samples (with each study counting as two separate samples) was treated separately. Thus, we had k = 4 samples in total. In each sample, an effect size was calculated for the slope of the relationship between SC scores and relative RSAP separately for each condition versus the null hypothesis (β = 0). The effect sizes for each sample and their associated standard errors were calculated based on the statistics from the reported multilevel models (Altman & Bland, 2011; Lakens, 2013).
The meta-analysis was performed with a random effects model estimated using restricted maximum likelihood in the meta package in R (Schwarzer, 2007). The significance of the effect sizes was evaluated with z-tests. Heterogeneity in the distribution of effect sizes was examined with the Q test and I2 statistic. To examine the impact of relevant variables on the effect sizes across the four samples, culture (US, East Asian), country of origin (Taiwan, Japan, US), and EEG amplifier (Neuroscan, BioSemi) were tested as moderators of the observed effect size. In our primary analyses, the most consistent pattern across both studies occurred in the eyes closed condition. We therefore focused on this condition for the meta-analysis. To ensure the robustness of the findings, we examined whether independent and interdependent SC scores showed the same effects as the SC difference score. Moreover, we also report the same meta-analytic estimates for total spectral power and the aperiodic slope (power law exponent) of the power spectrum (see Supplementary Results).
4.1.3. Topographic Analysis
For the topographic analysis, the 24 electrode locations common across all the four samples tested were used (Fp1, Fp2, F7, F3, Fz, F4, F8, FC3, FCz, FC4, C3, Cz, C4, T8, CP3, CP4, P7, P3, Pz, P4, P8, O1, Oz, O2)4. The relationship between independent (vs. interdependent) SC and relative RSAP at each electrode was estimated using a linear mixed effect model as outlined in section 3.1.6. The model was fit with the fixed effects of Condition (Eyes-Open/Eyes-Closed), Sample (US Study 1/Taiwanese/US Study 2/Japanese), Electrode (all 24 shared Electrode locations), SC difference scores, and their interactions. In this model, a random intercept was estimated for each subject and a random slope was estimated for each Condition and Electrode Row (Fp, F, FC, C, CP, P, O). This allowed the standard errors to vary topographically across the scalp by condition, as RSAP estimates tend to vary systematically by these variables (Webster & Ro, 2020). As CSD reference solutions are dependent on the electrode montage used (Kayser & Tenke, 2006a), and these were slightly different between studies, the topographical results here should be interpreted with caution.
4.2. Meta-Analysis Results
4.2.1. Relationship with the SC Difference Score
The weighted mean effect size (ES) revealed a significant positive association between relative RSAP in the eyes-closed condition and the independent (vs. interdependent) SC score (see Figure 2), ES = .189, 95% CI: [.039−.34], z = 2.47, p = .014. The distribution of the effect sizes did not show strong evidence for heterogeneity, Q(3) = 1.55, p = .671, I2 = 0%. We also tested whether the estimated effect sizes systematically differed by Culture (US/East Asian), Country (US/Taiwan/Japan), or EEG Amplifier (Neuroscan/BioSemi). None of these subgroups significantly differed in effect size (all ps > .3). Notably, the effect of SC was specific to the eyes-closed condition. The same meta-analysis performed for the eyes-open condition showed that the weighted mean effect size was not significantly different from zero, ES = .027, 95% CI: [−.118−.172], z = .36, p = .717.
Figure 2. Meta-analysis of Relative Resting-State Alpha Power (RSAP) with Eyes-Closed and SC Difference Score.
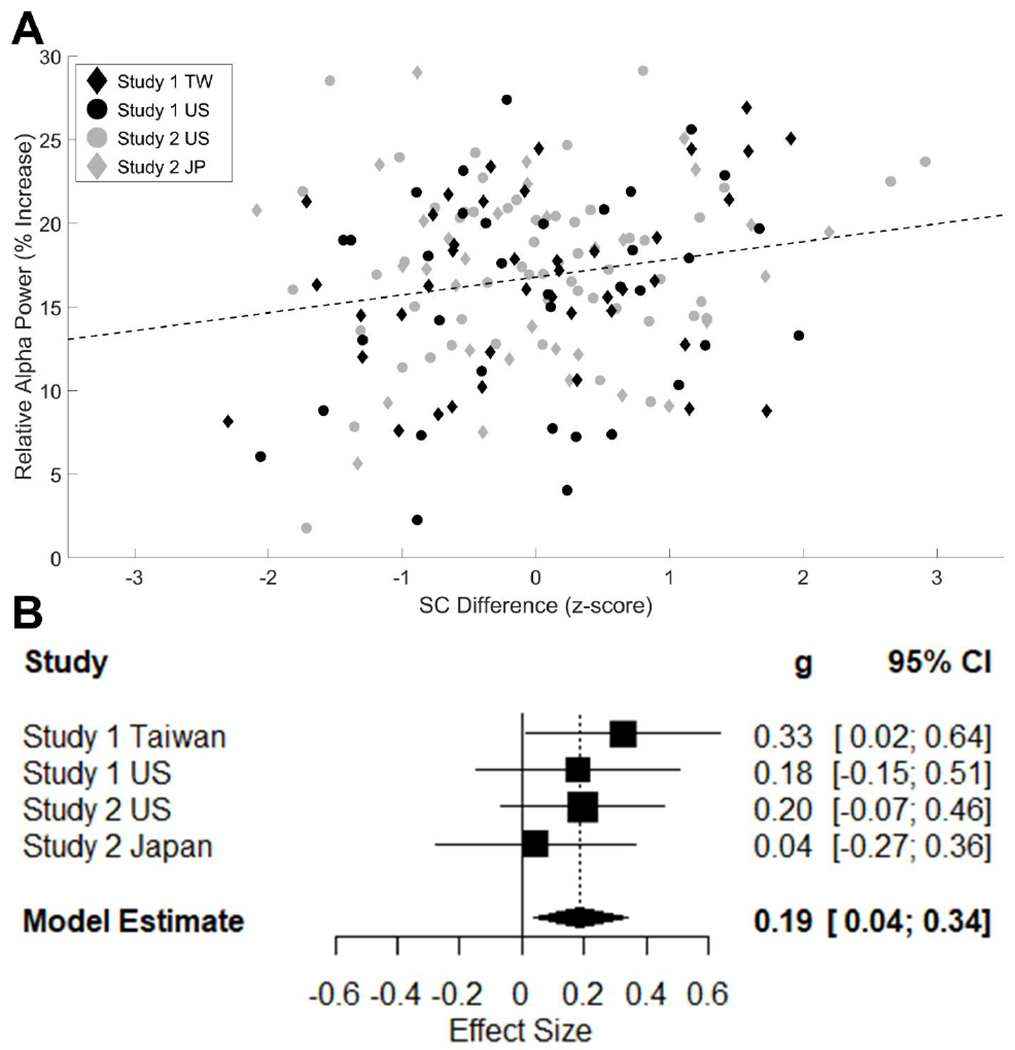
Note. The relationship between relative RSAP (% increase in oscillatory power from the aperiodic power estimate) and SC difference scores (z-scored within each sample) is plotted in two different ways. In the upper panel (A), a scatterplot of relative RSAP versus SC difference scores for all samples is shown. SC difference scores were standardized within each sample before plotting, as in the reported analyses. The symbol and color corresponding to each sample are noted in the top left corner for United States (US), Taiwanese (TW), and Japanese (JP) samples. Circles correspond to the participants in the US samples and diamonds for the East Asian samples. Data points for are colored in black for Study 1 and grey for Study 2. The line of best fit for all 4 samples combined (black dashed line) is also shown. Below (B), a forest plot of the effect sizes for the relationship between SC and relative RSAP power in the eyes-closed condition are also shown for all 4 samples reported. The square size indicates the relative weight of a study in the analysis and the lines indicate the range of the confidence interval.
4.2.2. Relationship with the Independent SC Score
The same analysis was performed for the Independent SC score (see Figure 3). This showed a significantly positive effect between the Independent SC score and relative RSAP in the eyes-closed condition ES = .169, 95% CI: [.016−.322], z = 2.17, p = .03. The effect sizes in this analysis also did not show strong evidence for heterogeneity, Q(3) = 3.45, p = .328, I2 = 13%. We again tested whether the estimated effect sizes systematically differed by Culture (US/East Asian), Country (US/Taiwan/Japan), or EEG Amplifier (Neuroscan/BioSemi). None of these subgroups significantly differed in effect size (all ps > .1). The same effect size was also calculated for Independence scores in the eyes-open condition. This effect was not significant, ES = .036, 95% CI: [−.113−.185], z = .47, p = .639.
Figure 3. Meta-analysis of Relative Resting-State Alpha Power (RSAP) with Eyes-Closed and Independent SC Score.
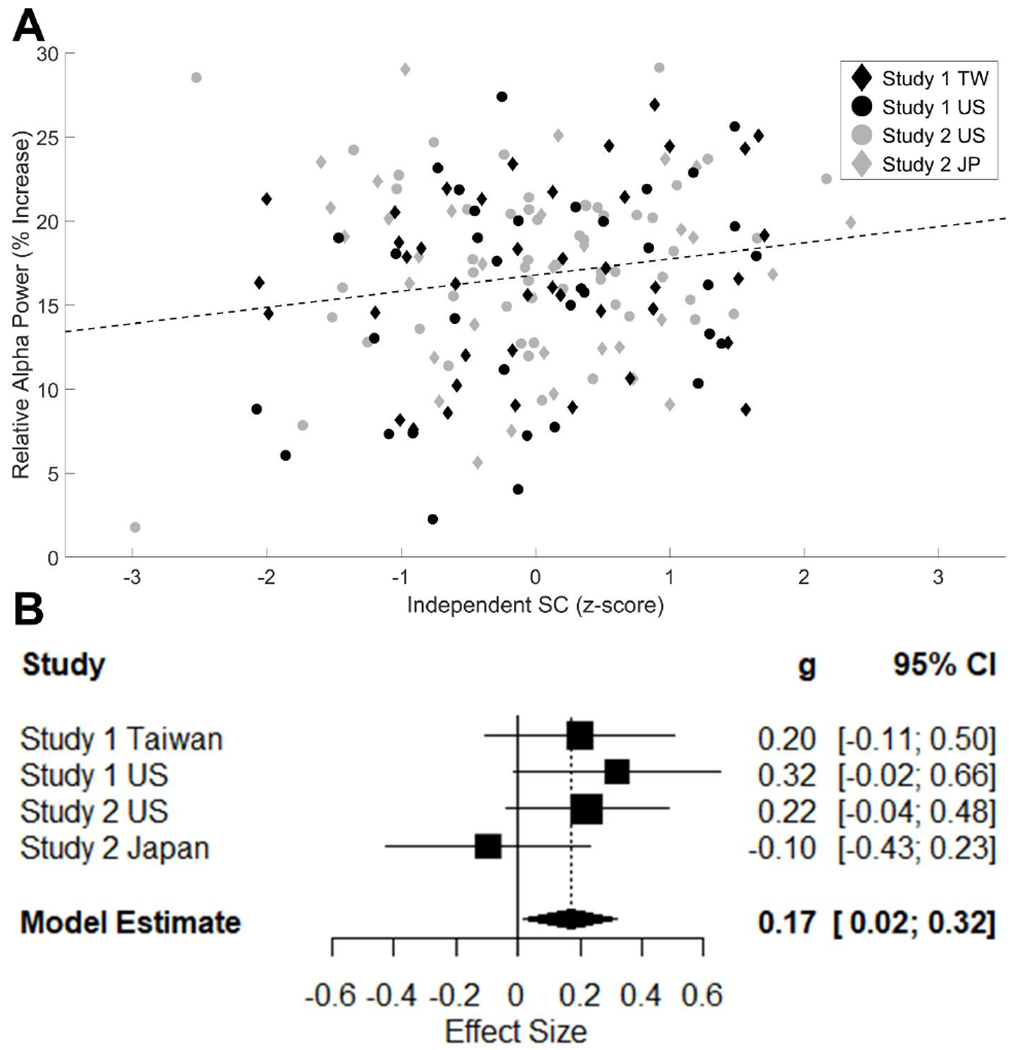
Note. The relationship between relative RSAP (% increase in oscillatory power from the aperiodic power estimate) and Independent SC (z-scored within each sample) is plotted in two different ways. In the upper panel (A), a scatterplot of relative RSAP versus Independent SC for all samples is shown. The same plotting conventions are used here as in Figure 2A. Below (B), a forest plot of the effect sizes for the relationship between Independent SC and relative RSAP in the eyes-closed condition is also shown for all 4 samples. The square size indicates the relative weight of a study in the analysis and the lines indicate the range of the confidence interval.
4.2.3. Relationship with the Interdependent SC Score
We also tested the effect size of Interdependence SC score on relative RSAP across all samples (see Figure 4). The Interdependent SC showed a negative relationship with relative RSAP in the eyes-closed condition, although this effect was not significant, ES = −.144, 95% CI: [−.293−.005], z = −1.89, p = .059. There was no evidence that the heterogeneity of the effect sizes was problematic, Q(3) = 2.57, p = .462, I2 = 0%. We also tested whether the estimated effect sizes systematically differed by Culture (US/East Asian), Country (US/Taiwan/Japan), or EEG Amplifier (Neuroscan/BioSemi). None of these subgroups significantly differed in effect size (all ps > .1). This same analysis was also performed for the eyes-open condition and the effect was also not significant, ES = −.015, 95% CI: [−.157−.128], z = −.2, p = .841.
Figure 4. Meta-analysis of Relative Resting-State Alpha Power (RSAP) with Eyes Closed and Interdependent SC Score.

Note. The relationship between relative RSAP (% increase in oscillatory power from the aperiodic power estimate) and Interdependent SC (z-scored within each sample) is plotted in two different ways. In the upper panel (A), a scatterplot of relative RSAP versus Interdependent SC for all samples is shown. The same plotting conventions are used here as in Figure 2A. Below (B), a forest plot of the effect sizes for the relationship between Interdependent SC and relative RSAP in the eyes-closed condition is also shown for all 4 samples reported. The square size indicates the relative weight of a study in the analysis and the lines indicate the range of the confidence interval.
4.3. Topographic Analysis
To explore whether relative RSAP at electrode-specific locations showed a significant relationship with SC scores, we included all 24 Electrode locations common across samples as an additional independent variable. We analyzed all 4 samples from the two studies (see Supplementary Results for additional analyses focusing on sample-specific analyses).
4.3.1. SC Difference Score
We first tested the topographic pattern using the SC difference score as the index of independent SC. The linear mixed model analysis performed on relative RSAP showed that a substantial amount of the variance was accounted for by the model (Marginal R2 = .51, Conditional R2 = .85). As in the main analyses reported, both the main effect of Condition and the Condition x SC interaction proved significant, F(1,156) = 633.93, p < .001, dz = 2.0 and F(1,156) = 5.98, p = .032, dz = .19, respectively. The Electrode x SC interaction was also significant, F(23,881.5) = 1.82, p = .011, dz = .07. This interaction, however, was qualified by a 3-way interaction involving Electrode, SC, and Sample, F(69,881.5) = 1.71, p < .001, dz = .07. There was some evidence that the SC effect was observed primarily in occipital/parietal electrodes in one of the two US samples (Study 2). However, the effect tended to be more diffuse in the other US sample (Study 1) as well as in the Taiwanese sample. There was no clear SC effect across all electrodes in the Japanese sample. A very similar pattern was observed when the independent SC score was used instead of the SC difference score. No systematic pattern was evident when the interdependent SC score was used.
5. Discussion
5.1. Resting-State Alpha Power (RSAP) and Independent SC
The contemporary cultural psychology literature explains a large number of cross-cultural differences in cognition, emotion, and motivation by hypothesizing that the personal self is more salient for those with independent (rather than interdependent) construals of the self (Markus & Kitayama, 1991; Triandis, 1989). In the present work, we utilized a neuroscience approach to provide evidence for this assumption. We drew on several lines of work that converge to suggest that DMN activity, which correlates with RSAP (Mantini et al., 2007; Marino et al., 2019), reflects mental processes that contribute to the personal self. These mental processes include self-reference (Qin & Northoff, 2011), autobiographical memory (Andrews-Hanna et al., 2014), and maintenance of the temporal and spatial unity of our moment-to-moment experience (Klimesch, 2012). We then observed a reliable relationship between SC and RSAP when the data from four samples (two American samples and two East Asian samples) were meta-analytically combined. This relationship was highly significant in the eyes-closed condition, and there was no evidence that the magnitude of the association significantly varied across samples. Critically, this relationship was driven primarily by independent (rather than interdependent) SC. Overall, our findings suggest that the personal self (as indicated by RSAP) is more salient for those with an independent (vs. interdependent) SC. This was observed for both relative RSAP and a standard measure of total RSAP.
Given the hypothesized overlap between the self and DMN activity (Northoff, 2016; Qin & Northoff, 2011), we could hypothesize that the strength of functional communication between regions of the DMN (as assessed by within-DMN functional connectivity in fMRI) also varies with the degree of one’s independent SC. Consistent with this premise, Li et al. (2018) used resting-state fMRI data from 51 Chinese participants and found that functional communication within the DMN was stronger for those with an independent (vs. interdependent) SC. Similarly, Knyazev and colleagues (2020) observed that the functional communication of the DMN was stronger for Russians with a more independent SC when making trait judgements about themselves. While much of this evidence is new and its robustness is unclear, it does converge with an earlier hypothesis by Northoff (2016) that DMN activity contains mental processes which comprise the self as an agent.
5.2. Is There Any Cultural Variation in Relative RSAP?
Since European Americans on average are more independent than Asians, we might expect European Americans to show greater relative RSAP than Asians in the eyes-closed condition. Contrary to this prediction, we found no cultural variation in relative RSAP in this condition. Curiously, European Americans did have significantly higher relative RSAP than Japanese in the eyes-open condition of Study 2 (see Table 2). European Americans’ relative RSAP, however, was substantially lower in Study 1 (see Table 1), and as a consequence it was not any higher than the relative RSAP of Taiwanese in that study (of note, there is no apparent difference in relative RSAP between Japanese and Taiwanese). Hence, there is no evidence for a cultural difference between European Americans than Asians in the eyes-closed condition. We would have expected a cultural difference in this condition given our finding that independent SC predicts relative RSAP in the eyes-closed condition. However, curiously, in the eyes-open condition (where we observe no relationship between RSAP and independent SC), European Americans had higher levels of relative RSAP in one sample (i.e., in Study 2, but not in Study 1), compared to either Taiwanese or Japanese. The pattern observed here is puzzling and hard to interpret. Nevertheless, this apparent anomaly might reflect, at least in part, the nature of independence in Western, individualistic cultural contexts.
Such socio-cultural contexts impose a strong demand to act independently—that is, to use one’s values, attitudes, and preferences to guide one’s own actions. This societal demand for independence is most relevant in such contexts that call for certain concrete actions (e.g., choosing someone to marry, expressing one’s opinion even in front of someone opposing it). This societal demand is inscribed in daily conventions and practices and thus is collective in nature. Everyone in these societies will be subject to it regardless of their levels of independent SC. In such societies, then, people would benefit from trying to acting independently in all social settings. However, since this effort would be psychologically taxing, they may actively stop and discontinue this effort, at least temporarily, outside of such social settings. We suggest that the resting-state EEG procedure, especially in the eyes-closed condition, might represent one such context. Under these conditions, European Americans may feel less compelled to be independent temporarily, unless they are very high in independent SC. However, more work is needed to fully test this conjecture.
A visualization of the pattern of results associated with the inference above is schematically illustrated in Figure 5. A positive correlation exists between independent SC and relative RSAP in each of two groups, A and B. Since Group A (e.g., Americans) is more independent than Group B (e.g., Taiwanese/Japanese), we might expect the average relative alpha power to be higher for Group A. The projected distribution of the Group A data points is illustrated with the dotted oval. However, in Group A, there is a downward push on relative RSAP in the eyes-closed condition, as indicated by the black arrows. According to this analysis, in East Asian, collectivistic societies (Group B) including Japan and Taiwan, there is no strong social demand to act independently in social settings. Therefore, there may be no inhibition of independence in the resting-state EEG setting even in the eyes-closed condition.
Figure 5. Visualization of the Proposed Relationship Between Culture and Relative RSAP.

Note. A schematic illustration of how a culture-level factor (e.g., a social norm idiosyncratic to one culture, designated by downward arrows) may modulate the group mean, independent of the effect of an individual difference factor (e.g., independent self-construal).
5.3. Other Contributions to RSAP
Replicating one of the oldest effects in EEG (Berger, 1929), we found that RSAP is much greater when eyes are closed (vs. open). This is consistent with past work showing the role of RSAP as an index of internally oriented attention (Benedek et al., 2014). Of significance, the association between independent SC and RSAP was found only in the eyes-closed condition. This finding is similar to previous work where the relationship between RSAP and a measure of episodic, self-related ideation during rest was only present when the eyes were closed (Knyazev et al., 2011). It is possible that RSAP in the eyes-closed condition serves as a reliable correlate of the personal self because there is no available external visual stimulation under these conditions. This interpretation is also consistent with the well documented role of alpha as a correlate of sensory gating via the thalamus (Klimesch et al., 2007). Additionally, it should be noted that while we primarily focus on the evidence for a relationship between the DMN and alpha here, the thalamus may directly modulate both the activity of the DMN and alpha (Buckner & DiNicola, 2019; Liu et al., 2012). Future work will have to explore exactly which mechanisms underlie the relationship between the DMN and alpha activity.
Our exploratory analysis focusing on topographic locations of the association between independent SC and relative RSAP showed that the localization of the effect is sample-dependent. This finding is consistent with the CSD reference used here varying with the electrode montage used (Kayser & Tenke, 2006a). Because of this source of variability in the distribution of relative RSAP across studies, quantifying alpha power from all available scalp electrodes is likely the best way to find robust relationships with SC. This method of quantifying alpha is consistent with past studies reporting correlations in activity between RSAP and DMN activity when RSAP is assessed from all available scalp electrodes (Jann et al., 2009; Mantini et al., 2007; Scheeringa et al., 2012; Wu et al., 2010). Subsequent work using consistent electrode montages across samples will be better suited to localize the relationship between RSAP and independent SC.
Prior work (Huang et al., 2016; Wolff et al., 2019) has reported that private self-consciousness (an aspect of the personal self) is correlated with the slope of aperiodic power (see the solid black lines in Figure 1). This slope has been shown to be steeper for those high in private self-consciousness. Curiously, we found no evidence that SC is related to this slope (see Figures S7–S12). While independent SC and private self-consciousness could both be aspects of the personal self, they may constitute separate and potentially distinct facets of the personal self. Additional work is needed to clarify the possible psychological significance of these different parameters of the resting-state EEG signal.
5.4. Limitations and Future Directions
Some limitations of our work must be noted. First, our findings between SC and RSAP are correlational. Future work may try to experimentally manipulate independence and interdependence to see how it influences both self-related thought and RSAP. One way to accomplish this would be to temporarily increase independent SC via an experimental priming manipulation (Oyserman & Lee, 2008). We may expect RSAP to increase when independent SC is primed.
Second, we could also test if the causal effect runs in the opposite direction. For example, RSAP could plausibly be manipulated experimentally via transcranial magnetic stimulation (Bonnard et al., 2016). This manipulation could possibly facilitate mental processes such as self-reference and autobiographic memory, which in theory could make one feel more independent. A finding of this nature would establish a causal role of RSAP in the formation of the independent sense of the self.
Third, we have hypothesized that RSAP is a valid index of the personal self. However, this hypothesis should at best be seen as a first approximation. The personal self may be composed of multiple sources of information (Neisser, 1988) including correlates of RSAP, such as self-reference and accessing autobiographical memory (Bai et al., 2016; Knyazev et al., 2011). However, the personal self may also include cognitively more elaborate processes, such as the stream of thoughts as conceptualized by William James (1890) and self-schemas (Markus, 1977). Future work would benefit from a more thorough examination of the relationship between RSAP and these different facets of self-consciousness.
Fourth, our samples were composed of only European Americans and East Asians. Future work must explore the relationship between SC and RSAP in other cultural contexts. Even though many non-Western cultures, including Latin American and African cultures, are less independent, they are also extremely diverse. Thus, the culture-level influences we postulated in Figure 5 could be correspondingly diverse. The examination of these influences would require a more expanded theoretical framework that considers a broad set of socio-ecological, historical, and even political variables in the analysis of neural correlates of the self, including, but not limited to, RSAP (Kitayama & Uskul, 2011).
Despite these limitations, our work is the first to show that RSAP conveys important information about the nature of the independent self. It has therefore laid down much-needed groundwork for further neuroscience investigations of culture and the self.
Supplementary Material
Highlights:
We correlated oscillatory resting-state alpha power with self-construal scores
Independent self-construal predicted alpha oscillations when the eyes were closed
The overall power differences in alpha oscillations were inconsistent across cultures
Alpha oscillations at rest contain information relevant to the personal self
Acknowledgements
This work was supported by NIH grant T32NS047987 (to B.K.), an NSF grant (SES 1325881), and a Russell Sage Foundation Residential Fellowship (to S.K.).
Footnotes
Publisher's Disclaimer: This is a PDF file of an unedited manuscript that has been accepted for publication. As a service to our customers we are providing this early version of the manuscript. The manuscript will undergo copyediting, typesetting, and review of the resulting proof before it is published in its final form. Please note that during the production process errors may be discovered which could affect the content, and all legal disclaimers that apply to the journal pertain.
The scales included were the Rosenberg Self-Esteem scale (Rosenberg, 1965), the Generalized Self-Efficacy scale (R. Schwarzer & Jerusalem, 2010), the Regulatory Focus Questionnaire (Higgins et al., 2001), the Need to Belong scale (Leary et al., 2013), the Fear of Negative Evaluation scale (Leary, 1983), and the Behavioral Inhibition/Activation scale (Carver & White, 1994). These measures were included for other purposes and are not analyzed here.
According to Luck (2014), normalizing the signal is an acceptable way to minimize the potential impact of non-equivalent raw voltage measurements between EEG systems. As any differences in raw voltage across systems should equally affect both aperiodic (background) and oscillatory power, the normalization performed here should minimize these differences.
Cohen’s d is reported here as Cohen’s dz for within-subjects tests and Cohen’s ds for between-subjects tests (Lakens, 2013). It should also be noted that the effect sizes for F-tests of regression coefficients and the relationships between alpha power and SC are reported as Cohen’s dz, as the statistical test used for these effects is conceptually similar to a one sample t-test. This is a more conservative effect size measure than the typical between-subjects version of Cohen’s ds, and thus our reported effect sizes may be an underestimate of the true magnitude of these effects.
Our electrode coverage was reduced primarily by the Taiwanese system (Neuroscan), which used many different electrode locations from the Japanese and the US systems (BioSemi). To remedy this situation, we extrapolated alpha power for these electrodes in the other samples to make them consistent with the electrodes in the Taiwanese sample. In the US and Japanese data, CP4 was estimated from the average of CP6 and CP2, CP3 was estimated using the average of CP5 and CP1, FC4 was estimated using the average of FC2 and FC6, and FC3 was estimated using the average of FC1 and FC5. None of these estimated electrodes showed a significant relationship with any SC scores and the overall results did not change when these estimated electrodes were removed to the analysis.
References
- Altman DG, & Bland JM (2011). How to obtain the confidence interval from a P value. Bmj, 343, d2090. [DOI] [PubMed] [Google Scholar]
- Andrews-Hanna JR, Saxe R, & Yarkoni T (2014). Contributions of episodic retrieval and mentalizing to autobiographical thought: Evidence from functional neuroimaging, resting-state connectivity, and fMRI meta-analyses. Neuroimage, 91, 324–335. [DOI] [PMC free article] [PubMed] [Google Scholar]
- Baayen RH, Davidson DJ, & Bates DM (2008). Mixed-effects modeling with crossed random effects for subjects and items. Journal of Memory and Language, 59(4), 390–412. [Google Scholar]
- Bai Y, Nakao T, Xu J, Qin P, Chaves P, Heinzel A, Duncan N, Lane T, Yen N-S, Tsai S-Y, & Northoff G (2016). Resting state glutamate predicts elevated pre-stimulus alpha during self-relatedness: A combined EEG-MRS study on “rest-self overlap.” Social Neuroscience, 11(3), 249–263. [DOI] [PubMed] [Google Scholar]
- Barr DJ, Levy R, Scheepers C, & Tily HJ (2013). Random effects structure for confirmatory hypothesis testing: Keep it maximal. Journal of Memory and Language, 68(3), 255–278. [DOI] [PMC free article] [PubMed] [Google Scholar]
- Bates D, Mächler M, Bolker B, & Walker S (2014). Fitting linear mixed-effects models using lme4. ArXiv Preprint ArXiv:1406.5823. [Google Scholar]
- Benedek M, Schickel RJ, Jauk E, Fink A, & Neubauer AC (2014). Alpha power increases in right parietal cortex reflects focused internal attention. Neuropsychologia, 56, 393–400. [DOI] [PMC free article] [PubMed] [Google Scholar]
- Berger H (1929). Über das elektroenkephalogramm des menschen. Archiv Für Psychiatrie Und Nervenkrankheiten, 87(1), 527–570. [Google Scholar]
- Bonnard M, Chen S, Gaychet J, Carrere M, Woodman M, Giusiano B, & Jirsa V (2016). Resting state brain dynamics and its transients: A combined TMS-EEG study. Scientific Reports, 6(1), 1–9. [DOI] [PMC free article] [PubMed] [Google Scholar]
- Braga RM, & Buckner RL (2017). Parallel interdigitated distributed networks within the individual estimated by intrinsic functional connectivity. Neuron, 95(2), 457–471. [DOI] [PMC free article] [PubMed] [Google Scholar]
- Braga RM, Van Dijk KR, Polimeni JR, Eldaief MC, & Buckner RL (2019). Parallel distributed networks resolved at high resolution reveal close juxtaposition of distinct regions. Journal of Neurophysiology, 121(4), 1513–1534. [DOI] [PMC free article] [PubMed] [Google Scholar]
- Buckner RL, & DiNicola LM (2019). The brain’s default network: Updated anatomy, physiology and evolving insights. Nature Reviews Neuroscience, 20(10), 593–608. [DOI] [PubMed] [Google Scholar]
- Carver CS, & White TL (1994). Behavioral inhibition, behavioral activation, and affective responses to impending reward and punishment: The BIS/BAS scales. Journal of Personality and Social Psychology, 67(2), 319. [Google Scholar]
- Croft RJ, & Barry RJ (2000). Removal of ocular artifact from the EEG: A review. Neurophysiologie Clinique/Clinical Neurophysiology, 30(1), 5–19. [DOI] [PubMed] [Google Scholar]
- Davey CG, Pujol J, & Harrison BJ (2016). Mapping the self in the brain’s default mode network. NeuroImage, 132, 390–397. [DOI] [PubMed] [Google Scholar]
- Delorme A, & Makeig S (2004). EEGLAB: An open source toolbox for analysis of single-trial EEG dynamics including independent component analysis. Journal of Neuroscience Methods, 134(1), 9–21. [DOI] [PubMed] [Google Scholar]
- DiNicola LM, Braga RM, & Buckner RL (2020). Parallel distributed networks dissociate episodic and social functions within the individual. Journal of Neurophysiology, 123(3), 1144–1179. [DOI] [PMC free article] [PubMed] [Google Scholar]
- Donoghue T, Haller M, Peterson EJ, Varma P, Sebastian P, Gao R, Noto T, Lara AH, Wallis JD, & Knight RT (2020). Parameterizing neural power spectra into periodic and aperiodic components. Nature Neuroscience, 23(12), 1655–1665. [DOI] [PMC free article] [PubMed] [Google Scholar]
- Enders CK, & Tofighi D (2007). Centering predictor variables in cross-sectional multilevel models: A new look at an old issue. Psychological Methods, 12(2), 121. [DOI] [PubMed] [Google Scholar]
- Fries P (2005). A mechanism for cognitive dynamics: Neuronal communication through neuronal coherence. Trends in Cognitive Sciences, 9(10), 474–480. [DOI] [PubMed] [Google Scholar]
- Higgins ET, Friedman RS, Harlow RE, Idson LC, Ayduk ON, & Taylor A (2001). Achievement orientations from subjective histories of success: Promotion pride versus prevention pride. European Journal of Social Psychology, 31(1), 3–23. [Google Scholar]
- Huang Z, Obara N, Davis HH IV, Pokorny J, & Northoff G (2016). The temporal structure of resting-state brain activity in the medial prefrontal cortex predicts self-consciousness. Neuropsychologia, 82, 161–170. [DOI] [PubMed] [Google Scholar]
- James W (1890). The principles of psychology (Vol. 1). New York: Holt. [Google Scholar]
- Jann K, Dierks T, Boesch C, Kottlow M, Strik W, & Koenig T (2009). BOLD correlates of EEG alpha phase-locking and the fMRI default mode network. Neuroimage, 45(3), 903–916. [DOI] [PubMed] [Google Scholar]
- Jann K, Kottlow M, Dierks T, Boesch C, & Koenig T (2010). Topographic electrophysiological signatures of fMRI resting state networks. PloS One, 5(9), e12945. [DOI] [PMC free article] [PubMed] [Google Scholar]
- Judd CM, Westfall J, & Kenny DA (2017). Experiments with more than one random factor: Designs, analytic models, and statistical power. Annual Review of Psychology, 68, 601–625. [DOI] [PubMed] [Google Scholar]
- Kayser J, & Tenke CE (2006a). Principal components analysis of Laplacian waveforms as a generic method for identifying ERP generator patterns: I. Evaluation with auditory oddball tasks. Clinical Neurophysiology, 117(2), 348–368. [DOI] [PubMed] [Google Scholar]
- Kayser J, & Tenke CE (2006b). Principal components analysis of Laplacian waveforms as a generic method for identifying ERP generator patterns: II. Adequacy of low-density estimates. Clinical Neurophysiology, 117(2), 369–380. [DOI] [PubMed] [Google Scholar]
- Kayser J, Tenke CE, & Bruder GE (2003). Evaluating the quality of ERP measures across recording systems: A commentary on Debener et al.(2002). International Journal of Psychophysiology, 48(3), 315–316. [DOI] [PubMed] [Google Scholar]
- Kim H, & Markus HR (1999). Deviance or uniqueness, harmony or conformity? A cultural analysis. Journal of Personality and Social Psychology, 77(4), 785. [Google Scholar]
- Kitayama S, & Cohen D (2010). Handbook of cultural psychology. [Google Scholar]
- Kitayama S, Duffy S, Kawamura T, & Larsen JT (2003). Perceiving an object and its context in different cultures: A cultural look at new look. Psychological Science, 14(3), 201–206. [DOI] [PubMed] [Google Scholar]
- Kitayama S, Mesquita B, & Karasawa M (2006). Cultural affordances and emotional experience: Socially engaging and disengaging emotions in Japan and the United States. Journal of Personality and Social Psychology, 91(5), 890. [DOI] [PubMed] [Google Scholar]
- Kitayama S, Park H, Sevincer AT, Karasawa M, & Uskul AK (2009). A cultural task analysis of implicit independence: Comparing North America, Western Europe, and East Asia. Journal of Personality and Social Psychology, 97(2), 236. [DOI] [PubMed] [Google Scholar]
- Kitayama S, & Park J (2014). Error-related brain activity reveals self-centric motivation: Culture matters. Journal of Experimental Psychology: General, 143(1), 62. [DOI] [PubMed] [Google Scholar]
- Kitayama S, Snibbe AC, Markus HR, & Suzuki T (2004). Is there any “free” choice? Self and dissonance in two cultures. Psychological Science, 15(8), 527–533. [DOI] [PubMed] [Google Scholar]
- Kitayama S, & Uskul AK (2011). Culture, mind, and the brain: Current evidence and future directions. Annual Review of Psychology, 62, 419–449. [DOI] [PubMed] [Google Scholar]
- Klimesch W (2012). Alpha-band oscillations, attention, and controlled access to stored information. Trends in Cognitive Sciences, 16(12), 606–617. [DOI] [PMC free article] [PubMed] [Google Scholar]
- Klimesch W, Sauseng P, & Hanslmayr S (2007). EEG alpha oscillations: The inhibition–timing hypothesis. Brain Research Reviews, 53(1), 63–88. [DOI] [PubMed] [Google Scholar]
- Knyazev GG (2013). EEG correlates of self-referential processing. Frontiers in Human Neuroscience, 7, 264. [DOI] [PMC free article] [PubMed] [Google Scholar]
- Knyazev GG, Savostyanov AN, Bocharov AV, Levin EA, & Rudych PD (2020). The default mode network in self-and other-referential processing: Effect of cultural values. Culture and Brain, 1–17. [Google Scholar]
- Knyazev GG, Slobodskoj-Plusnin JY, Bocharov AV, & Pylkova LV (2011). The default mode network and EEG alpha oscillations: An independent component analysis. Brain Research, 1402, 67–79. [DOI] [PubMed] [Google Scholar]
- Kraus B, & Kitayama S (2019). Interdependent self-construal predicts emotion suppression in Asian Americans: An electro-cortical investigation. Biological Psychology, 146, 107733. [DOI] [PubMed] [Google Scholar]
- Kuznetsova A, Brockhoff PB, & Christensen RHB (2017). lmerTest package: Tests in linear mixed effects models. Journal of Statistical Software, 82(13). [Google Scholar]
- Lakens D (2013). Calculating and reporting effect sizes to facilitate cumulative science: A practical primer for t-tests and ANOVAs. Frontiers in Psychology, 4, 863. [DOI] [PMC free article] [PubMed] [Google Scholar]
- Leary MR (1983). A brief version of the Fear of Negative Evaluation Scale. Personality and Social Psychology Bulletin, 9(3), 371–375. [Google Scholar]
- Leary MR, Kelly KM, Cottrell CA, & Schreindorfer LS (2013). Construct validity of the need to belong scale: Mapping the nomological network. Journal of Personality Assessment, 95(6), 610–624. [DOI] [PubMed] [Google Scholar]
- Lenth RV (2016). Least-squares means: The R package lsmeans. Journal of Statistical Software, 69(1), 1–33. [Google Scholar]
- Li LMW, Luo S, Ma J, Lin Y, Fan L, Zhong S, Yang J, Huang Y, Gu L, & Fan L (2018). Functional connectivity pattern underlies individual differences in independent self-construal. Social Cognitive and Affective Neuroscience, 13(3), 269–280. [DOI] [PMC free article] [PubMed] [Google Scholar]
- Liu Z, de Zwart JA, Yao B, van Gelderen P, Kuo L-W, & Duyn JH (2012). Finding thalamic BOLD correlates to posterior alpha EEG. Neuroimage, 63(3), 1060–1069. [DOI] [PMC free article] [PubMed] [Google Scholar]
- Luck SJ (2014). An introduction to the event-related potential technique. MIT press. [Google Scholar]
- Makeig S, Jung T-P, Bell AJ, Ghahremani D, & Sejnowski TJ (1997). Blind separation of auditory event-related brain responses into independent components. Proceedings of the National Academy of Sciences, 94(20), 10979–10984. [DOI] [PMC free article] [PubMed] [Google Scholar]
- Mantini D, Perrucci MG, Del Gratta C, Romani GL, & Corbetta M (2007). Electrophysiological signatures of resting state networks in the human brain. Proceedings of the National Academy of Sciences, 104(32), 13170–13175. [DOI] [PMC free article] [PubMed] [Google Scholar]
- Marino M, Arcara G, Porcaro C, & Mantini D (2019). Hemodynamic correlates of electrophysiological activity in the default mode network. Frontiers in Neuroscience, 13, 1060. [DOI] [PMC free article] [PubMed] [Google Scholar]
- Markus HR (1977). Self-schemata and processing information about the self. Journal of Personality and Social Psychology, 35(2), 63. [Google Scholar]
- Markus HR, & Kitayama S (1991). Culture and the self: Implications for cognition, emotion, and motivation. Psychological Review, 98(2), 224. [Google Scholar]
- Masuda T, & Nisbett RE (2001). Attending holistically versus analytically: Comparing the context sensitivity of Japanese and Americans. Journal of Personality and Social Psychology, 81(5), 922. [DOI] [PubMed] [Google Scholar]
- McMenamin BW, Shackman AJ, Maxwell JS, Bachhuber DR, Koppenhaver AM, Greischar LL, & Davidson RJ (2010). Validation of ICA-based myogenic artifact correction for scalp and source-localized EEG. Neuroimage, 49(3), 2416–2432. [DOI] [PMC free article] [PubMed] [Google Scholar]
- Mo J, Liu Y, Huang H, & Ding M (2013). Coupling between visual alpha oscillations and default mode activity. Neuroimage, 68, 112–118. [DOI] [PMC free article] [PubMed] [Google Scholar]
- Morris MW, & Peng K (1994). Culture and cause: American and Chinese attributions for social and physical events. Journal of Personality and Social Psychology, 67(6), 949. [Google Scholar]
- Na J, & Kitayama S (2011). Spontaneous trait inference is culture-specific: Behavioral and neural evidence. Psychological Science, 22(8), 1025–1032. [DOI] [PubMed] [Google Scholar]
- Nakagawa S, Johnson PC, & Schielzeth H (2017). The coefficient of determination R 2 and intra-class correlation coefficient from generalized linear mixed-effects models revisited and expanded. Journal of the Royal Society Interface, 14(134), 20170213. [DOI] [PMC free article] [PubMed] [Google Scholar]
- Neisser U (1988). Five kinds of self-knowledge. Philosophical Psychology, 1(1), 35–59. [Google Scholar]
- Northoff G (2016). Is the self a higher-order or fundamental function of the brain? The “basis model of self-specificity” and its encoding by the brain’s spontaneous activity. Cognitive Neuroscience, 7(1–4), 203–222. [DOI] [PubMed] [Google Scholar]
- Oyserman D, & Lee SW (2008). Does culture influence what and how we think? Effects of priming individualism and collectivism. Psychological Bulletin, 134(2), 311. [DOI] [PubMed] [Google Scholar]
- Peer M, Salomon R, Goldberg I, Blanke O, & Arzy S (2015). Brain system for mental orientation in space, time, and person. Proceedings of the National Academy of Sciences, 112(35), 11072–11077. [DOI] [PMC free article] [PubMed] [Google Scholar]
- Qin P, & Northoff G (2011). How is our self related to midline regions and the default-mode network? Neuroimage, 57(3), 1221–1233. [DOI] [PubMed] [Google Scholar]
- Raichle ME, MacLeod AM, Snyder AZ, Powers WJ, Gusnard DA, & Shulman GL (2001). A default mode of brain function. Proceedings of the National Academy of Sciences, 98(2), 676–682. [DOI] [PMC free article] [PubMed] [Google Scholar]
- Rosenberg M (1965). Rosenberg self-esteem scale (RSE). Acceptance and Commitment Therapy. Measures Package, 61(52), 18. [Google Scholar]
- Savani K, Markus HR, & Conner AL (2008). Let your preference be your guide? Preferences and choices are more tightly linked for North Americans than for Indians. Journal of Personality and Social Psychology, 95(4), 861. [DOI] [PubMed] [Google Scholar]
- Scheeringa R, Petersson KM, Kleinschmidt A, Jensen O, & Bastiaansen MC (2012). EEG alpha power modulation of fMRI resting-state connectivity. Brain Connectivity, 2(5), 254–264. [DOI] [PMC free article] [PubMed] [Google Scholar]
- Schneider W, Eschman A, & Zuccolotto A (2002). E-Prime: User’s guide. Psychology Software Incorporated. [Google Scholar]
- Schwarzer G (2007). meta: An R package for meta-analysis. R News, 7(3), 40–45. [Google Scholar]
- Schwarzer R, & Jerusalem M (2010). The general self-efficacy scale (GSE). Anxiety, Stress, and Coping, 12(1), 329–345. [Google Scholar]
- Shweder RA, & Bourne EJ (1982). Does the concept of the person vary cross-culturally? In Cultural conceptions of mental health and therapy (pp. 97–137). Springer. [Google Scholar]
- Smith EE, Reznik SJ, Stewart JL, & Allen JJ (2017). Assessing and conceptualizing frontal EEG asymmetry: An updated primer on recording, processing, analyzing, and interpreting frontal alpha asymmetry. International Journal of Psychophysiology, 111, 98–114. [DOI] [PMC free article] [PubMed] [Google Scholar]
- Triandis HC (1989). The self and social behavior in differing cultural contexts. Psychological Review, 96(3), 506. [Google Scholar]
- Webster K, & Ro T (2020). Visual Modulation of Resting State α Oscillations. ENeuro, 7(1). [DOI] [PMC free article] [PubMed] [Google Scholar]
- Whitfield-Gabrieli S, Moran JM, Nieto-Castañón A, Triantafyllou C, Saxe R, & Gabrieli JD (2011). Associations and dissociations between default and self-reference networks in the human brain. Neuroimage, 55(1), 225–232. [DOI] [PubMed] [Google Scholar]
- Wolff A, Di Giovanni DA, Gómez-Pilar J, Nakao T, Huang Z, Longtin A, & Northoff G (2019). The temporal signature of self: Temporal measures of resting-state EEG predict self-consciousness. Human Brain Mapping, 40(3), 789–803. [DOI] [PMC free article] [PubMed] [Google Scholar]
- Wu L, Eichele T, & Calhoun VD (2010). Reactivity of hemodynamic responses and functional connectivity to different states of alpha synchrony: A concurrent EEG-fMRI study. Neuroimage, 52(4), 1252–1260. [DOI] [PMC free article] [PubMed] [Google Scholar]
Associated Data
This section collects any data citations, data availability statements, or supplementary materials included in this article.