Abstract
The aim of this article was to design a self-emulsifying drug delivery system (SEDDS) of loaded cepharanthine (CEP) to improve the oral bioavailability in rats. Based on the solubility determination and pseudo-ternary phase diagram, isopropyl palmitate (IPP) was chosen as the oil phase. Meanwhile, Cremophor RH40 and Macrogol 200 (PEG 200) were chosen as the emulsifier and co-emulsifier, respectively. This prescription was further optimized by using central composite design of response surface methodology. The optimized condition was CEP:IPP:Cremophor RH40:PEG 200=3.6:30.0:55.3:11.1 in mass ratio with maximum drug loading (36.21 mg/mL) and the minimum particle size (36.70 nm). The constructed CEP-SEDDS was characterized by dynamic light scattering, transmission electron microscopy, in vitro release and stability studies. The dissolution level of CEP-SEDDS was nearly 100% after 30 min in phosphate-buffered saline (PBS, pH 6.8) which was higher than that of the pure CEP (approximately 20%). In addition, in vivo pharmacokinetic study in rats showed that CEP-SEDDS dramatically improved bioavailability compared with active pharmaceutical ingredient (API) (the relative bioavailability was 203.46%). In this study, CEP-SEDDS was successfully prepared to enhance the oral bioavailability which might facilitate to increase its better clinical application.
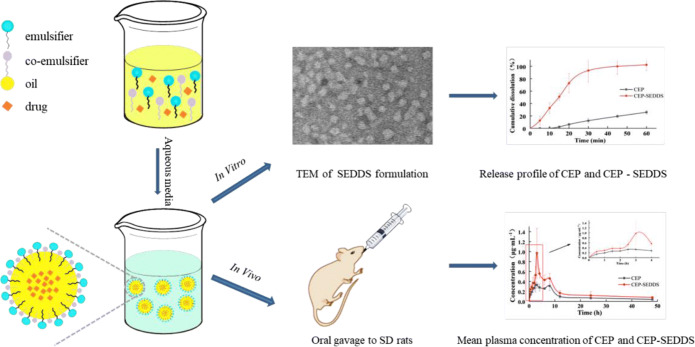
Graphical abstract
KEY WORDS: cepharanthine, self-emulsifying drug delivery system, central composite design, pseudo-ternary phase diagram, oral bioavailability
INTRODUCTION
Oral administration represents an attractive choice for systemic treatment which has advantages of less cost, convenience, and greater acceptability (1). With the gradual maturity and wide applications of computer-aided drug design, combinatorial chemistry, and high-throughput screening, the number of potential drug candidates with very low water solubility keeps increasing, as is known to all that dissolution is frequently the rate-limiting step in the gastrointestinal (GI) absorption, for the reason that the drug can only be absorbed from the GI tract if it is dissolved in the hydrous intestinal contents (2). Nevertheless, for many drugs that are insoluble in water, most of the dose is excreted after oral administration, resulting in low oral bioavailability.
Of the various physical and chemical factors that limit drug formation, low water solubility remains one of the most pervasive problems. For the sake of improving the solubility and oral bioavailability of insoluble drugs, many strategies have been adopted, such as solid dispersion (3), cyclodextrin complexation (4), lipid delivery (2), and micronization (5). Cyclosporin A (Sandimmune® and Nerol®), ritonavir (Kaletra®), sanquinavir (Fortovase®), and tipranavir (Aptivus®) have been marketed as lipid systems for oral pharmaceutical (6–8). In consequence, the study on lipid formulation has become a potential interest item for oral administration, especially for self-emulsifying drug delivery systems (SEDDS) (9–12). In SEDDS, drug molecules are thoroughly dissolved in the pre-concentrate consisting of the oil phase, emulsifier, and co-emulsifier. Once dispersed in the GI fluids, the O/W emulsion with a clear particle size of 10–500-nm emulsion is formed (13). In the fasting and feeding states, SEDDS tends to produce a reproducible drug concentration-time curve (AUC) after oral administration, and also plays a certain role in improving oral bioavailability (2,14). Relevant literature indicates that SEDDS is an effective method to improve the oral absorption, and bioavailability of insoluble drugs by improving their solubility and dissolution rate (15–17). In addition to drug solubility, gastrointestinal mucus barrier also plays a crucial role in oral absorption of drugs (18). Accordingly, there is an urgent need for innovative drug delivery systems to overcome that mucus barrier. SEDDS has attracted increasing attention because of its ability to conquer the mucous layer due to its small droplet size, charge, droplet surface, and shape deformation (19). Some studies have indicated that SEDDS can effectively overcome the mucus barrier and improve the oral bioavailability of the drug (20–23). By reason of the foregoing, SEDDS is effectively in improving oral bioavailability of insoluble drugs. Furthermore, SEDDS can be prepared in a simpler and more cost-efficient manner which is significant advantageous compared with other nanocarriers such as liposomes and nanoparticles (19).
Cepharanthine (CEP) is a bis-benzylisoquinoline alkaloid isolated from plants of Stephania genus in 1934 (24). In 1937, the application of CEP enormously reduced the average mortality rate among patients with severe pulmonary tuberculosis from 41 to 22% at the Yokohama Sanatorium in Japan (25). But it has since been superseded by more effective drugs (26). Nonetheless, the initial successful clinical application of CEP in the treatment of tuberculosis has encouraged its utilization in other pathological indications, such as anti-inflammation, analgesia, anti-virus, and anti-tumor activity (27–30). In the last few years, CEP has attracted increasing attention in research due to its distinct 1-benzylisoquinoline moiety similarities with natural polypeptides, physiological properties, and long-established remarkable safety profile (31). In December 2019, the emergence of the 2019 novel coronavirus disease (labeled COVID-19), caused by the severe acute respiratory syndrome coronavirus type 2 (SARS-CoV-2), has posed an unprecedented challenge to global public health. In a large drug screen of 2406 clinically approved drugs, CEP was recently identified as the most effective drug against SARS-CoV-2-related pangolin coronavirus. CEP has become a drug of interest for treating COVID-19 (31–33). It is suggested that CEP is not a “one pill fits all” medication but certainly an under-explored drug which should be reconsidered (34). Increasing studies have indicated that CEP has a variety of pharmacological activities, implying that will play a crucial role in clinical trials. Nevertheless, CEP has the defect of low water solubility and low direct oral bioavailability which limit its pharmacological validity (35). The absolute bioavailability of CEP by oral route was only 5.65 ± 0.35% in rats (36). Therefore, it is urgent to explore effective means to boost oral bioavailability to meet the clinical needs of CEP.
In this work, we examined whether these shortcomings could be overcome by enacting CEP in SEDDS. The oil phase, emulsifier, and co-emulsifier were studied by single factor experiment, pseudo-ternary phase diagram, and central composite design, screening out the best prescription. CEP was dissolved in SEDDS pre-concentrate consisting of oil, emulsifier, and co-emulsifier. Upon dispersion of the pre-concentrate in aqueous media, the O/W emulsion was formed. The properties of CEP-SEDDS were characterized by particle size and size distribution, particle morphology, drug release, and stability experiments in vitro. This dosage form was applied to a pharmacokinetic study in rats to further elucidate the superiorities.
MATERIALS AND METHODS
Materials
CEP was provided by Hubei Xingyinhe Chemical Co., Ltd. (Hubei, China). Transcutol P, Labrasol, and Labrafac Lipohile WL 1349 were obtained from Gattefossé Co. (Lyon, France). Cremophor EL, Primary Alcobol Ethoxylate (AEO-9), Kolliphor ELP, and Cremophor RH40 were kindly donated by BASF (Ludwigshafen, Germany). Castor oil and Capryliccapric triglyceride (GTCC) were purchased from Beijing FengliJingqiu Trading Co., Ltd. (Beijing, China). Macrogol 400 (PEG 400), Macrogol 200 (PEG 200), Polysorbate-80 (Tween-80), Isopropyl palmitate (IPP), and Isopropyl myristate (IPM) were purchased from Tianjin Komiou Chemical Reagent Co., Ltd. (Tianjin, China). Heparin sodium (>150 IU/mg) and isoflurane were received from the Dalian Meilun Biological Technology Co., Ltd. (Liaoning, China). Propranolol hydrochloride was obtained from Changzhou Yabang Pharmaceutical Co., Ltd. (Jiangsu, China). All other chemicals used in the experiments were analytical reagent grade and were obtained from local sources.
Preparation and Optimization of CEP-SEDDS
Solubility Determination of CEP
Solubility of CEP can be assayed by adding excessive amounts of CEP to the 10 mL of different test medium. At 37±0.5 °C, the samples were stirred at 100 rpm for 72 h. After centrifugation for 10 min at 10000 rpm, the concentration of CEP in the medium was assayed by using a Shimadzu series HPLC (Model LC-20A, Shimadzu, Japan) after appropriate dilution with methanol. The analytical column was Diamonsil C18 column (200 mm×4.60 mm, 5 μm). The flow rate was maintained at 1 mL/min and the column temperature was set to 35°C. The mobile phase was consisted of (A) water containing 0.08% trimethylamine and (B) methanol in a ratio of 81/19 (v/v). The sample (20 μl) was analyzed by the HPLC system equipped with an UV detector set at 282 nm. A linear calibration curve of CEP was plotted in the concentration range of 10~60 μg/mL with correlation coefficients of over 0.999 (a typical calibration curve: Area=12112C-11596). The relative standard deviation for both intra-day and inter-day precision were below 2%.
Pseudo-Ternary Phase Diagram
The mixed emulsifier was obtained by mixing emulsifier and co-emulsifier according to a certain mass ratio (Km=3:1, 2:1, 1:1, 1:2, 1:3). The oil phase and the mixed emulsifier were mixed in ratios (w/w) of 6:4, 5:5, 4:6, 3:7, 2:8, and 1:9. Then the mixture (1 mL) was dripped into the 100 mL water uniformly and slowly at a magnetic stirring speed of 10 rpm in water bath at 37 °C to observe whether a clear and transparent emulsion was formed. The pseudo-ternary phase diagrams of CEP-SEDDS were drawn by Origin Pro 8.0 software. The three sides of equilateral triangle represented emulsifier, co-emulsifier, and oil phase. The area of emulsion was taken as the index to determine the suitable phases and the proportion of each component.
Optimization of the SEDDS Prescription
The optimization of the prescription is a complex process which requires extensive experiments. However, this can be done by using central composite design–response surface methodology (CCD-RSM), because it can offer a simple possibility to research a high variety of variables at different levels with just a small amount variety of experiments (37). Therefore, CCD-RSM with two-factor, five-level face-centered was adopted as a tool to optimize the prescription of CEP-SEDDS in this study. The independent variables, including the ratio of emulsifier to co-emulsifier (Km) (X1) and percentage of oil (X2, %), were determined as critical factors responsible for drug loading (Y1, mg/mL) and particle size (Y2, nm) by the results of preliminary single-factor tests. The independent factors and their design levels are shown in Table I. The CCD-RSM was determined with a randomized order and designed by Design-Expert software (MN, USA) (38). 3D response surfaces verbalized the fitted polynomial equations. The drug loading and particle size of CEP-SEDDS were determined as follows.
Table I.
Levels of independent variable in the central composite design
| Factor | Level | ||||
|---|---|---|---|---|---|
| −α | −1 | 0 | +1 | +α | |
| X1 | 1.38 | 2 | 3.5 | 5 | 5.62 |
| X2 | 25.86 | 30 | 40 | 50 | 54.14 |
X1 (the ratio of emulsifier to co-emulsifier) and X2 (percentage of oil, %); Y1 (drug loading, mg/mL) and Y2 (particle size, nm)
According to the proportion shown by Table II, 2 g of the total mass of oil phase (O) and mixed emulsifier (S) was weighted. Then the excess CEP powder was added, mixed by vortex, ultrasonic for 20 min, shaken at 37 °C for 24 h, centrifuged for 10 min under the condition of 10000 rpm. The 1-mL as-obtained supernatant was diluted to 10 mL with methanol. The solution was filtered through a 0.22-μm microporous membrane and then was assayed by using a Shimadzu series HPLC to record the peak area of CEP and calculate the drug loading. The HPLC column and the applied chromatographic conditions are described in “Solubility Determination of CEP.”
Table II.
The central composite design and resulting values
| Experiments | Variables | Responses | ||
|---|---|---|---|---|
| X1 | X2 | Y1 | Y2 | |
| 1 | 1.38 | 40.00 | 31.86 ± 0.76 | 60.40 ± 0.06 |
| 2 | 2.00 | 30.00 | 31.19 ± 1.20 | 39.70 ± 0.05 |
| 3 | 5.00 | 50.00 | 17.57 ± 1.51 | 71.49 ± 0.04 |
| 4 | 5.62 | 40.00 | 23.27 ± 0.58 | 49.98 ± 0.05 |
| 5 | 5.00 | 30.00 | 35.95 ± 2.48 | 38.21 ± 0.05 |
| 6 | 3.50 | 40.00 | 26.40 ± 0.30 | 49.07 ± 0.04 |
| 7 | 3.50 | 25.86 | 41.69 ± 1.41 | 34.36 ± 0.04 |
| 8 | 3.50 | 40.00 | 21.83 ± 1.37 | 44.72 ± 0.03 |
| 9 | 3.50 | 40.00 | 24.55 ± 0.28 | 51.82 ± 0.03 |
| 10 | 3.50 | 54.14 | 21.56 ± 0.21 | 84.25 ± 0.01 |
| 11 | 3.50 | 40.00 | 17.72 ± 0.46 | 50.59 ± 0.05 |
| 12 | 3.50 | 40.00 | 20.91 ± 0.47 | 49.56 ± 0.06 |
| 13 | 2.00 | 50.00 | 23.89 ± 1.16 | 79.96 ± 0.04 |
X1 (the ratio of emulsifier to co-emulsifier) and X2 (percentage of oil, %); Y1 (drug loading, mg/mL) and Y2 (particle size, nm)
With agitation speed of 10 rpm, CEP-SEDDS was obtained by adding 1 mL of supernatant to 100 mL of water at 37°C. After filtration through a 0.45-μm microporous membrane, the particle size of CEP-SEDDS was detected by Zeta sizer (Nano-ZS, Malvern instruments, UK) at 25°C.
Preparation of CEP-SEDDS Pre-concentrate
The blank SEDDS pre-concentrate prescription was prepared by dissolving the preferred excipients with optimal proportion which based on previous experiments. The prescription quantity of CEP was precisely weighed and added to the blank SEDDS pre-concentrate. The system was evenly dispersed by vortex-mixing. CEP was completely dissolved by ultrasonic 30 min and a clear and transparent CEP-SEDDS pre-concentrate was obtained.
Characterization of CEP-SEDDS
Transmission Electron Microscopy
Transmission electron microscope (TEM) was applied to observe the morphology of CEP-SEDDS. CEP-SEDDS was mixed with 2% phosphotungstic acid solution of the equal volume. The resulting solution was then dripped onto a copper grid to form a coating. Filter paper was used to remove the excess liquid. After air-dry naturally, the surface morphology and the structure of blank-SEDDS as well as the CEP-SEDDS were observed under transmission electron microscope and photos were acquired by a transmission electron microscope (Hitachi TU770, 120 KV).
Particle Size and Zeta Potential (ζ)
The particle size is a sign to measure the formation of SEDDS. Meanwhile, the physical stability of SEDDS can be judged according to the Zeta potential (ζ). The particle size and zeta potential (ζ) of CEP-SEDDS were identified by using a Zeta sizer (Nano-ZS, Malvern instruments, UK) at 25°C. The measurement for each sample was repeated in triplicate.
Stability Experiment
Long-Term Stability
CEP-SEDDS pre-concentrate was reserved at room temperature for 6 months to observe the appearance of the system. At the same time, the self-emulsifying efficiency of the system in distilled water at 37 °C and the particle size after emulsification were determined.
Physical Stability After Dilution
CEP-SEDDS was diluted 50, 100, and 200 times with distilled water. The above preparations were deposited at room temperature and 4 °C for 48h, respectively. The changes of particle size and PDI were evaluated.
Physical Stability with Different Dispersion Media
CEP-SEDDS was diluted separately with distilled water, hydrochloric acid solution (HCl, pH = 1.2), and phosphate buffer solution (PBS, pH = 6.8). The above preparations were deposited at room temperature and 4 °C for 48h, respectively. The changes of particle size and PDI were evaluated.
Statistical Analysis
The form of mean±SD was applied to express the results. Statistical significance of data from different prescriptions was compared by one-way ANOVA.
In Vitro Release Experiment
The homemade CEP-SEDDS was put into no. 0 hard capsule to make CEP-SEDDS (an amount equal to 20 mg CEP) release capsule, and the same dose of CEP raw material was used as control. The dissolution and release of CEP in HCl solution (pH=1.2) and PBS solution (pH=6.8) were determined by the method of dissolution and release (Chinese Pharmacopeia 2015, paddle method). When the temperature was kept at 37±0.5 °C, CEP and CEP-SEDDS capsules were put into the medium of 900 mL and the rotational speed was maintained for 50 rpm. Samples were sampled at 5, 10, 15, 20, 30, 45, and 60 min at predetermined time points, and 5-mL samples were taken at each time point (supplemented with 5 mL blank medium). After filtration, HPLC was used to determine concentrations of CEP.
Similarity factor (f2) was employed to investigate the similarity of different dissolution curves, and f2 was calculated according to Eq. (1):
| 1 |
In Vivo Pharmacokinetic Study
Animal Experiments
Sprague Dawley rats (weight 200±20 g, in good health) of male (n=12) were randomly assigned into two groups (provided by Animal Center of Shenyang Pharmaceutical University). The animals were fasted for 12 h before the administration scheme and blood sample collection experiment. The homemade CEP-SEDDS and the pure CEP suspended in 0.5% sodium carboxymethylcellulose (CMC-Na) solution were given in oral gavage administration according to 40 mg/kg, and free drinking water was given 4 h after administration. Five hundred microliters of blood from orbital venous plexus was collected at 0.5, 1, 1.5, 2, 2.5, 3, 4, 6, 8, 12, 24, 36, and 48 h after administration, respectively. The rotational speed of the centrifuge was set to 5000 rpm with 4 °C. The plasma was separated with a pipetting gun and frozen in the refrigerator at −20 °C.
Analysis of CEP in Plasma
Ten microliters of propranolol hydrochloride (5 μg/mL) was added as internal standard solution. Twenty microliters of sodium hydroxide solution (0.5 mol/l) and 300 μl ethyl acetate were placed to a 100-μl plasma sample. After vortex mixing for 2 min and centrifugation at 10000 rpm for 10 min, the organic phase was carefully collected. Then the organic phase was evaporated to dry at 40 °C under a gentle nitrogen flow. The residue after drying was re-dissolved in 50 μl of mobile phase, vortexed 3 min, centrifuged at 10000 rpm for 10 min, and absorbed supernatant. A 20-μl sample was injected into the HPLC system equipped with an UV detector set at 235 nm. The analytical column was Diamonsil C18 column (5 μm, 4.6×150 mm). The flow rate was maintained at 1 mL/min and the column temperature was set to 35 °C. The mobile phase was consisted of (A) water containing 0.08% trimethylamine and (B) methanol in a ratio of 77/23 (v/v) (36,39). The linear range of this method was 0.05~1.6 μg/mL with an R2 (correlation coefficient) equal to 0.9985. Precision and accuracy results of three different concentrations within calibration range demonstrated good precision and accuracy (RSD < 15%). The recoveries were in the range of 85~115% for three different control samples and coefficient of variation was found to be less than 15%.
Pharmacokinetic Analysis
The form of mean±SD was applied to express the results. Statistical significance of data from different prescriptions was compared by Student t test (unpaired t test).
Ethical Approval
In this study, all animal research work was carried out with approval from the Life Science Research Center and Ethical Committee. Before the start of the animal experiments, all animal study protocols (license no. SYPU-IACUC-C-2018-59-008) was agreed and signed by the Institutional Animal Care and Use Committee (IACUC) at Shenyang Pharmaceutical University. All efforts guaranteed the animals’ welfare and minimized animal suffering. The animals were euthanized at the end of the experiment.
RESULTS AND DISCUSSION
Preparation and Optimization of CEP-SEDDS
Solubility Determination of CEP
Table III presents the saturated solubility data of CEP in various test media. IPP, GTCC, and IPM were selected as oil phase as it exhibited a highest solubility of CEP. Kolliphor ELP, Cremophor RH40, and AEO-9 were used as emulsifier on account of the reason that they also revealed a sufficient solubility of CEP. Isopropanol, Transcutol P, and PEG 200 were chosen as co-emulsifier as they also had displayed a fine solubility of CEP as well. The better excipients can be preliminarily selected through the saturation solubility experiment. The further investigation of the optimal excipients by pseudo-ternary phase diagram was carried out.
Table III.
Saturated solubility of cepharanthine in lipid phase
| Lipid phase | Name | Solubility (mg/mL) |
| Oil | Labrafac Lipophile WL 1349 | 2.47 |
| GTCC | 3.04 | |
| IPM | 2.74 | |
| IPP | 13.60 | |
| Castor oil | 1.85 | |
| Emulsifier | Cremophor RH 40 | 6.71 |
| Cremophor EL | 0.45 | |
| Kolliphor ELP | 9.07 | |
| Labrasol | 0.57 | |
| Tween-80 | 1.68 | |
| AEO-9 | 5.16 | |
| Co-emulsifier | Isopropanol | 18.52 |
| Transcutol P | 44.34 | |
| PEG-200 | 20.74 | |
| PEG-400 | 2.20 |
Pseudo-Ternary Phase Diagram
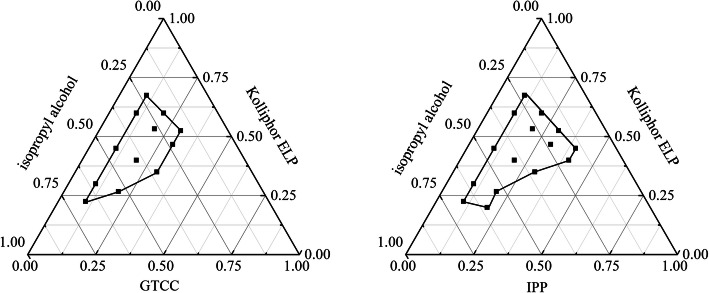
The emulsion regions can be identified by plotting pseudo-ternary phase diagrams. The area was where oil, emulsifier, and co-emulsifier are mixed in a certain ratio to form a uniform and transparent emulsion (40). In this study, the fixed emulsifier and co-emulsifier were kolliphor ELP and isopropanol when the oil phase was examined by pseudo-ternary phase diagram. The results showed that the SEDDS with IPM as the oil phase was unstable within 24 h; thus, the pseudo-ternary phase diagram of IPM-Killophor ELP-isopropanol was not pictured. As can be seen from Figure 1, the region where the line was closed was the effective region for the emulsion. The emulsion region formed by IPP was larger than that formed by GTCC. Additionally, the saturated solubility of IPP to CEP was much larger than that of GTCC (Table III); as a result, the oil phase chosen as IPP.
Fig. 1.
Effects of different oils on the phase diagrams (emulsifier: Kolliphor ELP; co-emulsifier: isopropyl alcohol)
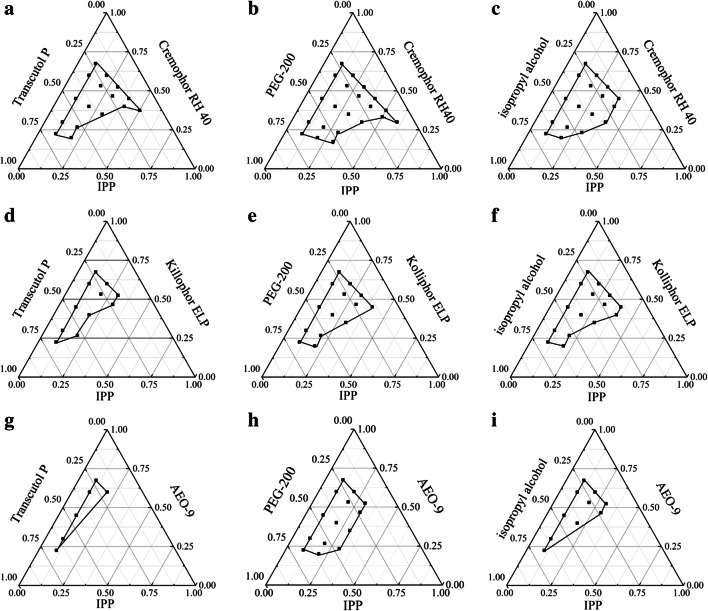
The pseudo-ternary phase diagrams were further drawn with the form of pairwise cross-match of emulsifiers and co-emulsifiers with fixed oil phase as IPP to filtrate the emulsifiers and co-emulsifiers. The results can be seen in the Figure 2. It is manifest from the figures that the emulsion region formed by IPP-Cremophor RH40-PEG200 was the largest and there was no oil-water stratification and precipitation within a week, indicating that the emulsion structure was steady. Consequently, IPP was selected as the oil phase, Cremoophor RH40 as the emulsifier, and PEG 200 as the co-emulsifier to construct the final prescription
Fig. 2.
Effects of different emulsifier and co-emulsifier on the phase diagrams. Emulsifier and co-emulsifier were Cremophor RH40 and Transcutol P, PEG 200, isopropyl alcohol (a–c); Kolliphor ELP and Transcutol P, PEG 200, isopropyl alcohol (d–f); AEO-9 and Transcutol P, PEG 200, isopropyl alcohol (g–i). The oil phase was fixed as IPP
Optimization of the SEDDS Prescription
In line with the rudimentary experiment results, the ratio of emulsifier to co-emulsifier (X1) and the percentage of oil (X2) had considerable effects on the drug loading (Y1) and particle size (Y2); as such, they were taken as the main factors for investigation. Table II showed the independent variables of the experiment and their responses. The response analysis of Design-Expert demonstrated that the quadratic model was the best regression model for each response Y1 and Y2. The mathematical models were described as follows:
Y1=103.52−0.07 X1−3.28 X2−0.18 X1X2+0.90 X12+0.04 X22 (R2=0.8021, *p<0.05)
Y2=66.18−6.87 X1−1.87 X2−0.12 X1X2+1.35 X12+0.05 X22 (R2=0.9808, *p<0.05)
The ANOVA for drug loading (Y1) and particle size (Y2) is depicted in Table IV. From the table, it can be seen that the both second-order models were extremely significant (*P<0.001), the lack-of-fit term were not, anyway. The coefficient of determination (R2) of the model Y1 was 0.9329 and 0.9888 of the model Y2. The R2adj was 0.8992 of the model Y1 and 0.9808 of the model Y2. The above results demonstrated that the experimental data had minor errors. The determined values were consistent with the predicted values and the model adequately reflected the relationship among the parameters (41).
Table IV.
Analysis of variance (ANOVA) of the model parameters
| Source | Sum of Squares | df | F value | P value | Significance | |
|---|---|---|---|---|---|---|
|
Drug loading (Y1) |
Model | 551.3 | 5 | 10.73 | 0.0035 | ** |
| A-A | 23.49 | 1 | 2.29 | 0.1743 | ||
| B-B | 366.5 | 1 | 35.66 | 0.0006 | ** | |
| AB | 30.69 | 1 | 2.99 | 0.1276 | ||
| A2 | 28.67 | 1 | 2.79 | 0.1388 | ||
| B2 | 114.68 | 1 | 11.16 | 0.0124 | * | |
| Residual | 71.94 | 7 | ||||
| Lack of Fit | 26.94 | 3 | 0.8 | 0.5558 | ||
| Pure Error | 45 | 4 | ||||
| Cor Total | 623.24 | 12 | ||||
| Particle size (Y2) | Model | 2904.74 | 5 | 123.29 | < 0.0001 | ** |
| A-A | 76.24 | 1 | 16.18 | 0.005 | ** | |
| B-B | 2595.43 | 1 | 550.81 | < 0.0001 | ** | |
| AB | 12.18 | 1 | 2.58 | 0.1519 | ||
| A2 | 64.38 | 1 | 13.66 | 0.0077 | ** | |
| B2 | 180.91 | 1 | 38.39 | 0.0004 | ** | |
| Residual | 32.98 | 7 | ||||
| Lack of Fit | 3.98 | 3 | 0.18 | 0.9027 | ||
| Pure Error | 29 | 4 | ||||
| Cor Total | 2937.72 | 12 |
**Extremely significantly (P<0.01); *significant (P<0.05)
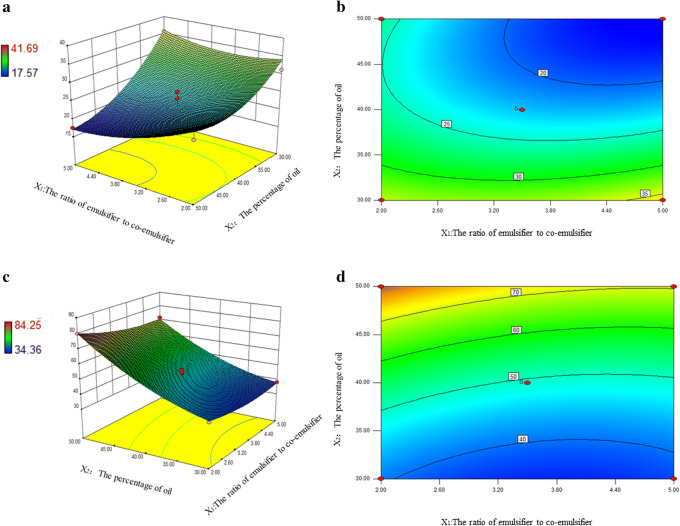
The three-dimensional (3D) response surfaces and contour plots for drug loading (Y1) and particle size (Y2) are described in Figure 3. From Figure 3 a and b, it can be found that X1, X2 and their interaction had valid influence on Y1. With the enhancement of percentage of oil, the reduction of dosage of emulsifier, there was a slight tendency to decrease the drug loading. The response surface plot and contour in Fig. 3 c and d described that X1, X2, and their interaction also had a significant impact on Y2. With the increase of oil content and the decrease of the ratio of emulsifier and co-emulsifier, the particle size gradually increased with different degrees. There were basically two theories on emulsion formation: mixed interfacial film had low-interfacial tension represented by Sculman and solubilized by swollen micelle represented by Shinoda (42,43). Based on the above theories, the drug was solubilized by the interfacial film formed by the emulsifier and co-emulsifier. With the growth of emulsifier content and the fall of oil, the solubility of drug increased; with the increase of oil, the particle size of O/W emulsion tended to become bigger due to the solubilization of the oil phase in the emulsion core, which was similar to the structure of swollen micelle; with the increase of emulsifier, the emulsifying ability of emulsion was boosted, so that the emulsion with smaller particle size and higher stability can be prepared (44).
Fig. 3.
Response surface plot and the corresponding contour plot showing the influence of the percentage of oil and the ratio of emulsifier to co-emulsifier on drug loading (a, b) and particle size (c, d) of CEP-SEDDS
The fitting results revealed that the optimized CEP-SEDDS with high drug loading (36.19 mg/mL) and minimal particle size (37.94 nm) were acquired with the oil concentration of 30% and the ratio of emulsifier to co-emulsifier as 5, respectively. In order to verify the accuracy of the model, three parallel experiments conducted on the grounds of the predicted optimal prescription. The drug loading of CEP-SEDDS was (36.21±1.12) mg/mL and the particle size was (36.70±0.74) nm. The experimental values of both response values determined within the optimum range resembled the anticipated values, which indicated that the optimized prescription was trustworthy as well as credible.
Characterization of CEP-SEDDS
Transmission Electron Microscopy
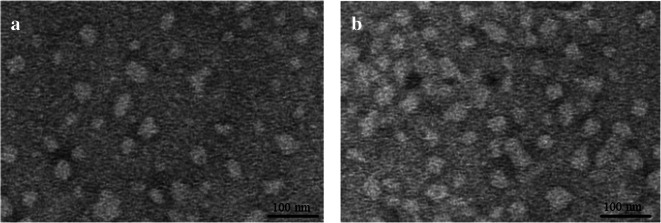
Figure 4 displayed the TEM micrograph of blank-SEDDS (a) and CEP-SEDDS (b). It can be obtained from the picture that emulsion particles were morphologically nearly spherical. In addition, the differences between the two images were relatively small. There was no particle aggregation because the nearly spherical particles separate from each other well.
Fig. 4.
TEM images showing morphology and particle size of the final optimized formulation. a Blank-SEDDS, b CEP-SEDDS
Particle Size and Zeta Potential (ζ)
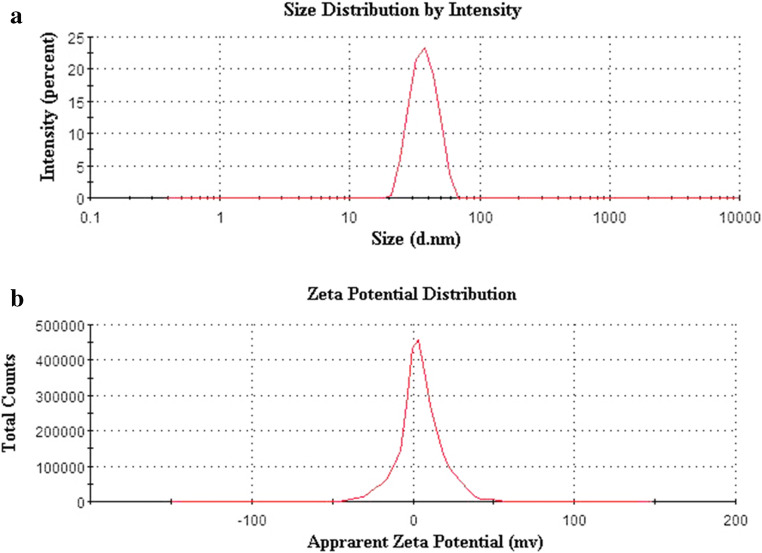
The particle size of CEP-SEDDS after emulsification was 36.70±0.74 nm and PDI was 0.040±0.015 (Figure 5a) which manifested that SEDDS had small particle size and uniform distribution. The zeta potential value of SEDDS after emulsification was 4.46±0.79 mV (Figure 5b), which may be due to the fact that the emulsifier (Cremophor RH40) and co-emulsifier (PEG 200) were non-ionic emulsifiers and did not cause the emulsion surface charged.
Fig. 5.
Particle size distribution (a) and zeta potential (b) of the final optimized formulation
Stability Experiment
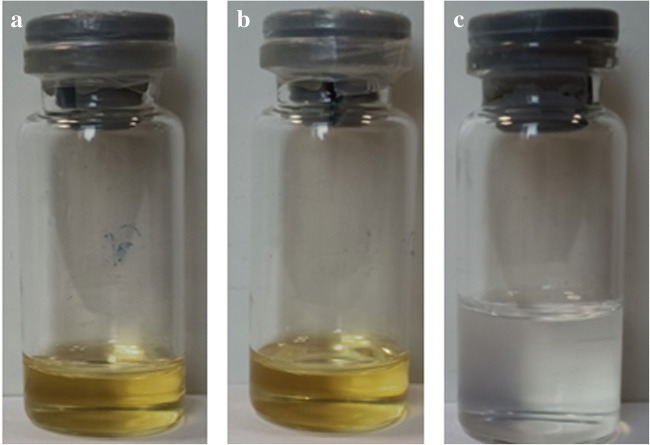
The appearance, particle size, and self-emulsifying efficiency of CEP-SEDDS pre-concentrate were observed after stored at room temperature for 6 months. As can be seen from Figure 6 a and b, the appearance of CEP-SEDDS pre-concentrate appeared to be the transparent and uniform oily liquid, without stratification and drug precipitation after 6 months of storage. As shown in Figure 6 c, the pre-concentrate stored was readily dispersed in water to obtain SEDDS. Meanwhile, the self-emulsifying efficiency (namely emulsification time) and the particle size after emulsification were scaled (Table V). The results proved that the self-emulsifying efficiency of CEP-SEDDS pre-concentrate and the particle size after emulsification did not change significantly (P>0.05) after storage for 6 months, indicating that the prescription was firm within 6 months.
Fig. 6.
The appearance of CEP-SEDDS pre-concentrate and CEP-SEDDS emulsion. a Fresh preparation of CEP-SEDDS pre-concentrate; b CEP-SEDDS pre-concentrate stored at room temperature for six months; c emulsion obtained for dispersions of CEP-SEDDS in water
Table V.
Self-emulsifying efficiency and particle size of CEP-SEDDS after 3 and 6 months of storage (n=3)
| Months | Self-emulsifying efficiency (s) | Particle size (nm) | PDI |
|---|---|---|---|
| 0 | 93.40±11.99 | 37.46±1.20 | 0.04±0.015 |
| 3 | 100.42±7.82 | 37.86±1.22 | 0.03±0.017 |
| 6 | 100.18±10.62 | 37.70±1.74 | 0.03±0.019 |
The influence of dilution on the stability of emulsified particles is displayed in Table VI and the impact of dispersion medium on the stability of emulsified particles is shown in Table VII. According to the results, the particle size of emulsion had no significant (P>0.05) change in 48 h under varying dilution times and dispersion medium. Accordingly, the conclusion that CEP-SEDDS pre-concentrate can be rapidly emulsified into uniformly dispersed droplets in a short time and the stability of the prescription which was fine could be drawn.
Table VI.
Effect of dilution on the particle size of CEP-SEDDS (n=3)
| Time (h) | 4°C | Room temperature | ||||
|---|---|---|---|---|---|---|
| 50 | 100 | 200 | 50 | 100 | 200 | |
| 0 | 37.30±0.89 | 36.70±0.74 | 37.79±0.45 | 37.30±0.89 | 36.70±0.74 | 37.79±0.45 |
| 24 | 38.39±0.25 | 37.42±0.42 | 38.42±0.17 | 39.58±0.57 | 38.42±0.40 | 40.59±0.23 |
| 48 | 39.61±0.97 | 39.22±0.84 | 40.94±0.46 | 40.67±1.98 | 40.31±0.31 | 42.91±0.50 |
Table VII.
Effect of different dispersion medium on the particle size of CEP-SEDDS (n=3)
| Time (h) | 4°C | Room temperature | ||||
|---|---|---|---|---|---|---|
| Water | pH 6.8 | pH 1.2 | Water | pH 6.8 | pH 1.2 | |
| 0 | 36.70±0.74 | 37.02±1.03 | 37.81±1.00 | 36.70±0.74 | 37.02±1.03 | 37.81±1.00 |
| 24 | 39.42±0.42 | 39.00±0.41 | 39.36±0.26 | 37.42±0.40 | 38.35±1.69 | 38.45±1.04 |
| 48 | 40.22±0.84 | 40.48±0.55 | 40.30±0.25 | 39.31±0.31 | 40.73±1.14 | 40.70±0.56 |
In vitro Release Experiment
As shown in Figure 7, the cumulative dissolution of CEP-SEDDS pre-concentrate in 30 min could reach approximately 100% in each release medium, while the cumulative dissolution of API in PBS solution (pH=6.8) (Figure 7a) was less than 20%, denoting that CEP-SEDDS prescription extremely improved the dissolution rate of CEP (f2=10.02<50). As it can be observed in Figure 7 b, the drug release profile of API was similar to CEP-SEDDS in HCl solution (pH=1.2) (f2=61.23>50). It can be seen that CEP was a bisbenzylisoquinoline alkaloid with weak base, so that it had high solubility under acidic condition (45). Additionally, several studies have shown that the absorption of weak base in the gastrointestinal tract occurs predominantly in the intestine (pH=5~7) (46,47). Whence, it is necessary to enhance the poor dissolution of CEP in the weak base medium to improve oral bioavailability. In the current study, CEP-SEDDS significantly increased the solubility of CEP in PBS solution (pH=6.8).
Fig. 7.
Plot showing mean percent release of pure drug (CEP) and optimized formulation (CEP-SEDDS) in different dissolution media. a pH 6.8 PBS, b pH 1.2 HCl
In Vivo Pharmacokinetic Study
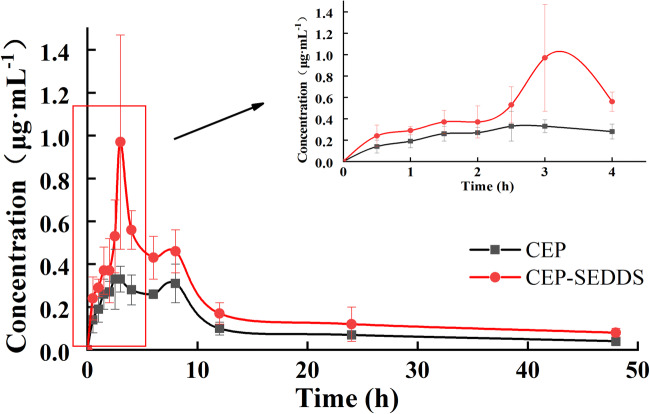
Figure 8 represented the acquired plasma concentration vs. time profiles after the oral administration of a single dose of CEP-SEDDS and CEP to male rats, while Table VIII showed the pharmacokinetic parameters. It can be seen from the pharmacokinetic parameters that the Cmax values of CEP-SEDDS and CEP were 1.00 and 0.43 μg/mL, separately, whereas the time to reach maximum drug concentration in plasma (Tmax) were 2.92 and 4.25 h and T half-life (T1/2) were 8.65 and 4.86 h, respectively. The AUC0-t of CEP-SEDDS and CEP were equal to be 9.49 and 4.66 μg/(mL·h), respectively. Compared with the CEP, 2-fold increase in AUC0-t of CEP-SEDDS was observed. The relative bioavailability of CEP-SEDDS in comparison with oral CEP was 203.64%. By the obtained results, the oral bioavailability of CEP was improved after it was made into SEDDS.
Fig. 8.
The plasma concentration–time profiles in rats after oral administration of CEP and CEP-SEDDS, respectively. Data are presented as the mean ± SD (n=6)
Table VIII.
Pharmacokinetic parameter of CEP-SEDDS and CEP (n=6)
| Parameter | CEP-SEDDS | CEP | Significance |
|---|---|---|---|
| Tmax (h) | 2.92±0.20 | 4.25±2.95 | |
| Cmax (μg/mL) | 1.00±0.48 | 0.43±0.06 | * |
| T1/2 (h) | 8.65±4.97 | 4.86±3.08 | |
| AUC0→t (μg/(mL·h)) | 9.49±1.68 | 4.66±1.49 | ** |
| RBA (%) | 203.64 | — |
**Extremely significantly (P<0.01); *significant (P<0.05)
CONCLUSION
In the present work, CEP-SEDDS was successfully prepared and optimized. Optimization of SEDDS prescription was an intricate, multistep process, which required considering a large number of variables and their interactions with each other. In the recent study, the optimal conditions for the CEP-SEDDS were determined by applying composite central design methodology to overcome the complex process. The maximum drug loading (36.21 mg/mL) and the minimum particle size (36.70 nm) were found under the following optimized conditions: CEP:IPP:Cremophor RH40:PEG 200=3.6:30:55.3:11.1 in mass ratio. CEP-SEDDS appeared nearly spherical shape with homogeneous size distribution, as confirmed by TEM analysis which prepared according to the above prescription. The CEP-SEDDS pre-concentrate was a light yellow transparent oily liquid, which was diluted with aqueous media to form a clear, light blue emulsion solution readily with good stability. The in vitro experiments proved that CEP-SEDDS significantly increased solubility of CEP in PBS solution (pH=6.8). In pharmacokinetic studies in rats, the relative bioavailability of CEP-SEDDS using CEP as reference agent reached 203.46%. In conclusion, CEP-SEDDS had the characteristics of simple process, good stability, accurate dosage, and higher oral bioavailability prepared in the current study.
Acknowledgements
We are grateful that this work was supported by grants from 2020 Liaoning Provincial Department of Education Scientific Research Funding Project—Key Research Project (NO. 2020LZD02) and Open Fund of the State Key Laboratory of New Technology of Chinese Medicine Pharmaceutical Process (no. SKL2020Z0206)
Declarations
Competing interests
The authors declare no competing interests.
Disclaimer
The authors are solely responsible for the content and writing of this article.
Footnotes
Publisher’s Note
Springer Nature remains neutral with regard to jurisdictional claims in published maps and institutional affiliations.
References
- 1.Lee BH, Choi SH, Kim HJ, Park SD, Rhim H, Kim HC, Hwang SH, Nah SY. Gintonin absorption in intestinal model systems. Journal of Ginseng Research. 2018;42(1):35–41. doi: 10.1016/j.jgr.2016.12.007. [DOI] [PMC free article] [PubMed] [Google Scholar]
- 2.Mu H, Holm R, Mullertz A. Lipid-based formulations for oral administration of poorly water-soluble drugs. Int J Pharm. 2013;453(1):215–224. doi: 10.1016/j.ijpharm.2013.03.054. [DOI] [PubMed] [Google Scholar]
- 3.Nanaki, Eleftheriou, Barmpalexis, Kostoglou, Bikiaris. Aprepitant drug in ternary pharmaceutical solid dispersions with soluplus and poloxamer 188 prepared by melt mixing. 2019.
- 4.Rawat S, Jain SK. Solubility enhancement of celecoxib using Î2-cyclodextrin inclusion complexes. Eur J Pharm Biopharm. 2004;57(2):263–267. doi: 10.1016/j.ejpb.2003.10.020. [DOI] [PubMed] [Google Scholar]
- 5.Shehzadi KHAQNIBAHN. Impact of particle-size reduction on solubility and antidiabetic activity of extracts of leaves of Vinca rosea. Turkish Journal of Pharmaceutical Sciences. 2018;16:335–339. doi: 10.4274/tjps.galenos.2018.02419. [DOI] [PMC free article] [PubMed] [Google Scholar]
- 6.Grove M. Müllertz A, Nielsen JLG, Pedersen GP. Bioavailability of seocalcitol II: development and characterisation of self-microemulsifying drug delivery systems (SMEDDS) for oral administration containing medium and long chain triglycerides. European Journal of Pharmaceutical Ences. 2006;28(3):233–242. doi: 10.1016/j.ejps.2006.02.005. [DOI] [PubMed] [Google Scholar]
- 7.Pouton CW. Formulation of self-emulsifying drug delivery systems. Adv Drug Deliv Rev. 1997;25(1):47–58. doi: 10.1016/S0169-409X(96)00490-5. [DOI] [Google Scholar]
- 8.Pouton CW. Lipid formulations for oral administration of drugs: non-emulsifying, self-emulsifying and 'self-microemulsifying’ drug delivery systems. European Journal of Pharmaceutical Ences. 2000;11:S93–SS8. doi: 10.1016/S0928-0987(00)00167-6. [DOI] [PubMed] [Google Scholar]
- 9.Porter CJH, Pouton CW, Cuine JF, Charman WN. Enhancing intestinal drug solubilisation using lipid-based delivery systems. Adv Drug Deliv Rev. 2008;60(6):673–691. doi: 10.1016/j.addr.2007.10.014. [DOI] [PubMed] [Google Scholar]
- 10.Chang-Shun L, Li C, Yan-Nan H, Jin-Lian D, Biao M, Qing-Fa T, et al. Self-microemulsifying drug delivery system for improved oral delivery and hypnotic efficacy of ferulic acid. Int J Nanomedicine. 2020;15:2059–2070. doi: 10.2147/IJN.S240449. [DOI] [PMC free article] [PubMed] [Google Scholar]
- 11.Kannamangalam VU, Sadineni V, Sushant S. S SR. Enhancement of loading and oral bioavailability of curcumin loaded self-microemulsifying lipid carriers using Curcuma oleoresins. Drug Dev Ind Pharm. 2020;46(6):889–898. doi: 10.1080/03639045.2020.1762201. [DOI] [PubMed] [Google Scholar]
- 12.Pawar YB, Purohit H, Valicherla GR, Munjal B, Lale SV, Patel SB, Bansal AK. Novel lipid based oral formulation of curcumin: development and optimization by design of experiments approach. Int J Pharm. 2012;436(1-2):617–623. doi: 10.1016/j.ijpharm.2012.07.031. [DOI] [PubMed] [Google Scholar]
- 13.Singh SK, Prasad Verma PR, Razdan B. Glibenclamide-loaded self-nanoemulsifying drug delivery system: development and characterization. Drug Dev Ind Pharm. 2010;36(8):933–945. doi: 10.3109/03639040903585143. [DOI] [PubMed] [Google Scholar]
- 14.Pouton CW, Porter CJH. Formulation of lipid-based delivery systems for oral administration: materials, methods and strategies. Adv Drug Deliv Rev. 2008;60(6):625–637. doi: 10.1016/j.addr.2007.10.010. [DOI] [PubMed] [Google Scholar]
- 15.Kumar DGP. Formulation development and evaluation of pioglitazone hydrochloride self-emulsifying drug delivery systems. J Chin Pharm Sci. 2015;24(7):433–441. doi: 10.5246/jcps.2015.07.056. [DOI] [Google Scholar]
- 16.Vamshi KM, Vijaya KB, Dudhipala N. In-situ intestinal absorption and pharmacokinetic investigations of carvedilol loaded supersaturated self-emulsifying drug system. Pharm Nanotechnol. 2020. [DOI] [PubMed]
- 17.Potharaju S, Mutyam SK, Liu M, Green C, Frueh L, Nilsen A, Pou S, Winter R, Riscoe MK, Shankar G. Improving solubility and oral bioavailability of a novel antimalarial prodrug: comparing spray-dried dispersions with self-emulsifying drug delivery systems. Pharm Dev Technol. 2020;25(5):625–639. doi: 10.1080/10837450.2020.1725893. [DOI] [PMC free article] [PubMed] [Google Scholar]
- 18.Bruno, AFMCACS Chemical modification of drug molecules as strategy to reduce interactions with mucus. Adv Drug Deliv Rev. 2017;124:98–106. doi: 10.1016/j.addr.2017.09.020. [DOI] [PubMed] [Google Scholar]
- 19.Griesser J. Hetenyi, Gergely, Kadas, Hatice, et al. Self-emulsifying peptide drug delivery systems: how to make them highly mucus permeating. Int J Pharm. 2018;538(1-2):159–166. doi: 10.1016/j.ijpharm.2018.01.018. [DOI] [PubMed] [Google Scholar]
- 20.Zaichik S, Steinbring C, Caliskan C, Bernkop-Schnurch A. Development and in vitro evaluation of a self-emulsifying drug delivery system (SEDDS) for oral vancomycin administration. Int J Pharm. 2019;554:125–133. doi: 10.1016/j.ijpharm.2018.11.010. [DOI] [PubMed] [Google Scholar]
- 21.Cardona MI, Nguyen Le NM, Zaichik S, Aragon DM, Bernkop-Schnurch A. Development and in vitro characterization of an oral self-emulsifying delivery system (SEDDS) for rutin fatty ester with high mucus permeating properties. Int J Pharm. 2019;562:180–186. doi: 10.1016/j.ijpharm.2019.03.036. [DOI] [PubMed] [Google Scholar]
- 22.Menzel C, Holzeisen T, Laffleur F, Zaichik S, Abdulkarim M, Gumbleton M. In vivo evaluation of an oral self-emulsifying drug delivery system (SEDDS) for exenatide. Journal of Controlled Release Official Journal of the Controlled Release Society. 2018;277:165–172. doi: 10.1016/j.jconrel.2018.03.018. [DOI] [PubMed] [Google Scholar]
- 23.Zaichik S, Steinbring C, Menzel C, Knabl L, Orth-Holler D, Ellemunter H, et al. Development of self-emulsifying drug delivery systems (SEDDS) for ciprofloxacin with improved mucus permeating properties. Int J Pharm. 2018;547(1-2):282–290. doi: 10.1016/j.ijpharm.2018.06.005. [DOI] [PubMed] [Google Scholar]
- 24.Unson S, Kongsaden C, Wonganan P. Cepharanthine combined with 5-fluorouracil inhibits the growth of p53-mutant human colorectal cancer cells. J Asian Nat Prod Res. 2020;22(4):370–385. doi: 10.1080/10286020.2018.1564136. [DOI] [PubMed] [Google Scholar]
- 25.Hasegawa S, Takahashi K. The effect of cepharanthine on pertussis. Jpn J Exp Med. 1949;20(2):229–234. [PubMed] [Google Scholar]
- 26.Hussam A-H, Rafal A-S, Ahmed A-H. Addressing the challenges of tuberculosis: a brief historical account. Front Pharmacol. 2017;8:689. doi: 10.3389/fphar.2017.00689. [DOI] [PMC free article] [PubMed] [Google Scholar]
- 27.Kikukawa Y, Okuno Y, Tatetsu H, Nakamura M, Hata H. Induction of cell cycle arrest and apoptosis in myeloma cells by cepharanthine, a biscoclaurine alkaloid. Int J Oncol. 2008;33(4):807–814. [PubMed] [Google Scholar]
- 28.Chen Z, Huang C, Yang YL, Ding Y, Ou-Yang HQ, Zhang YY, Xu M. Inhibition of the STAT3 signaling pathway is involved in the antitumor activity of cepharanthine in SaOS2 cells. Acta Pharmacol Sin. 2012;33(1):101–108. doi: 10.1038/aps.2011.164. [DOI] [PMC free article] [PubMed] [Google Scholar]
- 29.Fang ZH, Li YJ, Chen Z, Wang JJ, Zhu LH. Inhibition of signal transducer and activator of transcription 3 and cyclooxygenase-2 is involved in radiosensitization of cepharanthine in HeLa cells. International Journal of Gynecological Cancer Official Journal of the International Gynecological Cancer Society. 2013;23(4):608–614. doi: 10.1097/IGC.0b013e31828a05fd. [DOI] [PubMed] [Google Scholar]
- 30.Shigeki I, Satoshi I. Induction of insulin-like growth factor-I by cepharanthine from dermal papilla cells: a novel potential pathway for hair growth stimulation2013. [DOI] [PubMed]
- 31.Rogosnitzky M, Okediji P, Koman I. Cepharanthine: a review of the antiviral potential of a Japanese-approved alopecia drug in COVID-19. Pharmacol Rep. 2020;22:1–8. doi: 10.1007/s43440-020-00132-z. [DOI] [PMC free article] [PubMed] [Google Scholar]
- 32.Saso HOKWW. Multidrug treatment with nelfinavir and cepharanthine against COVID-19. bioRxiv. 2020.
- 33.Chen CZ, Xu M, Pradhan M, Gorshkov K, Whittaker GR. Identifying SARS-CoV-2 entry inhibitors through drug repurposing screens of SARS-S and MERS-S pseudotyped particles. ACS Pharmacology & Translational Science. 2020;3(6):1165–1175. doi: 10.1021/acsptsci.0c00112. [DOI] [PMC free article] [PubMed] [Google Scholar]
- 34.Bailly C. Cepharanthine: an update of its mode of action, pharmacological properties and medical applications. Phytomedicine. 2019;62:1529–1526. doi: 10.1016/j.phymed.2019.152956. [DOI] [PMC free article] [PubMed] [Google Scholar]
- 35.Li Q, Cai T, Huang Y, Zhang R, Cole SPC, Cai Y. The preparation and evaluation of cepharanthine-nanostructured lipid carriers in vitro and in vivo. J Biomater Tissue Eng. 2017;7(9):848–857. doi: 10.1166/jbt.2017.1642. [DOI] [Google Scholar]
- 36.Deng Y, Wu W, Ye S, Wang W, Wang Z. Determination of cepharanthine in rat plasma by LC-MS/MS and its application to a pharmacokinetic study. Pharm Biol. 2017;55(1):1775–1779. doi: 10.1080/13880209.2017.1328446. [DOI] [PMC free article] [PubMed] [Google Scholar]
- 37.Ahn J-H, Kim Y-P, Lee Y-M, Seo E-M, Lee K-W, Kim H-S. Optimization of microencapsulation of seed oil by response surface methodology. Food Chem. 2008;107(1):98–105. doi: 10.1016/j.foodchem.2007.07.067. [DOI] [Google Scholar]
- 38.Das SS, Singh A, Kar S, Ghosh R, Pal M, Fatima M, et al. Application of QbD framework for development of self-emulsifying drug delivery systems. Pharmaceutical Quality by Design. 142019:297–350.
- 39.Dong RH, Fang ZZ, Gao HZ, Hao GT, Liu G, Shan TT, Liu ZY. Bioanalysis of cepharanthine byLC–ESI–MS–MS and its application to pharmacokinetic studies. Chromatographia. 2011;73(1-2):75–81. doi: 10.1007/s10337-010-1823-3. [DOI] [Google Scholar]
- 40.Zakkula A, Gabani BB, Jairam RK, Kiran V, Todmal U, Mullangi R. Preparation and optimization of nilotinib self-micro-emulsifying drug delivery systems to enhance oral bioavailability. Drug Dev Ind Pharm. 2020;46(3):498–504. doi: 10.1080/03639045.2020.1730398. [DOI] [PubMed] [Google Scholar]
- 41.Ma F, Li X, Yin J, Ma L, Li D. Optimisation of double-enzymatic extraction of arabinoxylan from fresh corn fibre. Journal of Food Science and Technology. 2020;pp:1-11. [DOI] [PMC free article] [PubMed]
- 42.Schulman JH, Stoeckenius W, Prince LM. Mechanism of formation and structure of micro emulsions by electron microscopy. J Phys Chem. 1959;63(10):1677–1680. doi: 10.1021/j150580a027. [DOI] [Google Scholar]
- 43.Hironobu SKK. Conditions to produce so-called microemulsions: factors to increase the mutual solubility of oil and water by solubilizer. Shinoda Kōzō;Kunieda Hironobu. 1973;42(2):381–387. [Google Scholar]
- 44.Rocha ESFCP, Roque BAC, Rocha ESNMP, Rufino RD, Luna JM, Santos VA, et al. Yeasts and bacterial biosurfactants as demulsifiers for petroleum derivative in seawater emulsions. AMB Express. 2017;7(1):202. doi: 10.1186/s13568-017-0499-6. [DOI] [PMC free article] [PubMed] [Google Scholar]
- 45.Xu W, Chen S, Wang X, Wu H, Yamada H, Hirano T. Bisbenzylisoquinoline alkaloids and P-glycoprotein function: a structure activity relationship study. Bioorg Med Chem. 2020;28(12):115553. doi: 10.1016/j.bmc.2020.115553. [DOI] [PubMed] [Google Scholar]
- 46.Bian X, Jiang L, Zhou J, Guan X, Wang J, Xiang P, et al. Improving dissolution and cytotoxicity by forming multidrug crystals. Molecules. 2020;25(6). [DOI] [PMC free article] [PubMed]
- 47.XJ WX. Absorption kinetics of cepharanthine in the intestines of rats. Western China Journal of pharmacy. 2007;04:416–418. [Google Scholar]


