Figure 1. Degron-tagged transmembrane insulin/insulin-like growth factor-1 (IGF-1) receptor DAF-2 is susceptible to auxin-mediated degradation.
(A) Schematic illustration of auxin-inducible degradation (AID)-mediated DAF-2 receptor depletion in daf-2(bch40) Caenorhabditis elegans. (B) Immunoblot of eft-3p::TIR1::mRuby::unc-54 3’UTR, daf-2(bch40), wild type (N2), and DAF-2::degron (eft-3p::TIR1::mRuby::unc-54 3’UTR; daf-2(bch40)). (C) Immunoblot of ‘DAF-2::degron’ animals that were grown on OP50 NGM and at L4 stage shifted to either empty vector control RNAi (L4440) or daf-2(RNAi) plates containing either DMSO or 1 mM auxin. After 48 hr on the second day of adulthood, animals were harvested for western blotting. (D) Densitometric quantification of (C) from n = 3 independent experiments. Error bars represent s.d. Two-sided t-test was used for statistical analysis. *: p < 0.05, **: p < 0.01, ***: p < 0.001. (E) Immunoblot of DAF-2::degron animals showed no decrease of DAF-2 levels at high temperatures. Animals were raised at 15°C and put as L4 for 24 hr at the indicated temperatures. (F) A representative immunoblot of ‘DAF-2::degron’ animals after 1% glucose and 36–48 hr starvation on the second day of adulthood. L4 DAF-2::degron animals were either placed on OP50 NGM plates with or without 1 mM auxin, or containing 1% glucose, or on empty (no bacteria) NGM plates. Animals were harvested 36–48 hr later. (G) Densitometric quantification of (F) from n = 3 independent experiments. Error bars represent s.d. Two-sided t-test was used for statistical analysis. *: p < 0.05, **: p < 0.01, ***: p < 0.001. (H) Immunoblot analysis of starved DAF-2::degron animals. Animals were raised on OP50 NGM at 20°C and shifted from L4 to L4440 containing FUdR. After 2 days, they were washed off, and either frozen as control or put on empty plates and harvested after 24 or 48 hr, respectively. (I) Immunoblot analysis of 1-day-old adult DAF-2::degron animals treated with 1 mM auxin for the indicated time periods. (J) Quantification of (I) from n = 3 independent experiments. Error bars represent s.d. One-sided t-test was used for statistical analysis. *: p < 0.05, **: p < 0.01, ***: p < 0.001. For (B–J), see Source data 1 and Source data 2 for raw data, full blots, and statistics.

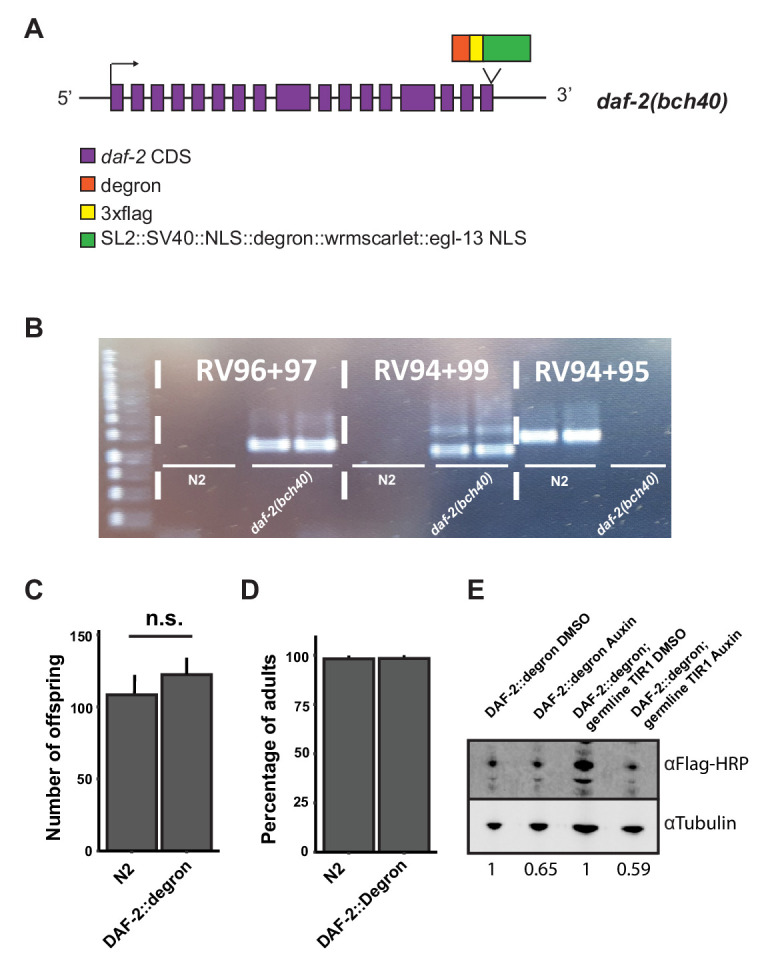
Figure 1—figure supplement 1. Degron-tagged DAF-2 is functional and susceptible to auxin-mediated degradation.