. 2021 Sep 6;10:e67403. doi: 10.7554/eLife.67403

Figure 2. Strong enhancers contain a diverse array of motifs.

(a) Receiver operating characteristic for classifying strong enhancers from silencers. Solid black, 6-mer support vector machine (SVM); orange, eight transcription factors (TFs) predicted occupancy logistic regression; aqua, predicted cone-rod homeobox (CRX) occupancy logistic regression; dashed black, chance; shaded area, 1 standard deviation based on fivefold cross-validation. (b and c) Total predicted TF occupancy (b) and frequency of TF motifs (c) in each activity class. (d) Frequency of co-occurring TF motifs in strong enhancers. Lower triangle is expected co-occurrence if motifs are independent. (e) Frequency of activity classes, colored as in (b), for sequences in CRX, NRL, and/or MEF2D ChIP-seq peaks. (f) Frequency of TF ChIP-seq peaks in activity classes. TFs in (c) are sorted by feature importance of the logistic regression model in (a).

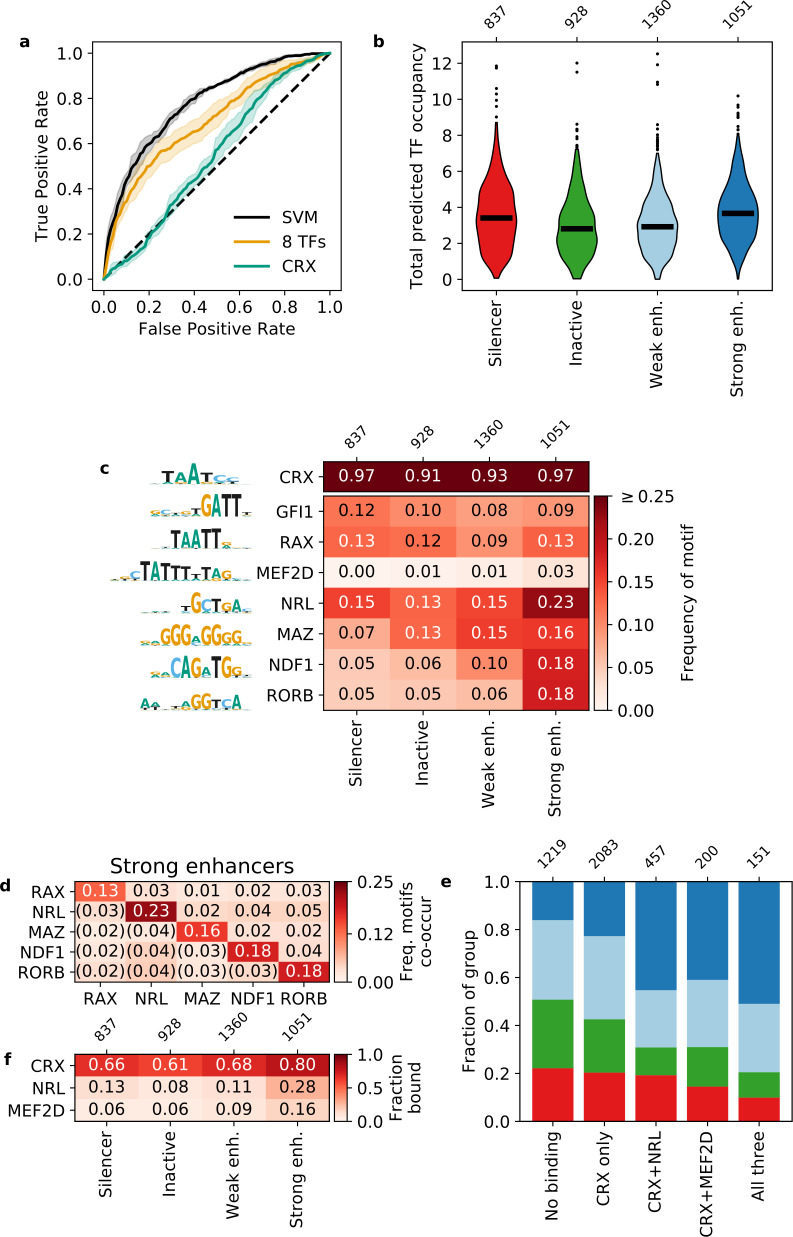
Figure 2.

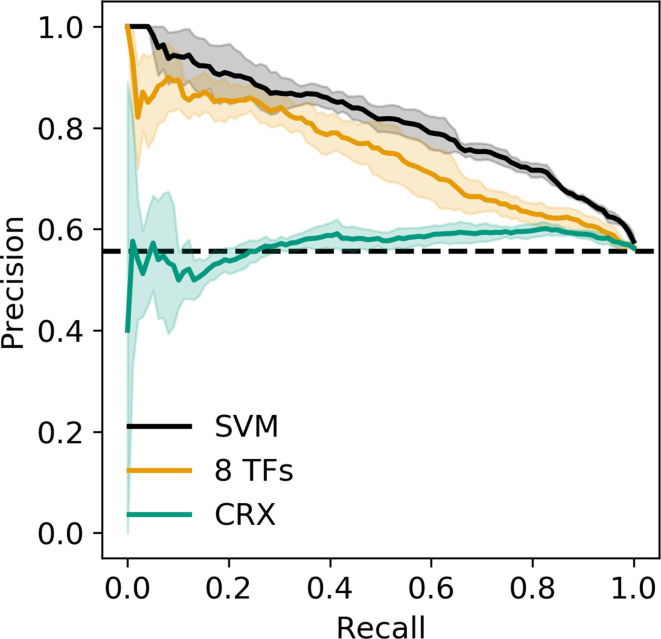
Figure 2—figure supplement 1. Precision recall curve for strong enhancer vs. silencer classifiers.

Figure 2—figure supplement 1.

Solid black, 6-mer support vector machine (SVM); orange, eight transcription factors (TFs) predicted occupancy logistic regression; aqua, predicted cone-rod homeobox (CRX) occupancy logistic regression; dashed black, chance; shaded area, 1 standard deviation based on fivefold cross-validation.
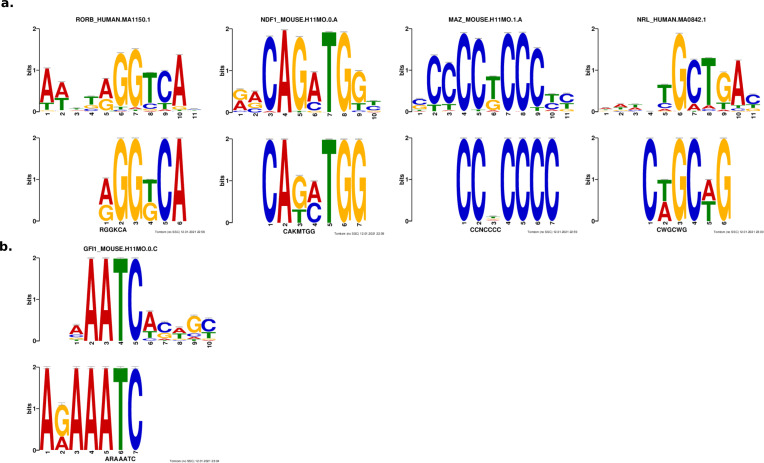
Figure 2—figure supplement 2. Results from de novo motif analysis.

Figure 2—figure supplement 2.

Motifs enriched in strong enhancers (a) and silencers (b). Bottom, de novo motif identified with DREME; top, matched known motif identified with TOMTOM.
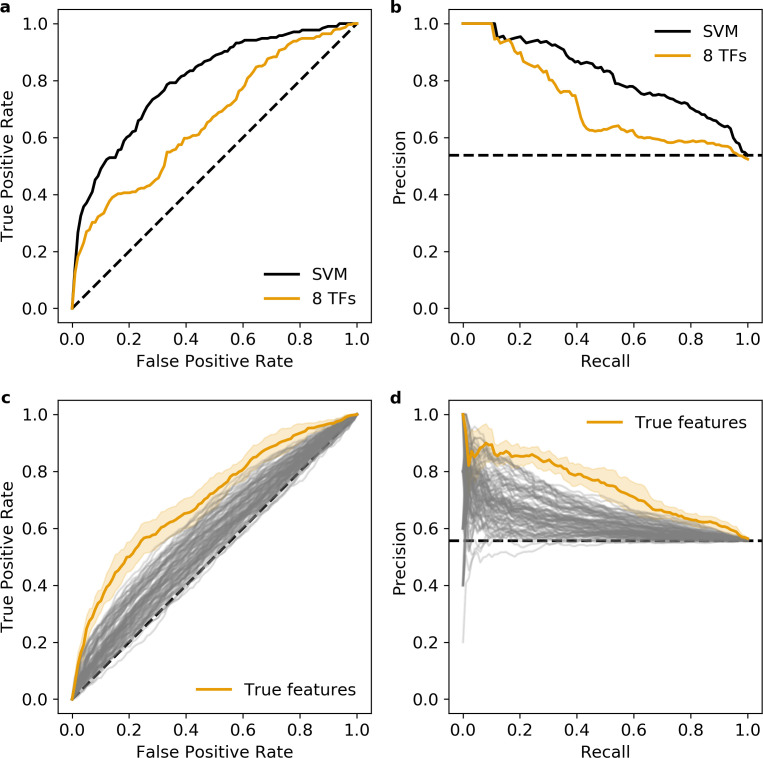
Figure 2—figure supplement 3. Additional validation of the eight transcription factors (TFs) predicted occupancy logistic regression model.

Figure 2—figure supplement 3.

(a and b) Predictions of the 6-mer support vector machine (SVM) (black) and eight TFs predicted occupancy logistic regression model (orange) on an independent test set. (c and d) Null distribution of 100 logistic regression models trained using randomly selected motifs (gray) compared to the true features (orange). Shaded area, 1 standard deviation based on fivefold cross-validation. (a and c) Receiver operating characteristic, (b and d) precision recall curve. Dashed black line represents chance in all panels.