Abstract
Aging is associated with progressive loss of cellular homeostasis resulting from intrinsic and extrinsic challenges. Lack of a carefully designed, well-characterized, precise, translational experimental model is a major limitation to understanding the cellular perturbations that characterize aging. Here, we tested the feasibility of primary fibroblasts isolated from nonhuman primates (baboons) as a model of cellular resilience in response to homeostatic challenge. Using a real-time live-cell imaging system, we precisely defined a protocol for testing effects of prooxidant compounds (e.g., hydrogen peroxide (H2O2), paraquat), thapsigargin, dexamethasone, and a low glucose environment on cell proliferation in fibroblasts derived from baboons across the life course (n = 11/sex). Linear regression analysis indicated that donor age significantly reduced the ability of cells to proliferate following exposure to H2O2 (50 and 100 µM) and paraquat (100 and 200 µM) challenges in cells from males (6.4–21.3 years; average lifespan 21 years) but not cells from females (4.3–15.9 years). Inhibitory effects of thapsigargin on cell proliferation were dependent on challenge duration (2 vs 24 h) and concentration (0.1 and 1 µM). Cells from older females (14.4–15.9 years) exhibited greater resilience to thapsigargin (1 µM; 24 h) and dexamethasone (500 µM) challenges than did those from younger females (4.3–6.7 years). The cell proliferation response to low glucose (1 mM) was reduced with age in both sexes. These data indicate that donor’s chronological age and sex are important variables in determining fibroblast responses to metabolite and other challenges.
Supplementary Information
The online version contains supplementary material available at 10.1007/s11357-021-00395-1.
Keywords: Aging, Fibroblast, Baboon, Oxidative stress, Cell proliferation, Resilience
Introduction
Aging is associated with progressive loss of cellular homeostasis resulting in increased vulnerability to intrinsic and extrinsic challenges. The hallmarks of biologic aging, including genomic instability, cellular senescence, mitochondrial dysfunction, and epigenetic alterations, among others [1], are associated with responses to stressful cellular challenges. Stress conditions caused by several sources including free radicals, nutrient deficit, or dysregulated neuroendocrine stress axis [2] perturb cellular function and are thought to substantially contribute to aging. Processes that maintain homeostasis are pivotal for optimal cellular function and health span. Normal physiologic activities can elicit stress factors that may have both beneficial and detrimental effects. For example, aerobic respiration by the mitochondria to generate ATP is accompanied by generation of reactive oxygen species (ROS), which are important for cell signaling at low concentrations but cause damage to cellular DNA and functional proteins at high concentrations [3].
The frequency of exposure to stressors increases and accumulates throughout the lifespan, significantly disrupting homeostasis and altering the rate of aging. Moreover, organisms are exposed to a variety of types of cellular stress from both extrinsic and intrinsic sources throughout life. Challenges with defined forms of stress, chemical, physical, or otherwise can inform on particular response systems that regulate homeostasis. For example, oxidants such as H2O2 and paraquat increase mitochondrial ROS generation to cause oxidative stress (OS) [4], which has been proposed as a major driver of aging. The intracellular Ca2+ pump inhibitor, thapsigargin, induces endoplasmic reticulum (ER) stress [5]. Most ER activities including chaperone maintenance of protein folding are Ca2+ dependent [6]. Depletion of ER Ca2+ leads to an overload of aggregated protein and eventual cell death [7]. Disruption to proteostasis causes cellular aging [8] and is associated with many age-related diseases such as Parkinson’s disease and Alzheimer’s disease [9]. Metabolic stress caused by nutrient deficit such as glucose deprivation also elicits mitochondrial OS [10] and ER stress [11]. Limiting glucose utilization reduces cellular ATP content [12], increases ROS generation [13], and activates apoptotic signals that lead to cell death [14]. Glucocorticoids (GCs, e.g., cortisol in primates and corticosterone in rodents) are primary stress hormones that contribute to homeostasis through genomic or non-genomic processes. The cause-and-effect relationship between aging and GCs is not clear [15, 16], with age-dependent rise and fall in cortisol level reported in humans and primates [17, 18] and a fall in rodents [19]. At low concentrations, GCs increase the replicative lifespan of human fibroblasts by suppressing p21 expression which is associated with cellular senescence [20], whereas at high concentrations, GCs induce OS [21] which may contribute to aging.
In response to cellular stress, a series of events are initiated to restore homeostasis. These include, among others, activation of endogenous antioxidant systems to mitigate free radical accumulation [22], induction of the unfolded protein response that maintains protein quality and prevents protein aggregation, and initiation of cell repair machinery to restore damaged DNA [23]. As physiologic functions gradually decline with aging, the molecular machinery for homeostasis and stress adaptive response becomes weakened [24]. The overwhelming effect of stressors therefore navigates the systems towards a diseased state.
Clarifying the particulars of cellular homeostasis in aging has the potential to identify potential therapeutic options to delay age-related diseases. There is a need for carefully controlled studies that mimic relevant physiologic and pathophysiologic conditions occurring at the cellular level that lead to aging. A carefully designed, well-characterized, translational experimental model that affords the opportunity to identify subtle but significant changes would contribute greatly to understanding mechanisms responsible for human aging. Cellular viability assays in culture are useful tools for screening compounds of choice especially when accompanied by real-time tracking of cellular growth and morphological changes. Most available methods for measurement of cell proliferation are laborious and time-consuming and are weakened by potential interference from endogenous or exogenous compounds. For example, tetrazolium-based assays determine the conversion of tetrazolium compound to a formazan product as a measure of cell enumeration but the conversion can be influenced by antioxidants [25], glucose concentrations [26], or phytochemicals [27].
Here, using a real-time live-cell imaging system on the IncuCyte platform as an alternative method to the traditional endpoint assays, we report a protocol for characterizing the resilience effects of dividing fibroblasts to several cellular challenges including prooxidant compounds (e.g., H2O2 and paraquat), an inducer of proteotoxic stress, thapsigargin, the synthetic glucocorticoid, dexamethasone, and a low glucose environment on cell proliferation in baboon fibroblasts. The duration of challenge, concentration, donor age, and sex served as variable factors. This approach represents a method of identifying aging-related mechanisms that are translatable to humans both as a research and a diagnostic tool.
Methods
Animals
All procedures involving animals were approved by the Institutional Animal Care and Use Committee of Texas Biomedical Research Institute (TBRI) and conducted in Association for Assessment and Accreditation of Laboratory Animal Care approved facilities. Baboons (Papio species) were maintained in an outdoor group social environment and fed ad libitum with normal monkey diet (Purina Monkey diet 5038; 3.22 kcal/g) using an individual feeding system. Details of animal care and husbandry have been previously described in detail [28].
Skin biopsy to obtain fibroblasts
A skin biopsy was taken from behind the upper back portion of one ear of each baboon when animals were aged between 4 and 21 years (human equivalent 14–73 years) at the time of collection. The biopsy was collected into Dulbecco’s modified eagle medium (DMEM) (Gibco, Carlsbad, CA, USA) during an ancillary procedure in which baboons were tranquilized with ketamine (10 mg/kg IM). Primary fibroblasts were established from 4-mm diameter skin biopsy using previously published methods [29, 30] with slight modifications. A detailed procedure for isolating baboon fibroblast is presented in the supplementary information (SI). Following fibroblast isolation and each subculture, viable cells were counted and population doubling time determined.
Cell density optimization on IncuCyte S3 live-cell imaging system
Procedure
Count cells and seed 250, 500, 1000, 2000, 4000, 5000, and 10,000 cells per well into a 96-well plate in triplicate.
The volume of complete media (DMEM, 10% fetal bovine serum and 1% antibiotics) should be about 250 µl per well.
Place 250 µl of sterile Dulbecco’s phosphate-buffered saline (DPBS) (Gibco) in wells on the plate edges to control evaporation of media from the cells.
Incubate at room temperature for 30 min to allow cells to settle at the bottom of the plate.
Transfer the plate to the IncuCyte and fit stably to the imaging platform.
Allow the assay plate to warm up to 37 °C for at least 30 min in the IncuCyte before capturing images.
IncuCyte S3 setup
Launch the software and select ‘schedule to acquire’ to set the device to begin data acquisition.
- Select ‘launch add vessel’.Note: the vessel in this case is referred to as the 96-well plate with seeded cells.
Select ‘scan on schedule’ so that the vessel will be scanned repeatedly.
Go to the next page to add information about the new vessel about to be scanned.
Select ‘standard type of scan’ for the new vessel.
Specify the scan setting as ‘phase’ for image channel and set the objective as × 20 magnification.
Enter the catalogue number of the 96-well plate in the vessel selection panel. For Costar 96-well plate, the reference code is 3596. The software will load the details of the plate automatically.
Select the information provided and navigate to the next page.
Choose the exact location of the 96-well plate on the IncuCyte plate holder.
Select the scan pattern for image acquisition in the wells with cells.
Set the number of images to be captured as nine (9) to ensure images are taken from different fields.
Name the experiment in the vessel notebook and label the cell type and passage number.
Use the plate map to specify detailed information about each well as appropriate.
Defer image analysis to a later time if it is not yet defined.
Note: it is recommended to set analysis to run automatically after the vessels have been scanned.
Right-click on timeline window to set the number of scans and select ‘set selected scan group interval’ that pops up.
Schedule time for scanning to commence.
Select scan interval as 6 h apart, for a 24-h period, and click ok. This setting keeps the schedule going on repeatedly until it is ended by the user.
Review the summary page and select ‘add to schedule’ to save settings.
The device is set to acquire images.
IncuCyte S3 analysis setup
Launch IncuCyte software.
Select ‘view recent scans’ option.
Click on the vessel name to be analyzed.
On the left panel of the software window, choose ‘launch analysis.’
Select ‘new analysis definition’ and instruct the software to run a basic analysis of the images using the basic analyzer button.
Select representative images to preview and refine the analysis.
Under the analysis definition window, define the metrics (e.g., fibroblast) and set the background segmentation as 1.
To avoid capturing debris along with cells, randomly measure the radius of the cells and set the device to a value slightly lower than the minimum radius observed. This way, pieces of debris are not captured as cellular objects.
Keep clean up and filter settings in their default states.
Preview image to determine if the selection is appropriate.
Check if the confluence mask is truly covering the cells and not the background. Otherwise, adjust radius and background segmentation as deemed appropriate.
Select the available scan times and images for your analysis to commence.
Select ‘Analyze future scans’ option if it is desirable to analyze subsequent scans.
Provide a name for the analysis setup.
Save and apply the analysis definition.
For future experiments requiring only phase scans, use the named analysis to maintain consistency.
Acquiring data from the IncuCyte
Launch the software.
Select ‘view recent scans’ option.
On the software platform, click the pointed arrow to the left of the named vessel.
Double click the drop-down window to open the analyzed results.
Use the graph option to see a time plot or histogram of results.
Select confluence (%) under defined metrics, the appropriate wells, and scan times to graph the data.
Data can be exported using the export data button.
Images and movies can be exported using the export images and movies icon.
Testing the effects of prooxidant compounds, thapsigargin, dexamethasone, and glucose on baboon fibroblast proliferation
Baboon fibroblasts were exposed to varying concentrations of H2O2, paraquat, and thapsigargin as well as a synthetic glucocorticoid, dexamethasone, and glucose. Fibroblasts derived from male and female baboons (n = 11 per sex) were used for the proliferation assay with donor age, sex, and duration of challenge compounds as variables.
Note: before starting the experiment, it is advisable to draw a layout of the required wells for the assay and program the system to continuously monitor cell growth immediately after cell seeding until termination of the experiment. All measurements should be made in 3 replicate wells.
Cell seeding
Follow standard procedure for splitting/trypsinizing cells as described in SI.
Resuspend cells in complete media.
Count and calculate the number of cells per milliliter.
Place 96-well plate in a laminar flow hood and label as appropriate.
Add complete media (250 µl) to the wells according to planned layout for challenging cells.
Add 250-µl DPBS to wells closer to the edges.
-
Seed 2000 cells per well in triplicate.
Note: we do not seed cells to outer wells because fluid evaporates quickly from there.
Incubate cells at room temperature for 30 min in the laminar flow hood.
Place on the IncuCyte platform for image acquisition and cell confluence computation.
Set data acquisition for every 6 h.
Procedure for testing the effect of H2O2 on baboon fibroblast proliferation
-
Challenge cells with H2O2 48 h after cell seeding.
Note: during the development of this assay, we found that higher concentrations of H2O2 caused cells to detach easily from the plate when challenged 24-h post-seeding as for other agents tested here. To address this, we grew cells for 48 h prior to challenge. However, 24-h growth may be sufficient with milder H2O2 concentration or with cell types that proliferate quickly.
Prepare aliquots from stock H2O2 solution (9.8 M; 30% w/v in water; Sigma).
Label 15-ml tubes and perform serial dilution of stock H2O2 to achieve 50- and 100-µM H2O2 concentrations.
Carefully aspirate complete media from wells and add 50- and 100-µM H2O2 to designated wells and complete media to wells designated as control.
Incubate cell plate for 2 h.
Remove plate from incubator, aspirate media, and wash wells twice with DPBS.
Add 250-µl complete media to the wells.
Return plate to IncuCyte for continuous monitoring of cell confluence.
Procedure for testing the effect of paraquat on baboon fibroblast proliferation
Challenge cells with paraquat 24 h after cell plating.
Prepare stock concentrations of methyl viologen dichloride (paraquat) with dimethyl sulfoxide (DMSO) (e.g., 0.5 mM; Sigma).
Label 15-ml tubes for serial dilution.
Dilute stock paraquat solution with complete media to achieve 100- and 200-µM paraquat concentrations.
Carefully remove complete media from wells, challenge cells with paraquat (100 and 200 µM) for 2 h.
Wash wells with DPBS and add 250-µl complete media.
Return cell plate to IncuCyte to continue cell confluence determination.
Procedure for testing the effect of thapsigargin on baboon fibroblast proliferation
Challenge cells with thapsigargin 24 h after cell plating.
Prepare stock concentrations of thapsigargin with DMSO (e.g., 8 mM; Sigma).
Label 15-ml tubes for serial dilution.
Reconstitute stock thapsigargin solution with complete media to achieve 0.1- and 1-µM thapsigargin concentrations.
Incubate cells with the prepared concentrations of thapsigargin for 2 or 24 h.
Wash wells with DPBS and add 250 µl complete media.
Monitor cell proliferation on the IncuCyte.
Procedure for testing the effect of dexamethasone on baboon fibroblast proliferation
Challenge cells with dexamethasone 24 h after plating.
Prepare stock concentrations of dexamethasone with DMSO (e.g., 63.7 mM; Sigma).
Label 15-ml tubes for serial dilution.
Reconstitute stock dexamethasone solution with complete media to achieve 100- and 500-µM dexamethasone concentrations.
Incubate cells with dexamethasone (100 and 500 µM) for 48 h, wash wells with DPBS, and add 250-µl complete media.
Return plate to the IncuCyte for continuous determination of cell confluence.
Procedure for testing the effect of low glucose media on baboon fibroblast proliferation
Prepare stock concentrations of glucose (e.g. 50 mM; Sigma).
Label 15-ml tubes for serial dilution.
Prepare glucose-free media using DMEM without glucose and supplement with 5% bovine serum albumin (Gibco) and 1% antibiotics.
Prepare a glucose dilution to achieve 1-mM glucose media.
Designate glucose-free media as 0-mM glucose concentration.
Challenge cells with low glucose 24 h after cell plating.
Wash wells with DPBS at least 3 times before adding low glucose or glucose-free media.
Add 0- and 1-mM glucose solutions to the appropriate wells and add complete media to wells designated as control.
Return cell plate to the IncuCyte for continuous determination of cell confluence in the presence of low glucose for 5 d.
Cell proliferation rate
The IncuCyte analysis software quantifies cell surface area coverage to determine cell confluence values during the entire cell culture period. Each cell confluence data point (%) was plotted against its corresponding time (h) of data collection to generate a kinetic graph. The slope of the time-course changes in cell confluence particularly during the exponential growth phase was used to determine cell proliferation rate (% confluence per h) using GraphPad prism 8 software.
Statistical analysis
Cell number following fibroblast isolation and passage was regressed against baboon chronological age using simple linear regression. Cell proliferation rate was analyzed by two-way analysis of variance (ANOVA) followed by Tukey post hoc test with categorical age and sex as independent variables. Young male and female baboons were aged between 6.4–7.4 and 4.3–6.7 years, respectively, while old baboons were 14.5–14.8 years for males and 14.4–15.9 years for females. The animals categorized into age groups were those in the same age bracket to ensure relative uniformity in age-dependent responses. Data from each individual animal were used in the life-course analysis. The relationship between proliferation rate in the presence of challenge compounds and age across the life course (males, 6.4–21.3 years; females, 4.3–15.9 years) was determined by linear regression. Data are presented as mean ± SEM; p < 0.05 is considered statistically significant. All analyses were carried out using GraphPad prism 8 (GraphPad software, San Diego, CA, USA).
Results
Cell count from cultured baboon fibroblasts
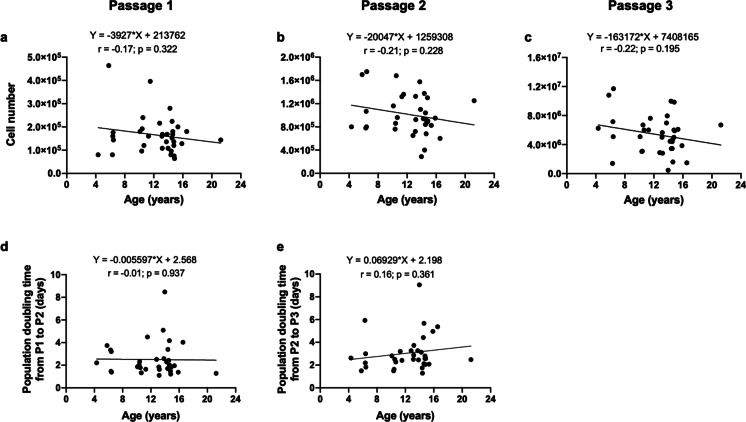
During the subculturing of fibroblasts prior to resilience challenge, we found no effect of sex on the relationship between donor age and cell number as well as population doubling time; therefore, cell count and population doubling for males and females were pooled. No significant relationship was observed between donor age and cell number at passages 1, 2, and 3 (Fig. 1a–c ); similarly there was no relationship between donor age and population doubling time from passages 1 to 2 as well as those from passages 2 to 3.
Fig. 1.
Relationship between donor age and baboon fibroblast cell number. Cells were isolated from 4-mm skin biopsy, cultured, and counted following trypsin digestion. The number of fibroblast cells derived from baboon skin upon reaching a first confluence after isolation, passage 1, and subsequent sequential subcultures, b passage 2, and c passage 3 was plotted against donor age. The number of cells at each passage tended to decline with age (r values are − 0.17, − 0.21, and − 0.22 for passages 1, 2, and 3, respectively, p > 0.05). d Population doubling time from passages 1 (P1) to 2 (P2) and e from P2 to P3. There was no relationship between population doubling time and donor age. Black rounded dots represent cell count or population doubling time from individual male and female baboons, donor age: 4.3–21.3 years, n = 34–35
Effect of seeding density on growth and proliferation
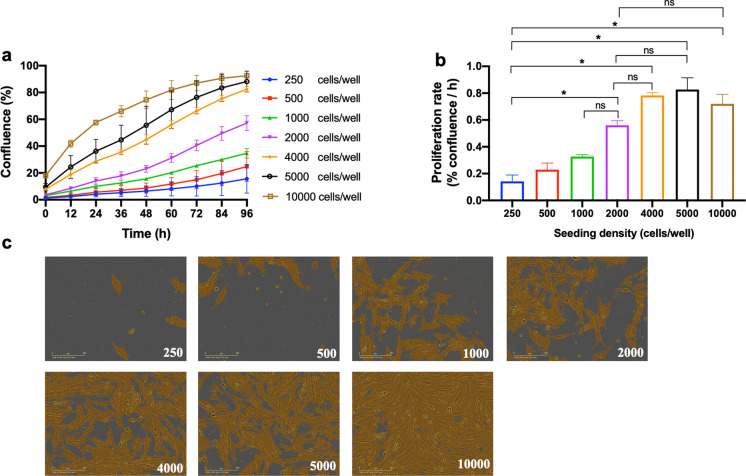
We tested the effects of seeding density on baboon fibroblast proliferation to confluence during development of this assay (Fig. 2). The time-course graph generated from the confluence metrics provides an overview of cell confluence level after cells were seeded at varying densities (Fig. 2a). These data are an important guide to determine the design of future experiments such as length of time in culture and likely differ depending on donor species, tissue, and cell type. The proliferation rate calculated for skin-derived baboon fibroblasts was similar for 250-, 500- and 1000-cell seeding densities between 12 and 72 h. However, this rate was lower than that found when starting populations of 2000 to 10,000 cells per well (Fig. 2b). It is therefore apparent that cell seeding density influences fibroblast proliferation rate as also indicated by images of cultured fibroblasts at 72-h time point. The lowest and highest proliferation rates were seeding densities of 250 and 5000 cells per well with an average of 0.14 and 0.83% confluence per hour, respectively. To test baboon fibroblast responses to challenge compounds, the seeding density of 2000 cells per well of a 96-well plate was chosen, as cells were in the proliferative phase when challenged and cell confluence can be monitored for more than 96 h before attaining full confluency.
Fig. 2.
Effect of seeding density on passage 4 baboon fibroblast proliferation. a Time-course graph of varying cell seeding density on fibroblast proliferation. Cell confluence (%) was monitored with the IncuCyte live-cell imaging system which quantifies cell surface area over time. The IncuCyte is housed within a standard cell culture incubator maintained at 37 °C, 3% O2, and 5% CO2. Cell proliferation following seeding densities of 250, 500, 1000, 2000, 4000, 5000, and 10,000 cells per well is represented by blue, red, green, purple, orange, black, and brown lines, respectively. b Proliferation rate determined from the slope of the time-course graph between 12 and 72 h was influenced by cell seeding density. c Representative images showing fibroblast proliferation at 72-h time point after seeding varying cell densities. Representative fibroblasts photomicrographs were obtained from a young male (6.4 years) baboon, scale bar; 200 µm. Image area analyzed is 0.57 mm2 per image. Data are expressed as mean ± SEM, each data point represents 3 replicate wells for each animal, n = 2, males, aged 6.40–6.50 years, *p < 0.05, ns = not significant
Effect of a H2O2 challenge on fibroblast proliferation
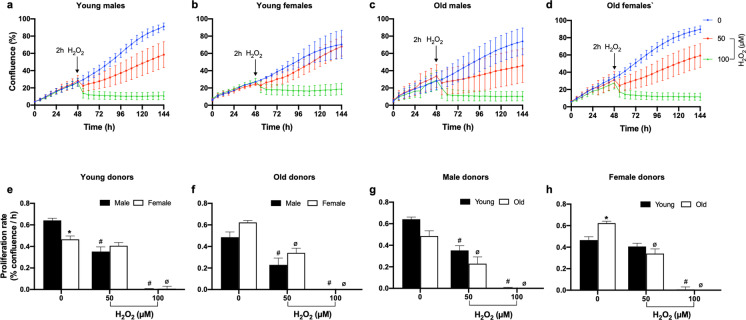
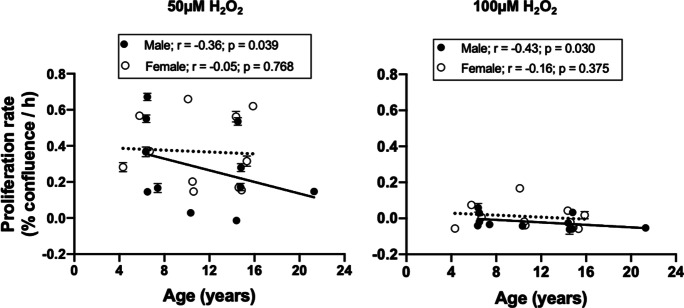
For all cellular resilience challenges, our overall goal was to define a dose (including time) of each cellular challenge that was not completely cytotoxic and following which there was a measurable resumption of cellular proliferation. That is, following challenge, we predicted there would be a pause in cellular proliferation followed by a resumption of cellular proliferation at a presumably reduced rate. For example, a 2-h exposure of passage 4 baboon fibroblast cultures to H2O2 (an OS challenge) elicited a concentration-dependent decrease in cell proliferation. When cells were challenged with 100-µM H2O2, there was a complete arrest of cell growth irrespective of donor age or sex, whereas the 50-µM H2O2 challenge only decreased cell proliferation (Fig. 3a–d). Thus, the lower dose could be used to estimate cellular resilience (i.e., recovery of proliferation rate), whereas the higher dose is more informative on cytotoxicity. Data analysis by categorical age group (young vs old) using two-way ANOVA revealed that there was no difference in the cell proliferation response to H2O2 challenge when fibroblasts derived from young and old baboons of both sexes (young males: 6.3–7.4; young females: 4.3–6.7; old males: 14.5–14.8; old females: 14.4–15.9 years) were compared (Fig. 3e–h). However, analysis by linear regression showed that both 50- and 100-µM H2O2 challenges significantly decreased cell proliferation as age advances in males but not females (Fig. 4).
Fig. 3.
Effect of H2O2 on proliferation of baboon fibroblasts at passage 4. Fibroblasts were derived from young and old baboons of both sexes. a–d Kinetic profile of fibroblast cell confluence (%) in response to 50- and 100-µM H2O2 challenge for 2 h (red and green lines, respectively). The blue line represents untreated cells (designated as 0). Time-course changes in cell confluence were monitored real time with the IncuCyte live-cell imaging system housed within a cell culture incubator (3% O2, 5% CO2 at 37 °C). Arrow points to the time when H2O2 was added to the cells. e–h Proliferation rate (% confluence/h) calculated from the slope of the corresponding kinetic graph between 78 and 144 h. H2O2 challenge inhibited cell proliferation in a concentration-dependent manner. Closed bars represent male or young donors, while open bars represent female or old donors. Proliferation rate was analyzed using two-way ANOVA. Data expressed as mean ± SEM, each data point represents 3 replicate wells for each animal, 2000 cells/well, donor age in years; young males (6.34–7.4), n = 5, old males (14.5–14.8), n = 4, young females (4.3–6.7), n = 3; old females (14.4–15.9), n = 5, *p < 0.05 vs young male or female donors, #p < 0.05 vs untreated cells of male or young donors, øp < 0.05 vs untreated cells of female or old donors
Fig. 4.
Linear regression of baboon fibroblast proliferation rate in response to H2O2 against chronological age. Passage 4 fibroblast proliferation rate in the presence of 50- and 100-µM H2O2 challenge fell with age in males (50 µM; r = − 0.36, p = 0.039; 100 µM; r = − 0.42, p = 0.030) but not females (r = − 0.05 and − 0.16 for 50- and 100-µM H2O2, respectively, p > 0.05). Proliferation rate was determined by the slope of the IncuCyte time-course cell confluence graph between 78 and 144 h following 2-h H2O2 challenge. Black circles represent individual males, while white circles are for individual females. Solid line refers to linear regression for males and dashed line for females. Data are from triplicate measurements and expressed as mean ± SEM. Donor age: males, 6.4–21.3 years; females, 4.30–15.9 years; n = 11/sex
Effect of a paraquat challenge on fibroblast proliferation
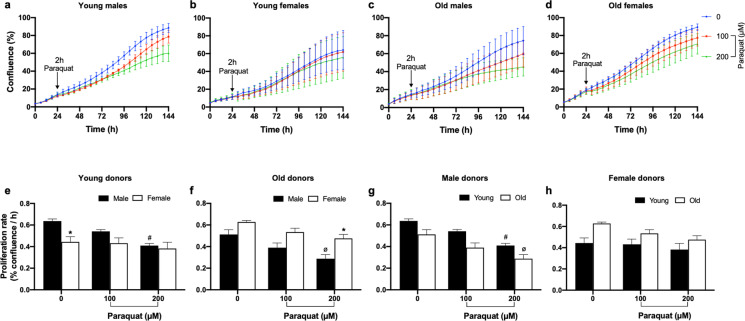
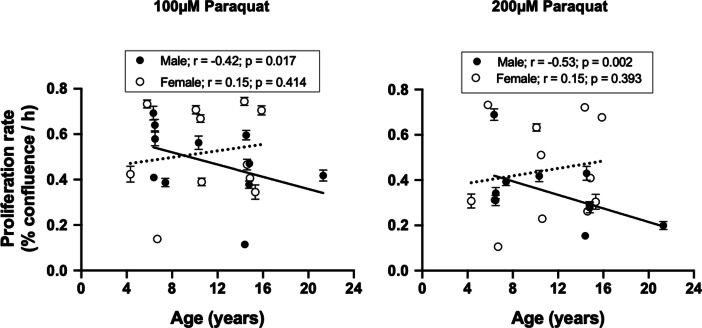
To determine the effect of an alternative source of OS, paraquat, on baboon fibroblast proliferation rate, we used a similar protocol as above wherein passage 4 cells were challenged with 100- and 200-µM paraquat for 2 h. Paraquat inhibited cell proliferation in a concentration-dependent manner in both young and old males with a greater effect from 200 µM (Fig. 5). Fibroblasts derived from female donors of both age were resilient to paraquat challenge at the two concentrations tested. The sex difference in fibroblast proliferation rate in response to paraquat was prominent in the older baboons, where older males exhibited a significant decrease in proliferation rate in the presence of paraquat challenge (200 µM) compared to older females (Fig. 5f). Across the life course, age-dependent decrease in proliferation rate following paraquat challenge was seen in males but not in females (Fig. 6).
Fig. 5.
Effect of paraquat on baboon fibroblast proliferation at passage 4. a–d Cell proliferation time-course graph of fibroblasts challenged with paraquat (PQ) for 2 h. Red and green lines represent cell confluence (%) in fibroblasts challenged with 100- and 200-µM PQ, respectively. Untreated cells are represented by the blue line. Arrow points to the commencement of PQ challenge in fibroblasts derived from young and old baboon of both sexes. Cell confluence kinetics were determined with the IncuCyte live-cell imaging system housed within a standard cell culture incubator. e–h Fibroblast proliferation rate (% confluence/h) calculated using the slope of the time-course graph between 30 and 144 h after PQ challenge. Proliferation rate was analyzed using two-way ANOVA. The inhibitory effects of PQ were concentration-dependent, particularly in male donors. Data expressed as mean ± SEM, each data point represents 3 replicate wells for each animal, 2000 cells/well, donor age in years; young males (6.4–7.4), n = 5, old males (14.5–14.8), n = 4, young females (4.3–6.7), n = 3; old females (14.4–15.9), n = 5, *p < 0.05 vs young or old male donors, #p < 0.05 vs untreated cells of young male donors, øp < 0.05 vs untreated cells of old male donors
Fig. 6.
Association between donor age and baboon fibroblast proliferation rate in response to paraquat challenge. Passage 4 cells were challenged with paraquat (100 and 200 µM) for 2 h. Proliferation rate was determined by the slope of the IncuCyte time-course cell confluence graph between 30 and 144 h following paraquat challenge. A negative relationship was observed between donor age and proliferation rate in response to paraquat challenge in male baboons (100 µM; r = − 0.42, p = 0.017; 200 µM; r = − 0.53, p = 0.002) but not females (r = 015 for both 100 and 200 µM paraquat, p > 0.05). Black circles represent individual males, while white circles are for individual females. Solid line refers to linear regression for males and dashed line for females. Data are from triplicate measurements and expressed as mean ± SEM. Donor age: males, 6.4–21.3 years; females, 4.3–15.9 years; n = 11/sex
Effect of a thapsigargin challenge on fibroblast proliferation
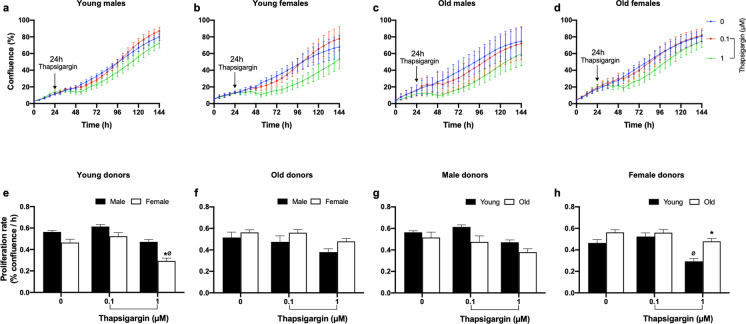
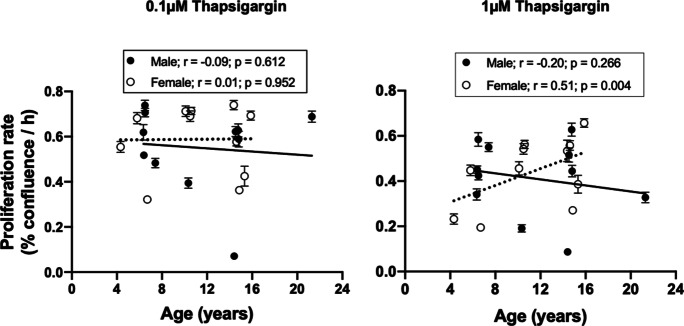
A slight modification to this protocol was required to test the effect of thapsigargin, an inducer of endoplasmic reticulum stress. Fibroblast cultures at passage 4 were challenged with 0.1- and 1-µM thapsigargin either for 2 or 24 h. The inhibitory effects of thapsigargin on cell proliferation were dependent on challenge duration and thapsigargin concentration. A 2-h thapsigargin challenge was not sufficient to inhibit cell proliferation (data not shown). Similarly, 0.1-µM thapsigargin challenge for 24 h did not affect the proliferation of cultured fibroblasts. With 24-h treatment of 1-µM thapsigargin, proliferation rate was reduced in cells from young females compared to young males (Fig. 7e), but no difference was observed in fibroblasts from old donors when both sexes were compared (Fig. 7f). Using two-way ANOVA, there were no differences in proliferation response of young and old male-derived fibroblasts to the thapsigargin challenge (Fig. 7g), but older females exhibited greater resilience to a 24-h thapsigargin challenge than their younger counterparts (Fig. 7h). These data obtained by ANOVA for categorical age group analysis were similar to life-course evaluation of proliferation rate by linear regression, where a significant positive relationship between donor age and thapsigargin-induced proliferation rate was observed in females but no relationship was observed in males (Fig. 8).
Fig. 7.
Effect of thapsigargin on baboon fibroblast proliferation rate at passage 4. a–d Time-course graph for the effect of thapsigargin on cell confluence (%) of fibroblasts derived from young and old baboons of both sexes. Cells were challenged with 0.1- and 1-µM thapsigargin for 24 h and changes in cell confluence were determined real time using the IncuCyte live-cell imaging system housed within a standard cell culture incubator. Arrow indicates the commencement of thapsigargin challenge. The blue line represents untreated cells (designated as 0); red and green lines represent cells challenged with 0.1- and 1-µM thapsigargin, respectively. e–h Proliferation rate (% confluence/h) calculated from the slope of the time-course graph between 60 and 144 h following thapsigargin challenge and analyzed using two-way ANOVA. Proliferation rate of young female baboon-derived fibroblasts was significantly inhibited by 1-µM thapsigargin challenge compared to that of young males and old females. Data expressed as mean ± SEM, each data point represents 3 replicate wells for each animal, 2000 cells/well, donor age in years; young males (6.34–7.4), n = 5, old males (14.5–14.8), n = 4, young females (4.3–6.7), n = 3; old females (14.4–15.9), n = 5, *p < 0.05 vs young male or female donors, øp < 0.05 vs untreated cells of young female donors
Fig. 8.
Relationship between donor age and baboon fibroblast proliferation rate in response to thapsigargin challenge. Passage 4 cells were challenged with 0.1- and 1-µM thapsigargin for 24 h. Proliferation rate was determined by the slope of the IncuCyte time-course cell confluence graph between 60 and 144 h following thapsigargin challenge. Thapsigargin (1 µM) significantly inhibited the proliferation of fibroblasts derived from younger female baboons without affecting older females resulting in a positive relationship between donor age and proliferation rate (r = 0.51; p = 0.004). Black circles represent individual males, while white circles are for individual females. Solid line refers to linear regression for males and dashed line for females. Data are from triplicate measurements and expressed as mean ± SEM. Donor age: males, 6.4–21.3 years; females, 4.3–15.9 years
Effect of a dexamethasone challenge on fibroblast proliferation
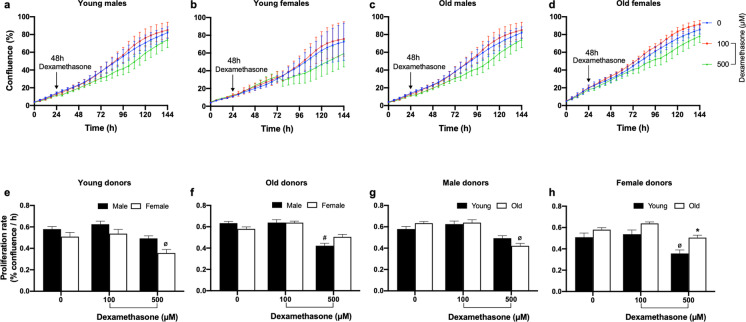
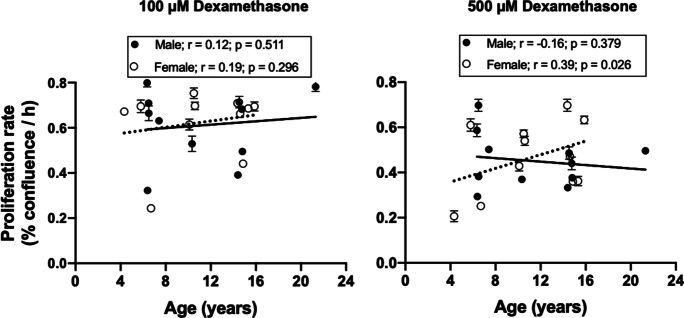
Passage 5 fibroblast cultures were challenged with the synthetic glucocorticoid dexamethasone at 100- and 500-µM concentrations for 48 h. A shorter challenge duration of 24 h did not elicit any significant effect on cell proliferation (data not shown), which may be related to membrane permeability of baboon fibroblasts as reported for dexamethasone uptake in murine thymoma cells [31]. At 100 µM, dexamethasone did not influence cell proliferation in any of the age groups of both sexes (Fig. 9). However, fibroblasts derived from young females exhibited reduced proliferation rate in response to 500-µM dexamethasone challenge, whereas older females were not affected. In old males, dexamethasone (500 µM) decreased cell proliferation rate relative to untreated cells but did not affect fibroblasts derived from young male baboons. When dexamethasone (500 µM) effects were assessed across the life course, a positive relationship was observed between donor age and dexamethasone-induced proliferation rate in female-derived fibroblasts (Fig. 10).
Fig. 9.
Dexamethasone effect on proliferation of baboon fibroblasts at passage 5. a–d Kinetic profile of fibroblast cell confluence (%) in response to 48-h dexamethasone (Dex, 100 and 500 µM) challenge. Untreated cells are represented by blue line, while red and green lines represent cells challenged with 100- and 500-µM Dex, respectively. Arrow points to commencement of Dex challenge and changes in cell confluence were determined with the IncuCyte live-cell imaging system. e–h Baboon fibroblast proliferation rate (% confluence/h) calculated from the slope of the time-course graph between 78 and 144 h after 48-h Dex challenge. Proliferation rate was analyzed using two-way ANOVA. Fibroblasts derived from young female baboons exhibited decreased proliferation rate in the presence of 500-µM Dex challenge compared to fibroblasts from old females. Similarly, older males had reduced proliferation rate in response to 500-µM Dex challenge, whereas young males were not affected. Data expressed as mean ± SEM, each data point represents 3 replicate wells of each animal, 2000 cells/well, donor age in years; young males (6.34–7.4), n = 5, old males (14.5–14.8), n = 4, young females (4.3–6.7), n = 3; old females (14.4–15.9), n = 5, *p < 0.05 vs young female donors, #p < 0.05 vs untreated cells of old male donors, øp < 0.05 vs untreated cells of young male or female donors
Fig. 10.
Relationship between donor age and baboon fibroblast proliferation rate in response to dexamethasone challenge. Passage 5 cells were challenged with dexamethasone (100 and 500 µM) for 48 h. Proliferation rate was determined in a time-course measurement of cell confluence between 78 and 144 h following dexamethasone challenge. Dex (500 µM) significantly inhibited the proliferation of fibroblast derived from younger female baboons without affecting the older females, leading to a positive relationship between donor age and proliferation rate (r = 0.39, p = 0.026). Black circles represent male data, while white circles are for female data. Solid line refers to linear regression for males and dash line for females. Data are from triplicate measurements and expressed as mean ± SEM. Donor age: males, 6.4–21.3 years; females, 4.3–15.9 years
Proliferation of baboon fibroblasts in low glucose culture media
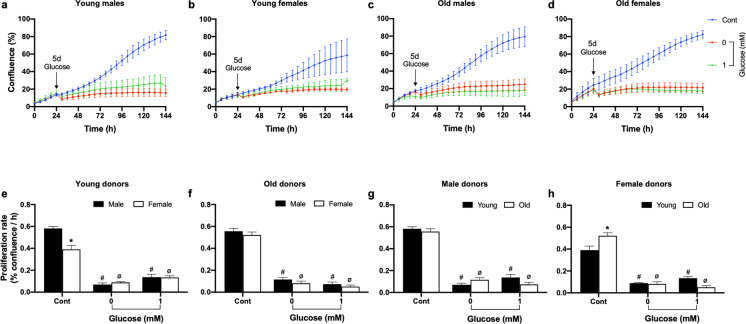
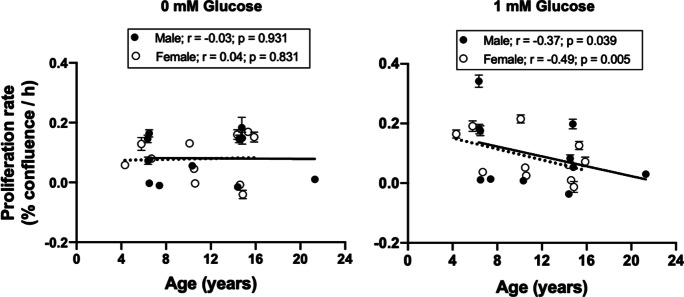
Complete withdrawal of glucose from culture media (0 mM) inhibited proliferation of passage 6 fibroblasts regardless of donor age and sex. In a similar manner, there were no differences by categorical age or sex in proliferation response to the 1-mM glucose challenge when data were analyzed by two-way ANOVA (Fig. 11). Across the life course, there was no relationship between donor age and fibroblast proliferation rate in response to 0-mM glucose challenge; however, cell proliferation rate in the presence of 1-mM glucose fell with age in both sexes indicating a potential greater energy requirement for cell proliferation in cells from older animals (Fig. 12).
Fig. 11.
Effect of low glucose on baboon fibroblast proliferation at passage 5. a–d Time-course graph of baboon fibroblast cell confluence (%) in response to glucose deprivation and low glucose concentration (1 mM). Arrow points to the commencement of glucose challenge for 5 days in fibroblasts derived from young and old baboon of both sexes. Unchallenged cells are represented by a blue line, while red and green lines represent cells challenged with 0- and 1-mM glucose, respectively. Fibroblasts cell confluence was determined with the IncuCyte live-cell imaging system. e–h Proliferation rate (% confluence/h) calculated from the slope of the corresponding time-course graph during glucose challenge between 30 and 144 h. Proliferation rate was analyzed using two-way ANOVA. Glucose deprivation (0-mM glucose) and 1-mM glucose inhibited cell proliferation rate without age and sex differences. Data expressed as mean ± SEM, each data point represents 3 replicate wells, 2000 cells/well, donor age in years; young males (6.34–7.4), n = 5, old males (14.5–14.8), n = 4, young females (4.3–6.7), n = 3; old females (14.4–15.9), n = 5, *p < 0.05 vs young male or female donors, #p < 0.05 vs untreated cells of male or young donors, øp < 0.05 vs untreated cells of female or old donors
Fig. 12.
Linear regression analysis of baboon fibroblast proliferation rate in response to low glucose environment and donor age. Passage 6 cells were challenged with 0- and 1-µM glucose for 5 d. Fibroblast proliferation rate was determined by the slope of the IncuCyte time-course cell confluence graph following the glucose challenge. There was a negative relationship between donor age and proliferation rate of male and female fibroblasts in response to 1-mM glucose (male; r = − 0.37, p = 0.039, female; r = − 0.49, p = 0.005) but no relationship was observed in response to 0 mM glucose (male; r = − 0.03, female; r = 0.04, p > 0.05). Black circles represent individual males while white circles are for individual females. Solid line refers to linear regression for males and dashed line for females. Data are from triplicate measurements and expressed as mean ± SEM. Donor age: males, 6.4–21.3 years; females, 4.3–15.9 years
Discussion
Several factors, including cost, resources, and ethical considerations, often limit the use of primates in aging research despite its huge translational potential. To potentially address such limitations, we used primary cells (fibroblasts) isolated through minimally invasive means from the skin of baboons as a nonhuman primate cellular model to characterize proliferation responses to challenges similar to those faced during aging. Fibroblasts are useful in measuring cellular homeostasis during aging because they retain at least some of the functional characteristics of the animals they are derived from, even after repeated subculturing [32]. Moreover, primary cell cultures can be generated multiple times from the same donor for longitudinal studies and can be exploited to test dynamic processes unlike the case with tissue collection from euthanized animals. Primary fibroblasts exhibit different characteristics in culture relative to donor age, including age-related decline in colony size distribution and cell replication rate as well as early onset of cellular senescence in fibroblasts derived from old donors [33, 34]. The negative relationship between fibroblast proliferation and donor age highlights the intrinsic effects on cells that are caused by aging such as diminished cell growth. In contrast to these previous studies, we found no significant effect of age on cell growth or population doubling time at early passages during cell culture. The contrast in findings aligns with existing controversy on the relationship between primary fibroblasts proliferative potential and donor age. In one Baltimore longitudinal aging study, no significant correlation was found between fibroblast proliferative potential and donor age, even when cell lines from the same donors at different ages were considered [35]. When colony size distribution was used as a measure of proliferative potential in the same study, a significant decline in proliferative potential with donor age was observed in fibroblasts derived from female and not male donors [36]. Confounding issues such as experimental design, donor’s health status and variation in biopsy collection site, among others, may influence the relationship between fibroblast proliferation and donor age. Moreover, these differences spurred our interest in testing whether continuous assessment of cell growth parameters through live-cell imaging might resolve some of these issues.
We combined the ability to monitor cell proliferation in real time with testing various stress-related compounds to offer a guide for future experimental designs related to understanding aging mechanisms. Cell confluence metrics generated by the IncuCyte can be used as a phenotypic determinant of significant effects on the regulatory processes involved in cell growth, i.e., metabolism, transcription, translation, etc. The ability to monitor cell proliferation in real time is an attractive alternative to traditional methods of determining cell proliferation. Here, we characterized cell seeding density of 2000 cells per well of a 96-well plate as suitable cell density for baboon fibroblast cellular proliferation assays requiring up to 5 days in culture. In a preliminary comparative experiment, we discovered that mouse fibroblast required a much lesser seeding density (250 cells per well) for a similar proliferation assay (data not shown), demonstrating that fibroblasts derived from baboons proliferate at a slower rate compared to that obtained from mice. Despite the advantages of this method, further extrapolation using other cellular studies is required to determine the explicit molecular changes caused by exposure to these challenges that cause the reduction in cell proliferation that we report. A limitation of this study is that we did not verify whether endpoint cell number directly corresponds to the cell confluence data generated after challenging cells. However, as described above, we report on proliferation rate derived from percent confluence per hour and thus are able to provide a longitudinal time-course measurement to ascertain cellular proliferation response which we view as more a measure of resilience than is endpoint data.
One of our primary findings is identification of age- and sex-specific effects in cellular proliferation responses to oxidative challenges. It is well established that cellular resistance to stressors declines with age because the intrinsic cellular repair and recovery mechanisms are altered by the aging process [37]. The decline in proliferation rate with age in response to H2O2 and paraquat challenges was only observed in male baboon fibroblasts which indicates that sex-related factors influence cellular resilience. For captive baboons at the Southwest National Primate Research Center (SNPRC) where our animals are maintained, the average lifespan is about 21 years and the rate of adult mortality is slightly lower in female baboons compared to males [38]. The sex differences in cellular proliferation responses to oxidative challenges may be another confirmation that this cellular model retains the sex-related functional characteristic of the animal they are derived from. The antioxidant properties of the female sex hormone—estrogen—are believed to promote longevity in most mammalian females over males [39]. Estrogen confers higher mitochondrial antioxidant defense mechanism, resulting in lesser oxidative damage to mitochondrial DNA in female rats compared to males [40]. Similarly in humans, there is increased generation of oxidative stress in men in relation to women [41]. The female-biased expression of X-linked genes involved in the regulation of autophagy, redox state, and apoptosis also supports stress resistance in females [42]. Because our culturing procedures for male- and female-derived cells are identical, i.e., there is no difference in estrogen in culture media, any sex-specific effects are likely to be genetic or epigenetic and caused by the specific sexual environment of the donor. Taken together, our finding lends support to the phenomenon of female aging advantage. Relatedly, the inhibitory effects of thapsigargin challenge (1 µM) were also age and sex dependent, but not in the same pattern as oxidative challenge. Young females were vulnerable to thapsigargin-induced ER stress, while young males and old females were not affected. The life-course data in the female support age-related susceptibility to ER stress in contrast to males that were not responsive to thapsigargin. The factors that confer these age- and sex-specific differences are not known and the significance of these observations requires further studies.
H2O2 is a nonradical ROS that induces cellular damage in a concentration- and time-dependent manner. In our assay, it is clear there is a narrow range of effectiveness between doses that impair (50 µM) and those that block cell proliferation (100 µM). The complete arrest of cell proliferation at this higher concentration parallels induction of cell cycle arrest for DNA repair [43], initiation of cellular senescence [44], or H2O2-induced cell death [45]. A lower concentration of H2O2 (50 µM) mildly inhibited cell proliferation and viewed as more appropriate for cellular resilience studies on baboon fibroblasts. Paraquat is another inducer of oxidative stress that exhibited a similar male-specific effect as H2O2 on cell proliferation. The similarity suggests a consistent pattern in cellular proliferation responses to oxidative stressors in this cellular model. The cytostatic actions of thapsigargin may be related to alteration in protein and calcium homeostasis. By blocking the ER Ca2+ pump, thapsigargin causes protein aggregation and enhances entry of extracellular calcium into the cell leading to apoptosis [7, 46]. We note that the effects of thapsigargin were dependent on challenge duration (2 vs 24 h) and concentration (0.1 and 1µ M), a finding that is consistent with the inhibitory effects of thapsigargin on human synovial cells [47].
GCs are main effectors of the neuroendocrine stress axis that act upon multiple hallmarks of the aging process including regulation of oxidative stress, mitochondrial function, and cellular growth and development [48, 49]. Due to the bimodal actions of GCs [50], they are beneficial to cellular function at low concentrations but detrimental at high concentrations. Admittedly, the concentrations of dexamethasone used were beyond the physiologic range, but the premise of this work was to identify dexamethasone concentrations that would be useful for cellular resiliency studies. Characterizing the rate of dexamethasone uptake across baboon fibroblasts may be useful in deciphering time- and concentration-dependent effects of dexamethasone observed in this study. On all the cell lines tested, dexamethasone concentration as high as 100 µM did not affect cell proliferation, neither was lower concentrations in the physiologic range of any effect (data not shown). Determining glucocorticoid receptor distribution is an important step in ascertaining the responsiveness or resistance of these cell lines to dexamethasone. At 500 µM, dexamethasone significantly inhibited the proliferation of fibroblast derived from younger female baboons without affecting the older females, leading to a positive relationship between aging and proliferation rate in response to dexamethasone challenge in female-derived fibroblasts, whereas males exhibited similar responses to dexamethasone challenge across the life course. These data indicate a divergent, sex-specific response to dexamethasone. Both in vitro and in vivo studies have demonstrated that high GC concentrations increase ROS production, with a corresponding inhibition of antioxidant defenses [48, 51]. At the cellular level, enhanced GR signaling sensitizes cells to oxidative stress by inhibiting antioxidant genes that mitigate oxidative damage [52]. Thus, one would expect that the life-course response to GC would follow the pattern of OS challenge if there were any nexus in the recruited pathways, but no such uniformity was found. A direct determination of OS markers following GC challenge would be required for any life-course interaction.
There were no sex differences in the cellular response to either of the glucose concentrations tested. An age-dependent effect was however observed in response to 1-mM glucose challenge where cell proliferation decreased with age. In contrast, glucose deprivation abolished cell growth across all age groups. It has been established that old cells consume more glucose than young cells, and exhibit increased dependence on glycolysis [53]. The age-related response of baboon fibroblasts to low glucose may be associated with the metabolic demands of the older cell lines, where more glucose is required for maintenance of cellular metabolism.
Given the scope of this study, we did not further characterize the induction of cellular senescence following stress exposure. It is well known that stressors like H2O2 induce premature senescence in a time- and concentration-dependent manner [44, 54]. Due to the importance of cellular senescence in the outcomes of aging, it will be important to clarify this important cellular characteristic in our baboon cohort, including any potential sex-related differences. It is of interest to note that we have maintained some cell lines tested here through passage 37 with evidence of increased cellular senescence in the form of altered cell size and phenotype.
Overall, we demonstrate that with advancing age, fibroblasts derived from female baboons were less impacted by oxidative stress compared to males, but younger females were susceptible to glucocorticoid stress in relation to older females. These differential responses mediated by donor age and sex warrant further investigations.
Supplementary Information
Below is the link to the electronic supplementary material.
Funding
This research was funded in part by R01 AG050797 and R01 AG057431 (ABS) and the Geriatric Research, Education and Clinical Center of the South Texas Veterans Health Care System. This material is the result of work supported with resources and the use of facilities at South Texas Veterans Health Care System, San Antonio, Texas. The contents do not represent the views of the U.S. Department of Veterans Affairs or the United States Government. Baboons in this study were maintained under 1U19AG057758-01A1 (PWN). The authors acknowledge the administrative and technical support of Karen Moore and Yuhong Liu. We also acknowledge support from the SNPRC which is funded by P51 OD011133.
Footnotes
Publisher's Note
Springer Nature remains neutral with regard to jurisdictional claims in published maps and institutional affiliations.
References
- 1.Lopez-Otin C, Blasco MA, Partridge L, Serrano M, Kroemer G. The hallmarks of aging. Cell. 2013;153(6):1194–1217. doi: 10.1016/j.cell.2013.05.039. [DOI] [PMC free article] [PubMed] [Google Scholar]
- 2.Sapolsky R, Armanini M, Packan D, Tombaugh G. Stress and glucocorticoids in aging. Endocrinol Metab Clin North Am. 1987;16(4):965–980. doi: 10.1016/S0889-8529(18)30453-5. [DOI] [PubMed] [Google Scholar]
- 3.Rubin H. Cell aging in vivo and in vitro. Mech Ageing Dev. 1997;98(1):1–35. doi: 10.1016/s0047-6374(97)00067-5. [DOI] [PubMed] [Google Scholar]
- 4.Park WH. The effects of exogenous H2O2 on cell death, reactive oxygen species and glutathione levels in calf pulmonary artery and human umbilical vein endothelial cells. Int J Mol Med. 2013;31(2):471–476. doi: 10.3892/ijmm.2012.1215. [DOI] [PubMed] [Google Scholar]
- 5.Lytton J, Westlin M, Hanley MR. Thapsigargin inhibits the sarcoplasmic or endoplasmic reticulum Ca-ATPase family of calcium pumps. J Biol Chem. 1991;266(26):17067–17071. doi: 10.1016/S0021-9258(19)47340-7. [DOI] [PubMed] [Google Scholar]
- 6.Mekahli D, Bultynck G, Parys JB, De Smedt H, Missiaen L. Endoplasmic-reticulum calcium depletion and disease. Cold Spring Harb Perspect Biol. 2011;3(6):a004317. doi: 10.1101/cshperspect.a004317. [DOI] [PMC free article] [PubMed] [Google Scholar]
- 7.Szegezdi E, Logue SE, Gorman AM, Samali A. Mediators of endoplasmic reticulum stress-induced apoptosis. EMBO Rep. 2006;7(9):880–885. doi: 10.1038/sj.embor.7400779. [DOI] [PMC free article] [PubMed] [Google Scholar]
- 8.Ben-Zvi A, Miller EA, Morimoto RI. Collapse of proteostasis represents an early molecular event in Caenorhabditis elegans aging. Proc Natl Acad Sci U S A. 2009;106(35):14914–14919. doi: 10.1073/pnas.0902882106. [DOI] [PMC free article] [PubMed] [Google Scholar]
- 9.DiLoreto R, Murphy CT. The cell biology of aging. Mol Biol Cell. 2015;26(25):4524–4531. doi: 10.1091/mbc.E14-06-1084. [DOI] [PMC free article] [PubMed] [Google Scholar]
- 10.Wang J, Alexanian A, Ying R, Kizhakekuttu TJ, Dharmashankar K, Vasquez-Vivar J, et al. Acute exposure to low glucose rapidly induces endothelial dysfunction and mitochondrial oxidative stress: role for AMP kinase. Arterioscler Thromb Vasc Biol. 2012;32(3):712–720. doi: 10.1161/ATVBAHA.111.227389. [DOI] [PMC free article] [PubMed] [Google Scholar]
- 11.Maier PJ, Zemoura K, Acuna MA, Yevenes GE, Zeilhofer HU, Benke D. Ischemia-like oxygen and glucose deprivation mediates down-regulation of cell surface gamma-aminobutyric acidB receptors via the endoplasmic reticulum (ER) stress-induced transcription factor CCAAT/enhancer-binding protein (C/EBP)-homologous protein (CHOP) J Biol Chem. 2014;289(18):12896–12907. doi: 10.1074/jbc.M114.550517. [DOI] [PMC free article] [PubMed] [Google Scholar]
- 12.Redzic ZB, Malatiali SA, Al-Bader M, Al-Sarraf H. Effects of hypoxia, glucose deprivation and recovery on the expression of nucleoside transporters and adenosine uptake in primary culture of rat cortical astrocytes. Neurochem Res. 2010;35(9):1434–1444. doi: 10.1007/s11064-010-0203-6. [DOI] [PubMed] [Google Scholar]
- 13.Graham NA, Tahmasian M, Kohli B, Komisopoulou E, Zhu M, Vivanco I, et al. Glucose deprivation activates a metabolic and signaling amplification loop leading to cell death. Mol Syst Biol. 2012;8:589. doi: 10.1038/msb.2012.20. [DOI] [PMC free article] [PubMed] [Google Scholar]
- 14.Vander Heiden MG, Plas DR, Rathmell JC, Fox CJ, Harris MH, Thompson CB. Growth factors can influence cell growth and survival through effects on glucose metabolism. Mol Cell Biol. 2001;21(17):5899–5912. doi: 10.1128/mcb.21.17.5899-5912.2001. [DOI] [PMC free article] [PubMed] [Google Scholar]
- 15.van den Beld AW, Kaufman JM, Zillikens MC, Lamberts SWJ, Egan JM, van der Lely AJ. The physiology of endocrine systems with ageing. Lancet Diabetes Endocrinol. 2018;6(8):647–658. doi: 10.1016/S2213-8587(18)30026-3. [DOI] [PMC free article] [PubMed] [Google Scholar]
- 16.Nathanielsz PW, Huber HF, Li C, Clarke GD, Kuo AH, Zambrano E. The nonhuman primate hypothalamo-pituitary-adrenal axis is an orchestrator of programming-aging interactions: role of nutrition. Nutr Rev. 2020;78(Supplement_2):48–61. doi: 10.1093/nutrit/nuaa018. [DOI] [PMC free article] [PubMed] [Google Scholar]
- 17.Zhao ZY, Lu FH, Xie Y, Fu YR, Bogdan A, Touitou Y. Cortisol secretion in the elderly. Influence of age, sex and cardiovascular disease in a Chinese population. Steroids. 2003;68(6):551–5. doi: 10.1016/s0039-128x(03)00083-7. [DOI] [PubMed] [Google Scholar]
- 18.Yang S, Gerow KG, Huber HF, Considine MM, Li C, Mattern V, et al. A decline in female baboon hypothalamo-pituitary-adrenal axis activity anticipates aging. Aging (Albany NY) 2017;9(5):1375–1385. doi: 10.18632/aging.101235. [DOI] [PMC free article] [PubMed] [Google Scholar]
- 19.Zambrano E, Reyes-Castro LA, Nathanielsz PW. Aging, glucocorticoids and developmental programming. Age (Dordr) 2015;37(3):9774. doi: 10.1007/s11357-015-9774-0. [DOI] [PMC free article] [PubMed] [Google Scholar]
- 20.Mawal-Dewan M, Frisoni L, Cristofalo VJ, Sell C. Extension of replicative lifespan in WI-38 human fibroblasts by dexamethasone treatment is accompanied by suppression of p21 Waf1/Cip1/Sdi1 levels. Exp Cell Res. 2003;285(1):91–98. doi: 10.1016/s0014-4827(03)00013-2. [DOI] [PubMed] [Google Scholar]
- 21.Spiers JG, Chen HJ, Sernia C, Lavidis NA. Activation of the hypothalamic-pituitary-adrenal stress axis induces cellular oxidative stress. Front Neurosci. 2014;8:456. doi: 10.3389/fnins.2014.00456. [DOI] [PMC free article] [PubMed] [Google Scholar]
- 22.Pham-Huy LA, He H, Pham-Huy C. Free radicals, antioxidants in disease and health. Int J Biomed Sci. 2008;4(2):89–96. [PMC free article] [PubMed] [Google Scholar]
- 23.Valerie K, Povirk LF. Regulation and mechanisms of mammalian double-strand break repair. Oncogene. 2003;22(37):5792–5812. doi: 10.1038/sj.onc.1206679. [DOI] [PubMed] [Google Scholar]
- 24.Taylor RC. Aging and the UPR(ER) Brain Res. 2016;1648(Pt B):588–593. doi: 10.1016/j.brainres.2016.04.017. [DOI] [PubMed] [Google Scholar]
- 25.Bruggisser R, von Daeniken K, Jundt G, Schaffner W, Tullberg-Reinert H. Interference of plant extracts, phytoestrogens and antioxidants with the MTT tetrazolium assay. Planta Med. 2002;68(5):445–448. doi: 10.1055/s-2002-32073. [DOI] [PubMed] [Google Scholar]
- 26.Vistica DT, Skehan P, Scudiero D, Monks A, Pittman A, Boyd MR. Tetrazolium-based assays for cellular viability: a critical examination of selected parameters affecting formazan production. Cancer Res. 1991;51(10):2515–2520. [PubMed] [Google Scholar]
- 27.Wang P, Henning SM, Heber D. Limitations of MTT and MTS-based assays for measurement of antiproliferative activity of green tea polyphenols. PLoS ONE. 2010;5(4):e10202. doi: 10.1371/journal.pone.0010202. [DOI] [PMC free article] [PubMed] [Google Scholar]
- 28.Schlabritz-Loutsevitch NE, Howell K, Rice K, Glover EJ, Nevill CH, Jenkins SL, et al. Development of a system for individual feeding of baboons maintained in an outdoor group social environment. J Med Primatol. 2004;33(3):117–126. doi: 10.1111/j.1600-0684.2004.00067.x. [DOI] [PubMed] [Google Scholar]
- 29.Salmon AB, Murakami S, Bartke A, Kopchick J, Yasumura K, Miller RA. Fibroblast cell lines from young adult mice of long-lived mutant strains are resistant to multiple forms of stress. Am J Physiol Endocrinol Metab. 2005;289(1):E23–E29. doi: 10.1152/ajpendo.00575.2004. [DOI] [PubMed] [Google Scholar]
- 30.Salmon AB, Sadighi Akha AA, Buffenstein R, Miller RA. Fibroblasts from naked mole-rats are resistant to multiple forms of cell injury, but sensitive to peroxide, ultraviolet light, and endoplasmic reticulum stress. J Gerontol A Biol Sci Med Sci. 2008;63(3):232–241. doi: 10.1093/gerona/63.3.232. [DOI] [PMC free article] [PubMed] [Google Scholar]
- 31.Johnson DM, Newby RF, Bourgeois S. Membrane permeability as a determinant of dexamethasone resistance in murine thymoma cells. Cancer Res. 1984;44(6):2435–2440. [PubMed] [Google Scholar]
- 32.Salmon AB, Dorigatti J, Huber HF, Li C, Nathanielsz PW. Maternal nutrient restriction in baboon programs later-life cellular growth and respiration of cultured skin fibroblasts: a potential model for the study of aging-programming interactions. Geroscience. 2018;40(3):269–278. doi: 10.1007/s11357-018-0024-0. [DOI] [PMC free article] [PubMed] [Google Scholar]
- 33.Smith JR, Pereira-Smith OM, Schneider EL. Colony size distributions as a measure of in vivo and in vitro aging. Proc Natl Acad Sci U S A. 1978;75(3):1353–1356. doi: 10.1073/pnas.75.3.1353. [DOI] [PMC free article] [PubMed] [Google Scholar]
- 34.Schneider EL, Mitsui Y. The relationship between in vitro cellular aging and in vivo human age. Proc Natl Acad Sci U S A. 1976;73(10):3584–3588. doi: 10.1073/pnas.73.10.3584. [DOI] [PMC free article] [PubMed] [Google Scholar]
- 35.Cristofalo VJ, Allen RG, Pignolo RJ, Martin BG, Beck JC. Relationship between donor age and the replicative lifespan of human cells in culture: a reevaluation. Proc Natl Acad Sci U S A. 1998;95(18):10614–10619. doi: 10.1073/pnas.95.18.10614. [DOI] [PMC free article] [PubMed] [Google Scholar]
- 36.Smith JR, Venable S, Roberts TW, Metter EJ, Monticone R, Schneider EL. Relationship between in vivo age and in vitro aging: assessment of 669 cell cultures derived from members of the Baltimore Longitudinal Study of Aging. J Gerontol A Biol Sci Med Sci. 2002;57(6):B239–B246. doi: 10.1093/gerona/57.6.b239. [DOI] [PubMed] [Google Scholar]
- 37.Smirnova L, Harris G, Leist M, Hartung T. Cellular resilience. Altex. 2015;32(4):247–260. doi: 10.14573/altex.1509271. [DOI] [PubMed] [Google Scholar]
- 38.Bronikowski AM, Alberts SC, Altmann J, Packer C, Carey KD, Tatar M. The aging baboon: comparative demography in a non-human primate. Proc Natl Acad Sci U S A. 2002;99(14):9591–9595. doi: 10.1073/pnas.142675599. [DOI] [PMC free article] [PubMed] [Google Scholar]
- 39.Stice JP, Lee JS, Pechenino AS, Knowlton AA. Estrogen, aging and the cardiovascular system. Future Cardiol. 2009;5(1):93–103. doi: 10.2217/14796678.5.1.93. [DOI] [PMC free article] [PubMed] [Google Scholar]
- 40.Borras C, Gambini J, Vina J. Mitochondrial oxidant generation is involved in determining why females live longer than males. Front Biosci. 2007;12:1008–1013. doi: 10.2741/2120. [DOI] [PubMed] [Google Scholar]
- 41.Tenkorang MA, Snyder B, Cunningham RL. Sex-related differences in oxidative stress and neurodegeneration. Steroids. 2018;133:21–27. doi: 10.1016/j.steroids.2017.12.010. [DOI] [PMC free article] [PubMed] [Google Scholar]
- 42.Tower J, Pomatto LCD, Davies KJA. Sex differences in the response to oxidative and proteolytic stress. Redox Biol. 2020;31:101488. doi: 10.1016/j.redox.2020.101488. [DOI] [PMC free article] [PubMed] [Google Scholar]
- 43.Chao HX, Poovey CE, Privette AA, Grant GD, Chao HY, Cook JG, et al. Orchestration of DNA Damage Checkpoint Dynamics across the Human Cell Cycle. Cell Syst. 2017;5(5):445–59.e5. doi: 10.1016/j.cels.2017.09.015. [DOI] [PMC free article] [PubMed] [Google Scholar]
- 44.Zhou L, Chen X, Liu T, Gong Y, Chen S, Pan G, et al. Melatonin reverses H2 O2 -induced premature senescence in mesenchymal stem cells via the SIRT1-dependent pathway. J Pineal Res. 2015;59(2):190–205. doi: 10.1111/jpi.12250. [DOI] [PMC free article] [PubMed] [Google Scholar]
- 45.Vilema-Enriquez G, Arroyo A, Grijalva M, Amador-Zafra RI, Camacho J. Molecular and Cellular Effects of Hydrogen Peroxide on Human Lung Cancer Cells: Potential Therapeutic Implications. Oxid Med Cell Longev. 2016;2016:1908164. doi: 10.1155/2016/1908164. [DOI] [PMC free article] [PubMed] [Google Scholar]
- 46.Prakriya M, Lewis RS. Store-Operated Calcium Channels. Physiol Rev. 2015;95(4):1383–1436. doi: 10.1152/physrev.00020.2014. [DOI] [PMC free article] [PubMed] [Google Scholar]
- 47.Wang H, Jia XZ, Sui CJ, Zhao YP, Mei YF, Zheng YN, et al. Effects of thapsigargin on the proliferation and survival of human rheumatoid arthritis synovial cells. ScientificWorldJournal. 2014;2014:605416. doi: 10.1155/2014/605416. [DOI] [PMC free article] [PubMed] [Google Scholar]
- 48.Sato H, Takahashi T, Sumitani K, Takatsu H, Urano S. Glucocorticoid Generates ROS to Induce Oxidative Injury in the Hippocampus, Leading to Impairment of Cognitive Function of Rats. J Clin Biochem Nutr. 2010;47(3):224–232. doi: 10.3164/jcbn.10-58. [DOI] [PMC free article] [PubMed] [Google Scholar]
- 49.Sionov RV, Cohen O, Kfir S, Zilberman Y, Yefenof E. Role of mitochondrial glucocorticoid receptor in glucocorticoid-induced apoptosis. J Exp Med. 2006;203(1):189–201. doi: 10.1084/jem.20050433. [DOI] [PMC free article] [PubMed] [Google Scholar]
- 50.Yeager MP, Pioli PA, Guyre PM. Cortisol exerts bi-phasic regulation of inflammation in humans. Dose Response. 2011;9(3):332–347. doi: 10.2203/dose-response.10-013.Yeager. [DOI] [PMC free article] [PubMed] [Google Scholar]
- 51.You JM, Yun SJ, Nam KN, Kang C, Won R, Lee EH. Mechanism of glucocorticoid-induced oxidative stress in rat hippocampal slice cultures. Can J Physiol Pharmacol. 2009;87(6):440–447. doi: 10.1139/y09-027. [DOI] [PubMed] [Google Scholar]
- 52.Alam MM, Okazaki K, Nguyen LTT, Ota N, Kitamura H, Murakami S, et al. Glucocorticoid receptor signaling represses the antioxidant response by inhibiting histone acetylation mediated by the transcriptional activator NRF2. J Biol Chem. 2017;292(18):7519–7530. doi: 10.1074/jbc.M116.773960. [DOI] [PMC free article] [PubMed] [Google Scholar]
- 53.Goldstein S, Ballantyne SR, Robson AL, Moerman EJ. Energy metabolism in cultured human fibroblasts during aging in vitro. J Cell Physiol. 1982;112(3):419–424. doi: 10.1002/jcp.1041120316. [DOI] [PubMed] [Google Scholar]
- 54.Dimozi A, Mavrogonatou E, Sklirou A, Kletsas D. Oxidative stress inhibits the proliferation, induces premature senescence and promotes a catabolic phenotype in human nucleus pulposus intervertebral disc cells. Eur Cell Mater. 2015;30:89–102. doi: 10.22203/ecm.v030a07. [DOI] [PubMed] [Google Scholar]
Associated Data
This section collects any data citations, data availability statements, or supplementary materials included in this article.


