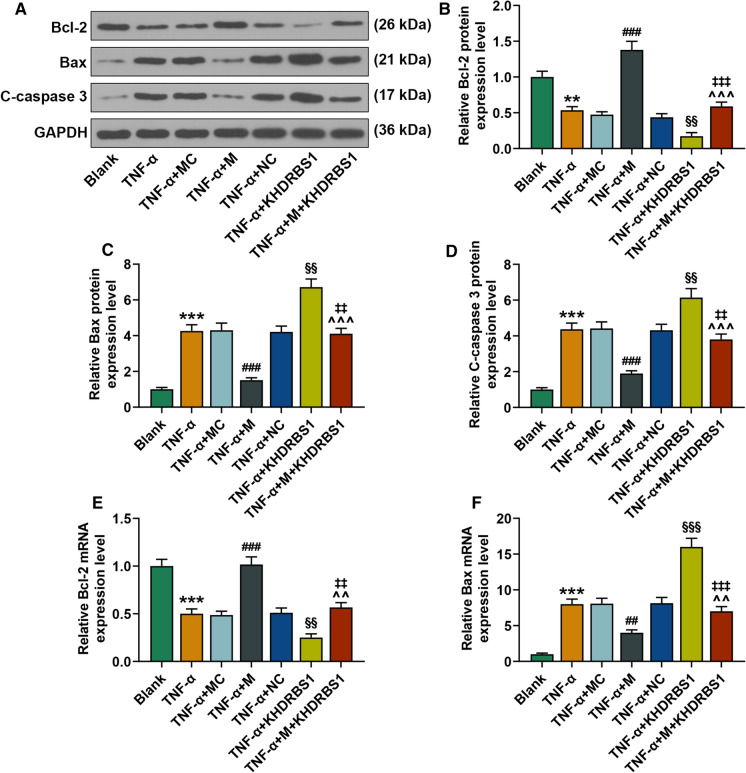
Fig. 5.
The effects of miR-200b-3p and KHDRBS1 on apoptosis-related proteins in vitro. A Western blot analysis of C-Caspase-3, Bcl-2 and Bax expression in each group. B–D The signal intensities of C-Caspase, Bcl-2 and Bax were quantified (n = 3, * vs. Blank; # vs. TNF-α+MC; ^ vs. TNF-α+M; § vs. TNF-α+NC; ‡ vs. TNF-α+KHDRBS1. **P < 0.01; ***P < 0.001; ###P < 0.001; ‡‡P < 0.01; ‡‡‡P < 0.001; ^^^P < 0.001; §§P < 0.01). E and F qRT-PCR analysis of Bcl-2 and Bax expression in each group rats (n = 3, * vs. Blank; # vs. TNF-α+MC; ^ vs. TNF-α+M; § vs. TNF-α+NC; ‡ vs. TNF-α+KHDRBS1. ***P < 0.01; ##P < 0.01; ###P < 0.001; ‡‡P < 0.01; ‡‡‡P < 0.001; ^^P < 0.01). Group: Blank group; TNF-α group; TNF-α+MC group; TNF-α+M group; TNF-α+NC group; TNF-α+KHDRBS1 group; TNF-α+M+KHDRBS1 group. qRT-PCR quantitative reverse transcription polymerase chain reaction, KHDRBS1 KH RNA binding domain containing, signal transduction associated 1, TNF-α tumor necrosis factor-α, Bcl-2 B cell lymphoma/lewkmia-2, Bax Bcl-2 associated X protein

