Abstract
Hepatocellular carcinoma (HCC) continues to cause severe burden worldwide. The limited options especially toward HCC with metastasis prompts us to identify novel molecules for either diagnostic/prognostic or therapeutic purposes. GRPEL2 is well defined in maintaining mitochondrial homeostasis, which is critical to multiple biological processes for cancer survival. However, its role in HCC progression was not investigated before. In our analysis using data from The Cancer Genome Atlas Liver Hepatocellular Carcinoma (TCGA LIHC) dataset and tissue microarray, higher expression levels of GRPEL2 were obseved in HCC tissues compared to in normal liver tissues, and indicated higher tumor grade, higher tumor stage, and shorter overall survival (OS). Consistent with the results of above analyses, the functional experiments validated that GRPEL2 acted as a tumor-promoting factor in HCC progression. GRPEL2 knockdown suppressed cell growth, migration, and invasion in vitro, as well as inhibited tumor growth in vivo. Moreover, GRPEL2 deficiency also accelerated reactive oxygen species (ROS) production and increased mitochondrial membrane potential (MMP), leading to cell apoptosis. In addition, we found that the cell cycle and NF-κB signaling pathways were responsible for GRPEL2-induced HCC progression, based on the results of Gene Set Enrichment Analysis (GSEA) and subsequent experimental validation. Our study, for the first time, identified the role of GRPEL2 in HCC development and provided a compelling biomarker for targted therapy in HCC treatment.
Keywords: GRPEL2, HCC, diagnosis, prognosis, targeted therapy, cell cycle, NF-κB
Introduction
Hepatocellular carcinoma (HCC) is a leading cause of cancer-related deaths worldwide [1]. Of the HCC cases, 80% develop in people with a history of hepatitis, cirrhosis with hepatitis B or hepatitis C virus infection, or aflatoxin exposure [2,3]. Even though current treatments benefit patients a lot, there are limited strategies towards the treatment of advanced HCC with metastasis, which causes a severe public health problem. Sorafenib is an FDA-approved targeted drug to treat advanced HCC by inhibiting the activities of several kinases including Raf-1, VEGFR, and PDGFR [4-6]. However, patients will eventually develop sorafenib resistance, which prevents its further application. Therefore, there is an urgent need to develop novel therapeutic strategies for better treatment of advanced HCC patients.
Functional mitochondria are critical for cancer cell survival due to their tight regulation of the reactive oxygen species (ROS) level, production of certain metabolic precursors, and initiation of the apoptotic pathway [7,8]. Chaperon protein mtHsp70 (mitochondrial Hsp70) plays a key role in the import of nuclear-encoded polypeptides to the mitochondrial matrix [9,10]. Upon J-proteins binding, the ATP at the nucleotide-binding pocket of mtHsp70 is hydrolyzed to ADP.The transformed ADP-bound mtHsp70 has a higher affinity than the ATP bound form. Subsequently, the nucleotide exchange factor (NEF) acts to replace ADP with ATP, promoting the release of polypeptides into the mitochondrial matrix and allowing mtHsp70 to enter the next cycle [11]. GRPEL2 is one of the NEFs responsible for the mtHsp70 charpone activity [11]. Even though the role of GRPEL2 in maintaining mitochondrial homeostasis is well defined, its contribution to HCC progression has not been investigated.
The activation of NF-κB is frequently detected in human HCC, highlighting its importance as one of the driving forces in HCC development [12]. In an inflammation-triggered HCC mouse model, hepatic NF-κB signaling was activated by TNFα released from inflammatory cells and endothelial cells. Importantly, inhibtion of NF-κB signaling either with anti-TNFα or using a IκB-super-repressor could impair hepatocellular carcinoma development [13], suggesting NF-κB is a potential target for the treatment of HCC patients. There is no doubt that cell cycle related molecules play key roles to control cancer survival and apoptosis. For example, the frequent deletion of tumor suppressors such as p53 and Rb in HCC leads to uncontrolled cell proliferation [14]. In addition, the induction of hepatic growth factors IGF-2 and TGF-α has been well documented [15].
In this study, for the first time, we found that the expression levels of GRPEL2 were significantly increased in HCC tissues in comparison with normal liver tissues, according to The Cancer Genome Atlas Liver Hepatocellular Carcinoma (TCGA LIHC) dataset and immunohistochemical staining of HCC microarray. High GRPEL2 levels served as an independent predictor for tumor stage, tumor grade, distant metastasis, living status and overall survival (OS) of HCC patients, suggesting it may directly influence HCC development. Indeed, the in vitro data demonstrated that GRPEL2 knockdown suppressed cell growth and metastasis, but promoted cell apoptosis, which was attributable to its regulation on cell cycle progression, ROS produnction, and mitochondrial membrane potential (MMP). Gene Set Enrichment Analysis (GSEA) unfolded that cell cycle and NF-κB signaling pathways were activated in high GRPEL2 HCC patients, suggesting they may be potential mechanisms responsible for GRPEL2-mediated HCC cell growth, apoptosis, and metastasis. Overall, our data not only defined the oncogenic role of GRPEL2 in HCC development, but also built a rationale to develop a novel biomarker for targeted therapy in HCC treatment.
Materials and methods
Bioinformatic analysis
The RNA-seq from 371 patients in TCGA-LIHC and corresponding clinical information were downloaded from the Xena Functional Genomics Explorer (https://xenabrowser.net/heatmap/). The R survminer package v0.4.8 was used to perform OS analysis, and to draw the Kaplan-Meier survival curve. GraphPad Prism v8.2.1 (GraphPad Software, San Diego, CA, USA) was used to draw the ROC curve and calculate the area under the curve (AUC) value to evaluate the diagnostic value of GRPEL2. The GSEA was performed using software GSEA v4.1.0 to determine gene ontology (GO) term and Kyoto Encyclopedia of Genes and Genomic (KEGG) pathway associated with the GRPEL2 level after categorizing HCC patients into two groups by setting the median mRNA level of GRPEL2 as cut-off.
Cell culture: 293T, THLE-2, Hep3B, PLC/PRF/5, HepG2 and Huh7 cells were obtained from Xiamen Immocell Biotechnology Co., Ltd. All cells were cultured using DuIbecco’s modified eagIe’s medium (DMEM, Gibco, Detroit, MI, USA) containing 10% fetal bovine serum (FBS, Gibco) with 100 units/mL penicillin (Gibco) and 100 µg/mL streptomycin (Gibco) in a humidified hood (Thermo, Waltham, MA, USA) containing 5% CO2 at 37°C.
Immunohistochemistry (IHC)
IHC was performed on HCC microarray (D19A0792, Shanghai Outdo Biotech Company). Briefly, the deparaffinized and rehydrated tissue chip was pretreated with peroxidase blocking buffer (LSBio, Seattle, WA, USA) at 28°C for 25 min. Antigen retrieval was done in pH 6.0 citrate buffer at 28°C for 30 min. Then tissue chip was incubated with 5% BSA in PBS for 1 h at 28°C, subsequently incubated with Anti-GRPEL2 antibody (ab229985, Abcam, Shanghai, China) at 4°C overnight. The next day, the tissue chip was incubated with biotin-labeled secondary antibody at 28°C for 30 min, followed by incubation with horseradish peroxidase (HRP)-conjugated streptavidin at 28°C for 15 min. Finally, GRPEL2 signal was determined by DAB staining. The images were captured using a panoramic scanner PANNORAMIC (3DHISTECH, Budapest, Hungary) with software CaseViewer 2.4 (3DHISTECH). The staining intensity and rate of positive cells were analyzed using the software AIpathwell (Servicebio, Wuhan, China). German semi-quantitative scoring system was used to score staining intensity, according to the intensity of the cytoplasmic staining (no staining = 0, weak staining = 1, moderate staining = 2, strong staining = 3). The GRPEL2 expression level was semi-quantified using the formula: level = intensity score × positive rate × 100.
Lentivirus generation and infection
Lentiviral plasmid pLKO.1-TRC (Antihela, Xiamen, Fujian, China) was used for overexpressing two shRNAs targeting GRPEL2 (shGRPEL2-1 and shGRPEL2-2). The primers for construction of pLKO.1-shGRPEL2 plasmids were listed in Table 1. 293T cells were maintained in a 10 cm dish and co-transfected with pLKO.1-shGRPEL2 or vector plasmid (12 µg), psPAX2 (8 µg, Antihela), and pMD2.G (4 µg, Antihela) using Exfect Transfection Reagent (Vazyme, Nanjing, Jiangsu, China), when the cells reached 80% confluence. Four hours post transfection, fresh medium was added to generate lentiviruses for another 48 hours. The lentivirus supernatant was collected and used to infect HCC cells at a multiplicity of infection (MOI) of 40 with addition of 10 µg/mL polybrene (Yeasen, Shanghai, China), constructing stable GRPEL2-knockdown HCC cells (shGRPEL2-1 and shGRPEL2-2) or control cells (shctrl).
Table 1.
Primers for plasmid construction and RT-qPCR
| Primers | Sequence (5’-3’) | |
|---|---|---|
| shGRPEL2-1 | F | CCGGCTCTTGCTGAACGAGCCTTAACTCGAGTTAAGGCTCGTTCAGCAAGAGTTTTT |
| R | AATTAAAAACTCTTGCTGAACGAGCCTTAACTCGAGTTAAGGCTCGTTCAGCAAGAG | |
| shGRPEL2-2 | F | CCGGGATATTTGGAATCCAGAGTTTCTCGAGAAACTCTGGATTCCAAATATCTTTTT |
| R | AATTAAAAAGATATTTGGAATCCAGAGTTTCTCGAGAAACTCTGGATTCCAAATATC | |
| GRPEL2 OE | F | CTAGAGCTAGCGAATTCATGGCCGTACGGTCGCTGTG |
| R | CAGCGGCCGCGGATCCCAGTCTTCTCTGAGACTCCAC | |
| 18S RNA | F | AGGCGCGCAAATTACCCAATCC |
| R | GCCCTCCAATTGTTCCTCGTTAAG | |
| CCNB1 | F | GACCTGTGTCAGGCTTTCTCTG |
| R | GGTATTTTGGTCTGACTGCTTGC | |
| CDK1 | F | GGAAACCAGGAAGCCTAGCATC |
| R | GGATGATTCAGTGCCATTTTGCC | |
| HDAC2 | F | CTCATGCACCTGGTGTCCAGAT |
| R | GCTATCCGCTTGTCTGATGCTC | |
| HIF1AN | F | CCTCTAACCTGCTGCTCATTGG |
| R | GTAGAGGCACTCGAACTGATCC | |
| GRPEL2 | F | CATAAGGAGGCGAACCCAGAGA |
| R | GTCTTCTCCAAAATGTCAGCCAC | |
RT-qPCR
Total RNAs were extracted using Trizol (Vazyme) and following the standard protocol. Two micrograms of total RNA was used to perform reverse transcription using Superscript III transcriptase (Invitrogen). The expression levels of mRNA were examined using a Bio-Rad CFX96 system (Bio-Rad Laboratories, Hercules, CA, USA) with a ChamQ Universal SYBR qPCR Master Mix Kit (Vazyme) under the following conditions: 95°C for 4 min, followed by 95°C for 15 sec, 60°C for 20 sec, and 72°C for 20 sec, for 40 cycles. The 2-ΔΔct method was used to determine the mRNA levels, which were calibrated to 18S rRNA. The primers were listed in Table 1.
Western blotting
Hep3B and HepG2 cells were washed with PBS and lysed in cold RIPA lysis buffer (Vazyme). A bicinchoninic acid (BCA) protein assay kit (Abcam, Shanghai, China) was used to estimate the concentration of protein. Samples (15 μg/lane) were loaded into a 12% SDS-PAGE gel for electrophoresis, subsequently transferred to a PVDF membrane (Roche, Basel, Switzerland). The bolt with proteins was probed with specific primary antibodies at 4°C overnight, followed by incubation with HRP-conjugated secondary antibodies at 28°C for 1 hour. After being washed, signals were visualized using a ChemiDOC XRS + system (Becton, Dickinson and Company, Franklin L., NJ, USA). The antibodies used in this study were listed in Table 2. The protein level was quantified by densitometry using Image J 1.8.0v (NIH, Bethesda, MD, USA) and to normalized to GAPDH.
Table 2.
Antibodies for western blotting
| Antibodies | Provider | Catalog NO. | Dilution |
|---|---|---|---|
| GAPDH | Proteintech, Wuhan, China | 10494-1-AP | 1:3000 |
| CCNB1 | Abcam, Shanghai, China | ab212977 | 1:2000 |
| HDAC2 | Abcam, Shanghai, China | ab32117 | 1:2000 |
| HIF1AN | Proteintech, Wuhan, China | 10646-1-AP | 1:1000 |
| GRPEL2 | Proteintech, Wuhan, China | 17751-1-AP | 1:1500 |
| p65 | Proteintech, Wuhan, China | 10745-1-AP | 1:2000 |
| p-p65 | Abcam, Shanghai, China | ab76302 | 1:2000 |
| HRP Goat Anti-mouse IgG(H + L) | Proteintech, Wuhan, China | SA00001-1 | 1:10000 |
| HRP Goat Anti-Rabbit IgG(H + L) | Proteintech, Wuhan, China | SA00001-2 | 1:10000 |
3-(4,5-Dimethylthiazolyl-2-yl)-2,5-diphenyltetrazolium bromide (MTT) cell growth assay
Tatally, 2 × 10³ shctrl or shGRPEL2-Hep3B and HepG2 cells were seeded into 96-well plates. At different time points (0 h, 24 h, 48 h, 72 h), 5 μg/mL MTT (Beyotime, Shanghai, China) was added to the medium. After a 2-h incubation, the absorbance was detected using a SpectraMax Absorbance Reader (Molecular Devices, San Francisco, CA, USA) at 490 nm. The measurement was performed in sextuple.
Detection of cell cycle
shctrl or shGRPEL2-Hep3B and HepG2 cells were trypsinized and fixed with 70% ethanol at -20°C for 6 h. After permeation with 0.5% Triton X-100 at 37°C for 15 min, the fixed cells were treated with 20 μg/mL RNase and 20 μg/mL propidium iodide (PI, Vazyme) at 28°C for 15 min. Finally, the stained cells were subjected to flow cytometry analysis within PE-channel (Ex: 488 nm/Em: 578 nm).
EdU staining
shctrl or shGRPEL2-Hep3B and HepG2 cells were seeded into 96-well plates at a density of 1.0 × 10⁴ per well. The cells were incubated with 10 μM EdU solution (Beyotime, Shanghai, China) at 37°C for 4 hours. After a series of treatments (20-min fixation with 4% methanal, 5-min neutralizaztion with 2 mg/mL glycine, and 10-min permeation with 0.5% Triton X-100) at 28°C, the cells were treated with 50 µL of 1 × Click Additive Solution (Beyotime) at 28°C for 30 min, followed by nuclear staining with 10 μg/mL DAPI solution (Beyotime). Finally, pictures were taken using a fluorescence microscope (MOTIC, Hongkong, China). The number of EdU+ cells was counted using Image J 1.8.0v.
ROS detection
shctrl or shGRPEL2-Hep3B and HepG2 cells were harvested and suspended with DMEM containing 10 μmol/L DCFH-DA (Sigma, San Francisco, CA, USA) at a density of 1 × 10⁷/mL. After a 30-min incubation at 28°C, the cells were washed with PBS for three times, subsequently resuspended in 1 mL PBS for flow cytometry analysis using a flow cytometer NovoCyte 1300 (ACEA, San Diego, CA, USA) within the FITC-channel (Ex: 488 nm/Em: 519 nm).
MMP detection
shctrl or shGRPEL2-Hep3B and HepG2 cells were seeded into 6-well plates at 80% confluence. JC-1 (Sigma) was added to a final concentration of 5 μM for 30 min in a humidified hood. Cells were trypsinized, washed with PBS, and subjected to flow cytometry analysis. Green (JC-1 monomer) and red (JC-1 aggregates) fluorescence were detected within the FITC-channel and PE-channel (Ex: 488 nm/Em: 578 nm), respectively. The mean fluorescence intensity (MFI) was measured, and then the MFI ratio of green/red was counted.
Detection of apoptosis
shctrl or shGRPEL2-Hep3B and HepG2 cells were collected and stained with 200 µg/mL Annexin V-fluorescein isothiocyanate (Annexin V-FITC, Vazyme) and 20 µg/mL PI at 28°C for 10 min. Without wash, the stained cells were subjected to analysis by flow cytometry within the FITC-channel and PE-channel.
Wound healing assay
shctrl or shGRPEL2-Hep3B and HepG2 cells were seeded into 6-well plates at 100% confluence and scratched using a pipette tip. Images of these cells were captured using a microscope (MOTIC) at two different time points (0 h and 48 h).
Transwell assay
Transwell plates (Corning, Corning, NY, USA) were pre-coated with matrigel (BD Biosciences, Sparks, MD) before use. Totally, 1 × 10⁵ Vector or shGRPEL2-Hep3B and HepG2 cells suspended in 100 μL 0% FBS DMEM were seeded into the upper chamber of transwell plates. The bottom chamber was added with 800 μL 20% FBS DMEM as a chemoattractant. Twenty-four hours later, the invaded cells were fixed with 4% methanal at 28°C for 15 min, followed by staining with 0.1% crystal violet (Sangon Biotech, Shanghai, China) for 40 min. Images were captured under an inverted microscope (MOTIC). The experiment performed in transwell plates without pre-coated Matrigel was considered as migration assay. The numbers of migrated and invasive cells were counted using Image J 1.8.0v.
Construction of GRPEL2-overexpressing plasmid and transfection
Plasmid pCDH-CMV-MCS-T2A-puro (Antihela) was used to overexpress GRPEL2 in Hep3B cells. The primers for construction were listed in Table 1. Hep3B cells in were seeded into 6-well at the density of 2 × 10⁶ per well. The cells in “Vector” and “GRPEL2 OE” groups were transfected with empty vector (4 μg/well) and pCDH-GRPEL2 plasmid (4 μg/well) using Exfect Transfection Reagent, respectively. The cells in “GRPEL2 OE + PDTC” group were supplied with 100 μM PDTC (Selleck, Shanghai, China) after a 6-h transfection with pCDH-GRPEL2 plasmid. Thirty-six hours after transfection, the cells in three groups were collected and subjected to the analyse of cellular function as above. All experiments were performed in triple.
In vivo experiments
Six-week-old female BALB/c nude mice were obtained from Shanghai SLAC Laboratory Animal Co., Ltd (Shanghai, China). shctrl and shGRPEL2-Hep3B cells (4 × 10⁶) were subcutaneously injected into the right flank of mice (n = 6) in each group, respectively. The long diameter (a) and short diameter (b) of tumors were measured every 4 days. The tumor volume (V) was calculated using the formula V = ab2/2. The tumors were dissected off and imaged 34 days after injection. The study was approved by the Institutional Animal Care and Use Committee (IACUC) of Zhejiang University.
Statistical analysis
GraphPad Prism v8.2.1 was used to perform statistical analysis of experimental data. Data are presented as mean ± standard deviation (SD). Mann-Whitney test was performed for nonparametric data between two groups. Wilcoxon matched-pairs signed rank test was used to compare matched samples for nonparametric data. Kruskal-Wallis one-way ANOVA followed by Dunn’s multiple comparison test was performed for nonparametric data among three or more groups. One way ANOVA followed by Tukey’s post-hoc test was used for multiple comparisons among three experimental groups. Statistical significance was accepted at P < 0.05.
Results
The expression level of GRPEL2 was increased in HCC patients
The mRNA level of GRPEL2 in HCC patients was examined according to TCGA LIHC dataset. Results showed that HCC patients tended to express higher mRNA levels of GRPEL2 than heathy people (Figure 1A). Besides, the GRPEL2 mRNA level was also significantly increased in 50 HCC samples when compared to their corresponding adjacent liver tissues (Figure 1B). Notably, female HCC patients expressed higher GRPEL2 levels than male patients (Figure 1C), indicating that sex-related hormones may regulate GRPEL2 expression. Moreover, the mRNA level of GRPEL2 was tightly associated with the T stage, TNM stage and pathological grade (G) of HCC patients (Figure 1D-F, top). Notably, higher GRPEL2 mRNA level was observed in T stage III, TNM stage III, and G3 than in their corresponding controls (Figure 1D-F, bottom). To further assess the role of GPREL2 in HCC development, we performed IHC to stain GRPEL2 in commercial HCC microarray. Results consistently exhibited that the expression level of GPREL2 was remarkably higher in HCC tumors (n = 75), compared to the adjacent normal tissues (n = 75) (Figure 1G). However, GPREL2 expression level in this HCC microarray was not tightly associated with TNM stage and pathological grade (Supplementary Figure 1 and Table 3), probably due to the limited number of sample. Together, all these data indicate that GRPEL2 is overexpressed in HCC patients and is further increased as the patient’s progress moves to a more lethal stage, implying that GRPEL2 may serve as an oncogenic factor determining HCC progression.
Figure 1.
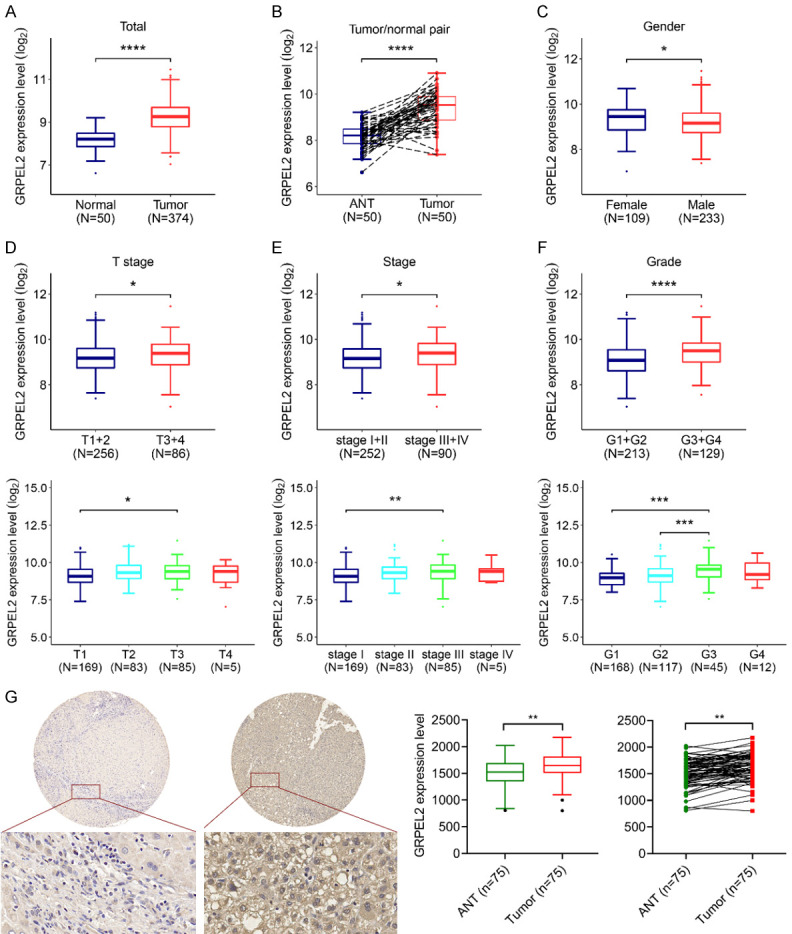
The clinical significance of GRPEL2 in HCC patients. A. The mRNA level of GRPEL2 was remarkably increased in HCC patients (n = 371) compared to that in normal tissues (n = 50). B. The mRNA level of GRPEL2 was also increased in HCC and the paired adjacent tissues (n = 50). C. Male HCC patients tended to express a higher mRNA level of GRPEL2 than female HCC patients. D. Top, GRPEL2 mRNA level was overexpressed in HCC patients with T3 + T4 stage using patients with T1 + T2 stage as a comparison. Bottom, the GRPEL2 mRNA level was increased in HCC patients with T3 stage compared to patients with T1 stage. E. Top, the mRNA GRPEL2 level was upregulated in HCC patients with TNM stage III + IV compared to TNM stage I + II patients. Bottom, HCC patients with TNM stage III expressed higher level of GRPEL2 mRNA compared to with TNM stage I. F. Top, the mRNA GRPEL2 level was elevated in HCC patients with G3 + G4 grade compared to patients with G1 + G2 grade. Bottom, the mRNA GRPEL2 level was remarkably increased in HCC patients with G3 grade when compared to patients with either G2 or G1 grade. G. IHC staining of GRPEL2 in HCC microarray. Left panel, representative image of IHC staining. Right panel, statistical analysis of GRPEL2 expression level determined using IHC staining. *P < 0.05, **P < 0.01, ***P < 0.001, ****P < 0.0001.
Table 3.
Correlation between clinicopathological variables and GRPEL2 expression in HCC
| Total (N = 75) | GRPEL2 Expression | P-valuea | ||
|---|---|---|---|---|
|
| ||||
| High (N = 37) | Low (N = 38) | |||
| Age (year) | ||||
| < 65 | 66 (88.0%) | 31 (83.8%) | 35 (92.1%) | 0.451 |
| ≥ 65 | 9 (12.0%) | 6 (16.2%) | 3 (7.9%) | |
| Gender | ||||
| Male | 58 (77.3%) | 27 (73.0%) | 31 (81.6%) | 0.539 |
| Female | 17 (22.7%) | 10 (27.0%) | 7 (18.4%) | |
| Pathological grade | ||||
| I | 2 (2.7%) | 0 (0%) | 2 (5.3%) | 0.359 |
| I-II | 3 (4.0%) | 2 (5.4%) | 1 (2.6%) | |
| II | 30 (40.0%) | 17 (45.9%) | 13 (34.2%) | |
| II-III | 29 (38.7%) | 14 (37.8%) | 15 (39.5%) | |
| III | 10 (13.3%) | 3 (8.1%) | 7 (18.4%) | |
| III-IV | 1 (1.3%) | 1 (2.7%) | 0 (0%) | |
| Clinical stage | ||||
| Phase 1 | 11 (14.7%) | 5 (13.5%) | 6 (15.8%) | 0.855 |
| Phase 2 | 20 (26.7%) | 11 (29.7%) | 9 (23.7%) | |
| Phase 3 | 36 (48.0%) | 18 (48.6%) | 18 (47.4%) | |
| Phase 4 | 8 (10.7%) | 3 (8.1%) | 5 (13.2%) | |
| Pathologic T | ||||
| T1 | 11 (14.7%) | 5 (13.5%) | 6 (15.8%) | 0.777 |
| T2 | 22 (29.3%) | 11 (29.7%) | 11 (28.9%) | |
| T3 | 41 (54.7%) | 20 (54.1%) | 21 (55.3%) | |
| Unknown | 1 (1.3%) | 1 (2.7%) | 0 (0%) | |
| Pathologic N | ||||
| N0 | 69 (92.0%) | 35 (94.6%) | 34 (89.5%) | 0.246 |
| N1 | 5 (6.7%) | 1 (2.7%) | 4 (10.5%) | |
| Unknown | 1 (1.3%) | 1 (2.7%) | 0 (0%) | |
| Pathologic M | ||||
| M0 | 72 (96.0%) | 35 (94.6%) | 37 (97.4%) | 0.981 |
| M1 | 3 (4.0%) | 2 (5.4%) | 1 (2.6%) | |
| Distant metastasis | ||||
| No | 72 (96.0%) | 35 (94.6%) | 37 (97.4%) | 0.981 |
| Yes | 3 (4.0%) | 2 (5.4%) | 1 (2.6%) | |
Chi-square test.
High GRPEL2 level indicated poor prognosis of HCC patients
The prognostic value of GRPEL2 in HCC was further investigated. The analysis showed that higher mRNA level of GRPEL2 was observed in HCC patients with distant metastasis using non-metastatic patients as controls (Figure 2A). Nevertheless, there is no significant difference in the GRPEL2 mRNA level when HCC patients were classified by lymph node metastasis (Figure 2B). In addition, higher GRPEL2 mRNA level was clearly observed in HCC patients with poor prognosis (Figure 2C). The data also revealed that the mRNA level of GRPEL2 was higher in dead patients than in alive patiens (Figure 2D). Collectively, all these results indicate that GRPEL2 levels may be used as an independent predictor for prognosis in HCC patients.
Figure 2.
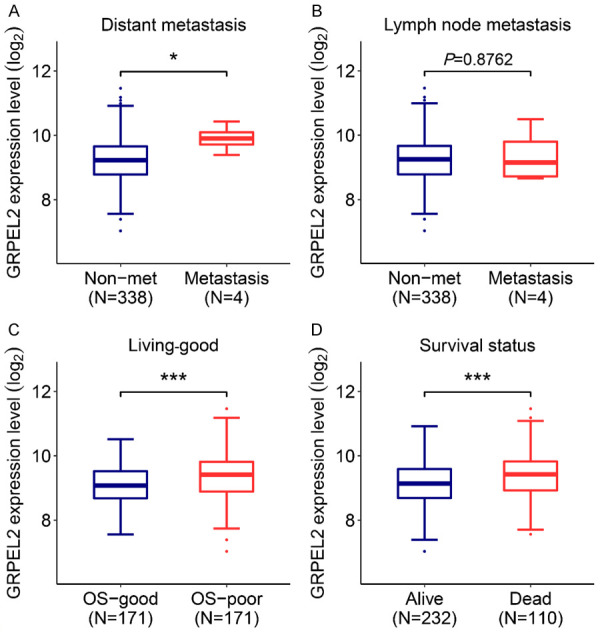
High GRPEL2 level indicated poor prognosis of HCC. The association of GRPEL2 expression level with distant metastasis (A), lymph node metastasis (B), overall survival (OS) (C) and living status (D). *P < 0.05, ***P < 0.001.
The diagnostic value of GRPEL2 in HCC
We subsequently sought to investigate the diagnostic value of GRPEL2 in HCC. Receiver operating characteristics (ROC) curves were used to correlate the clinicopathological parameters of HCC with the GRPEL2 level. The expression level GRPEL2 was sufficient to distinguish HCC patients from healthy people with an area under the receiver operating characteristics curves (AUC) of 0.8924 (95% CI: 0.8533-0.9314; P < 0.0001) (Figure 3A). Similar conclusion was gained from HCC and the paired normal tissues (Figure 3B, n = 50), with the AUC of 0.9012 (95% CI: 0.8388-0.9636; P < 0.0001). GRPEL2 level was also sufficient to discriminate HCC patients classified by TNM stage, T stage, pathological grade, OS and living status: TNM stage I + II vs TNM stage III + IV (Figure 3C, AUC = 0.5875, P = 0.0135); T1 + T2 vs T3 + T4 (Figure 3D, AUC = 0.5834, P = 0.0206); G1 + G2 vs G3 + G4 (Figure 3E, AUC = 0.6521, P < 0.0001); OS good vs OS poor (Figure 3F, AUC = 0.6182, P = 0.0002); living vs deceased (Figure 3G, AUC = 0.6133, P = 0.0007). Together, these results illustrated that the GRPEL2 expression level can be used as a potential diagnostic indicator for HCC patients.
Figure 3.
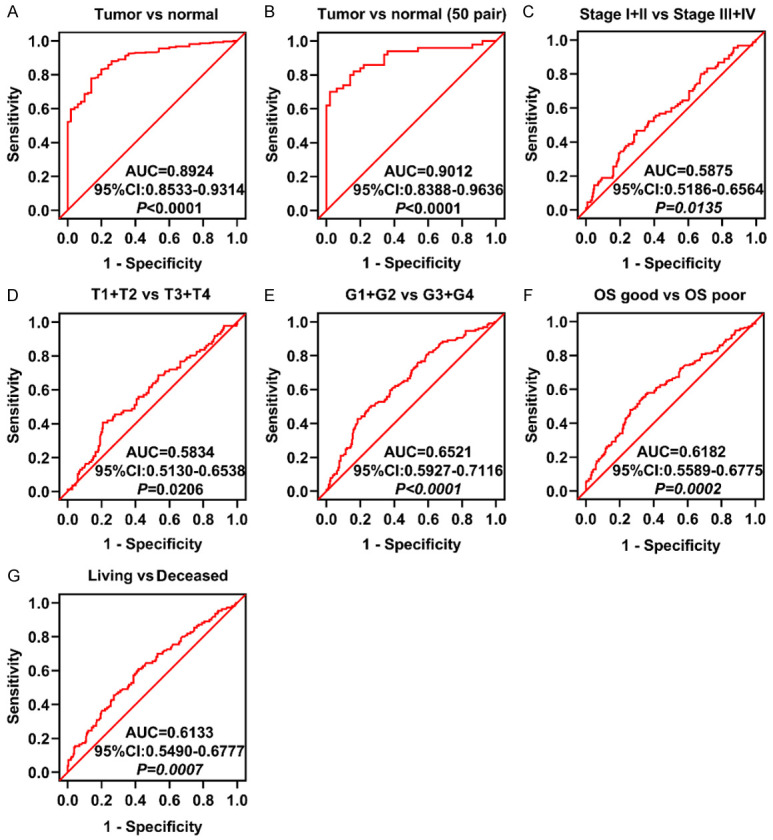
The diagnostic value of GRPEL2 in HCC. The expression level of GRPEL2 in HCC can be used to distinguish: Tumor from Normal (A, B), Stage I + II from Stage III-IV (C), T1 + T2 from T3 + T4 (D), G1 + G2 from G3 + G4 (E), OS good from OS poor (F), Living from Deceased (G).
The association between GRPEL2 level and OS time of HCC patients
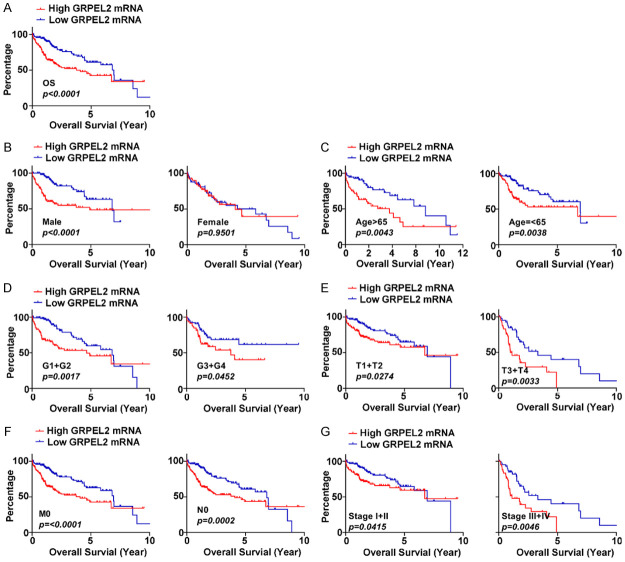
We further investigated the association between the GRPEL2 mRNA level and OS time of HCC patients. First, patients from TCGA-LIHC were classified into two groups according to the mRNA level of GRPEL2. Expectedly, high GRPEL2 HCC patients had shorter OS time compared to the low GRPEL2 group (Figure 4A, P < 0.0001). Stratified analyses also illustrated that high GRPEL2 mRNA level served as a factor for poor prognosis, when HCC patients were classified as male (Figure 4B, left, P < 0.0001), age > 65 years (Figure 4C, left, P = 0.0043), age ≤ 65 years (Figure 4C, right, P = 0.0038), G1 + G2 (Figure 4D, left, P = 0.0017), G3 + G4 (Figure 4D, right, P = 0.0452), T1 + T2 stage (Figure 4E, left, P = 0.0274), T3 + T4 stage (Figure 4E, right, P = 0.0033), M0 (Figure 4F, left, P < 0.0001), N0 (Figure 4F, right, P = 0.0002), TNM stage I + II (Figure 4G, left, P = 0.0415), and TNM stage III + V (Figure 4G, right, P = 0.0046). Notably, the GRPEL2 mRNA level failed to predict the OS of female HCC patients (Figure 4B, right, P = 0.9501). To summarize, we conclude that the GRPEL2 level serves as an predictor for the OS of HCC patients.
Figure 4.
The relationship between the GRPEL2 level and the OS time of HCC patients. (A) HCC patients with high expression levels of GRPEL2 had shorter OS time than patients with low GRPEL2 expression levels. (B-G) The association between GRPEL2 level and OS in HCC patients classified by male or female (B), age > 65 or age ≤ 65 (C), G1 + G2 or G3 + G4 (D), T1 + T2 or T3 + T4 (E), M0 or N0 (F), TNM stage I + II or TNM stage III + IV (G).
GRPEL2 promoted HCC cell growth
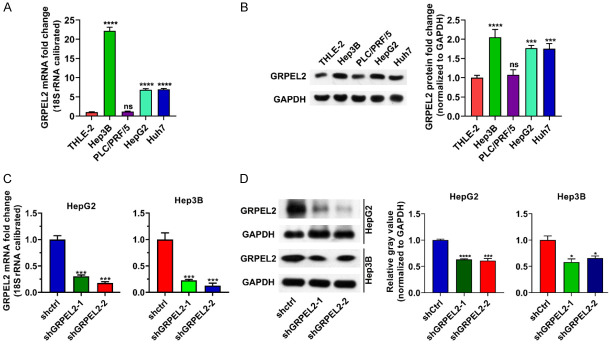
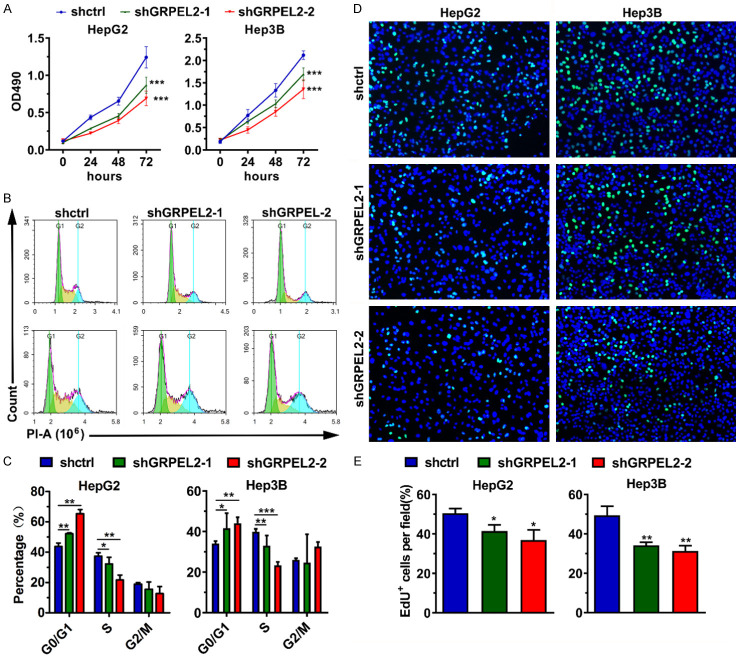
To experimentally evaluate the casual role of GRPEL2 in HCC, we first compared its expression level in several HCC cell lines and normal liver cells. As shown in Figure 5A, 5B, GRPEL2 was highly expressed in HCC cell lines (including Hep3B, HepG2, and Huh7) except for PLC/PRF/5, compared to in the normal liver cell line THLE-2 at both mRNA and protein levels. Next, we designed two independent short hairpin RNAs (shGRPEL2-1 and shGRPEL2-2) against GRPEL2 to silence GRPEL2 in HepG2 and Hep3B cells using lentivirus technology. As shown in Figure 5C, 5D, the mRNA and protein levels of GRPEL2 were significantly reduced in shGRPEL2-HepG2 and Hep3B cells. Consistent with the initial speculations, the knockdown of GRPEL2 suppressed cell growth of HepG2 and Hep3B cells (Figure 6A). To further dissect the underlying mechanisms by which GRPEL2 contributed to HCC cell growth, we examined the cell cycle process of HepG2 and Hep3B cells upon GRPEL2 knockdown. The results showed that GRPEL2 deficiency caused a cell cycle arrest at the G0/G1 phase in both HepG2 and Hep3B cells (Figure 6B, 6C). In addition, data from EdU staining demonstrated that GRPEL2 knockdown suppressesed cellular proliferation of HepG2 and Hep3B cells, as the number of EdU-positive cells in GRPEL2-knockdown cells was significantly lower than that in control cells (Figure 6D, 6E). All these findings suggest that GRPEL2-induced cell growth may be attributable to its regulation on cellular proliferation and cell cycle process.
Figure 5.
Knockdown of GRPEL2 in HepG2 and Hep3B cells. (A) The expression level of GRPEL2 was high in HCC cell lines compared to that in normal THLE-2 cells. 18S RNA was used as an internal control. (B) Western blotting confirmed that GRPEL2 protein was increased in HCC cell lines. GAPDH served as loading control. (C, D) Knockdown efficiency of shRNAs against GRPEL2 monitored using either qPCR (C) or western blotting (D). *P < 0.05, **P < 0.01, ***P < 0.001, ****P < 0.0001.
Figure 6.
GRPEL2 promoted HCC cell growth. (A) Knockdown of GRPEL2 suppressed cell growth of HepG2 and Hep3B cells. (B, C) Knockdown of GRPEL2 induced cell cycle arrest at G0/G1 in HepG2 and Hep3B cells. (B) Representative images of cell cycle assay by flow cytometry. (C) Statistical analysis of (B). (D, E) EdU staining assay revealed GRPEL2 knockdown inhibited cell proliferation of HepG2 and Hep3B cells. (D) Representative images of BrdU staining. Bar: 10 μm. (E) Statistical analysis of (D). *P < 0.05, **P < 0.01, ***P < 0.001.
Knockdown of GRPEL2 accelerated ROS production, enhanced MMP and triggered apoptosis
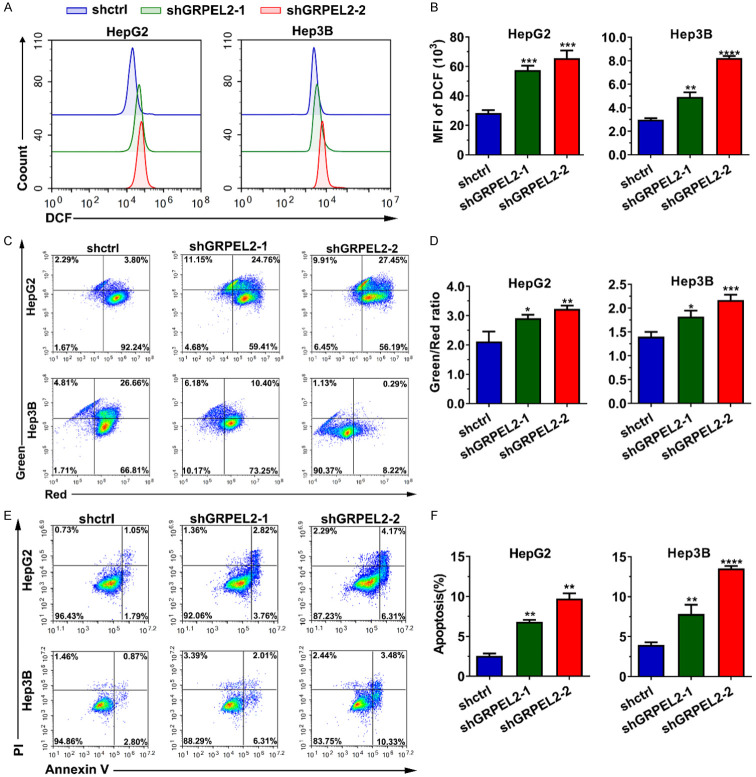
As a critical regulator of the mitochondrial function, we sought to investigate whether GRPEL2 alteration has any effect on ROS production, MMP and cell apoptosis. As we expected, knockdown of GRPEL2 in both HepG2 and Hep3B cells significantly increased their cellular ROS levels (Figure 7A, 7B), monitored by flow cytometry analysis using DCFH-DA as an indicator. Meanwhile, JC-1 based MMP detection suggested that MMP was significantly increased after GRPEL2 silence in HCC cells (Figure 7C, 7D). Since the ROS level and MMP are tightly associated with cell apoptosis, we examined cell apoptosis using an Annexin V/PI-based flow cytometry method. We found that GRPEL2 attenuation could substantially increase cell apoptosis of HepG2 and Hep3B cells (Figure 7E, 7F). Together, all these data illustrated that GRPEL2 plays a role in the regulations on ROS production, MMP and cell apoptosis.
Figure 7.
Knockdown of GRPEL2 accelerated reactive oxygen species (ROS) production, enhanced mitochondrial membrane potential (MMP) and cell apoptosis. (A, B) Knockdown of GRPEL2 significantly increased the ROS level. (A) Representative image from DCF-based flow cytometry analysis. (B) Statistical analysis of (A). (C, D) MMP in HCC cells was elevated when GRPEL2 was reduced by shRNAs. (C) Representative images of JC-1-based detection of MMP by flow cytometry. (D) Statistical analysis of (C). (E, F) Knockdown of GRPEL2 triggered cellular apoptosis of HepG2 and Hep3B cells. (E) Representative images of apoptosis detection by flow cytometry. (F) Statistical analysis of (E). *P < 0.05, **P < 0.01, ***P < 0.001, ****P < 0.0001.
GRPEL2 increased the metastasis ability of HCC cells
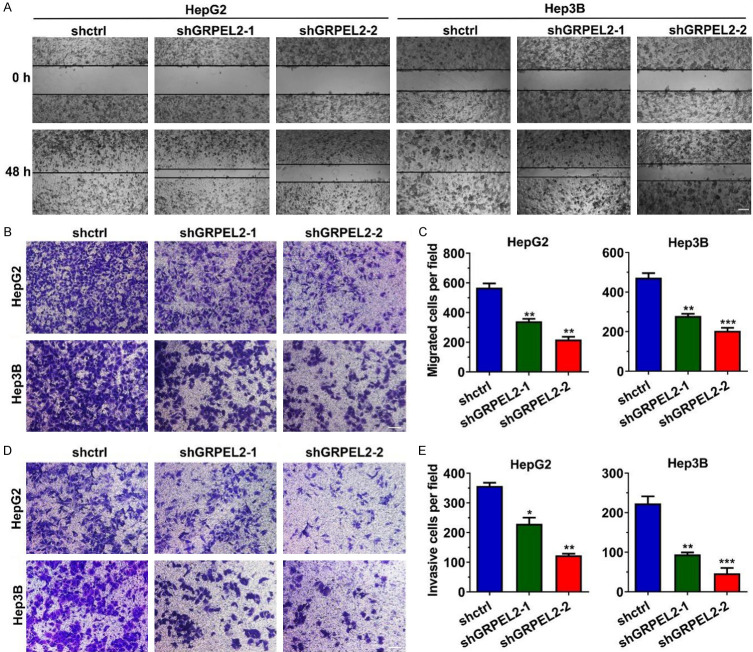
The data showed that high GRPEL2 levels indicated distant metastasis in HCC patients. Therefore, it is reasonable to explore the effect of GRPEL2 on cell metastasis. As shown in Figure 8A, wound healing assay showed that GRPEL2-silenced HepG2 and Hep3B migrated more slowly than the corresponding control cells. Similar results were gained when we perfomed a transwell migration assay in HepG2 and Hep3B cells after the manipulation of GRPEL2 (Figure 8B, 8C). Consistently, the invading ability of HepG2 and Hep3B cells was also significantly suppressed after GRPEL2 knockdown (Figure 8D, 8E). These data proved that GRPEL2 promotes cell metastasis.
Figure 8.
GRPEL2 increased migration and cell invasion of HCC cells. (A) Knockdown of GRPEL2 decreased migrating ability of HepG2 and Hep3B cells, monitored using wound healing assay. Bar: 5 μm. (B, C) The migrating ability of HepG2 and Hep3B cells was inhibited after GRPEL2 knockdown, monitored using transwell migration assay. (B) Representative images of migrated cells. 1.0 × 10⁵ cells were seeded into the upper chamber. Bar: 10 μm. (C) Statistical analysis of (B). (D, E) GRPEL2 knockdown dramatically reduced the invading ability of HepG2 and Hep3B cells, monitored using Matrigel invasion assay. (D) Representative images of invasive cells. 1.0 × 10⁵ cells were seeded into the upper chamber. Bar: 10 μm. (E) Statistical analysis of (D). *P < 0.05, **P < 0.01, ***P < 0.001.
GRPEL2 level was positively associated with the cell cycle and NF-κB pathways
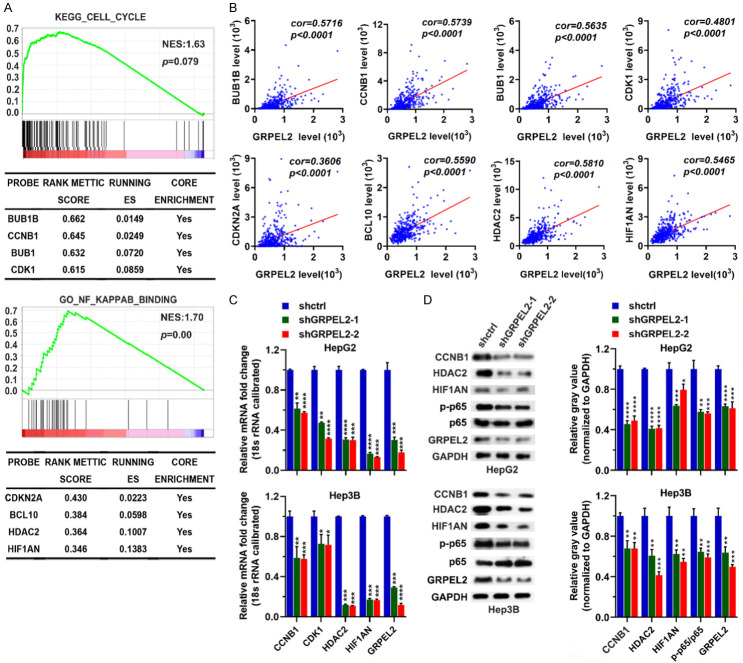
To identify the potential mechanisms accounting for GRPEL2-mediated HCC progression, we classified TCGA LIHC patients as high-GRPEL2 and low-GRPEL2 according to the median expression level of GRPEL2, which was used as bait to run GSEA. The analysis revealed that the cell cycle and NF-κB pathways were tightly associated with the expression level of GRPEL2, suggesting GRPEL2 may rely on these two pathways to control HCC progression (Figure 9A). Further investigation demonstrated that BUB1B, CCNB1, BUB1, and CDK1 in cell cycle pathway and CDKN2A, BCL10, HDAC2 and HIF1AN in NF-κB pathway were highly enriched in high-GRPEL2 HCC patients (Figure 9A). Moreover, these identified molecules are positively correlated with GRPEL2 (Figure 9B). For validation, we performed RT-qPCR and western blotting analyses. The results showed that knockdown of GRPEL2 could significantly reduce the mRNA and protein levels of CCNB1, CDK1, HDAC2 and HIF1AN in HepG2 and Hep3B cells, as well as the ratio of p-NF-κB p65/p65 (Figure 9C, 9D). Concisely, we conclude that GRPEL2 may mediate HCC progression through cell cycle and NF-κB pathways.
Figure 9.
GRPEL2 level was positively associated with the cell cycle and NF-κB pathways. A. GSEA determined Kyoto Encyclopedia of Genes and Genomic (KEGG) pathway (upper panel) and gene ontology (GO) term (lower panel) that associated with the GRPEL2 level. B. The correlations of GRPEL2 with several molecules in the cell cycle and NF-κB pathways. C. Knockdown of GRPEL2 reduced the mRNA levels of CCNB1, CDK1, HDAC2 and HIF1AN in both HepG2 and Hep3B cells. 18S RNA was used as an internal control. D. Knockdown of GRPEL2 reduced the protein levels of CCNB1, HDAC2, HIF1AN and the ratio of p-p65/p-65 in both HepG2 and Hep3B cells. GAPDH was used as a loading control. *P < 0.05, **P < 0.01, ***P < 0.001, ****P < 0.0001.
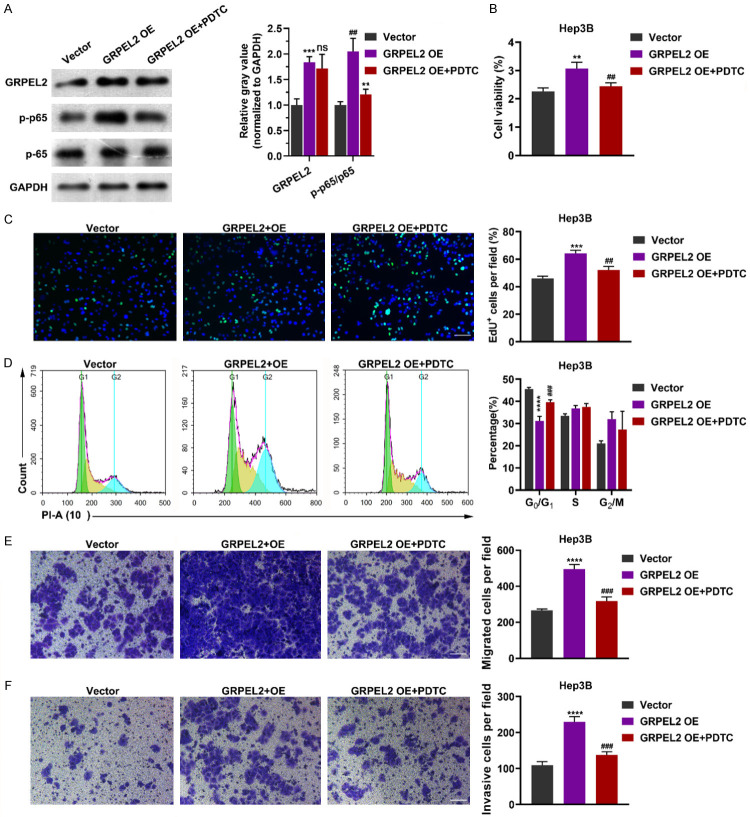
In order to further confirmed our conclusion, we overexpressed the GRPEL2 in Hep3B cells with or without treatment with a NF-KB inhibitor PDTC and then analyzed the phenotype. As shown in Figure 10A, GRPEL2 overexpression promoted the phosphorylation of NF-κB p65, which was rescued by PDTC treatment. Moreover, GRPEL2 overexpression increased the cell viability (Figure 10B) and percentage of EdU+ cells (Figure 10C), reduced the percentage of cells in G0/G1 phase (Figure 10D), and promoted the cell migration (Figure 10E) and cell invasion (Figure 10F). Interestingly, PDTC treatment rescued all the forementioned effects of GREPL2 overexpression (Figure 10A-F). These data confirmed that GRPEL2 plays an oncogenic role in HCC via NF-κB pathway.
Figure 10.
GRPEL2 overexpression promoted cell growth and metastasis via NF-κB pathway. A. Western blot showed the effect of PDTC treatment on p65 phosphorylation after GRPEL2 overexpression. B-F. PDTC treatment offset the effect of GRPEL2 overexpression that promoted the malignant biological behavior of HCC cells. B. MTT assay. C. EdU assay. Bar: 10 μm. D. Flow-cytometry based cell cycle assay. E. Mirgrtion assay. Bar: 10 μm. F. Invasion assay. Bar: 10 μm. ns, no significance. **P < 0.01, ***P < 0.001, ****P < 0.0001, * represented significance for comparison between GRPEL2 OE and Vector group. ##P < 0.01, ###P < 0.001, # represented significance for comparison between GRPEL2 OE + PDTC and GRPEL2 OE group.
Targeting GRPEL2 suppressed HCC tumor growth
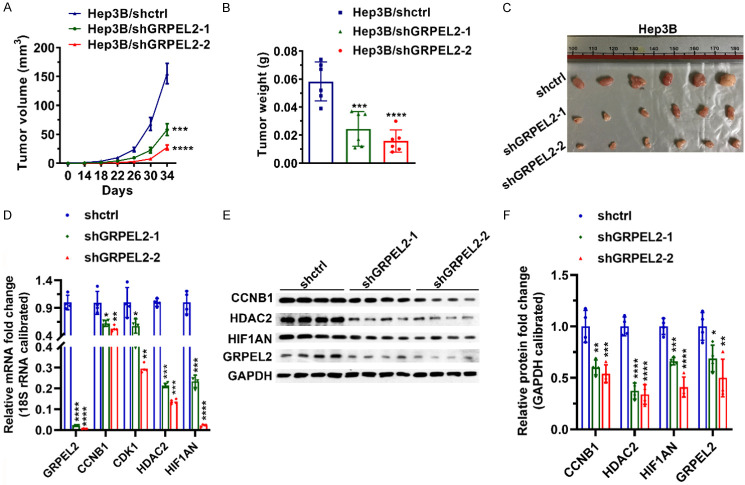
To further verify the oncogenic role of GRPEL2 in HCC development, we performed in vivo study. As shown in Figure 11A, silence of GRPEL2 by shRNAs could dramatically suppressed tumor growth, which was confirmed by tumor weight and tumor size at endpoint (Figure 11B, 11C). Moreover, results of qPCR and western blotting showed that implanted tumors in shGRPEL2-1 and shGRPEL2-2 groups expressed much lower levels of CCNB1, CDK1, HDAC2 and HIF1AN than those in shctrl group (Figure 11D-F), strengthening the important regulation of GRPEL2 on cell cycle and NF-κB pathways in HCC development.
Figure 11.
Knockdown of GRPEL2 suppressed the growth of implanted tumor. (A) Tumor volume. (B) Tumor weight. (C) Image of tumors. (D) The tumors in GRPEL2-silenced group expressed lower mRNA levels of CCNB1, CDK1, HDAC2 and HIF1AN than those in shctrl group. 18S RNA was used to normalize gene expression. (E) The tumors in GRPEL2-silenced group expressed lower mRNA levels of CCNB1, CDK1 and HDAC2 than those in shctrl group. GAPDH was used as an internal control. (F) Statistical analysis of (E). *P < 0.05, **P < 0.01, ***P < 0.001, ****P < 0.0001.
Discussion
At present, there is no comprehensive approach to completely prevent HCC recurrence and metastasis, which results in the poor prognosis [16]. Therefore, it is of scientific and clinical significance to identify novel biomarkers as diagnostic markers, prognositic factors, or therapeutic targets.
Followed with the continuous developments on computer science and high-throughput sequencing technology, bioinformatics has become a powerful tool to systematically explore the mechanism of tumorigenesis, further screen the most effective tumor biomarkers, and even formulate personalized treatment strategies [17,18]. In this study, for the first time, we attempted to identify the role of GRPEL2 in HCC by analyzing the data from TCGA database and tissue microarray. It was found that GRPEL2 was highly expressed in HCC, especially in high pathological grade and advanced TNM stage patients, and could be served as predictor for OS and living status for HCC patients. It is well known that the outcomes of HCC patients with similar clinical features can be fairly differentiated [19]. Our bioinfomatics results showed that GRPEL2 also played well in predicting OS in patients with the same gender, age, pathological grade or clinical stage. These results suggeted that GRPEL2 might play an important role in the malignant progression of HCC. In order to verify this hypothesis, we investigated the phenotype of HCC cells after GRPEL2 knockdown and overexpression in vitro. The results indicated that GRPEL2 deficiency inhibited cell growth, survival, and metastasis, which was contrary to the effects of GRPEL2 overexpression. Moreover, GRPEL2 knockdown also exhibited anti-tumor activity in vivo. Therefore, GRPEL2 might be served as an oncogene and used as a novel biomarker for diagnosis, prognosis prediction, and targeted therapy.
As we known, uncontrolled cell growth and proliferation are the characteristics of HCC cells [20]. Functional experiments in our study showed that GRPEL2 knockdown obviously induced cell cycle arrest at G0/G1 phase and reduced the expression of regulators in cell cycle such as BUB1B [21], CCNB1 [22], BUB1 [23], and CDK1 [24]. In recent years, the activation of the NF-κB pathway signaling in cell growth has been well documented. Moreover, two NF-κB binding sites at the CCNB1 promoter have been identified [25,26]. Actually, the regulatory effect of GRPEL2 on the NF-κB signaling pathway was also observed in our study. This suggested that GRPEL2 could affect cell growth by regulating the transcription of regulators in cell cycle such as CCNB1 via NF-κB signaling pathway.
GRPEL2 is a second NEF regulating the mitochondrial import and redox homeostasis [11]. Mitochondria is the main source of ROS in cells and ROS has a strong positive correlation with MMP. Increasing ROS often causes the loss of MMP [27,28], which has been shown to participate in the induction of cell apoptosis [29]. Our results showed that GRPEL2 deficiency dramatically triggered ROS production, destroyed MMP, and promoted apoptosis, implying that GRPEL2 may regulate apoptosis through mitochondrial pathway. Recently, more and more studies have found the anti-apoptotic effect of NF-κB [30-32], which is consistent with the results of our study, indicating that GRPEL2 may play an anti-apoptotic role in HCC via NF-κB pathway.
Epithelial-mesenchymal transition (EMT) is a process in which cancer cells confer their invasive phenotypes, losing their epithelial properties and acquiring mesenchymal properties. During the EMT process, the polarization of cancer cells are destroyed, resulting in increasing cell motility [33,34]. Vascular endothelial growth factor (VEGF), a cytokine that promotes angiogenesis, has been considered to contribute to the metastasis of tumors [35,36]. VEGF secretion promoted EMT in many types of cancers [33,37,38]. Previous studies have revealed that VEGF production is a NF-κB-dependent process [39-41]. Our results showed the promoting effect of GRPEL2 on cell metastasis and NF-κB signaling pathway. Therefore, GRPEL2 may promote cell metastasis by initiating VEGF-induced EMT via key genes on NF-κB pathway, which needs to be validated by further work.
It should be noted that there are also several limitations for this study. For example, we need to validate the effect of GRPEL2 on cell metastasis using animal models.
In summary, this study firstly confirmed the oncogenic role of GRPEL2 in HCC progression and provided a rationale to develop GRPEL2-based diagnostic and prognostic tools. More importantly, these results suggested that therapeutically targeting GRPEL2 may have benefits on HCC patients.
Acknowledgements
This study was graciously supported by the Natural Science Foundation of Zhejiang Province (LQ20H030008) and the Research Unit Project of Chinese Academy of Medical Sciences (2019-I2M-5-030).
Disclosure of conflict of interest
None.
Supporting Information
References
- 1.Bray F, Ferlay J, Soerjomataram I, Siegel RL, Torre LA, Jemal A. Global cancer statistics 2018: GLOBOCAN estimates of incidence and mortality worldwide for 36 cancers in 185 countries. CA Cancer J Clin. 2018;68:394–424. doi: 10.3322/caac.21492. [DOI] [PubMed] [Google Scholar]
- 2.El-Serag HB, Rudolph KL. Hepatocellular carcinoma: epidemiology and molecular carcinogenesis. Gastroenterology. 2007;132:2557–2576. doi: 10.1053/j.gastro.2007.04.061. [DOI] [PubMed] [Google Scholar]
- 3.Fwu CW, Chien YC, You SL, Nelson KE, Kirk GD, Kuo HS, Feinleib M, Chen CJ. Hepatitis B virus infection and risk of intrahepatic cholangiocarcinoma and non-Hodgkin lymphoma: a cohort study of parous women in Taiwan. Hepatology. 2011;53:1217–1225. doi: 10.1002/hep.24150. [DOI] [PubMed] [Google Scholar]
- 4.Palmer DH. Sorafenib in advanced hepatocellular carcinoma. N Engl J Med. 2008;359:2498. [PubMed] [Google Scholar]
- 5.Cervello M, Bachvarov D, Lampiasi N, Cusimano A, Azzolina A, McCubrey JA, Montalto G. Molecular mechanisms of sorafenib action in liver cancer cells. Cell Cycle. 2012;11:2843–2855. doi: 10.4161/cc.21193. [DOI] [PubMed] [Google Scholar]
- 6.Tai WT, Cheng AL, Shiau CW, Huang HP, Huang JW, Chen PJ, Chen KF. Signal transducer and activator of transcription 3 is a major kinase-independent target of sorafenib in hepatocellular carcinoma. J Hepatol. 2011;55:1041–1048. doi: 10.1016/j.jhep.2011.01.047. [DOI] [PubMed] [Google Scholar]
- 7.Hsu CC, Tseng LM, Lee HC. Role of mitochondrial dysfunction in cancer progression. Exp Biol Med (Maywood) 2016;241:1281–1295. doi: 10.1177/1535370216641787. [DOI] [PMC free article] [PubMed] [Google Scholar]
- 8.Wallace DC. Mitochondria and cancer. Nat Rev Cancer. 2012;12:685–698. doi: 10.1038/nrc3365. [DOI] [PMC free article] [PubMed] [Google Scholar]
- 9.Schulz C, Schendzielorz A, Rehling P. Unlocking the presequence import pathway. Trends Cell Biol. 2015;25:265–275. doi: 10.1016/j.tcb.2014.12.001. [DOI] [PubMed] [Google Scholar]
- 10.Konovalova S, Liu X, Manjunath P, Baral S, Neupane N, Hilander T, Yang Y, Balboa D, Terzioglu M, Euro L, Varjosalo M, Tyynismaa H. Redox regulation of GRPEL2 nucleotide exchange factor for mitochondrial HSP70 chaperone. Redox Biol. 2018;19:37–45. doi: 10.1016/j.redox.2018.07.024. [DOI] [PMC free article] [PubMed] [Google Scholar]
- 11.Srivastava S, Savanur MA, Sinha D, Birje A, R V, Saha PP, D’Silva P. Regulation of mitochondrial protein import by the nucleotide exchange factors GrpEL1 and GrpEL2 in human cells. J Biol Chem. 2017;292:18075–18090. doi: 10.1074/jbc.M117.788463. [DOI] [PMC free article] [PubMed] [Google Scholar]
- 12.Naugler WE, Karin M. NF-kappaB and cancer-identifying targets and mechanisms. Curr Opin Genet Dev. 2008;18:19–26. doi: 10.1016/j.gde.2008.01.020. [DOI] [PMC free article] [PubMed] [Google Scholar]
- 13.Yamamoto Y, Gaynor RB. Therapeutic potential of inhibition of the NF-kappaB pathway in the treatment of inflammation and cancer. J Clin Invest. 2001;107:135–142. doi: 10.1172/JCI11914. [DOI] [PMC free article] [PubMed] [Google Scholar]
- 14.Greenbaum LE. Cell cycle regulation and hepatocarcinogenesis. Cancer Biol Ther. 2004;3:1200–1207. doi: 10.4161/cbt.3.12.1392. [DOI] [PubMed] [Google Scholar]
- 15.Breuhahn K, Longerich T, Schirmacher P. Dysregulation of growth factor signaling in human hepatocellular carcinoma. Oncogene. 2006;25:3787–3800. doi: 10.1038/sj.onc.1209556. [DOI] [PubMed] [Google Scholar]
- 16.Ge Y, Mu W, Ba Q, Li J, Jiang Y, Xia Q, Wang H. Hepatocellular carcinoma-derived exosomes in organotropic metastasis, recurrence and early diagnosis application. Cancer Lett. 2020;477:41–48. doi: 10.1016/j.canlet.2020.02.003. [DOI] [PubMed] [Google Scholar]
- 17.Zheng H, Zhang G, Zhang L, Wang Q, Li H, Han Y, Xie L, Yan Z, Li Y, An Y, Dong H, Zhu W, Guo X. Comprehensive review of web servers and bioinformatics tools for cancer prognosis analysis. Front Oncol. 2020;10:68. doi: 10.3389/fonc.2020.00068. [DOI] [PMC free article] [PubMed] [Google Scholar]
- 18.Hong H, Zhang W, Shen J, Su Z, Ning B, Han T, Perkins R, Shi L, Tong W. Critical role of bioinformatics in translating huge amounts of next-generation sequencing data into personalized medicine. Sci China Life Sci. 2013;56:110–118. doi: 10.1007/s11427-013-4439-7. [DOI] [PubMed] [Google Scholar]
- 19.Li L, Wang H. Heterogeneity of liver cancer and personalized therapy. Cancer Lett. 2016;379:191–197. doi: 10.1016/j.canlet.2015.07.018. [DOI] [PubMed] [Google Scholar]
- 20.Grbčić P, Car EPM, Sedić M. Targeting ceramide metabolism in hepatocellular carcinoma: new points for therapeutic intervention. Curr Med Chem. 2020;27:6611–6627. doi: 10.2174/0929867326666190911115722. [DOI] [PubMed] [Google Scholar]
- 21.Myslinski E, Gérard MA, Krol A, Carbon P. Transcription of the human cell cycle regulated BUB1B gene requires hStaf/ZNF143. Nucleic Acids Res. 2007;35:3453–3464. doi: 10.1093/nar/gkm239. [DOI] [PMC free article] [PubMed] [Google Scholar]
- 22.Zhang H, Zhang X, Li X, Meng WB, Bai ZT, Rui SZ, Wang ZF, Zhou WC, Jin XD. Effect of CCNB1 silencing on cell cycle, senescence, and apoptosis through the p53 signaling pathway in pancreatic cancer. J Cell Physiol. 2018;234:619–631. doi: 10.1002/jcp.26816. [DOI] [PubMed] [Google Scholar]
- 23.Bolanos-Garcia VM, Blundell TL. BUB1 and BUBR1: multifaceted kinases of the cell cycle. Trends Biochem Sci. 2011;36:141–150. doi: 10.1016/j.tibs.2010.08.004. [DOI] [PMC free article] [PubMed] [Google Scholar]
- 24.Santamaría D, Barrière C, Cerqueira A, Hunt S, Tardy C, Newton K, Cáceres JF, Dubus P, Malumbres M, Barbacid M. Cdk1 is sufficient to drive the mammalian cell cycle. Nature. 2007;448:811–815. doi: 10.1038/nature06046. [DOI] [PubMed] [Google Scholar]
- 25.Guttridge DC, Albanese C, Reuther JY, Pestell RG, Baldwin AS Jr. NF-kappaB controls cell growth and differentiation through transcriptional regulation of cyclin D1. Mol Cell Biol. 1999;19:5785–5799. doi: 10.1128/mcb.19.8.5785. [DOI] [PMC free article] [PubMed] [Google Scholar]
- 26.Hinz M, Krappmann D, Eichten A, Heder A, Scheidereit C, Strauss M. NF-kappaB function in growth control: regulation of cyclin D1 expression and G0/G1-to-S-phase transition. Mol Cell Biol. 1999;19:2690–2698. doi: 10.1128/mcb.19.4.2690. [DOI] [PMC free article] [PubMed] [Google Scholar]
- 27.Retta SF, Chiarugi P, Trabalzini L, Pinton P, Belkin AM. Reactive oxygen species: friends and foes of signal transduction. J Signal Transduct. 2012;2012:534029. doi: 10.1155/2012/534029. [DOI] [PMC free article] [PubMed] [Google Scholar]
- 28.Suski JM, Lebiedzinska M, Bonora M, Pinton P, Duszynski J, Wieckowski MR. Relation between mitochondrial membrane potential and ROS formation. Methods Mol Biol. 2012;810:183–205. doi: 10.1007/978-1-61779-382-0_12. [DOI] [PubMed] [Google Scholar]
- 29.Ly JD, Grubb DR, Lawen A. The mitochondrial membrane potential (deltapsi(m)) in apoptosis; an update. Apoptosis. 2003;8:115–128. doi: 10.1023/a:1022945107762. [DOI] [PubMed] [Google Scholar]
- 30.Beg AA, Sha WC, Bronson RT, Ghosh S, Baltimore D. Embryonic lethality and liver degeneration in mice lacking the RelA component of NF-kappa B. Nature. 1995;376:167–170. doi: 10.1038/376167a0. [DOI] [PubMed] [Google Scholar]
- 31.Bales KR, Du Y, Dodel RC, Yan GM, Hamilton-Byrd E, Paul SM. The NF-kappaB/Rel family of proteins mediates Abeta-induced neurotoxicity and glial activation. Brain Res Mol Brain Res. 1998;57:63–72. doi: 10.1016/s0169-328x(98)00066-7. [DOI] [PubMed] [Google Scholar]
- 32.Guo Q, Robinson N, Mattson MP. Secreted beta-amyloid precursor protein counteracts the proapoptotic action of mutant presenilin-1 by activation of NF-kappaB and stabilization of calcium homeostasis. J Biol Chem. 1998;273:12341–12351. doi: 10.1074/jbc.273.20.12341. [DOI] [PubMed] [Google Scholar]
- 33.Chen L, Lin G, Chen K, Liang R, Wan F, Zhang C, Tian G, Zhu X. VEGF promotes migration and invasion by regulating EMT and MMPs in nasopharyngeal carcinoma. J Cancer. 2020;11:7291–7301. doi: 10.7150/jca.46429. [DOI] [PMC free article] [PubMed] [Google Scholar]
- 34.Mittal V. Epithelial mesenchymal transition in tumor metastasis. Annu Rev Pathol. 2018;13:395–412. doi: 10.1146/annurev-pathol-020117-043854. [DOI] [PubMed] [Google Scholar]
- 35.Yang X, Zhang Y, Hosaka K, Andersson P, Wang J, Tholander F, Cao Z, Morikawa H, Tegnér J, Yang Y, Iwamoto H, Lim S, Cao Y. VEGF-B promotes cancer metastasis through a VEGF-A-independent mechanism and serves as a marker of poor prognosis for cancer patients. Proc Natl Acad Sci U S A. 2015;112:E2900–2909. doi: 10.1073/pnas.1503500112. [DOI] [PMC free article] [PubMed] [Google Scholar]
- 36.Claffey KP, Robinson GS. Regulation of VEGF/VPF expression in tumor cells: consequences for tumor growth and metastasis. Cancer Metastasis Rev. 1996;15:165–176. doi: 10.1007/BF00437469. [DOI] [PubMed] [Google Scholar]
- 37.Fantozzi A, Gruber DC, Pisarsky L, Heck C, Kunita A, Yilmaz M, Meyer-Schaller N, Cornille K, Hopfer U, Bentires-Alj M, Christofori G. VEGF-mediated angiogenesis links EMT-induced cancer stemness to tumor initiation. Cancer Res. 2014;74:1566–1575. doi: 10.1158/0008-5472.CAN-13-1641. [DOI] [PubMed] [Google Scholar]
- 38.Gonzalez-Moreno O, Lecanda J, Green JE, Segura V, Catena R, Serrano D, Calvo A. VEGF elicits epithelial-mesenchymal transition (EMT) in prostate intraepithelial neoplasia (PIN)-like cells via an autocrine loop. Exp Cell Res. 2010;316:554–567. doi: 10.1016/j.yexcr.2009.11.020. [DOI] [PubMed] [Google Scholar]
- 39.Greenberger S, Adini I, Boscolo E, Mulliken JB, Bischoff J. Targeting NF-κB in infantile hemangioma-derived stem cells reduces VEGF-A expression. Angiogenesis. 2010;13:327–335. doi: 10.1007/s10456-010-9189-6. [DOI] [PMC free article] [PubMed] [Google Scholar]
- 40.Kiriakidis S, Andreakos E, Monaco C, Foxwell B, Feldmann M, Paleolog E. VEGF expression in human macrophages is NF-kappaB-dependent: studies using adenoviruses expressing the endogenous NF-kappaB inhibitor IkappaBalpha and a kinase-defective form of the IkappaB kinase 2. J Cell Sci. 2003;116:665–674. doi: 10.1242/jcs.00286. [DOI] [PubMed] [Google Scholar]
- 41.Schmidt D, Textor B, Pein OT, Licht AH, Andrecht S, Sator-Schmitt M, Fusenig NE, Angel P, Schorpp-Kistner M. Critical role for NF-kappaB-induced JunB in VEGF regulation and tumor angiogenesis. EMBO J. 2007;26:710–719. doi: 10.1038/sj.emboj.7601539. [DOI] [PMC free article] [PubMed] [Google Scholar]
Associated Data
This section collects any data citations, data availability statements, or supplementary materials included in this article.


