

Abstract
We report on molecular analyses of baseline tumor samples from the phase 3 JAVELIN Renal 101 trial (N=886; NCT02684006), which demonstrated significantly prolonged progression-free survival (PFS) with first-line avelumab + axitinib vs sunitinib in advanced renal cell carcinoma (aRCC). We found that neither expression of the commonly assessed biomarker PD-L1 nor tumor mutational burden differentiated PFS in either study arm. Similarly, the presence of FcɣR SNPs was unimpactful. We identified important biological features associated with differential PFS between the treatment arms, including novel immunomodulatory and angiogenesis gene expression signatures (GES), previously undescribed mutational profiles and their corresponding GES, and several HLA types. These findings provide insight into the determinants of response to combined PD-1/PD-L1 and angiogenic pathway inhibition and may aid in the development of strategies for improved patient care in aRCC.
Reporting summary.
Further information on research design is available in the Nature Research Reporting Summary linked to this article.
Introduction
The randomized phase 3 JAVELIN Renal 101 trial (NCT02684006) demonstrated prolonged progression-free survival (PFS) with the combination of avelumab (anti–PD-L11) + axitinib (tyrosine kinase inhibitor [TKI] targeting vascular endothelial growth factor [VEGF] receptors [VEGFRs] 1, 2, and 3) vs sunitinib (multitarget TKI) in previously untreated patients with advanced renal cell carcinoma (aRCC); overall survival analysis is ongoing2. The current study explored the biology associated with response to treatment with combination immune checkpoint inhibitor (ICI) + VEGFR TKI or VEGFR TKI alone in aRCC. With a total of 886 patients, JAVELIN Renal 101 is robust enough to yield insight. We report on prospectively defined molecular analyses of baseline tissue samples from patients enrolled in JAVELIN Renal 101 and their correlation with investigator-assessed PFS, based on a data cutoff of June 20, 2018. Most tissue samples analyzed (≈63%) were collected during nephrectomy; the remainder were from metastatic sites (Supplementary Table 1). Through whole exome sequencing (WES), gene expression profiling, and immunohistochemistry (IHC), we define features that differentiate outcomes for first-line ICI + VEGFR TKI combination therapy in aRCC, provide a novel basis for additional biological investigations into the responses to these agents, and inform personalized therapy strategies for patients with aRCC.
Results
Differential PFS with anti-angiogenic treatment in the presence of PD-L1+ or CD8+ cells
IHC analysis using the Ventana PD-L1 (SP263) assay showed that 69% (554/804) of samples were PD-L1+ (staining of any intensity on immune cells [ICs] occupying ≥1% of the tumor area [see Methods]). Following application of a 1% tumor cell (TC) algorithm, 218/812 (27%) were considered PD-L1+; most (196/212 [92%]) TC-PD-L1+ samples were also PD-L1+ per IC-based scoring criteria. PD-L1 expression on ICs did not differentiate PFS in the avelumab + axitinib arm (HR 0.89; 95% CI 0.652, 1.220; p=0.4734) (Fig. 1a). PFS was shorter among patients with PD-L1+ tumors relative to those with PD-L1− tumors in the sunitinib arm (HR 1.57; 95% CI 1.156, 2.142; p=0.0037). Similar trends were observed at IC PD-L1 expression thresholds of 5% and 10% or at TC thresholds of 1%, 10%, and 25% (Supplementary Table 2). Neither incorporation of a TC component into the PD-L1 algorithm nor elevation of the threshold on either TCs or ICs enhanced the predictivity of PD-L1 assessment.
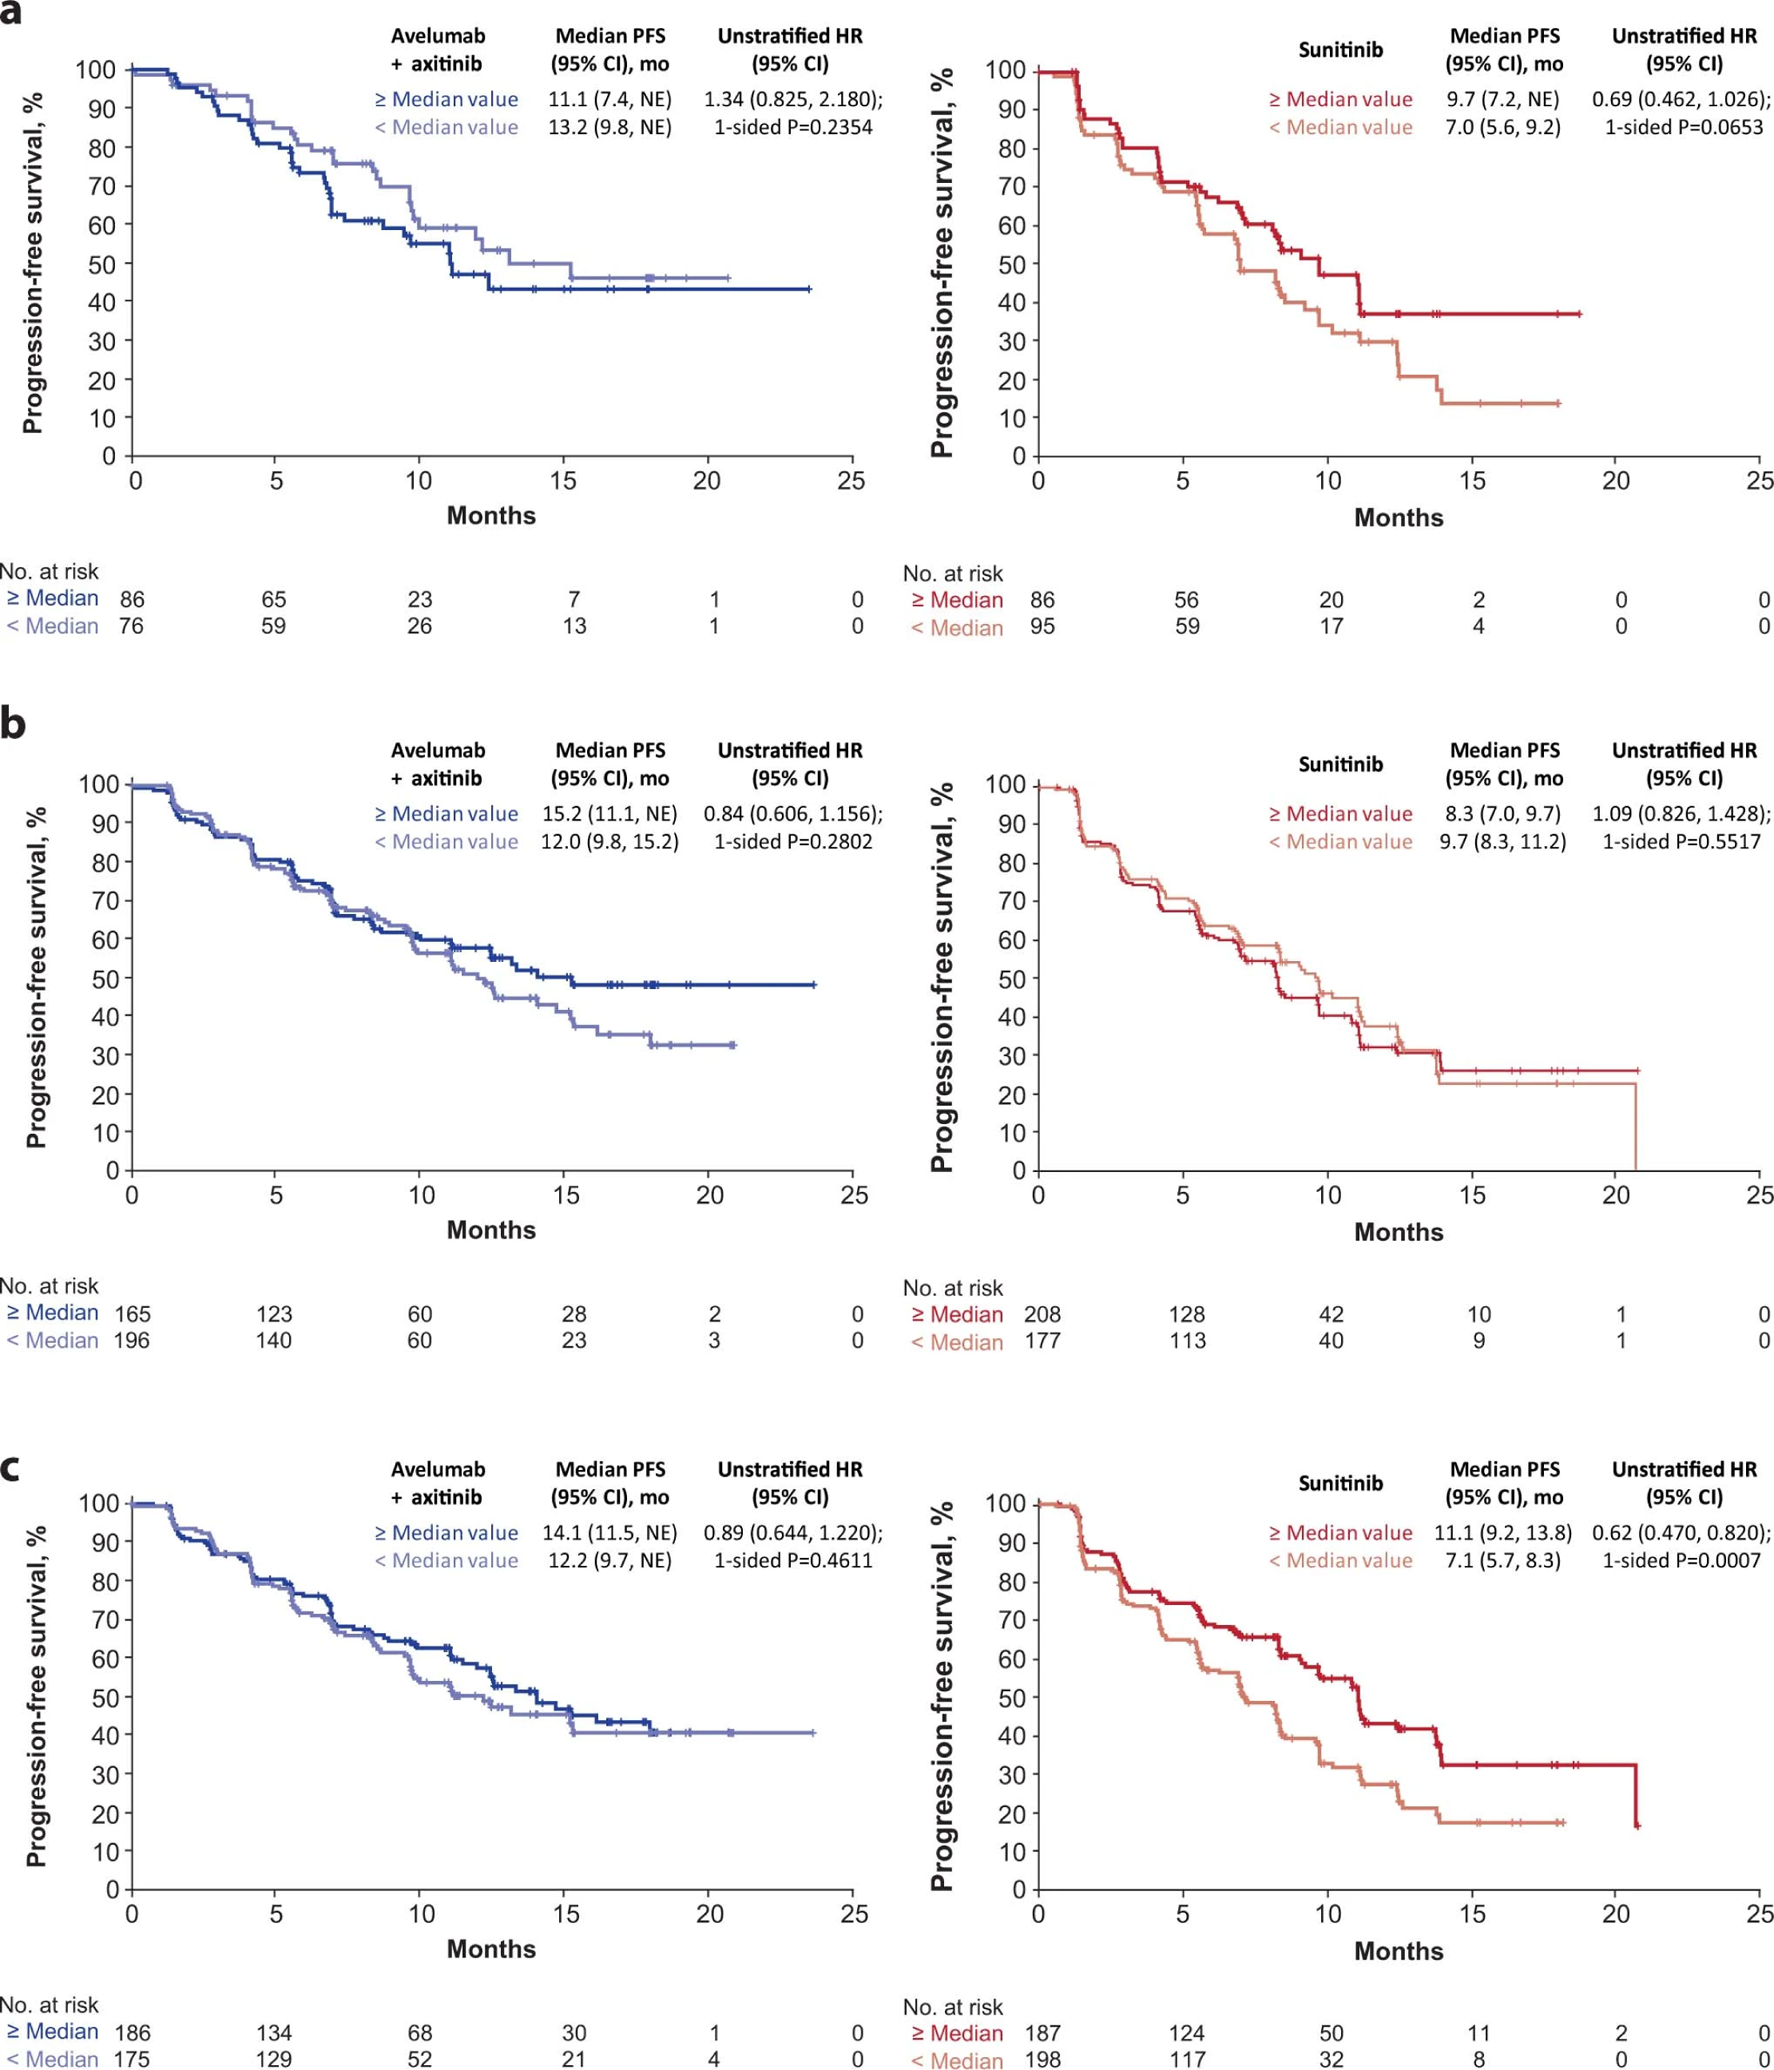
Figure 1.
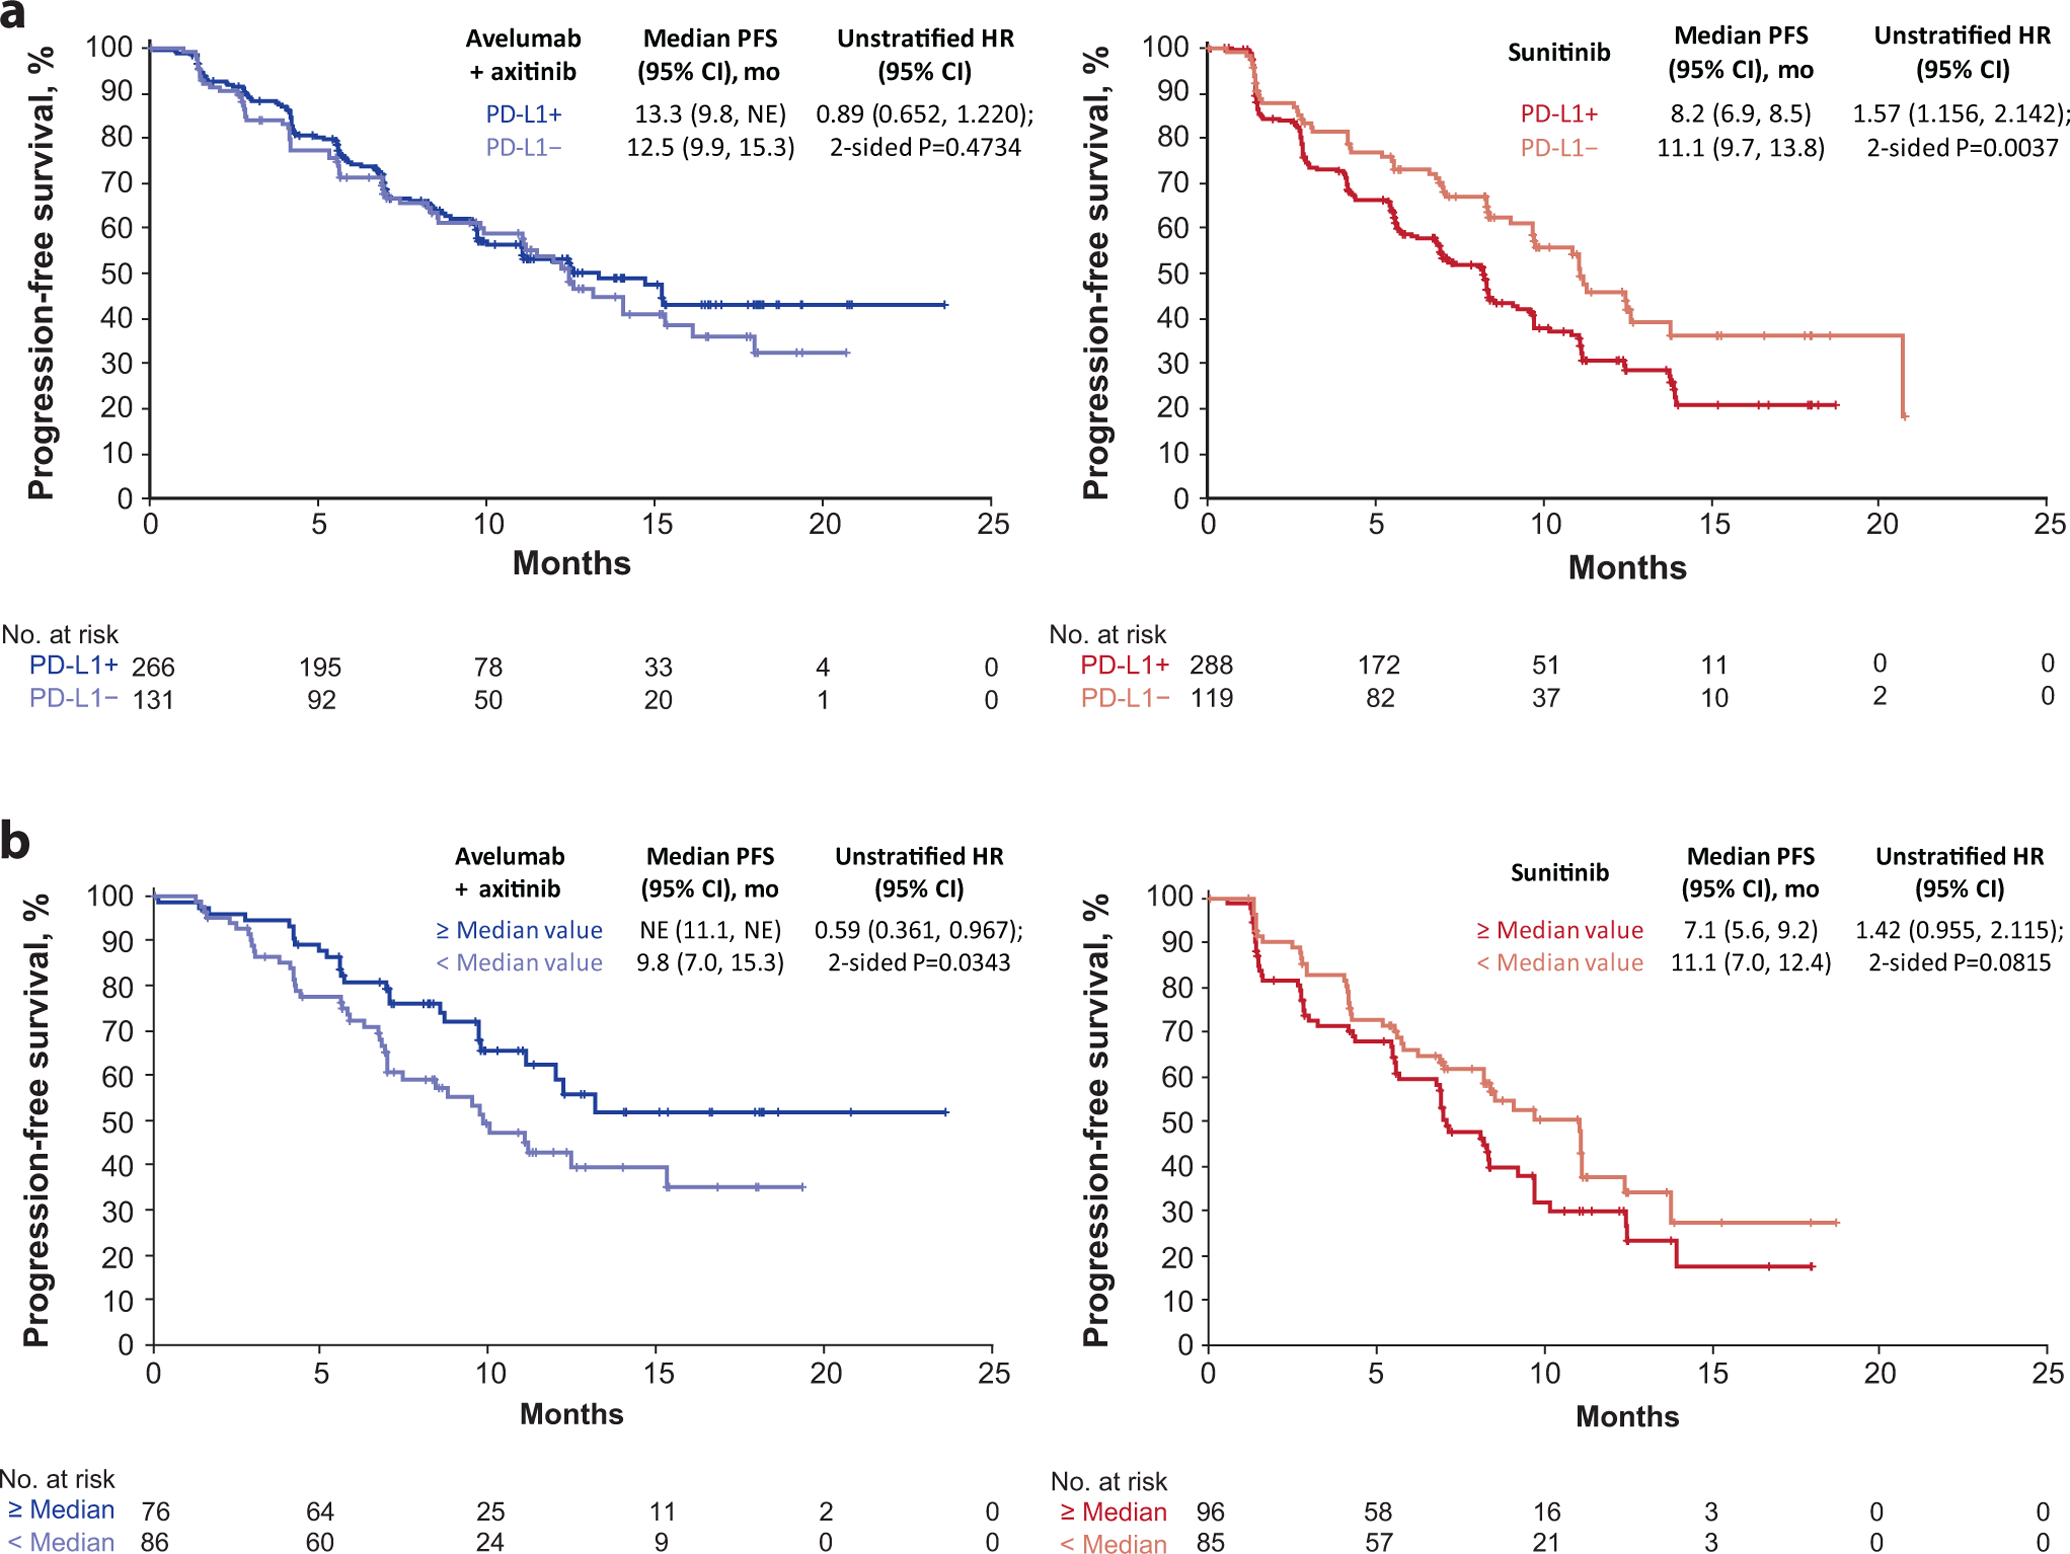
Progression-free survival (PFS) according to (a) programmed cell death ligand 1 (PD-L1) expression and (b) median invasive margin surface area by immunohistochemistry (Cox proportional hazards model with two-sided log rank test). HR, hazard ratio; NE, not estimable.
We examined the relationship between PFS and the presence of CD8+ cells within regions of the tumor: the total tumor area, tumor center, and the invasive margin (IM; see Methods). The proportion of CD8+ cells present within a given tumor region ranged from a median of 1.43% (n=746) within the total tumor area to 74.0% (n=343) within the IM (Supplementary Table 3). The median surface area of the IM was similar across all patients (13.28 mm2 in the combination arm [n=361] and 13.57 mm2 in the sunitinib arm [n=385]), however, the combination arm displayed a non-significant trend toward greater CD8+ cell density at the IM (median 78.5% vs 69.9% respectively). Among patients whose tumors contained ≥ median IM surface area, PFS was longer in the combination arm (HR 0.59; 95% CI 0.361, 0.967; p=0.0343) and trended shorter in the sunitinib arm relative to those with < median IM area (HR 1.42; 95% CI 0.955, 2.115; p=0.0815) (Fig. 1b). Longer PFS was observed in the sunitinib arm for patients whose tumors had greater abundance of CD8+ cells within the tumor center (HR 0.62; 95% CI 0.470, 0.820; p=0.0007) as well as a non-significant trend favoring higher CD8+ cell density within the IM (HR 0.69; CI 0.462, 1.026, p=0.0653) (Extended Data Fig. 1 and Supplementary Table 4).
No association between PFS and CD8+ cells in any tumor region was observed in the combination arm, however, compared with any similar sunitinib-treated group, longer median PFS was observed, underscoring the interdependence of TC/IC interactions in mediating responses to anti-angiogenic treatments + immunotherapy3. Extended Data Fig. 2 shows representative images of CD8 IHC.
Immune cell type-specific gene expression profiles and metabolic pathway activity were associated with treatment-specific effects on PFS
Deconvolution analysis of 22 IC types within the tumor microenvironment showed none had a nominal p-value <0.05 in relation to PFS observed in the combination arm; only CD8+ T-cells had a nominal interaction term p-value <0.05, consistent with the CD8 IHC results (Extended Data Fig. 3 and Supplementary Table 5).
A co-expression network analysis identified biological network modules from baseline transcriptomic data (Supplementary Table 6). Network analyses identified 23 clusters, including 4 metabolic pathways: oxygen transport, lipid metabolism, organic acid metabolism, and glucocorticoid metabolism (Extended Data Fig. 4). Oxygen transport and lipid metabolism had a nominal p-value <0.05 in the survival model, and higher expression was associated with a trend toward improved PFS in the combination arm (Extended Data Figs. 5 and 6).
Evaluation of KEGG metabolic pathways (ie, glycolysis, TCA/Kreb cycle, fatty acid biosynthesis, pentose phosphate, and AMPK signaling pathways) previously associated with survival in RCC4 found no significant association with PFS in the combination arm. However, for the glycolysis and pentose phosphate pathways, the trend was consistent with the reference article. In the sunitinib arm, four pathways (TCA/Kreb cycle, fatty acid biosynthesis, pentose phosphate, and AMPK pathways) were consistent with the reference article, with the TCA cycle and AMPK pathways reaching significant nominal p-values (Supplementary Table 7).
Novel and previously defined immune- and angiogenesis-associated gene expression signatures enriched for extended treatment-specific effects on PFS
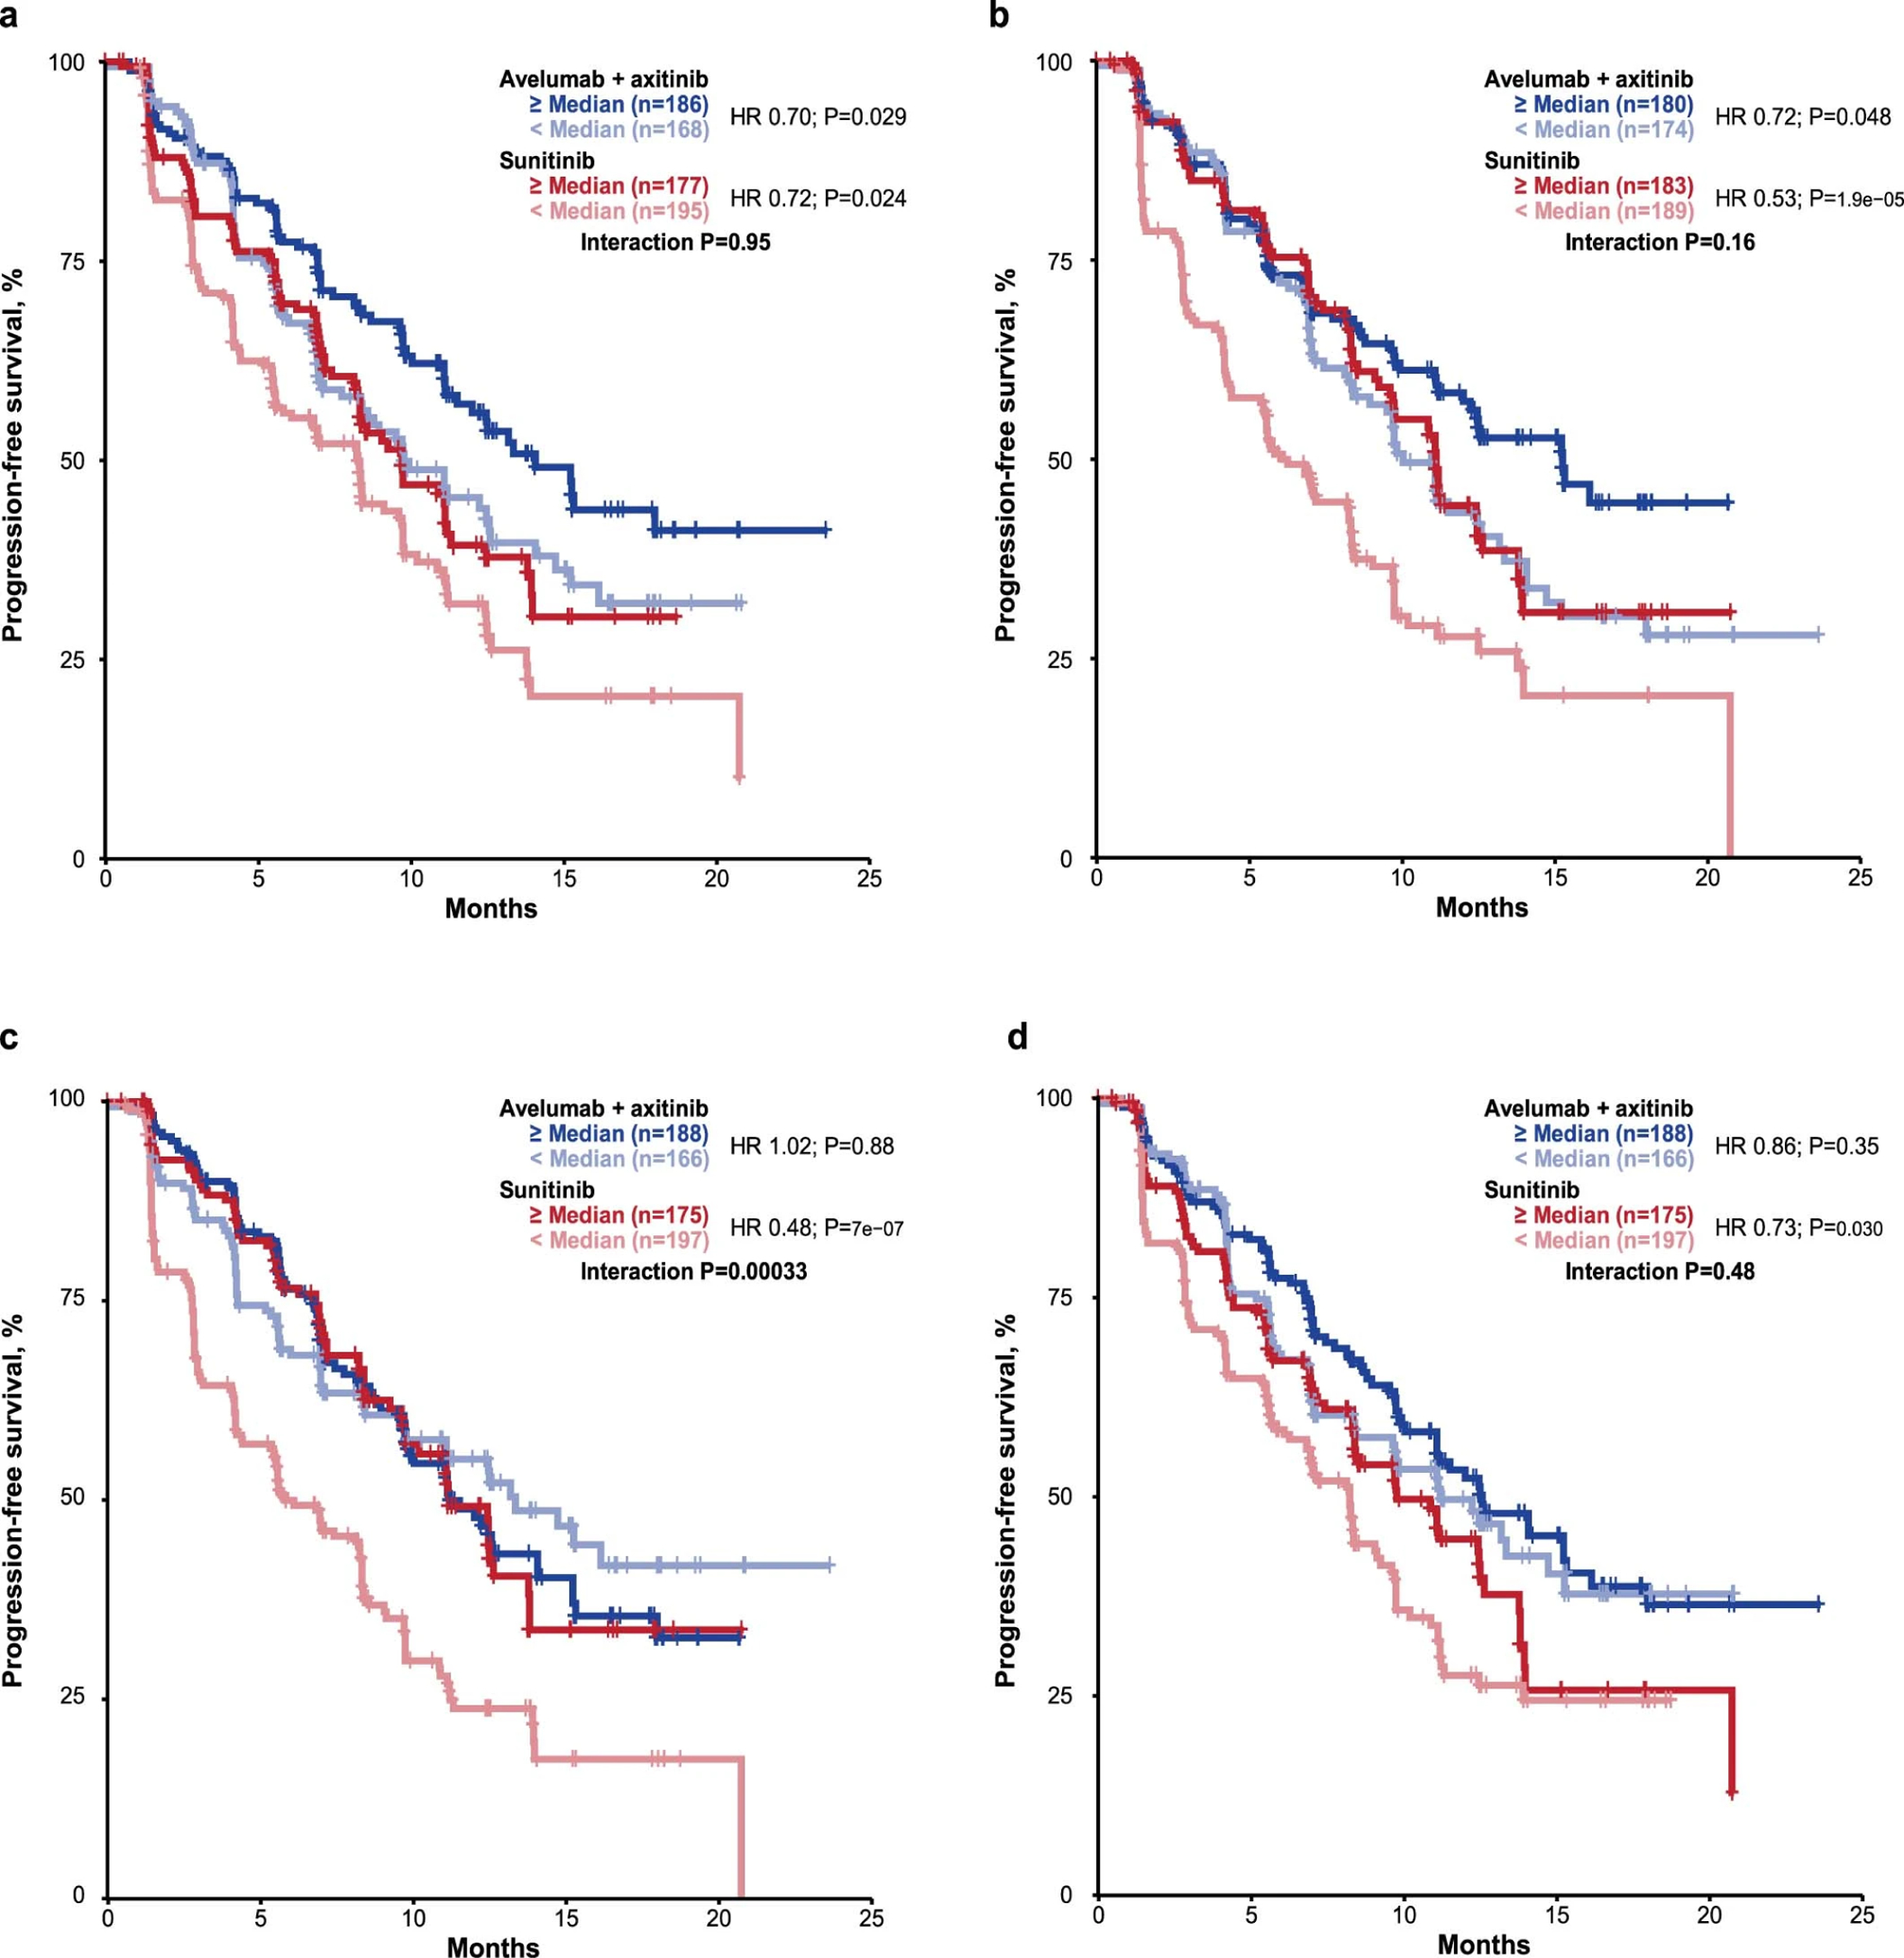
Following the co-expression and network analyses, we found elevated expression of an immune response cluster in patients with prolonged PFS in the combination arm compared to those without. Refinement of the module based on expression of genes most significantly associated with improved PFS in the combination arm identified a 26-gene subset, herein referred to as the “Renal 101 Immuno signature” (see Methods). This gene expression signature (GES) comprised regulators of both adaptive and innate immune responses (T cell and NK cell), cell trafficking, and inflammation (Table 1), but displayed limited overlap with published GESs, including the IMmotion 150 Teff signature3 and the interferon (IFN)-γ signature5. Patients with ≥ median expression of the Renal 101 Immuno signature had longer PFS than those with < median expression in the avelumab + axitinib arm (HR 0.60; 95% CI 0.439, 0.834]; p=0.0019), but the signature did not differentiate PFS in the sunitinib arm (HR 0.89; 95% CI 0.670, 1.172; p=0.3973) (Fig. 2a). The robustness and clinical relevance of the Renal 101 Immuno signature was verified in an independent dataset from the JAVELIN Renal 100 study, an uncontrolled single-arm phase 1b trial6; ≥ median expression of the signature was associated with improved PFS (HR 0.36; 95% CI 0.157, 0.805; p=0.0097) (Fig. 2b). Further testing of Renal 101 Immuno in mixed-cohort data from the phase 1 JAVELIN Solid Tumor trial of avelumab monotherapy1,7 revealed that the signature performed similarly, with high expression associated with improved PFS (continuous Cox PH p=0.007) (Supplementary Fig. 1).
Table 1.
26-gene JAVELIN Renal 101 Immuno signature
| Function | Gene |
|---|---|
| T-cell receptor signaling | CD3G, CD3E, CD8B, THEMIS, TRAT1, GRAP2, CD247 |
| T-cell activation, proliferation, and differentiation | CD2, * CD96, * PRF1, * CD6, IL7R, ITK, GPR18, EOMES, SIT1, NLRC3 |
| Natural killer cell mediated cytotoxicity | CD2, * CD96, * PRF1, * CD244, KLRD1, SH2D1A |
| Chemokine | CCL5, XCL2 |
| Other immune response genes | CST7, GFI1, KCNA3, PSTPIP1 |
Genes included in > 1 functional group.
Figure 2.
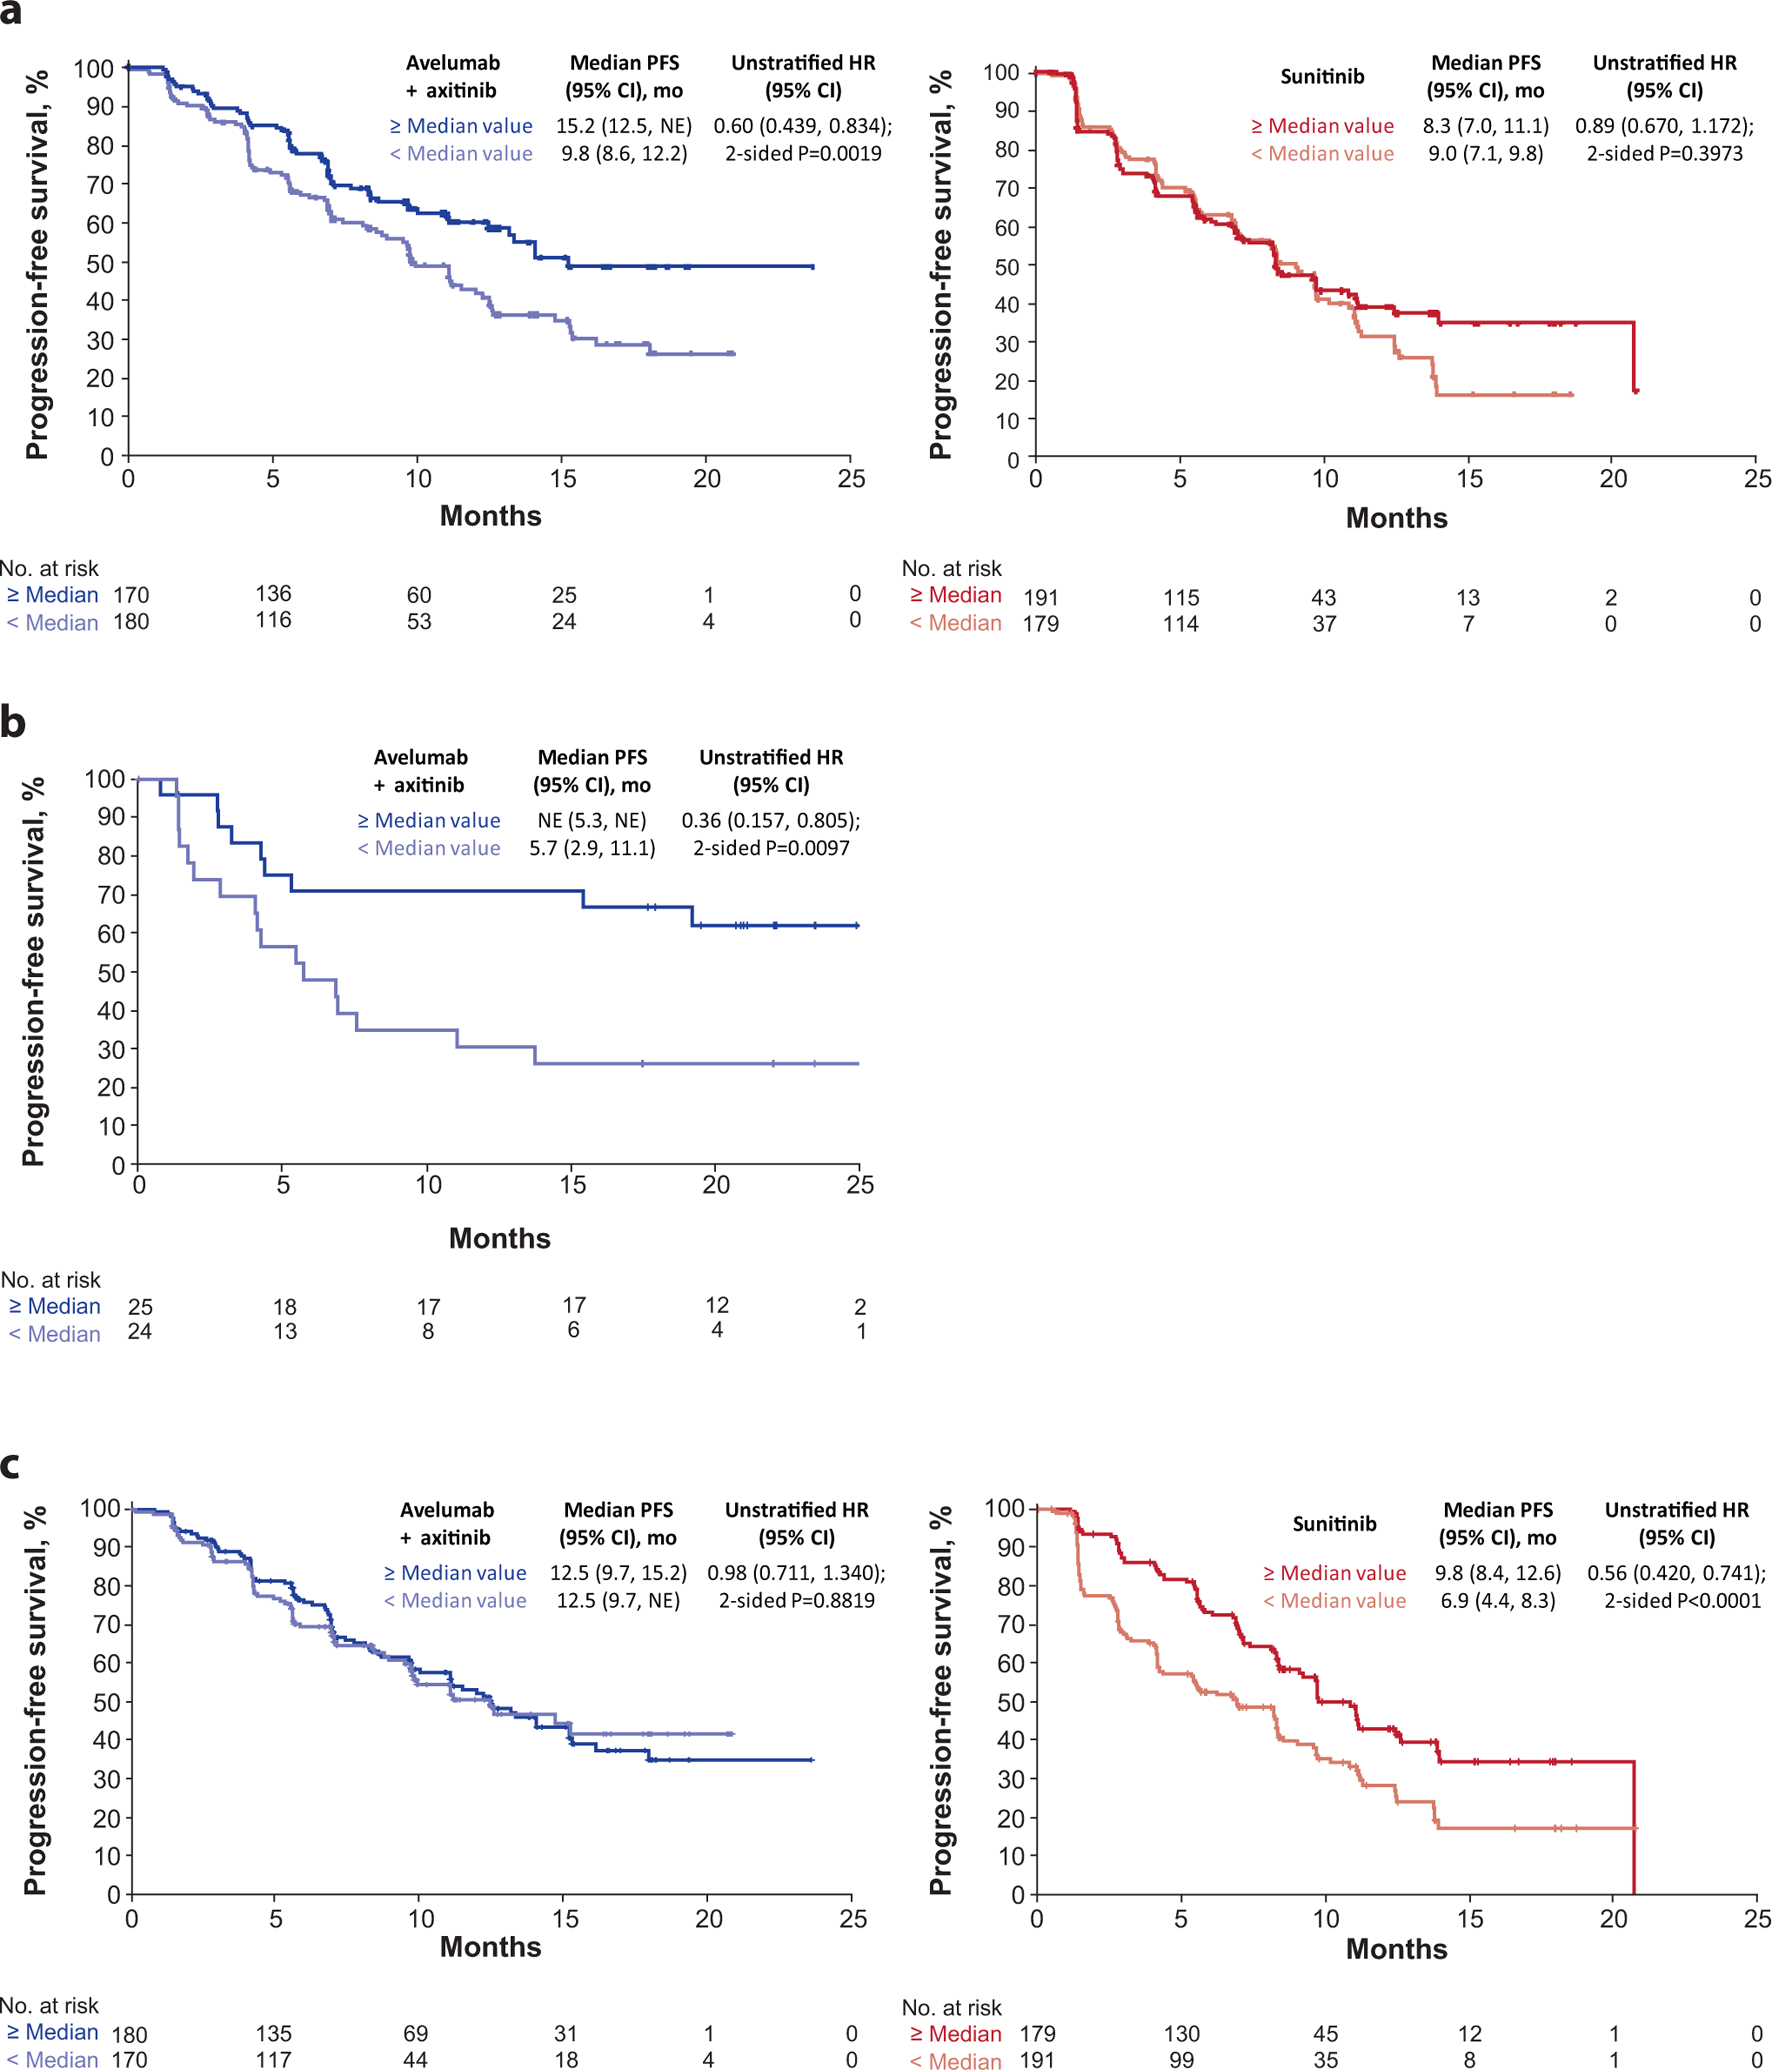
Progression-free survival (PFS) according to (a) 26-gene JAVELIN Renal 101 Immuno signature, (b) validation of the signature in an independent dataset, and (c) PFS according to JAVELIN Renal 101 Angio signature (Cox proportional hazard model with two-sided log rank test). HR, hazard ratio; NE, not estimable.
Gene expression data interrogation using a method similar to that used to define the Renal 101 Immuno signature identified a 26-gene angiogenesis GES (Supplementary Table 8; referred to as the Renal 101 Angio signature) that significantly differentiated PFS in the sunitinib arm (HR 0.56; 95% CI 0.420, 0.741; p<0.0001) but not the avelumab + axitinib arm (HR 0.98; 95% CI 0.711, 1.340; p=0.8819) (Fig. 2c).
Application of published GESs in aRCC to PFS data from JAVELIN Renal 101 showed ≥ median expression of the IMmotion 150 Teff GES3 in the avelumab + axitinib arm was associated with a trend toward longer PFS than the sunitinib arm (HR 0.79; 95% CI 0.58, 1.08; p=0.1446) (Fig. 3), whereas ≥ median expression of the IMmotion 150 angiogenesis GES in the sunitinib arm was associated with longer PFS (HR 0.64; 95% CI 0.48, 0.85, p=0.0018), but did not differentiate PFS in the avelumab + axitinib arm (HR 1.00; 95% CI 0.73, 1.38, p=0.9916). The IMmotion 150 myeloid inflamed GES did not differentiate PFS in either arm (avelumab + axitinib arm: HR 1.15; 95% CI 0.83, 1.59; p=0.4096; sunitinib arm: HR 1.18, 95% CI 0.89, 1.57; p=0.2540). In contrast to the observations in the IMmotion150 study, expression of the combined Teffhigh/myeloid inflamedhigh GES did not differentiate PFS in either arm (avelumab + axitinib arm: HR 1.22; 95% CI 0.89, 1.68; p=0.2076; sunitinib arm: HR 1.20; 95% CI 0.90, 1.59; p=0.2116) suggesting that the specific effect of myeloid-related immune resistance may be most marked with ICI monotherapy3.
Figure 3.
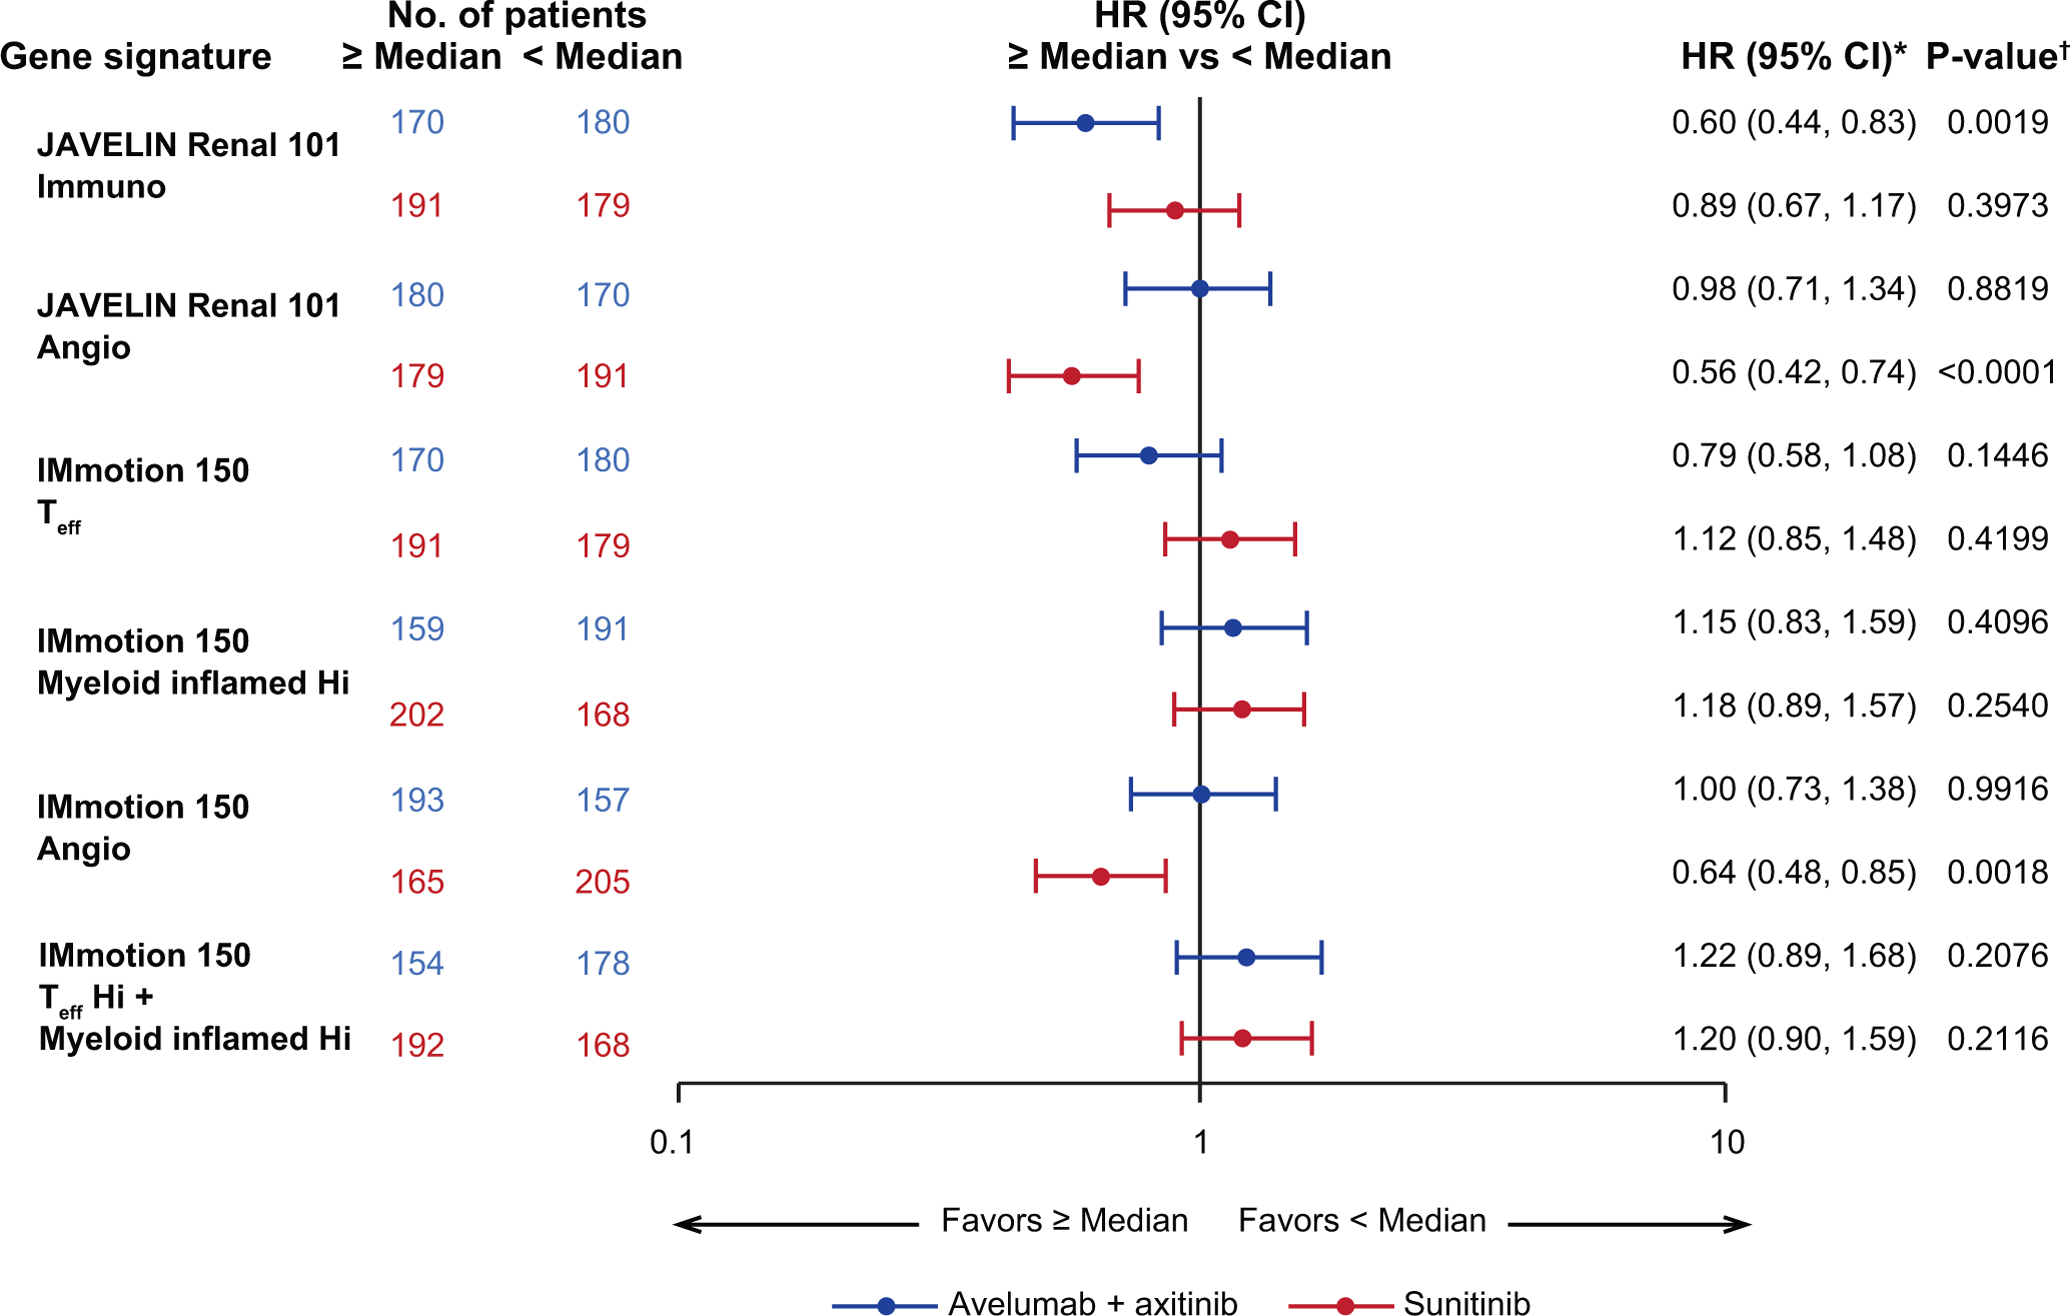
Progression-free survival (PFS) in JAVELIN Renal 101 patients according to expression of gene signatures3. Angio, angiogenesis; Hi, high; Seq, sequencing; Teff, effector T-cell. * Cox proportional hazards model with < Median as the reference group was used to calculate hazard ratio (HR) and 95% CI. HR < 1 indicates better survival in the ≥ median group, while HR > 1 indicates better survival in the < median group. † Two-sided log-rank test was performed to compare overall median cutoff groups.
Reduced MHC I gene expression may impact antigen presentation and PFS
Association between the immune-related GES and extended PFS in the combination arm raised the question of whether antigen presentation or MHC expression might also impact PFS. Although its relevance in the context aRCC is unknown, the DUX4 transcription factor and 6-gene GES (ZSCAN4, PRAMEF1, TRIM51, KHDC1L, MBD3L2 and TRIM43) have been implicated as suppressors of MHC class I expression associated with resistance to anti–CTLA-4 therapy8,9. The clinical relevance of the DUX4 GES, was examined through its relation to PFS (n=720). Among the 46 patients with high expression of the DUX4 GES, a trend toward reduced PFS was observed in the combination arm (HR 1.55; 95% CI 0.930, 2.591; p=0.0925) while PFS was not differentiated in the sunitinib arm (HR 1.12; 95% CI 0.585, 2.149; p=0.6552) (Supplementary Fig. 2). Further examination of the DUX4 GES in patients with high expression revealed significantly reduced expression of HLA-A, -B, and -C relative to low expression (Extended Data Fig. 7).
HLA type can impact PFS in both arms, but TMB does not
The potential relationship between antigen presentation, immune recognition, and clinical benefit was further explored through WES analysis of the distribution of HLA types. Of the HLA alleles present in ≥5% of patients, 5 (A*01:01, A*03:01, B*40:02, B*57:01 and C*06:02) were associated with treatment arm-specific differences in PFS (Extended Data Fig. 8). HLA allele frequency observed in this study is shown in Supplementary Fig. 3.
The clinical significance of tumor mutational burden (TMB) was assessed through WES analysis. The presence of non-synonymous single nucleotide variants per megabase (NSSNV/Mb) defined the TMB high and low status relative to the median value (5.95 NSSNV/Mb) derived from all evaluable patient samples in both treatment arms. TMB was distributed evenly across treatment arms: 182/366 patients (49.7%) in the combination arm and 186/372 (50.0%) in the sunitinib arm had < median TMB, and 184/366 patients (50.3%) in the combination arm and 186/372 (50.0%) in the sunitinib arm had ≥ median TMB (Supplementary Table 9). TMB was not associated with the presence of other known mutations in RCC, such as VHL or PBRM13, and did not differentiate PFS in either arm (avelumab + axitinib arm: HR 1.09; 95% CI 0.79, 1.50; p=0.6084; sunitinib arm: HR 0.79; 95% CI 0.60, 1.05; p=0.1092). Similarly, the presence of indels did not differentiate PFS in either arm. Tumor purity (median, 75%) was estimated from an H&E Pathology review (N=739 samples with WES data; samples with multiple values were averaged), (Supplementary Fig. 4). Published methods4 were used to determine the tumor heterogeneity MATH score, and no association between tumor heterogeneity and PFS was observed (Supplementary Fig. 5).
Fcɣ receptor polymorphisms do not impact PFS
Avelumab, an unmodified IgG1 isotype, retains Fc receptor engagement potential. To explore whether Fc receptor-elicited effector functions might contribute to the antitumor activity of the combination, we analyzed the correlation between the presence of naturally occurring polymorphisms in Fcɣ receptor genes FCGR2A and FCGR3A, which alter the affinity of each respective receptor for IgG110, and differences in PFS. The highest-affinity homozygous variants were identified in the proportion of patients expected from global populations (10–20%)10, but these polymorphisms were not associated with significant differences in PFS in either arm (Extended Data Fig. 9).
Elastic net combinatorial biomarker approach enhanced retrospective predictivity, but failed validation in an independent data set
To investigate whether biomarker combinations could enhance predictivity, we performed an elastic net analysis to build a multiparameter model, and 2 runs were completed. The first included the parameters CD8 IHC, PD-L1 IHC, FcɣR SNPs, TMB, age, sex, co-expression clusters, and LM22 immune cell signatures. The analysis was trained on 142 samples from the combination arm out of 308 total samples with complete data (Supplementary Fig. 6). The second included co-expression clusters and LM22 immune cell signatures, using 354 of 727 samples from the combination arm (Supplementary Fig. 7). These analyses identified a combination of features predictive (retrospectively) of response in JAVELIN Renal 101 study data. However, neither run was validated when tested in the independent JAVELIN Renal 100 dataset.
Mutations in independent genes are associated with prolonged PFS in the combination arm
The impact of mutations in genes with clinical relevance to RCC in other studies, including BAP1, PBRM1, MTOR, and VHL, was examined using WES, however, none were associated with significant differences in PFS in either arm. Our analyses did identify protein altering mutations in 11 other genes that were associated with treatment arm-specific differences in PFS. Mutations in PTEN were associated with reduced PFS in the avelumab + axitinib arm (HR 2.64; 95% CI 1.56, 4.46; p=0.0002), but did not differentiate PFS in the sunitinib arm (HR 1.20; 95% CI 0.74, 1.93; p=0.4571) (Fig. 4a). Mutations in the remaining 10 genes were associated with prolonged PFS in the avelumab + axitinib arm but have not previously been linked to the biology of RCC. The gene list is functionally diverse and comprises CD163L1 (encodes a scavenger receptor found mainly on macrophages), DNMT1 (encodes a DNA methyltransferase), IL16 (encodes a pleiotropic cytokine; chemoattractant and modulator of T cell activation), SPATA31C2 (encodes a testis-specific protein), MYH7B (encodes a myosin heavy chain), STAB2 (encodes a protein associated with inflammation), CROCC2 (LOC728763; encodes an uncharacterized protein), FOXO1 (encodes a transcription factor), ABCA1 (encodes a transporter), and MC1R (encodes a G-protein coupled receptor; may play a role in an anti-inflammatory response). While mutations in each of these specific genes were associated with extended PFS in the combination arm, mutations in CD163L1, MC1R, and DNMT1 were also associated with shorter PFS in the sunitinib arm (Fig. 4b). An unranked list of 2613 genes with mutations present in ≥4% of the study population is included in Supplementary Table 10. A volcano plot of these genes highlighting HR and p-value for mutant samples relative to wild-type samples in the combination arm as well as in models including an interaction term between treatment arms vs mutational status is shown in Fig. 4c. Following multiplicity adjustment, no genes reached statistical significance.
Figure 4.
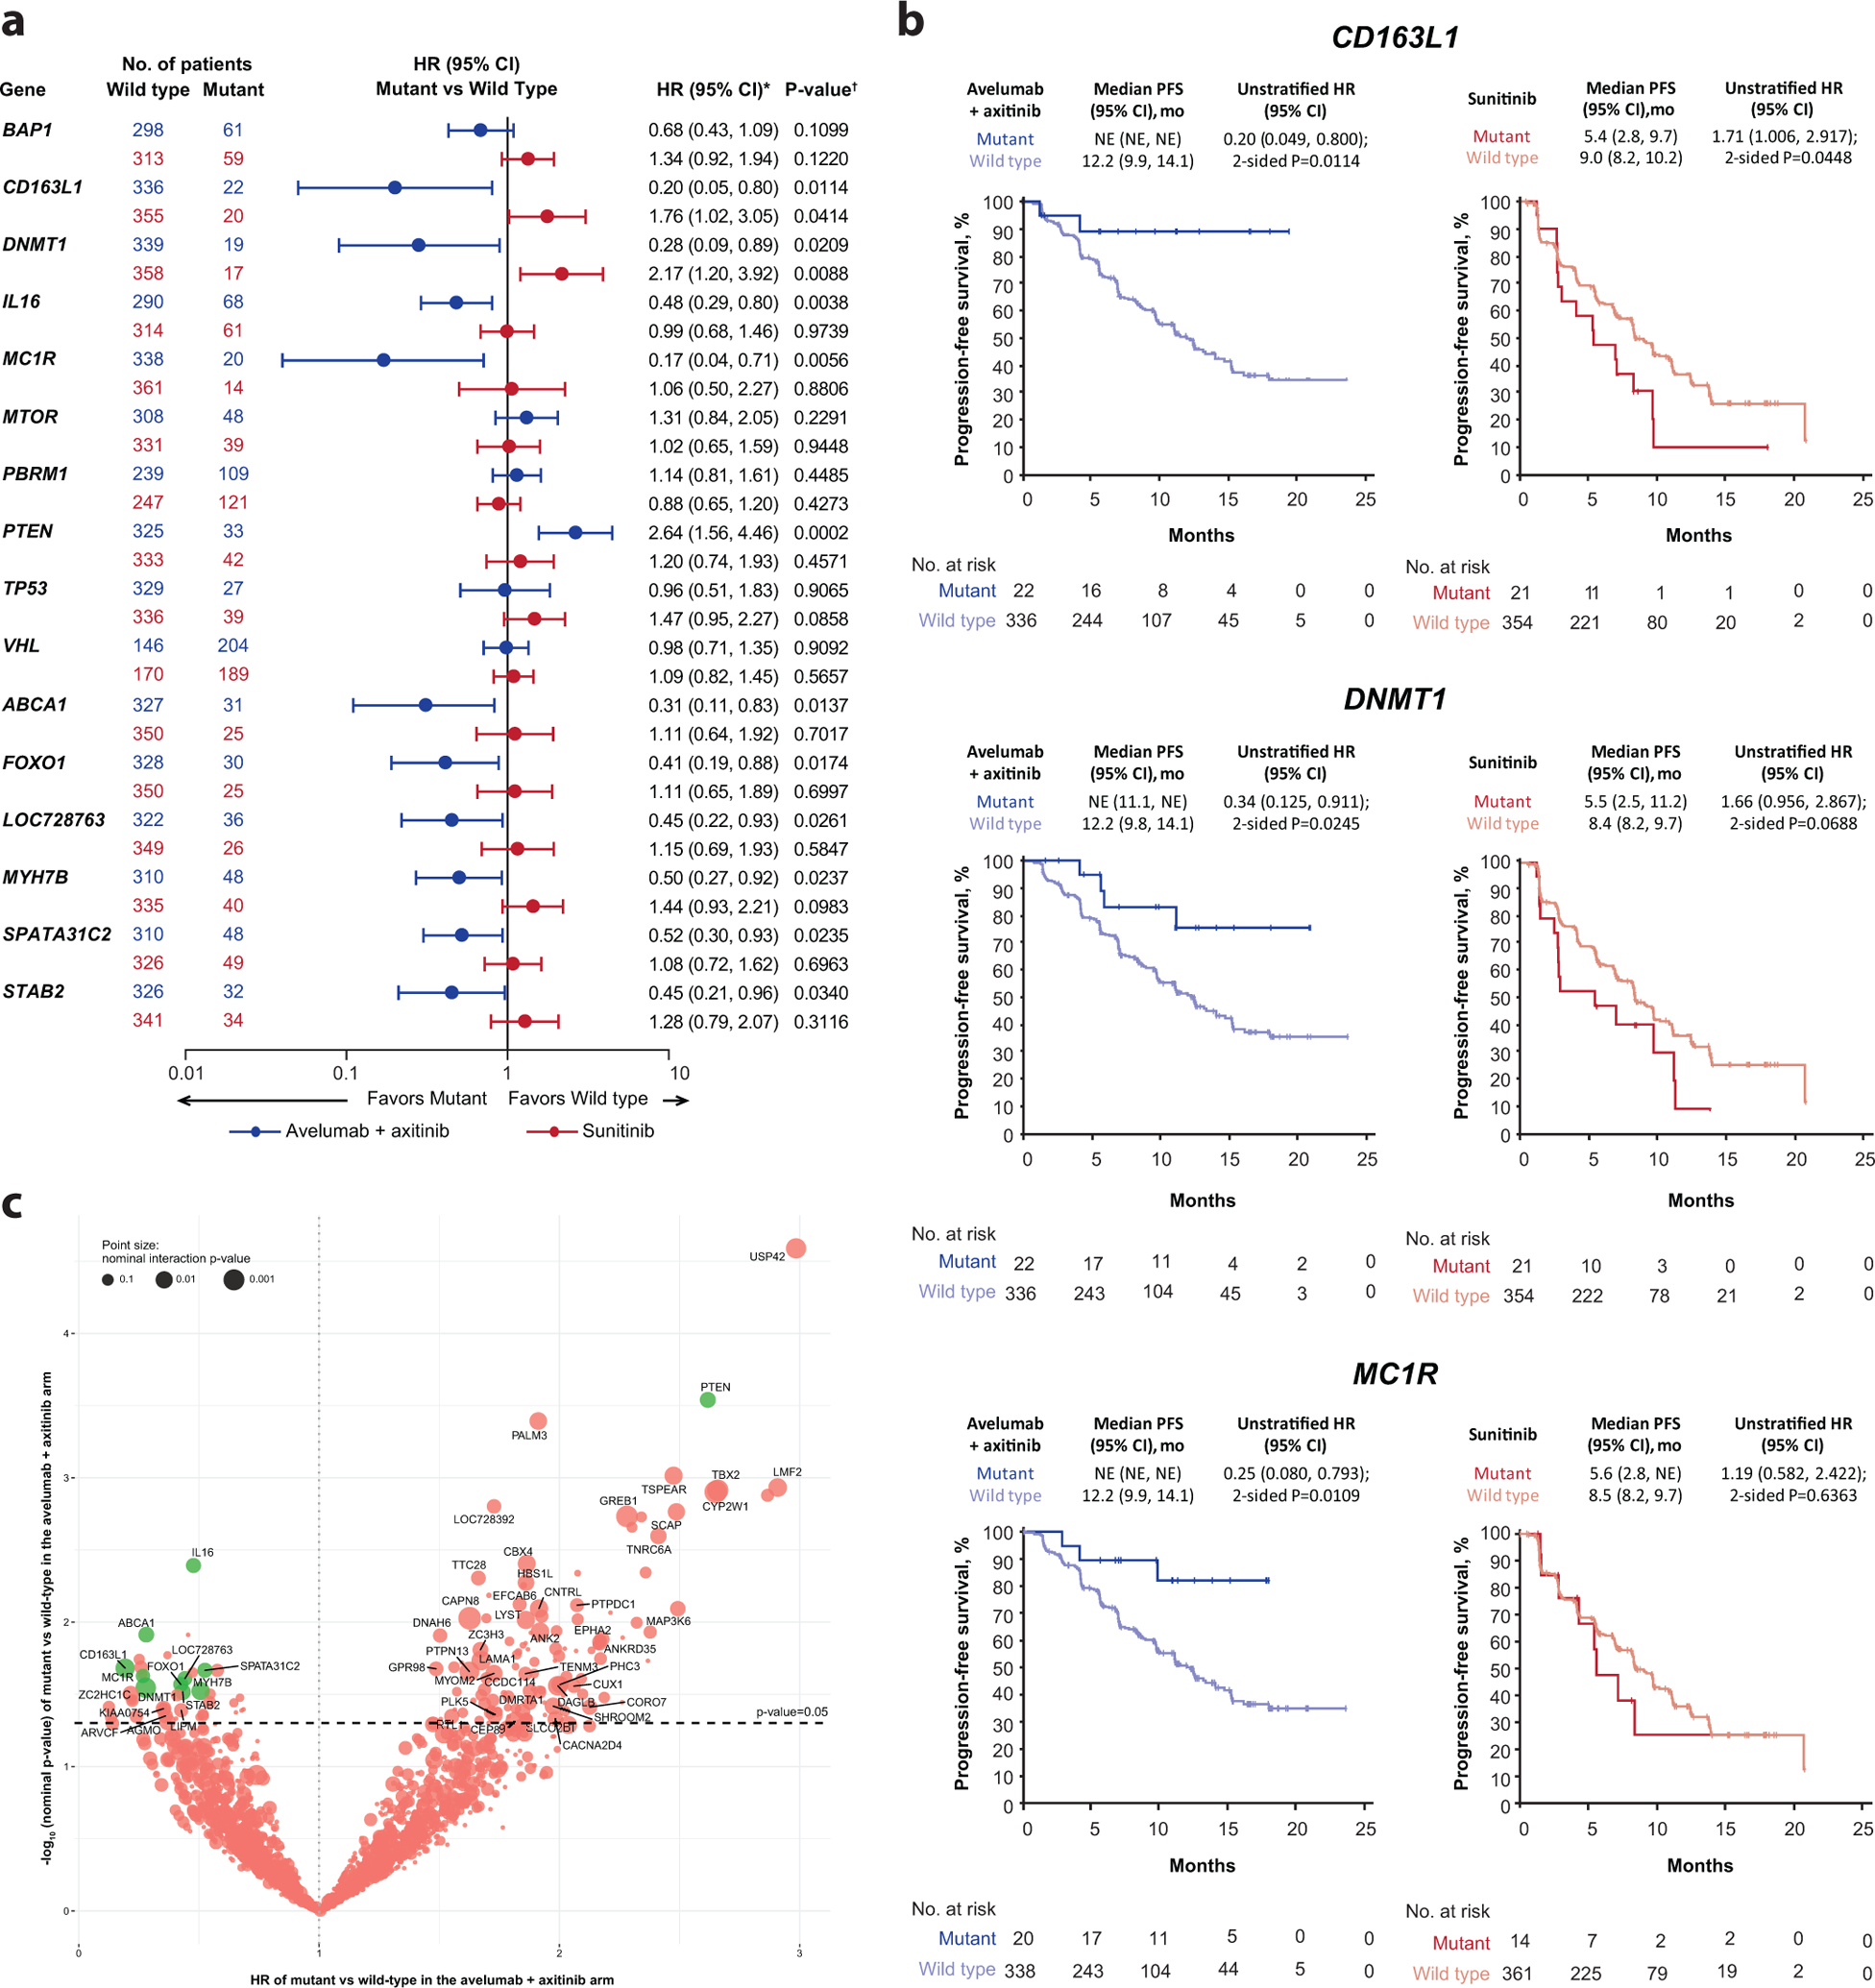
Progression-free survival (PFS) according to (a and b) protein-altering mutations in prioritized/selected genes and (c) all genes assessed. HR, hazard ratio; NE, not estimable; Seq, sequencing. * Cox proportional hazards model with wild type as the reference group used to calculate hazard ratio (HR) and 95% CI. HR <1 indicates better survival in the mutant group, while HR >1 indicates better survival in the wild-type group. † Two-sided log-rank test was performed to compare between wild type/mutant groups. (c) Cox proportional hazards model was used to test dependence of PFS on gene mutational status. Wild type is the reference group and two-sided Wald test was used. Following multiplicity adjustment, no gene reached statistical significance. Green dots represent prioritized genes, as described in the methods.
Mutations in each of the 11 individual genes associated with differential PFS were present in 5–16% of patients (n=733) in both arms (Fig. 5a). These analyses also revealed that the mutations were not mutually exclusive, with some patients harboring mutations in ≥2 genes. We examined PFS in patients with single or multiple mutations (assuming each gene carried the same weight) relative to wild-type patients. Interestingly, when any 2 mutant genes among the 10 associated with prolonged PFS in the combination arm were present, PFS was prolonged relative to either wild-type patients (HR 0.30; 95% CI 0.179, 0.495) or patients with single mutations (HR 0.82; 95% CI 0.581, 1.168) in the avelumab + axitinib arm (1-sided p≤0.001), but not in the sunitinib arm (1-sided p=0.815) (Fig. 5b). However, when one of the multiple genes with mutations was PTEN, PFS was similar to that observed in patients with no mutations in the genes of interest (Extended Data Fig. 10).
Figure 5.
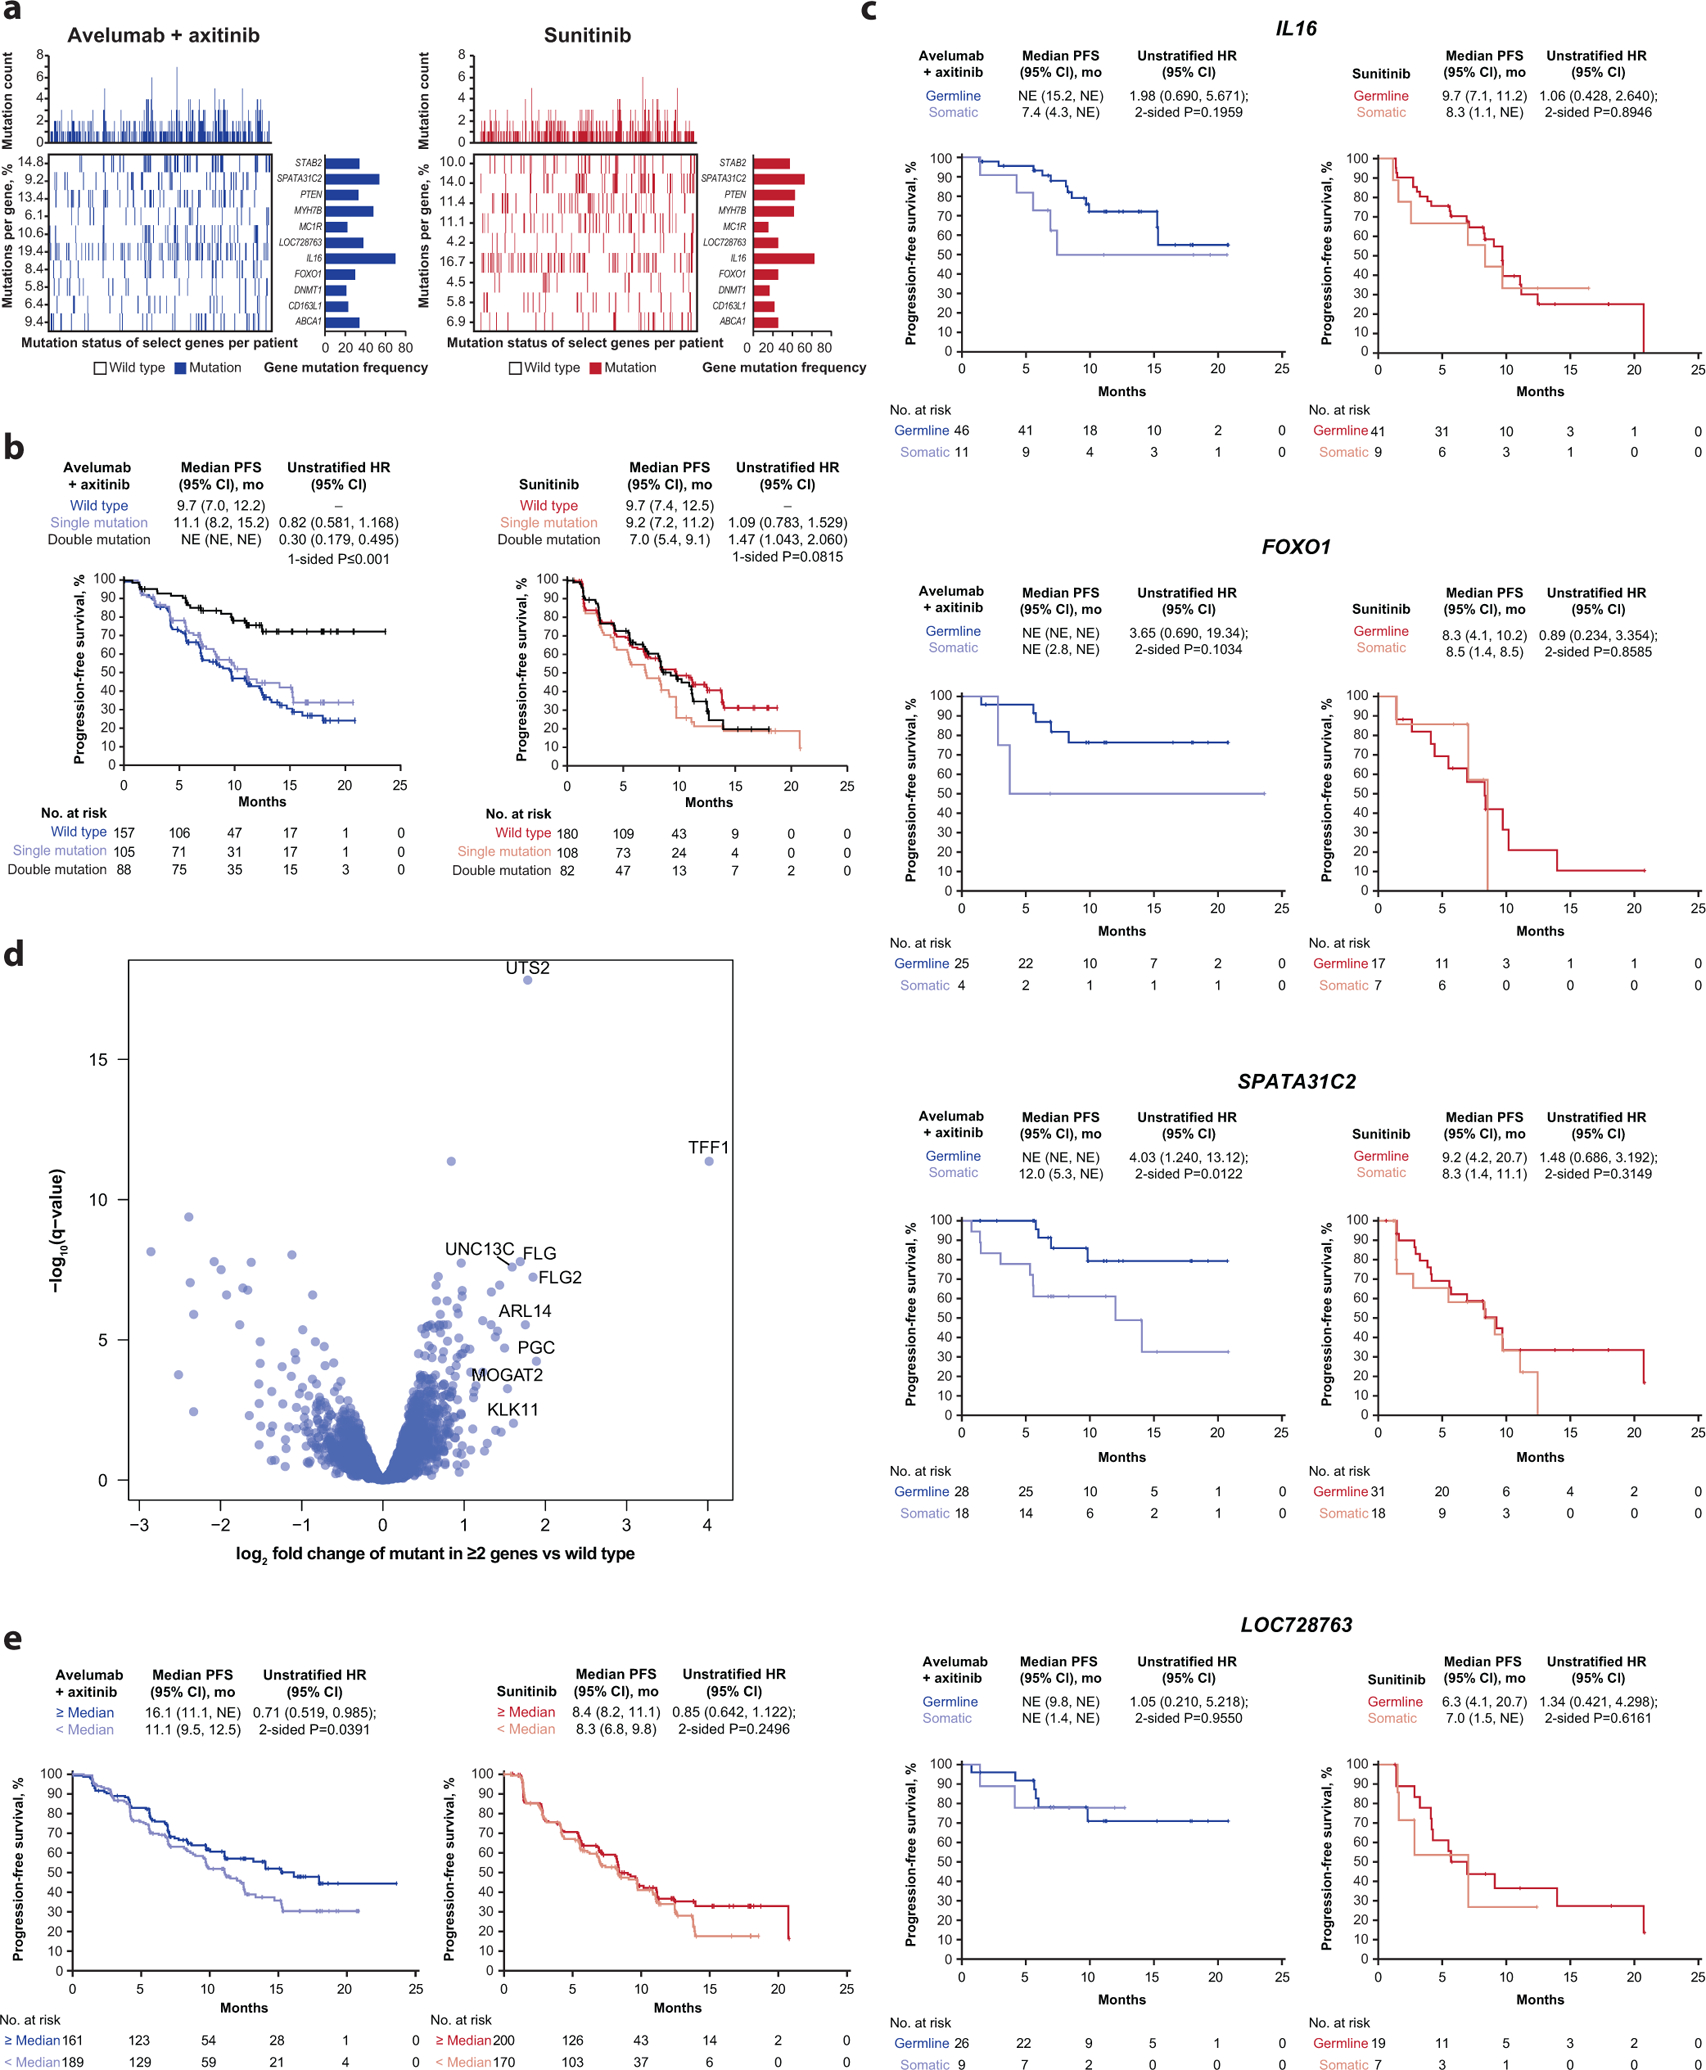
(a) Distribution of mutations among trial population, (b) progression-free survival (PFS) according to the presence of double mutations and (c) germline vs somatic mutations, (d) volcano plot of gene expression profiles comparing those from patients with ≥ 2 of any of the mutations vs those with wild-type alleles, and (e) PFS according to UTS2 expression. (b) P value is from one-sided log-rank testing; exact P value is 0.000005335. For hazard ratio (HR), wild type is reference. (c) P value is from log-rank testing. For HR, germline is reference. (d) P values are calculated by Wald test in DESeq2. Q-values were derived by multiple hypothesis adjustment using FDR. (e) For HR, < median is reference. P values are from two-sided log-rank testing. HR and 95% CI were calculated using the Cox proportional hazards model. NE, not estimable.
Mutations of interest are associated with a discrete gene expression profile
We re-examined WES and gene expression data to analyze functional relationships among the genes associated with differential PFS and found that mutations in IL16, FOXO1, and SPATA31C2 were associated with improved PFS only when present in the germline, whereas either somatic or germline mutations in LOC728763 were associated with improved PFS (Fig. 5c). We then grouped the patients who harbored ≥2 of any of the mutations and compared their gene expression profiles with those who had wild-type alleles. Strikingly, expression of a single gene, UTS2 (a potent vasoconstrictor also associated with inflammatory responses), was highly differentially expressed between these 2 groups (Fig. 5d). Furthermore, irrespective of mutation status, ≥ median UTS2 expression in the avelumab + axitinib arm showed prolonged PFS relative to < median expression (HR 0.71; 95% CI 0.519, 0.985; p=0.0391) (Fig. 5e).
Discussion
A primary objective of the phase 3 JAVELIN Renal 101 study was to compare PFS between treatment arms in patients with PD-L1+ tumors. We found that PD-L1 expression did not differentiate PFS in the combination arm and that PD-L1+ patients had shorter median PFS than PD-L1− patients in the sunitinib arm2,11, consistent with prior results12. Similar to findings in KEYNOTE-426 (pembrolizumab + axitinib vs sunitinib)13, these observations suggest that PD-L1 expression (on TC or IC) may have limited positive predictive value in RCC and are in contrast with findings from the CheckMate 214 (ipilimumab + nivolumab vs sunitinib)14 and IMmotion 150 (atezolizumab + bevacizumab vs sunitinib)3 trials.
The positive (combination arm) and negative (sunitinib arm) associations between PFS and the area occupied by the IM suggests a strong interplay between the immune system and the tumor in response to ICI + VEGFR TKI treatment in aRCC. For the sunitinib arm, the positive trends observed, although not always statistically significant, between PFS and the presence of CD8+ cells in the tumor center and IM vs the negative association with IM area or presence of CD8+ throughout the total tumor area may reflect the negative prognostic significance of IC infiltrate in aRCC noted in patients who do not receive ICIs15,16 and highlight contextually distinct roles for these cells. In the absence of ICI, responses to VEGF pathway-targeting agents may be impacted by impeded CD8 T-cell trafficking or redirection of cytotoxic cell activity. Therefore, patients with aRCC whose tumors have large tumor/immune interfaces but low CD8+ cell density in regions such as the IM and tumor center may benefit from treatment with ICI + VEGF pathway inhibitors. The lack of association between PFS in the combination arm and the presence of CD8+ cells or PD-L1 expression should not be interpreted to indicate that these elements are irrelevant but more likely indicate that other factors and IC types are also contributing to biological responses to treatment.
Gene expression-based pathway analysis confirmed expected biology for the sunitinib arm, such as the significance of cell cycle and EMT pathways, but also identified positive associations between PFS and upregulation of oxygen transport and lipid metabolism pathways in the combination arm. As both are known to regulate and enhance innate immunity17,18, this finding corroborates the RNAseq and IHC data suggesting contributions from the innate immune system as determinants of response.
Our gene expression deconvolution results further reinforce the clinical significance of cytotoxic T cells, indicating that, out of 22 cell types, only CD8+ T-cells had a significant interaction term with PFS in the combination arm. Consistent with the observation that more robust responses to immune checkpoint blockade occur in patients whose tumors have higher levels of tumor-infiltrating CD8+ T-cells, it also suggests that the immune system, while initially tumor supporting in this setting, can be reprogrammed with the proper intervention.
The composition of the Renal 101 Immuno signature, which comprises NK-cell–related transcripts as well as chemokine- and cytotoxic T-cell–related elements, suggests a biological link between improved PFS associated with combination treatment and modulation of both the innate and adaptive immune systems. The implication of the adaptive and innate immune pathways as potential contributors and determinants of response may help explain the signature’s limited overlap with other GESs previously associated with response to ICI-based treatments, such as atezolizumab + bevacizumab3,5. Confirmation of the predictive value of this signature in independent datasets (the phase 1b JAVELIN Renal 1006 and phase 1 JAVELIN Solid Tumor7 trials) supports its relevance and robustness as a potential indicator of PFS benefit following combination immunotherapy.
Underscoring the importance of immune modulation in mediating response to ICI + VEGFR TKI in aRCC is the observation that the IMmotion 150 Teff GES also identified patients more likely to benefit from avelumab + axitinib. Similarly, as observed in IMmotion 1503, application of the IMmotion 150 angiogenesis GES to the JAVLEIN Renal 101 dataset enriched for PFS in the sunitinib arm, but had no impact on the combination arm. We also derived an angiogenesis signature (Renal 101 Angio) that was significantly associated with prolonged PFS in the sunitinib arm but did not differentiate PFS in the combination arm. Despite both studies using sunitinib as a comparator, our 26-gene signature had limited overlap with published GESs: Only CD34 and KDR are present in both the JAVELIN Renal 101 Angio and IMmotion 150 angiogenesis GES, and only ECSCR, KDR, PTPRB, and TEK are present in both the JAVELIN Renal 101 Angio and an angiogenesis core signature identified in multiple tumor types3,19. Further evaluation of the JAVELIN Renal 101 Angio GES in independent datasets will be required to assess its robustness and utility.
TMB was not associated with the presence of previously described mutations, and neither TMB nor the presence of IgG1 affinity altering polymorphisms in FCGR2a nor FCGR3a impacted PFS in either arm. However, the NK cell related transcripts that are part of Renal 101 Immuno still suggest a role for engagement of innate immune mechanisms as potential contributors and determinants of response to the combination.
In addition to identifying novel signatures associated with PFS benefit in response to ICI + VEGFR TKI, we also highlighted the potential relevance of the DUX4 GES in aRCC, which was associated with suppression of HLA-A, -B, and -C genes in patients with DUX4–GES+ tumors. The significance of antigen presentation and recognition in the context of response to treatment in JAVELIN Renal 101 suggested by the DUX4 GES data is further reinforced by the observation that patients with any of 5 specific HLA subtypes, which represent ≈70% (511/720) of the HLA type-evaluable patients in aggregate, had improved or reduced PFS vs others in each treatment arm. Protein-altering mutations in 10 genes associated with improved PFS in the combination arm were identified and further examination determined that the mutations were somatic in 6 and germline in 4. In the context of immunotherapy, it is reasonable to hypothesize that the mutations might simply provide neoantigens recognized by the immune system. However, 3 key pieces of data argue against this hypothesis.
First, the germline polymorphisms in 4 genes were similarly associated with improved PFS in the combination arm, as were the somatic mutations. Therefore, since the patient’s immune system would likely have been tolerized against the resulting proteins as “self-antigens”, it is unlikely that they are eliciting antigen-specific immune responses. Additionally, relative to somatic mutations, the impact of these germline polymorphisms could be further amplified as these genes have greater potential to be expressed in a range of normal and stromal tissues (as well as malignant cells)20–23.
Second, the absence of association between either TMB and response or the broad range of protein-altering mutations observed coupled with the absence of tumor-restricted expression for germline mutations, disfavors a neo-antigen/immunogenicity hypothesis.
Third, the additive, potentially predictive effect observed when mutations in >1 of the genes are present is consistent with the concept of complementary and/or non-overlapping pathways being impacted by each mutation, rather than contributing novel T-cell epitopes driving immune responsiveness.
Alternatively, the altered proteins could serve directly as drug targets, but the diverse functional roles of the implicated genes and the broad range of biologically inequivalent mutations observed within individual genes argues against this concept.
Several lines of evidence are consistent with the idea that these mutations contribute to create a biologically convergent, integrated phenotype responsive to ICI + VEGFR TKI. The interchangability of the mutations—with any single gene mutation able to substitute for any other, as well as any pair of mutations yielding similar relative PFS benefit—suggests biological linkage contributing to enhanced antitumor responses via pathway activation and/or tumor microenvironment alterations. The linkage hypothesis is supported by the functional annotation of individual genes within the group (eg, STAB2) in which mutations were associated with better clinical outcome following treatment with other ICIs24,25 and most convincingly by the striking pattern of differential gene expression for UTS2 that is shared among patients harboring mutations in any 2 genes of interest.
Interestingly, UTS2 is under transcriptional control of DUX426 and its known functions as the most potent regulator of vasoconstriction and a proinflammatory cytokine upstream of MAPK, NF-ĸB, and IFN regulatory pathways may position UTS2 to integrate the diverse and complementary anti-angiogenic and immunomodulatory properties of ICI + VEGFR TKI combinations. The potential roles of UTS2 as determinant of response and integrator of the effects of ICI + VEGFR TKI treatment is further supported by our RNA-seq data, which showed, irrespective of key (10 gene) mutation status, patients in the combination arm whose tumors express higher levels of UTS2 have extended PFS relative to those with lower expression.
If the relationships between response to ICI + VEGFR TKI therapy and the mutations and/or expression of genes identified in this study are functional or causal, these markers may not only help identify patients with aRCC who are most likely to benefit from this combination but also address unmet medical needs in other indications. Examination of a public database (TCGA) suggests that mutations in each of these individual genes can be found in ≈5–25% of patients across a range of tumor types.
Through retrospective analysis of this large (N=886), controlled, exploratory clinical biomarker dataset, we have provided evidence to confirm the immunomodulatory role of anti-angiogenic therapy, defined molecular features that differentiate therapy-specific outcomes in first-line aRCC, and highlighted previously unappreciated biologically and clinically significant determinants of PFS benefit with an ICI + VEGFR TKI combination vs VEGFR TKI alone. These findings may inform personalized therapeutic strategies for patients with aRCC and other tumor types.
Methods
Study design and participants.
The study design and patient eligibility criteria have been described in detail previously.2 Briefly, JAVELIN Renal 101 (NCT02684006) is a multicenter, randomized, open-label, phase 3 trial comparing avelumab + axitinib with sunitinib. Randomization (1:1) was stratified according to Eastern Cooperative Oncology Group performance status (ECOG PS) score (0 vs 1) and geographic region (United States vs Canada and Western Europe vs rest of the world). Eligible patients were aged ≥ 18 years (≥ 20 years in Japan) with previously untreated advanced RCC with a clear-cell component. Additional inclusion criteria included the presence of ≥1 measurable lesion according to the Response Evaluation Criteria in Solid Tumors (RECIST) 1.1; ECOG PS score of 0 or 1; a fresh or archival tumor specimen; and adequate renal, cardiac, and hepatic function. Patients across all Memorial Sloan Kettering Cancer Center (MSKCC) and International Metastatic Renal Cell Carcinoma Database Consortium (IMDC) prognostic risk groups were included.
The 2 independent primary end points were PFS as determined by blinded independent central review (BICR) according to RECIST 1.1 and overall survival in patients with PD-L1+ tumors (≥1% of immune cells staining positive within the tumor area of the tested tissue sample). PD-L1 expression was assessed at a central laboratory with the use of the Ventana PD-L1 (SP263) assay (Ventana Medical Systems). Key secondary end points were PFS as determined by BICR according to RECIST 1.1 and overall survival in patients in the overall population, irrespective of PD-L1 expression. Other secondary end points included investigator-assessed PFS, ORR, adverse events, pharmacokinetic measures, tumor tissue biomarkers, and patient-reported outcomes. All data are reported per investigator assessment, unless otherwise stated.
The trial was conducted in accordance with the ethics principles of the Declaration of Helsinki and the Good Clinical Practice guidelines, defined by the International Council for Harmonisation. All the patients provided written informed consent. The protocol, amendments, and informed-consent forms were approved by the institutional review board or independent ethics committee at each trial site. An independent external data monitoring committee reviewed efficacy and safety.
Procedures.
Avelumab was administered at a dose of 10 mg/kg as a 1-hour intravenous infusion every 2 weeks. An antihistamine and acetaminophen were administered approximately 30 to 60 minutes before each infusion. Axitinib was administered orally at a starting dose of 5 mg twice daily on a continuous dosing schedule. Sunitinib was administered at a dose of 50 mg orally once daily for 4 weeks of a 6-week cycle. Dose escalations and reductions of axitinib and dose reductions of sunitinib are described in the protocol and package inserts. Dose reductions of avelumab were not permitted, but subsequent infusions could be omitted in response to persisting toxic effects.
Tumor assessments were performed using CT or MRI at baseline, every 6 weeks after randomization for the first 18 months, and then every 12 weeks until confirmed disease progression. Adverse events were graded according to the NCI CTCAE v4.03. Patients in each treatment group were permitted to continue therapy after RECIST-defined disease progression if the investigators determined that the therapy had benefit (ie, patients did not have clinical signs and symptoms associated with the radiographic findings).
Statistical analysis.
Calculation of the overall sample size required for the primary endpoints, the statistical testing schemes, and the preplanned interim analysis have been described previously.2
All data reported here are from pre-specified analyses of secondary endpoints and post hoc exploratory analyses based on the first interim analysis and are expressed according to investigator assessment. The analyses described used either nephrectomy or archival tumor samples. Kaplan-Meier analysis was done to evaluate the association of PFS and pre-specified variables. Cox proportional hazard (Cox PH) models were used to calculate hazard ratio and 95% CI; P-values were determined by one- or two-sided log-rank test as indicated. SAS version 9.4 was used for data analysis and figure generation.
Immunohistochemical analysis.
PD-L1 expression was assessed at a central laboratory with the use of the Ventana PD-L1 (SP263) assay (Ventana Medical Systems; catalog number 740–4907) using a threshold of ≥1% of immune cells staining positive within the tumor area of the tested tissue sample. The algorithm for defining PD-L1 expression status as patients whose tumors express PD-L1 at any intensity on immune cells occupying ≥1% of the tumor area was established following examination of PD-L1 expression on both tumor cells and immune cells in ≈1000 commercial RCC tissue samples and all evaluable samples from the independent JAVELIN Renal 100 study (N=55)6. Based on these analyses, this algorithm and threshold were selected because it would potentially identify the largest patient population with increased potential for clinical benefit from the combination.
CD8 expression expression was assessed by immunohistochemistry using clone C8/144B (part number: M710301-2) and scored via a quantitative method using image analysis software (Definiens). A central tumor region was delineated by a pathologist. At the interface between malignant and adjacent normal tissue, a 1000-μm wide invasive margin, an immunologically active region and site of PD-L1 expression27, region centered around the perimeter was generated. For both the central tumor region as well as the invasive margin, the relative area of marker-positive cells was calculated (ie, the CD8+ area relative to the total tumor area). CD8 expression was reported in terms of the percentage of CD8+ cells in relation to the total number of CD8+ cells in the total tumor area, tumor center, or at the invasive margin, with the median value as the cutpoint.
Gene expression analysis.
RNA sequencing and transcript quantification.
Whole-transcriptome profiles were generated for 720 patients (350 on the avelumab + axitinib arm and 370 on the sunitinib arm) using RNA-seq (Accuracy and Content Enhanced [ACE] version 3; Illumina NovaSeq) on formalin-fixed paraffin-embedded (FFPE) tumor tissue.
HLA typing.
HLA types of each sample were determined using the OptiType (version 1.3.1) algorithm for RNA-seq data28.
Transcript quantification and pathway score calculation.
Transcript levels were quantitated by the Personalis ACE Cancer Transcriptome Analysis pipeline which uses STAR version 2.4.2a-p1 to align reads to the NCBI hs37d5 annotation 105 reference genome and produces Transcripts Per Million (TPM) values for each gene. TPM values were log2 transformed for further analysis of individual genes or standardized gene pathway signature scores. Briefly, for each gene we calculated the mean expression and standard deviation across samples. Then for each gene, we subtracted the mean and divided by the standard deviation to standardize the gene score to be centered at zero with units of standard deviation (z-score). The pathway score for each sample was calculated as the average of the standardized values for the set of genes within the pathway.
Deconvolution analysis.
RNA-Seq was deconvoluted into LM22 immune cell proportions by ImmuneNet (Data4Cure29), an implementation of the method developed by Newman et al30.
Co-expression network analysis.
Weighted Gene Co-Expression Network Analysis (WGCNA)31 was used to find co-expressed modules in the 720 baseline transcriptomic samples. We first filtered out lowly expressed and invariant genes, ie, genes that were expressed in <5% of samples or had standard deviation ≤1 for expression (log2 TPM) were removed. The soft power of 6 was chosen based on goodness of fit to a scale-free network. A signed WGCNA network was constructed in R version 3.5 with merge CutHeight set to 0.25 and reassignThreshold set to 0. After removing non-coding genes and modules with size <10, 25 modules were identified. Gene signature scores were computed from the average expression of genes in a module. A univariate Cox PH model was used to assess the dependence of PFS on each gene signature, which was categorized into high vs low groups according to median signature score32,33. Multivariate analysis was also carried out adjusting for age and sex. Modules were annotated through identifying top enriched gene sets via hypergeometric tests using public gene set collections including the MsigDB Hallmark, GO Biological Process and LM2230,34,35.
To assess the robustness of identified gene modules, we then carried out a consensus WGCNA analysis. First, lowly expressed and invariant genes were filtered out, ie, genes that were expressed in <5% of samples or had standard deviation ≤0.9 were removed. The soft power of 6 was chosen based on goodness of fit to a scale-free network. 720 baseline data were randomly subsampled down to 80% of samples for 1,000 times. With each subsampled dataset, we constructed a co-expression network using the WGCNA procedure as described above. An adjacency matrix was constructed by counting the frequencies two genes were clustered into the same network module. A consensus network was then constructed using the new adjacency matrix via the standard WGCNA approach. Edges were then filtered by adjacency measure of 0.8. Modules with size <10 were removed. Consensus WGCNA identified 23 modules. Hypergeometric tests were then carried out to annotate modules as described above. Signature scores were computed from the average of log2 TPM of genes in the signature.
JAVELIN Renal 101 Immuno signature.
Blinded to clinical outcome, co-expression network analysis using WGCNA identified an immune response module of 306 genes and high expression of this 306-gene signature was associated with better PFS in the avelumab + axitinib arm but not in the sunitinib arm. To refine the 306-gene immune response module, we selected genes annotated for immune-related functionality and had univariate Cox PH p-value <0.01 in the combination arm. Together with the manually added CD8B gene, which barely misses the p-value=0.01 cutoff, we defined a 26-gene JAVELIN Renal 101 Immuno signature. Further consensus WGCNA analysis identified a consensus 414-gene immune response module that was associated with better PFS in the avelumab + axitinib arm but not in the sunitinib arm. All 26 genes in the JAVELIN Renal 101 Immuno signature are also in the consensus 414-gene module, verifying the robustness of the signature. Validation of the 26-gene signature was carried out using two independent datasets: the first derived from patients with advanced RCC enrolled in the single-arm, phase 1b JAVELIN Renal 100 clinical trial who received avelumab + axitinib (NCT02493751)6 and the second derived from a mixed solid tumor cohort from the avelumab monotherapy phase 1 JAVELIN Solid Tumor study (NCT01772004)1,7. A similar approach was used to define the JAVELIN Renal 101 Angio signature, in which top genes associated with better PFS in the sunitinib arm were identified.
Previously published gene signatures.
The impact of VEGF pathway inhibition on immune modulation has been noted in non-clinical studies36 in which GES for clear-cell RCC (angiogenesis/endothelial cell related) and response to antiangiogenic treatments19 were identified by co-expression network analysis. The randomized phase 2 IMmotion 150 study identified angiogenesis, effector T cell (Teff), and myeloid-inflamed GES in patients with advanced RCC (aRCC) who were treated with bevacizumab (anti-VEGF) + atezolizumab (anti–PD-L1), atezolizumab monotherapy, or sunitinib (multitarget tyrosine kinase inhibitor [TKI])3. A predictive multitumor interferon (IFN)-γ–related GES was identified for patients who received pembrolizumab (anti–PD-1), although it did not include RCC5. A prospective study in nivolumab (anti–PD-1) treated patients with RCC identified pharmacodynamic effects in chemokines, immune cell (IC) numbers, and a GES indicative of treatment-related immunomodulation37. These signatures were defined as follows based on associations with their respective biology3: angiogenesis38: VEGFA, KDR, ESM1, PECAM1, ANGPTL4, and CD34; Teffector39: CD8A, EOMES, PRF1, IFNG, and CD274; and myeloid inflammation40–44: IL6, CXCL1, CXCL2, CXCL3, CXCL8, and PTGS2. To calculate individual scores for each of these signatures, the expression level for each gene was standardized by first determining the mean expression level (log2 TPM) and standard deviation of that gene within the entire evaluable population across both study arms and then subtracting the mean value and dividing by the standard deviation for expression. The pathway score was then calculated as the mean of the standardized genes in the pathway.
Elastic net analysis.
A multi-feature signature was derived using samples with complete data from the combination arm. For each bootstrap run, we fitted a Cox PH model for PFS with regularization by an elastic net penalty45 and with 5-fold cross validation. 1,000 bootstraps were performed. Features were ranked by frequency observed in the bootstraps and the number of top features was selected using a local maximum concordance index. A composite signature score was computed by a weighted sum of the top features and each feature was weighted by its average coefficient across bootstrap models.
Differential gene expression analysis.
DESeq2 was used to identify differentially expressed genes in patients who had mutations in ≥2 of the 10 select genes and those with no mutation in any of the 10 genes, using raw read counts from RNA-seq46.
Whole-exome sequencing and variant calling.
Whole-exome sequencing (WES) data were generated for 733 patients (358 on the avelumab + axitinib arm and 375 on the sunitinib arm) from FFPE tumor tissue (ACE version 3; Illumina NovaSeq and processed by the Personalis ACE Cancer Exome pipeline which uses BWA, GATK, MuTect, Vardict, and Picard to generate variant calls. Variant calls were further filtered by the vendor using a Personalis proxy-normal and custom filters to remove many germline variants found in normal tissue. Mutation with a minimum of 5 mutant reads, ie, found on at least 5 separate DNA molecules in an individual tumor sample, not annotated as synonymous variants and annotated as resulting in a change in protein coding sequence were included in the analysis. To test association of mutated genes with PFS, we filtered genes by a mutation frequency of 4%, resulting in 2613 genes passing the filter for additional analysis.
Biomarker association analyses.
To identify genes whose mutations associated with improved PFS following combination treatment, we used a binary scheme to establish mutational status based on the presence of protein altering mutations and employed the Cox PH model to assess the dependence of PFS on mutational status of each gene. Multiplicity adjustment was not performed for these analyses. In addition, multivariate analysis was also carried out adjusting for age, sex, and TMB.
For each gene, four models were constructed: (1) a Cox PH model on the full cohort including an interaction term between gene mutational status and treatment arm (2) a Cox PH model on the full cohort including an interaction term between gene mutational status and treatment arm, adjusting for covariates age, sex, and TMB (3) a Cox PH model on the avelumab + axitinib arm (4) a Cox PH model on the avelumab + axitinib arm, adjusting for covariates age, sex, and TMB. Genes were filtered based on the following criteria:
Mutated at 5% or more in the cohort
Interaction term P-value<0.05 in both model (1) and model (2), testing for treatment specific differences of the mutations on PFS
P-value<0.05 in both model (3) and model (4), testing for significant effects the mutants have on PFS in the avelumab + axitinib arm
Hazard ratio (HR) <1 in both model (3) and model (4), filtering for mutations that have a beneficial effect on PFS in the avelumab + axitinib arm.
Applying the above criteria (A through D), we obtained 9 genes of interest: ABCA1, CD163L1, DNMT1, FOXO1, IL16, LOC728763, MYH7B, SPATA31C2, STAB2. After manual inspection and applying prior knowledge, we also included another gene, MC1R.
Extended Data
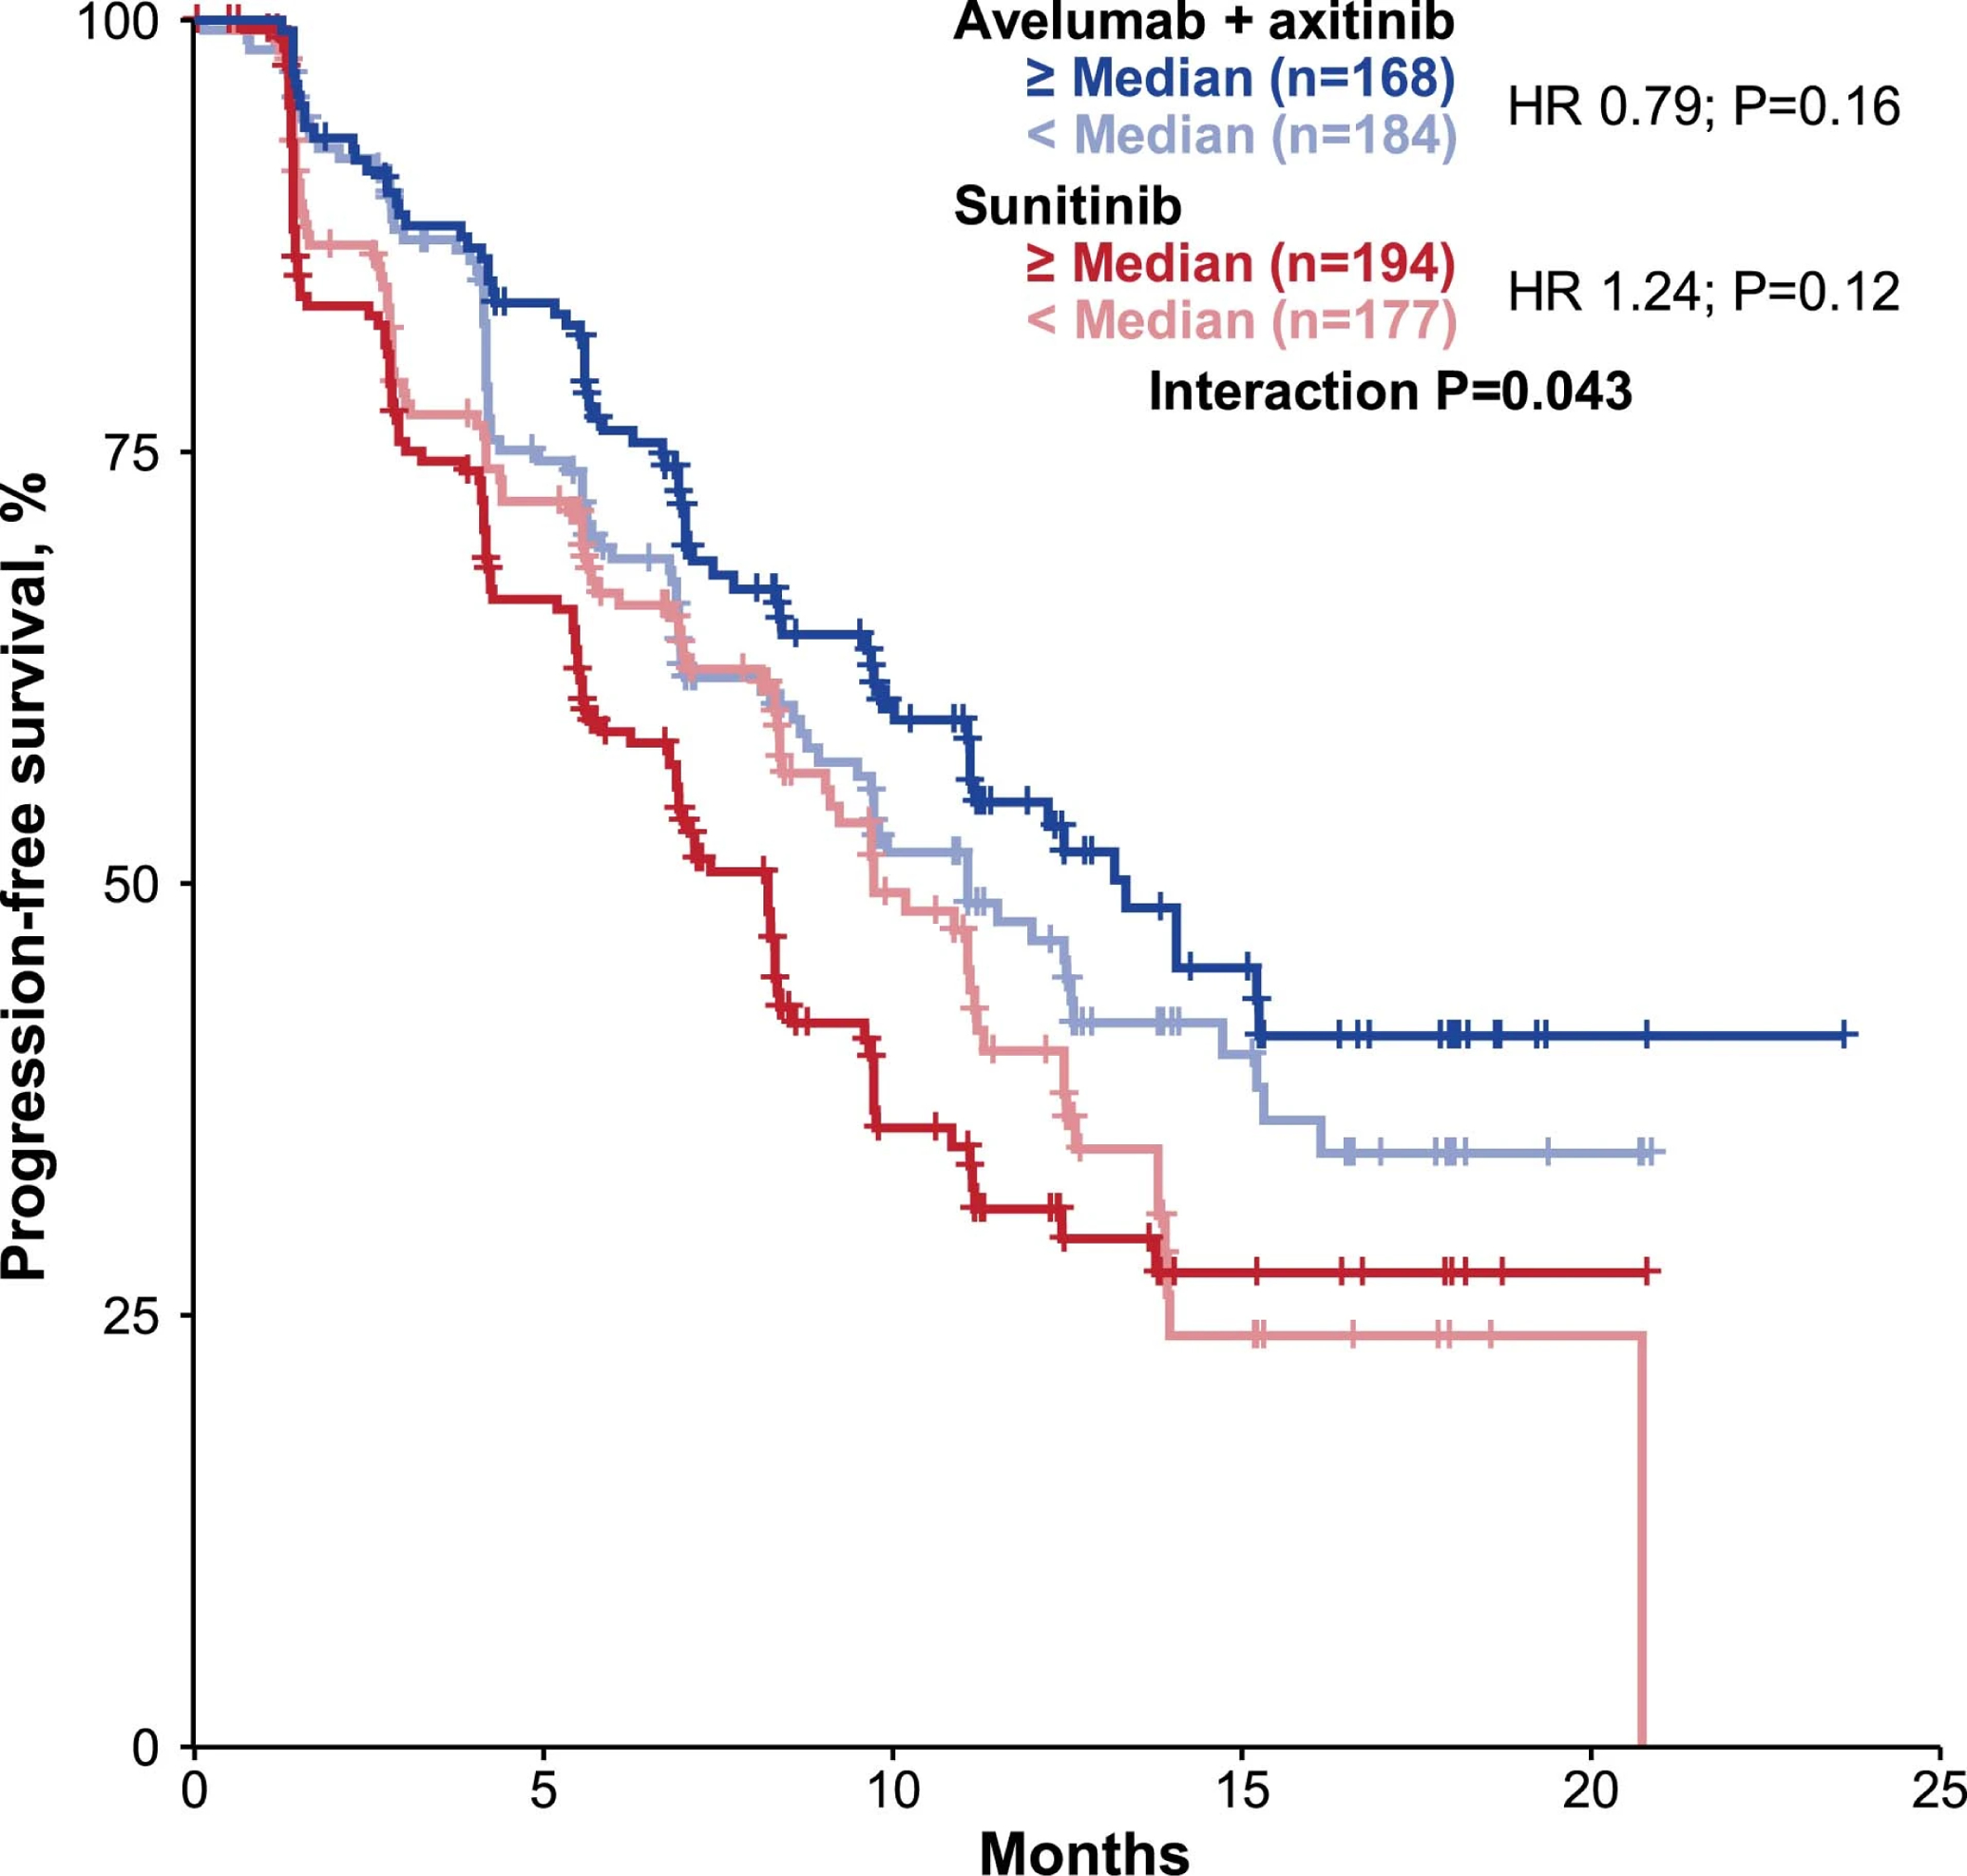
Extended Data Fig. 1: Progression-free survival (PFS) according to (a) CD8+ T cells in the invasive margin, (b) total tumor area and (c) at the tumor center.
Kaplan-Meier analysis was done to evaluate the association of PFS and the presence of CD8+ cells within regions of the tumor (Cox proportional hazards model with one-sided log-rank test). NE, not estimable.
Extended Data Fig. 2: Representative images of CD8 expression by immunohistochemistry in (a, b) CD8+ samples and (c, d) CD8− samples.
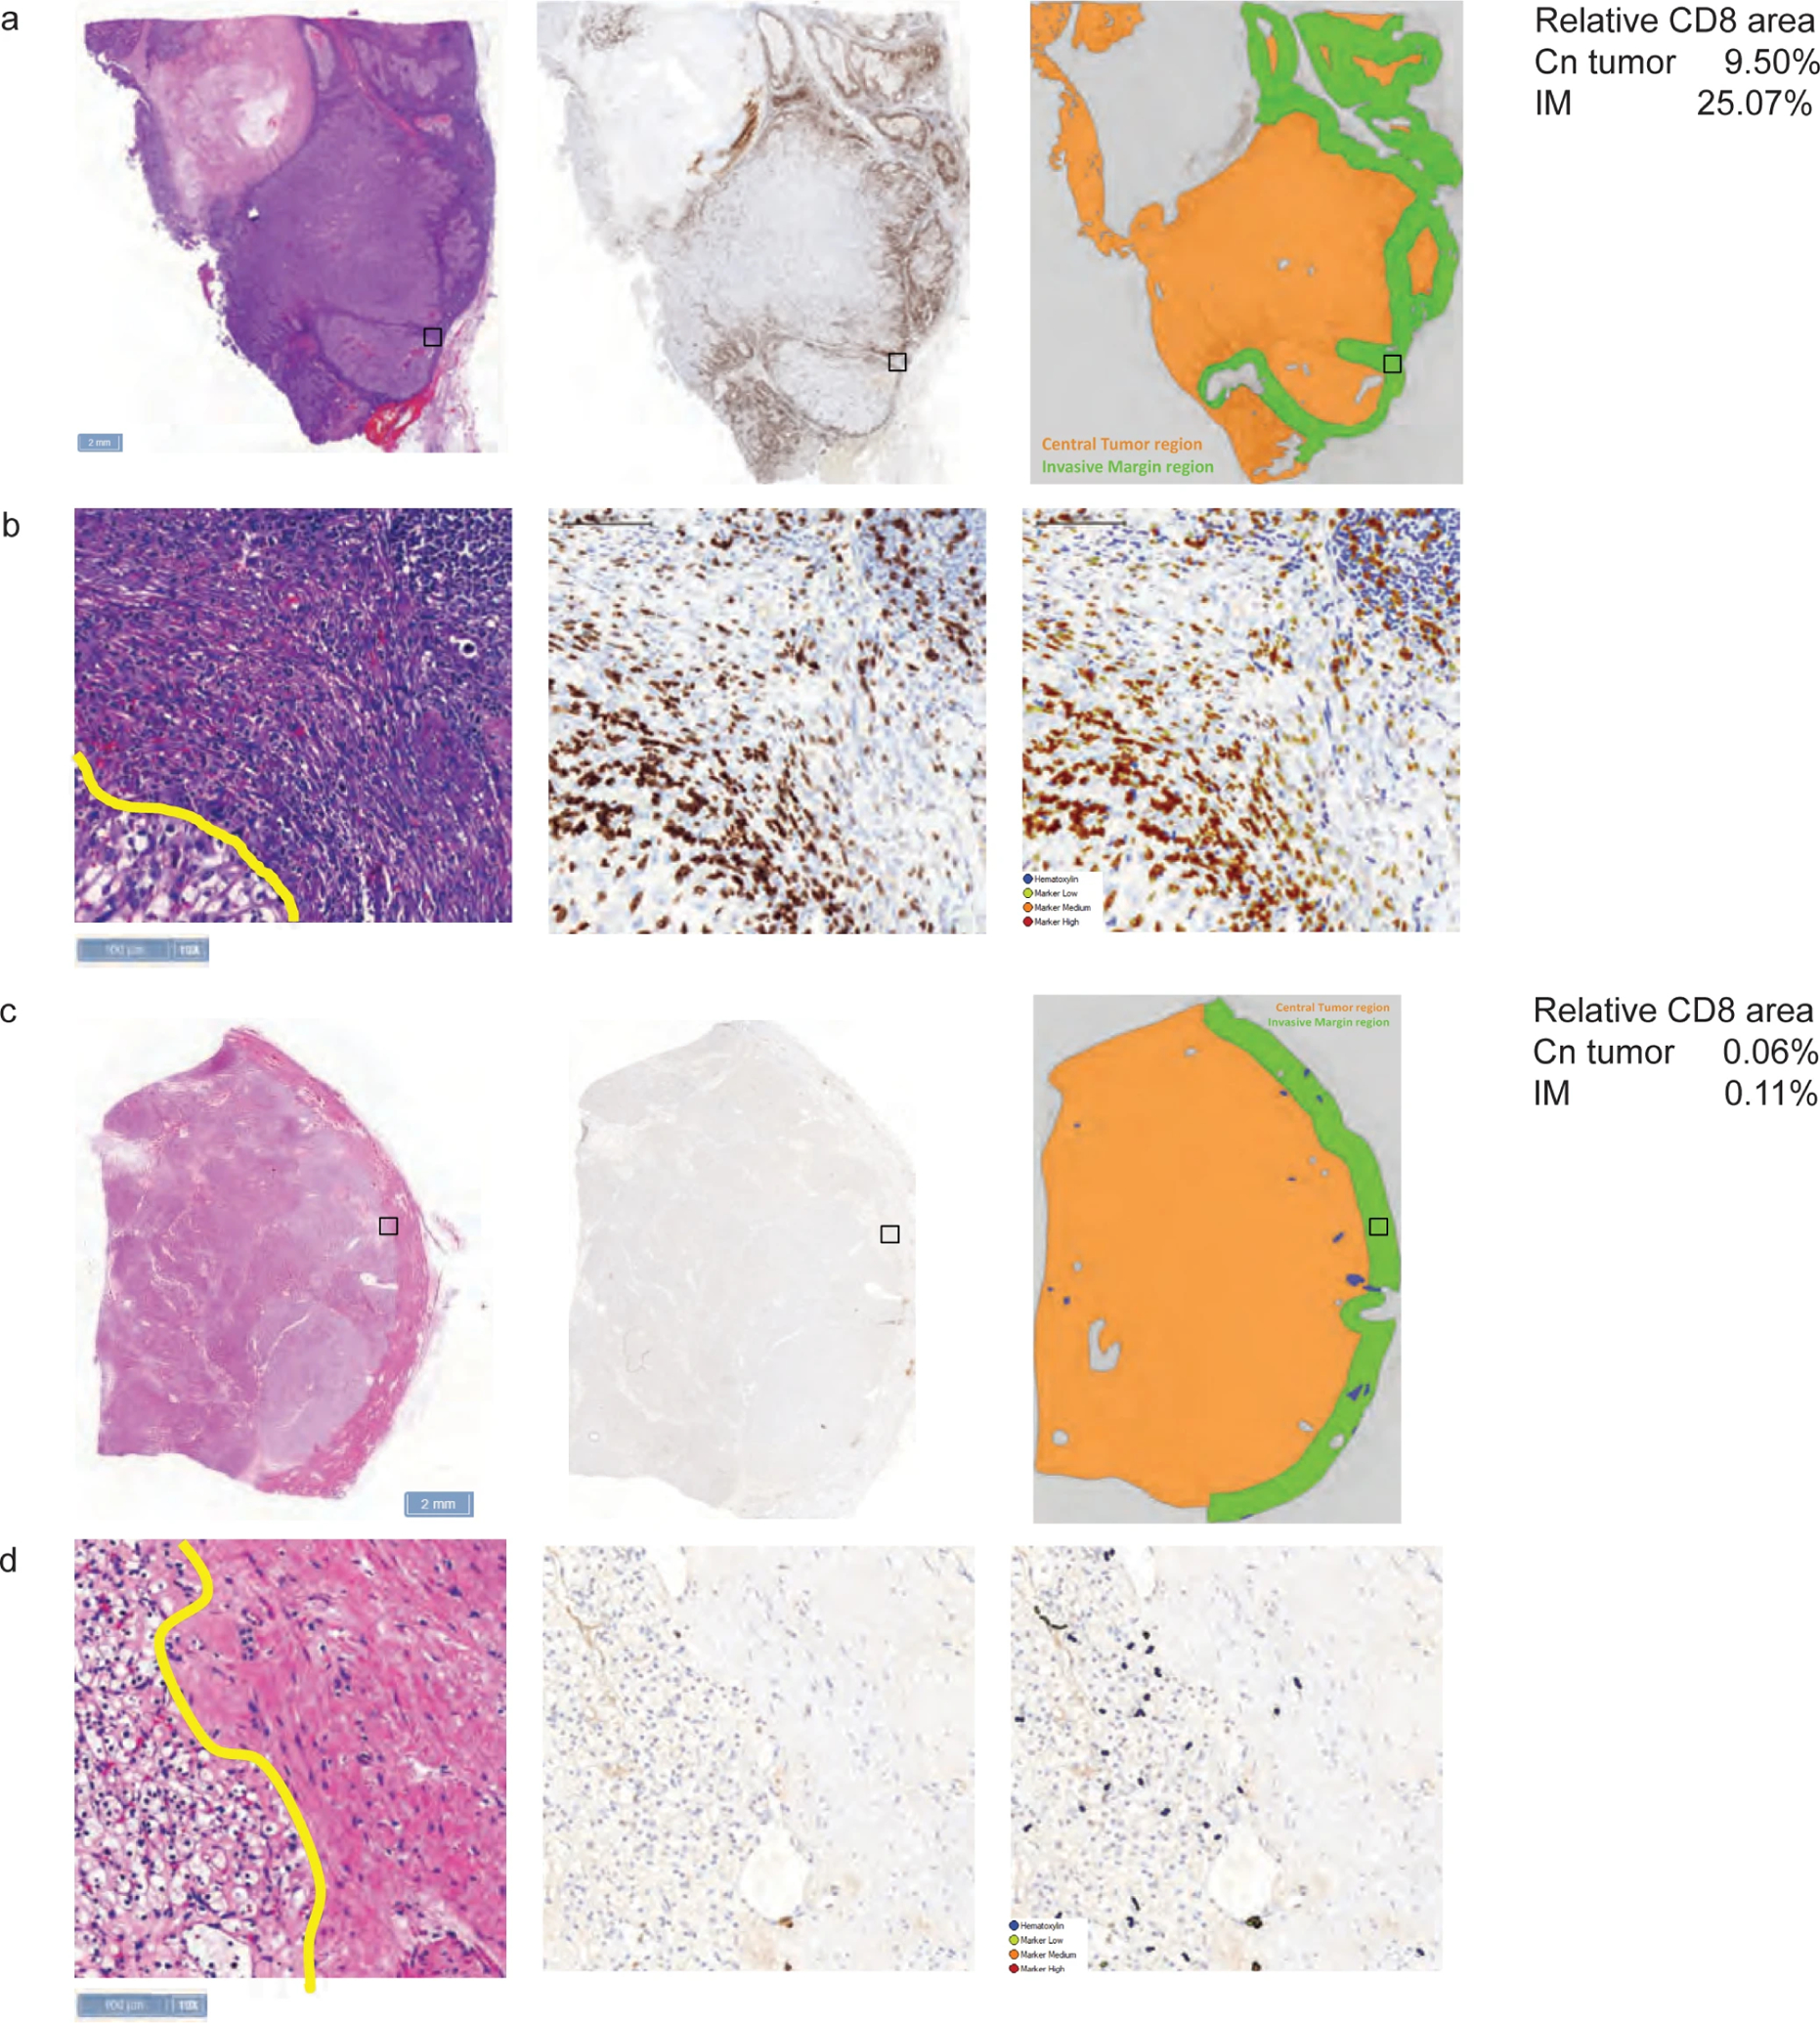
a, c, Black boxes denote magnified regions of interest displayed in b and d; scale bars = 2 mm. b, d, Scale bars = 100 μm.
Extended Data Fig. 3: Progression-free survival according to CD8+ T cells following ImmuneNet deconvolution.
Cox proportional hazards model was used and <median group was the reference group. Two-sided Wald test was used for P values.
Extended Data Fig. 4: Heatmap of correlation of WGCNA clusters vs consensus WGCNA clusters.
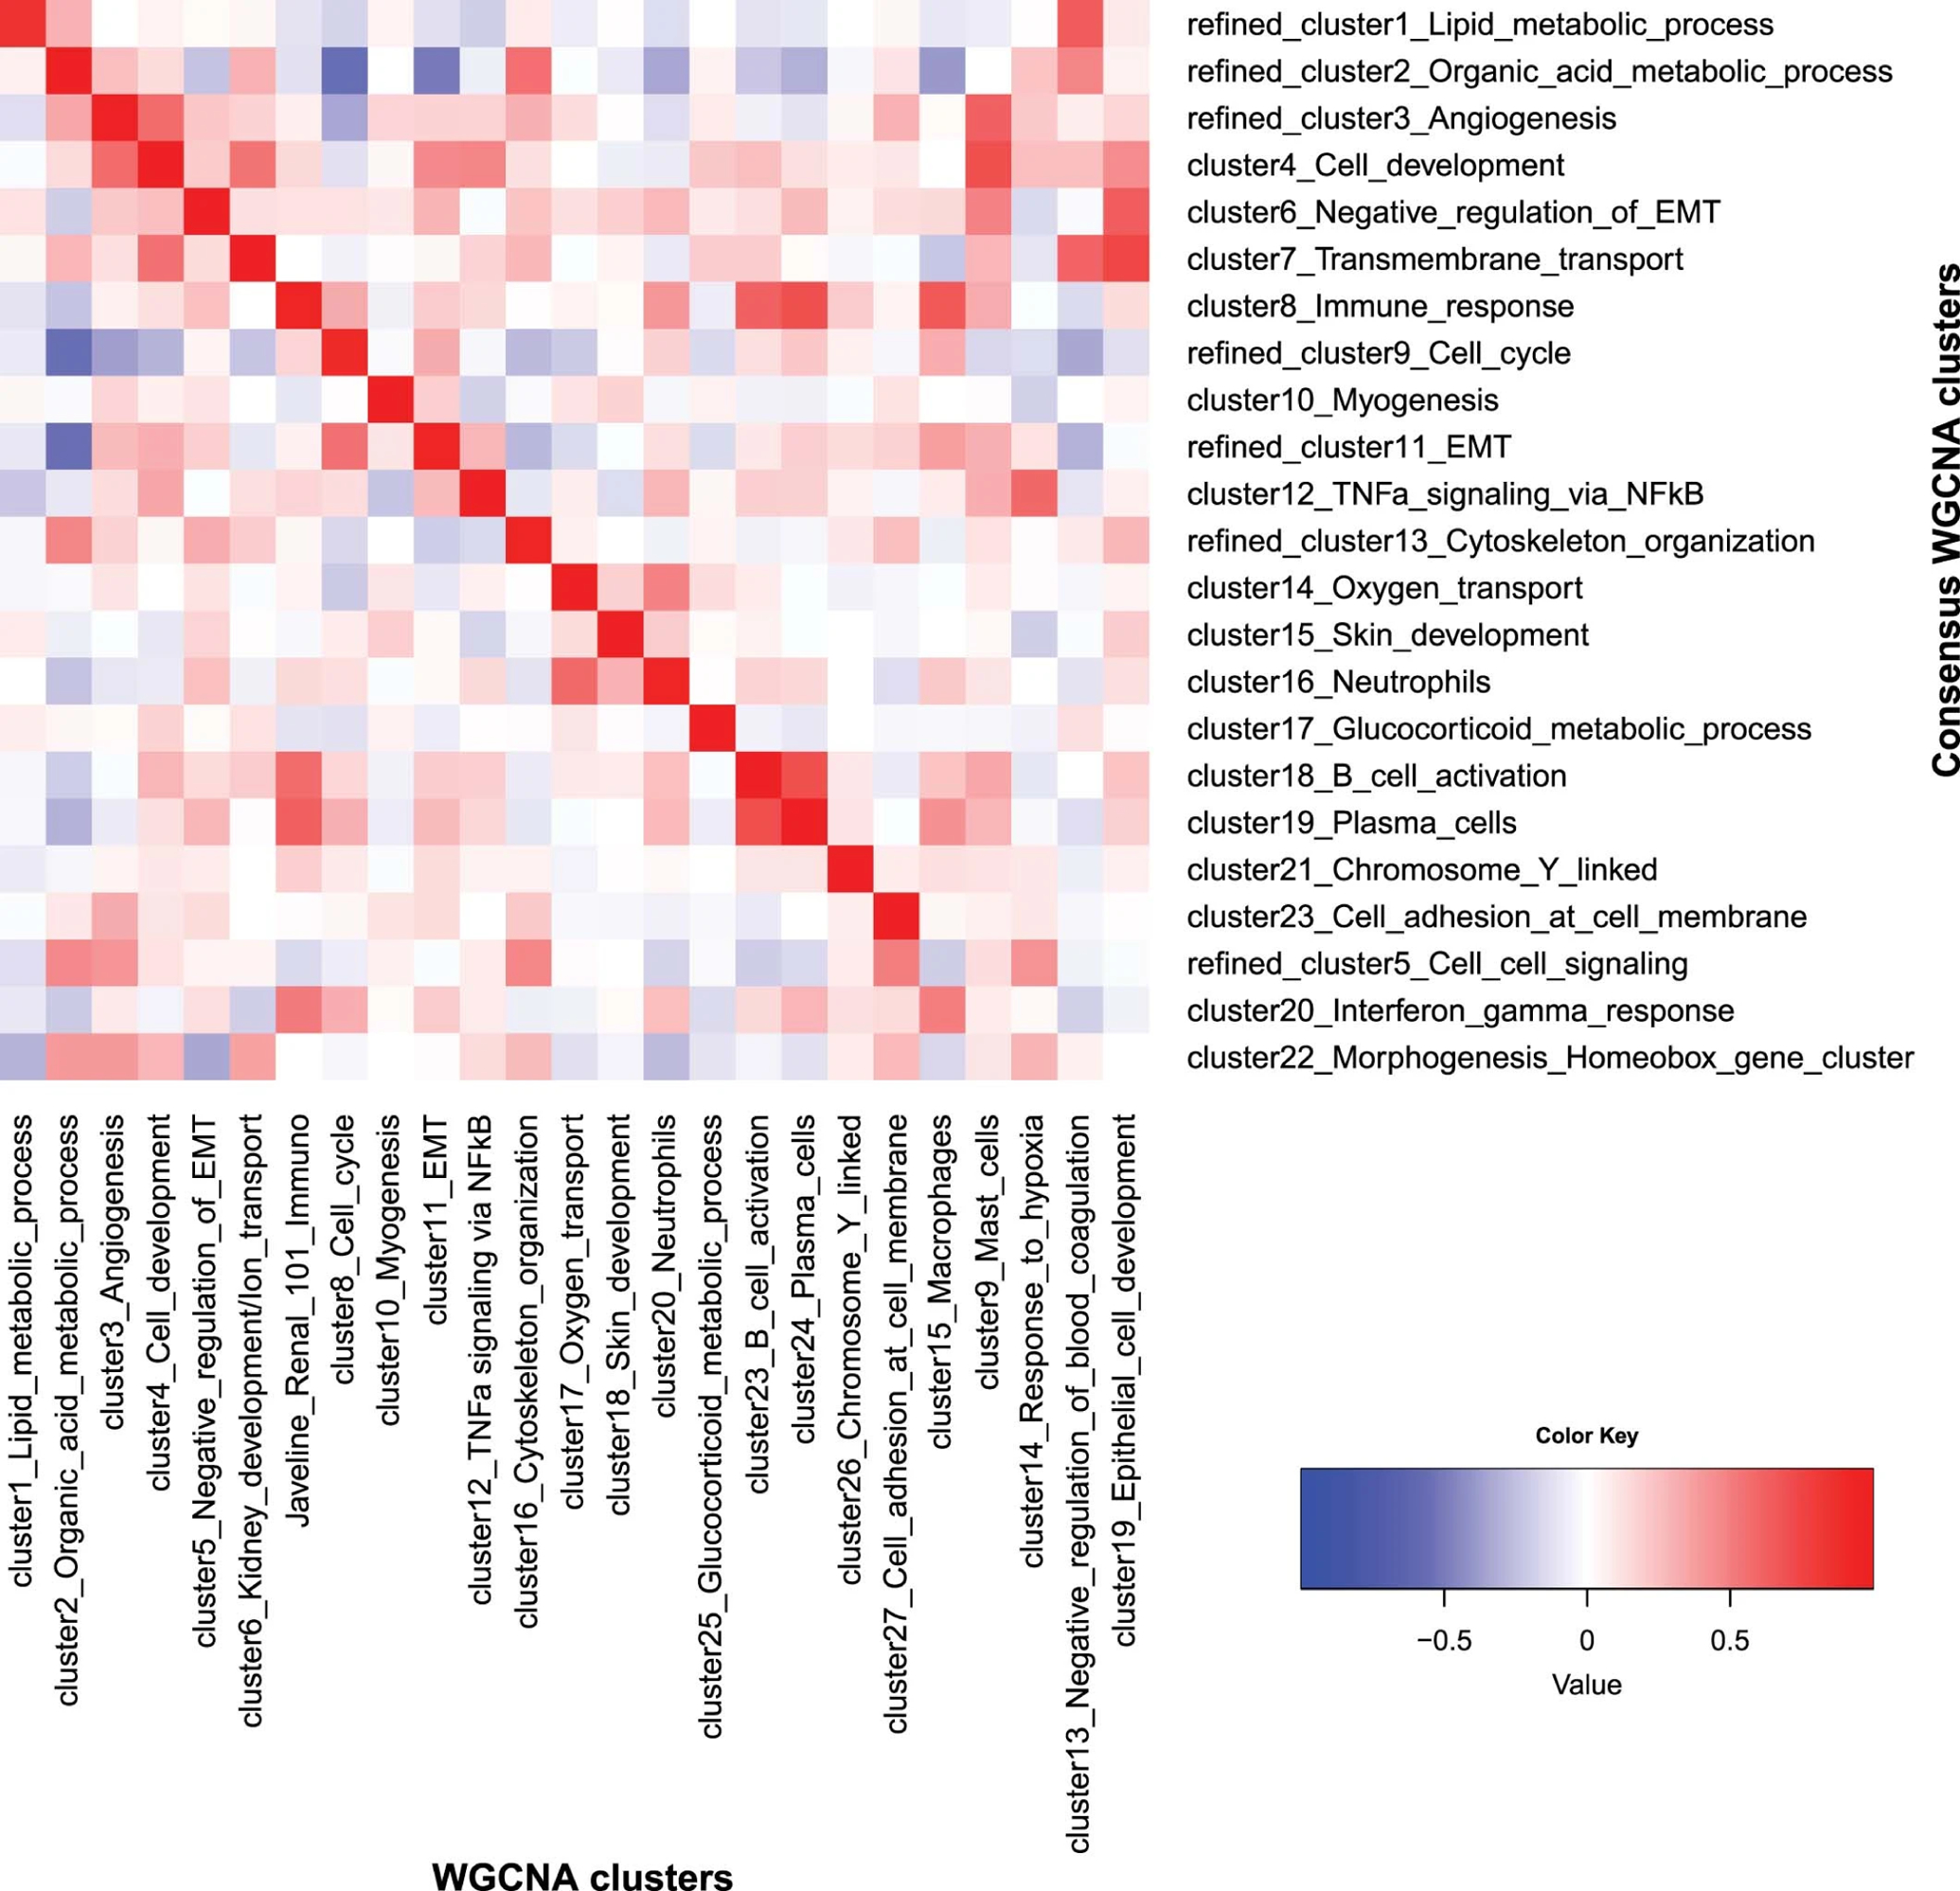
The heatmap depicts Pearson correlation of signature scores between the 25 original WGCNA clusters and the 23 consensus WGCNA clusters. It demonstrates that 20 of the clusters can be robustly found by both methods. These 20 clusters have been annotated by hypergeometric tests for the top enriched pathways, respectively, and they indeed have the highest correlation to the cluster with a matching annotation by the other method. Three clusters by the consensus method and five clusters by WGCNA (at the bottom right of the heatmap) do not have a matching cluster using the other method, representing contributions from multiple other clusters/biological processes. Importantly, the 26-gene JAVELIN Renal 101 Immuno signature identified by the WGCNA method is highly correlated with the immune response cluster by the consensus method (correlation=0.95, P value <2.2e-16), confirming the robustness of the WGCNA findings.
Extended Data Fig. 5: Volcano plot of association of coexpression signatures with PFS in the combination arm.
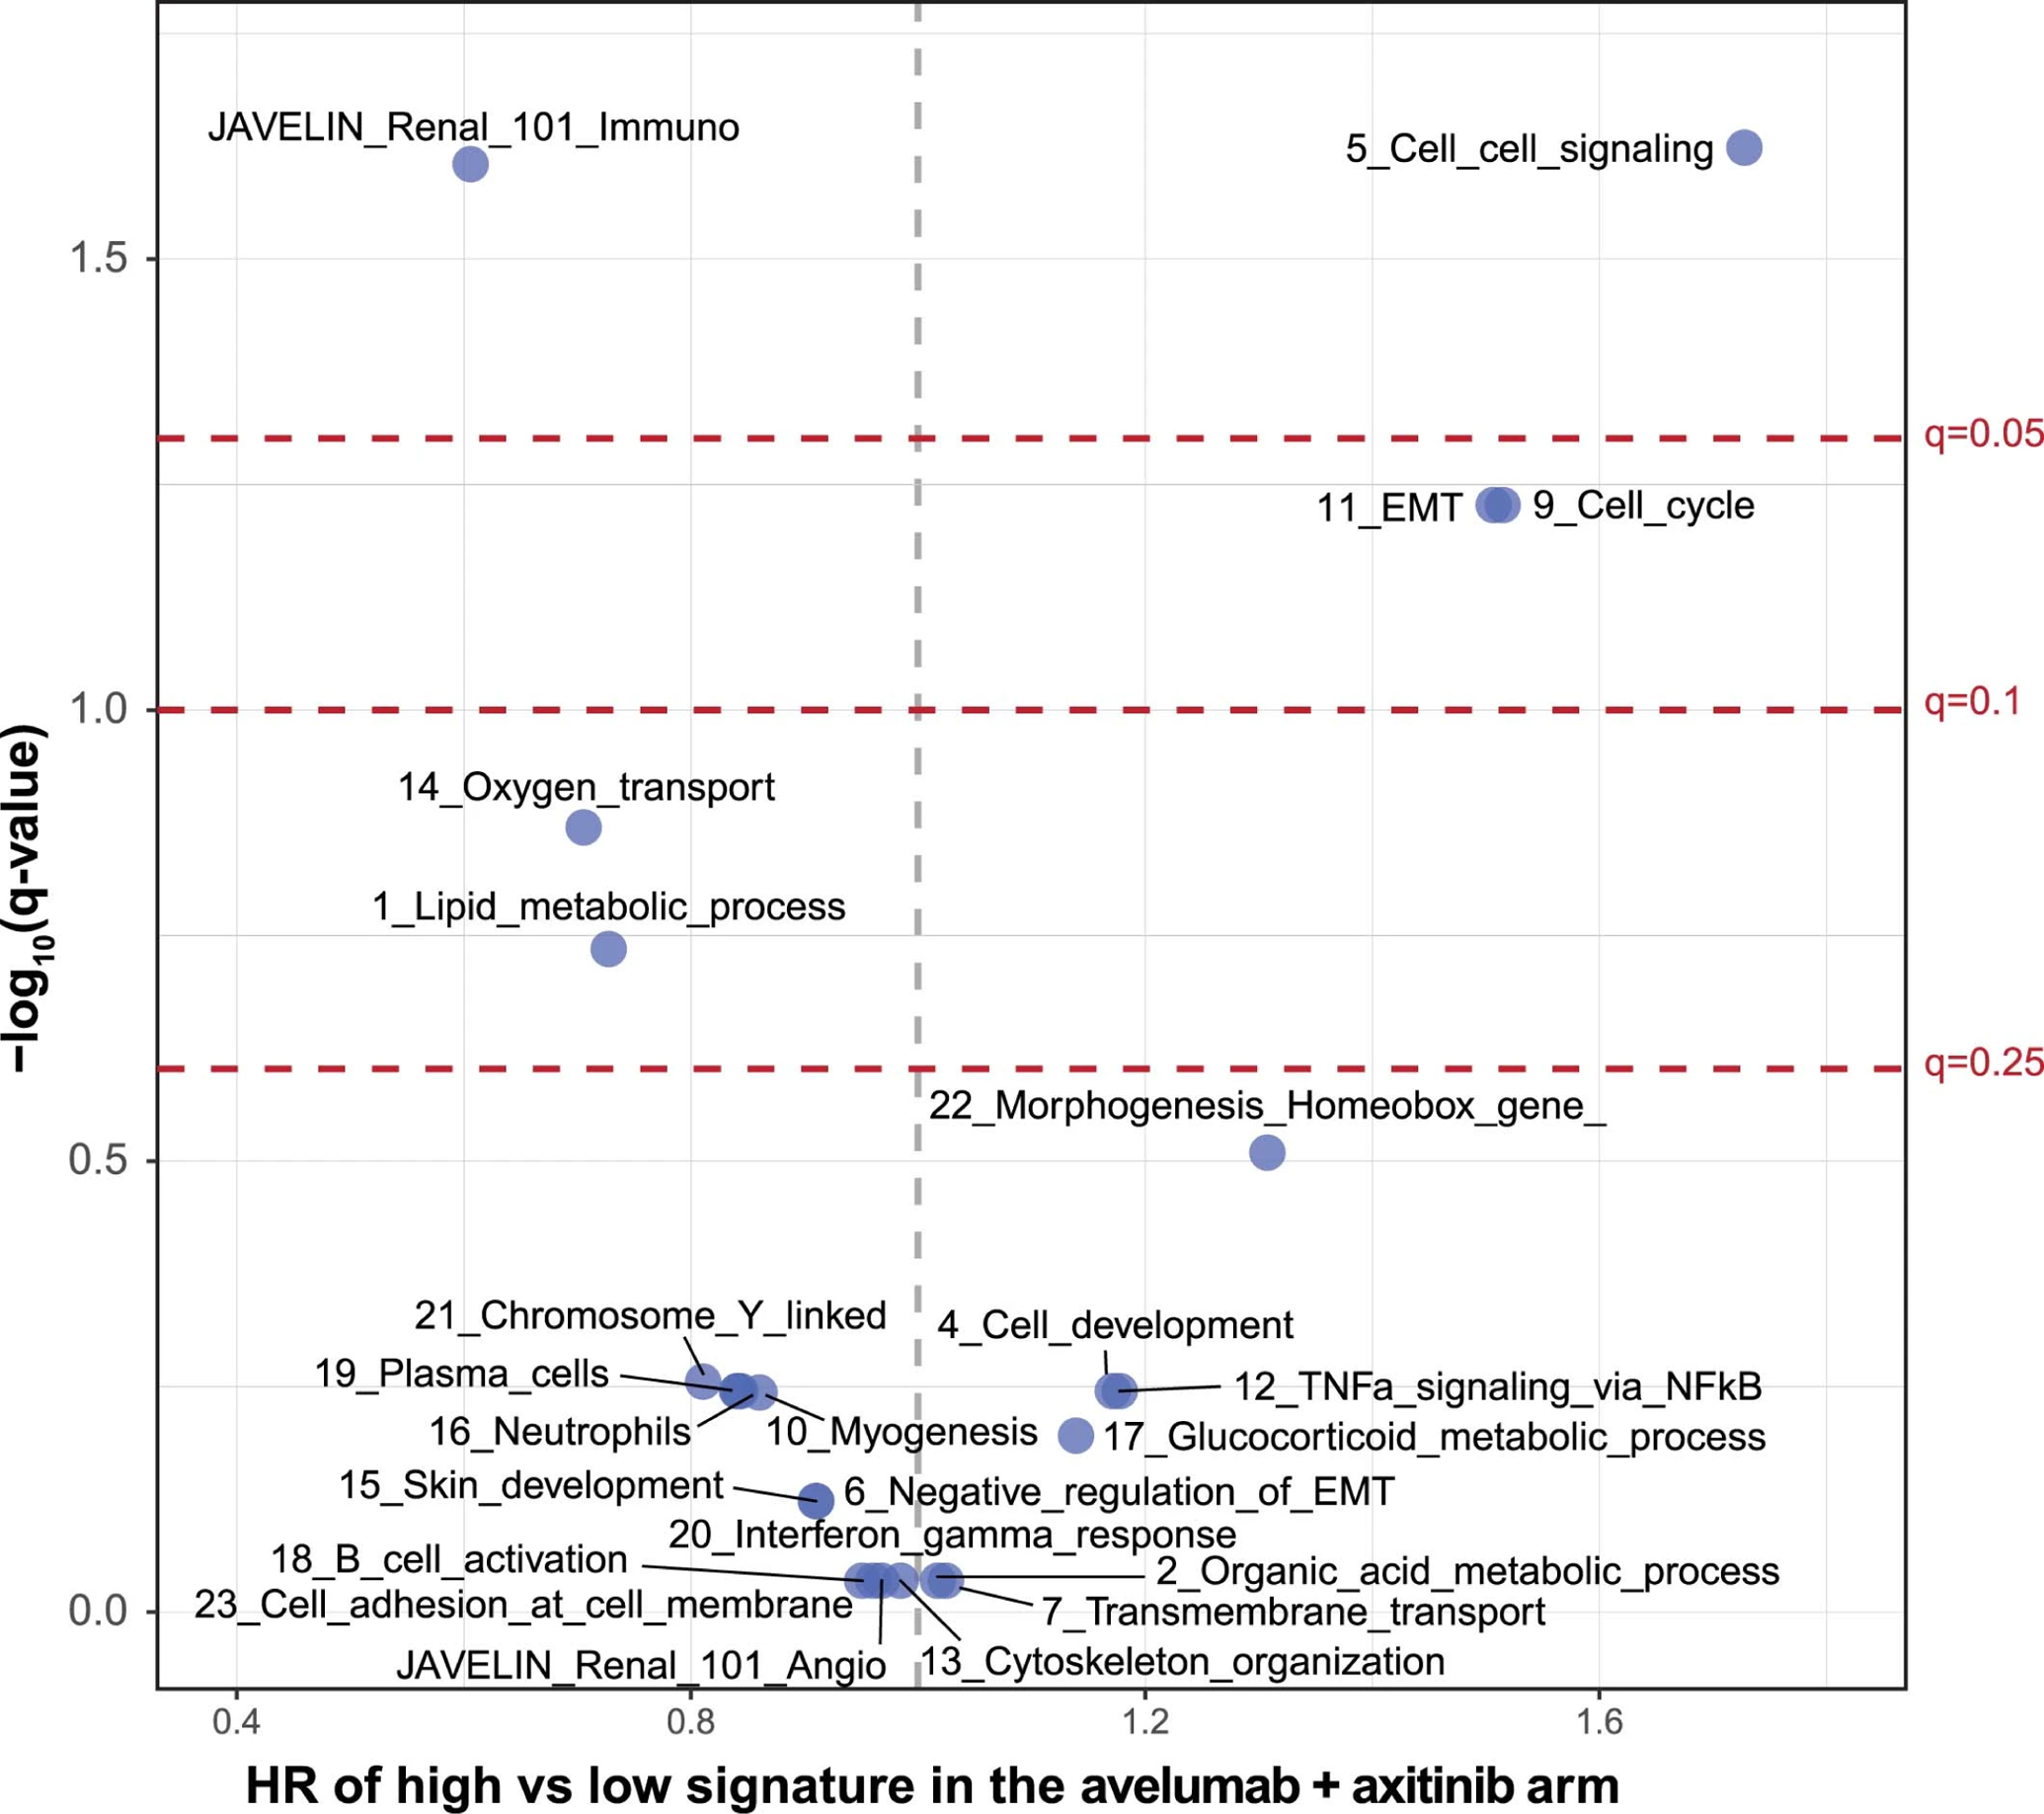
Cox proportional hazards model was used and <median (low) group is the reference group. Two-sided Wald test was used for P values. Q values were derived from multiple hypothesis adjustment using FDR.
Extended Data Fig. 6: Progression-free survival according to metabolic pathways: (a) oxygen transport, (b) lipid metabolism, (c) organic acid metabolism and (d) glucocorticoid metabolism.
Cox proportional hazards model was used and <median group was the reference group. Two-sided Wald test was used for P values. No multiple hypothesis adjustment was made.
Extended Data Fig. 7: Correlation between DUX4 signature and expression of HLA-A, -B, and -C.
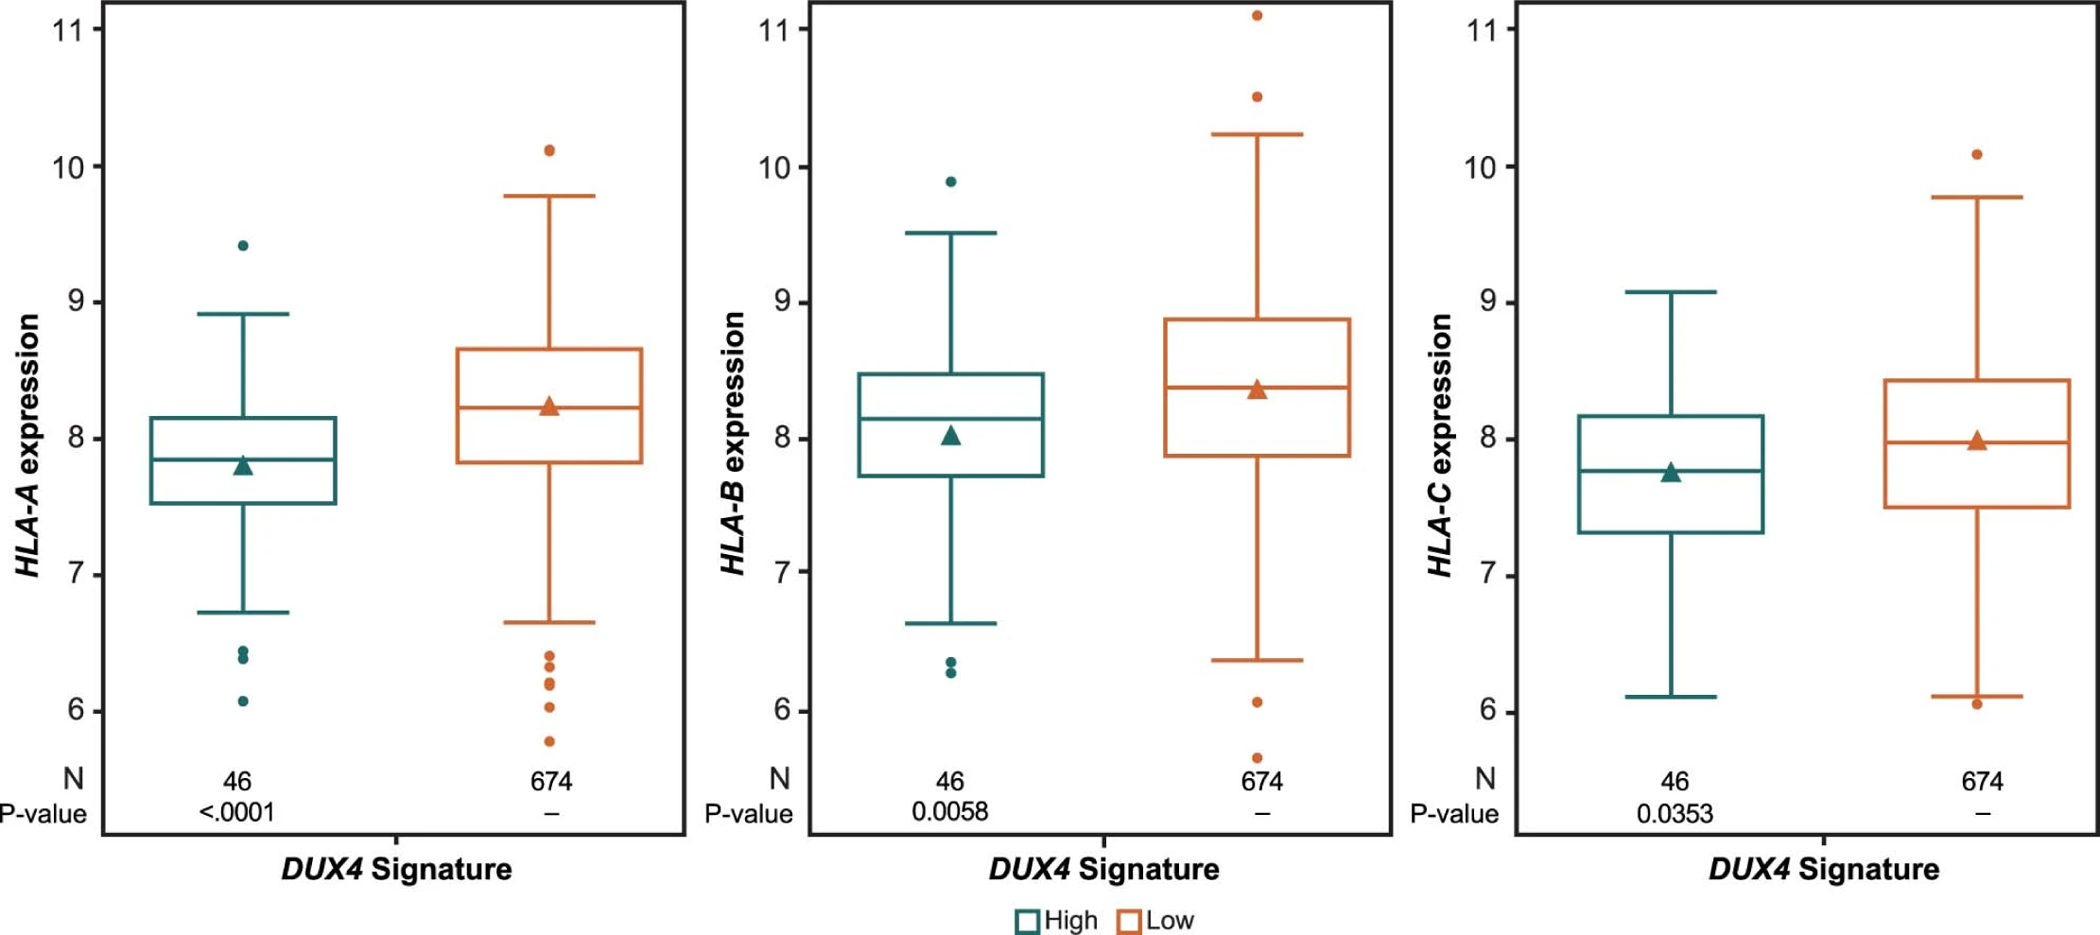
The triangle symbol in the box represents the mean value. The horizontal line in the box represents the median. Upper and lower box lines represent the third and first quartiles, respectively. Two-sided P value is from Wilcoxon rank-sum test. Analysis value is converted to log2.
Extended Data Fig. 8: HLA types associated with differential progression-free survival.
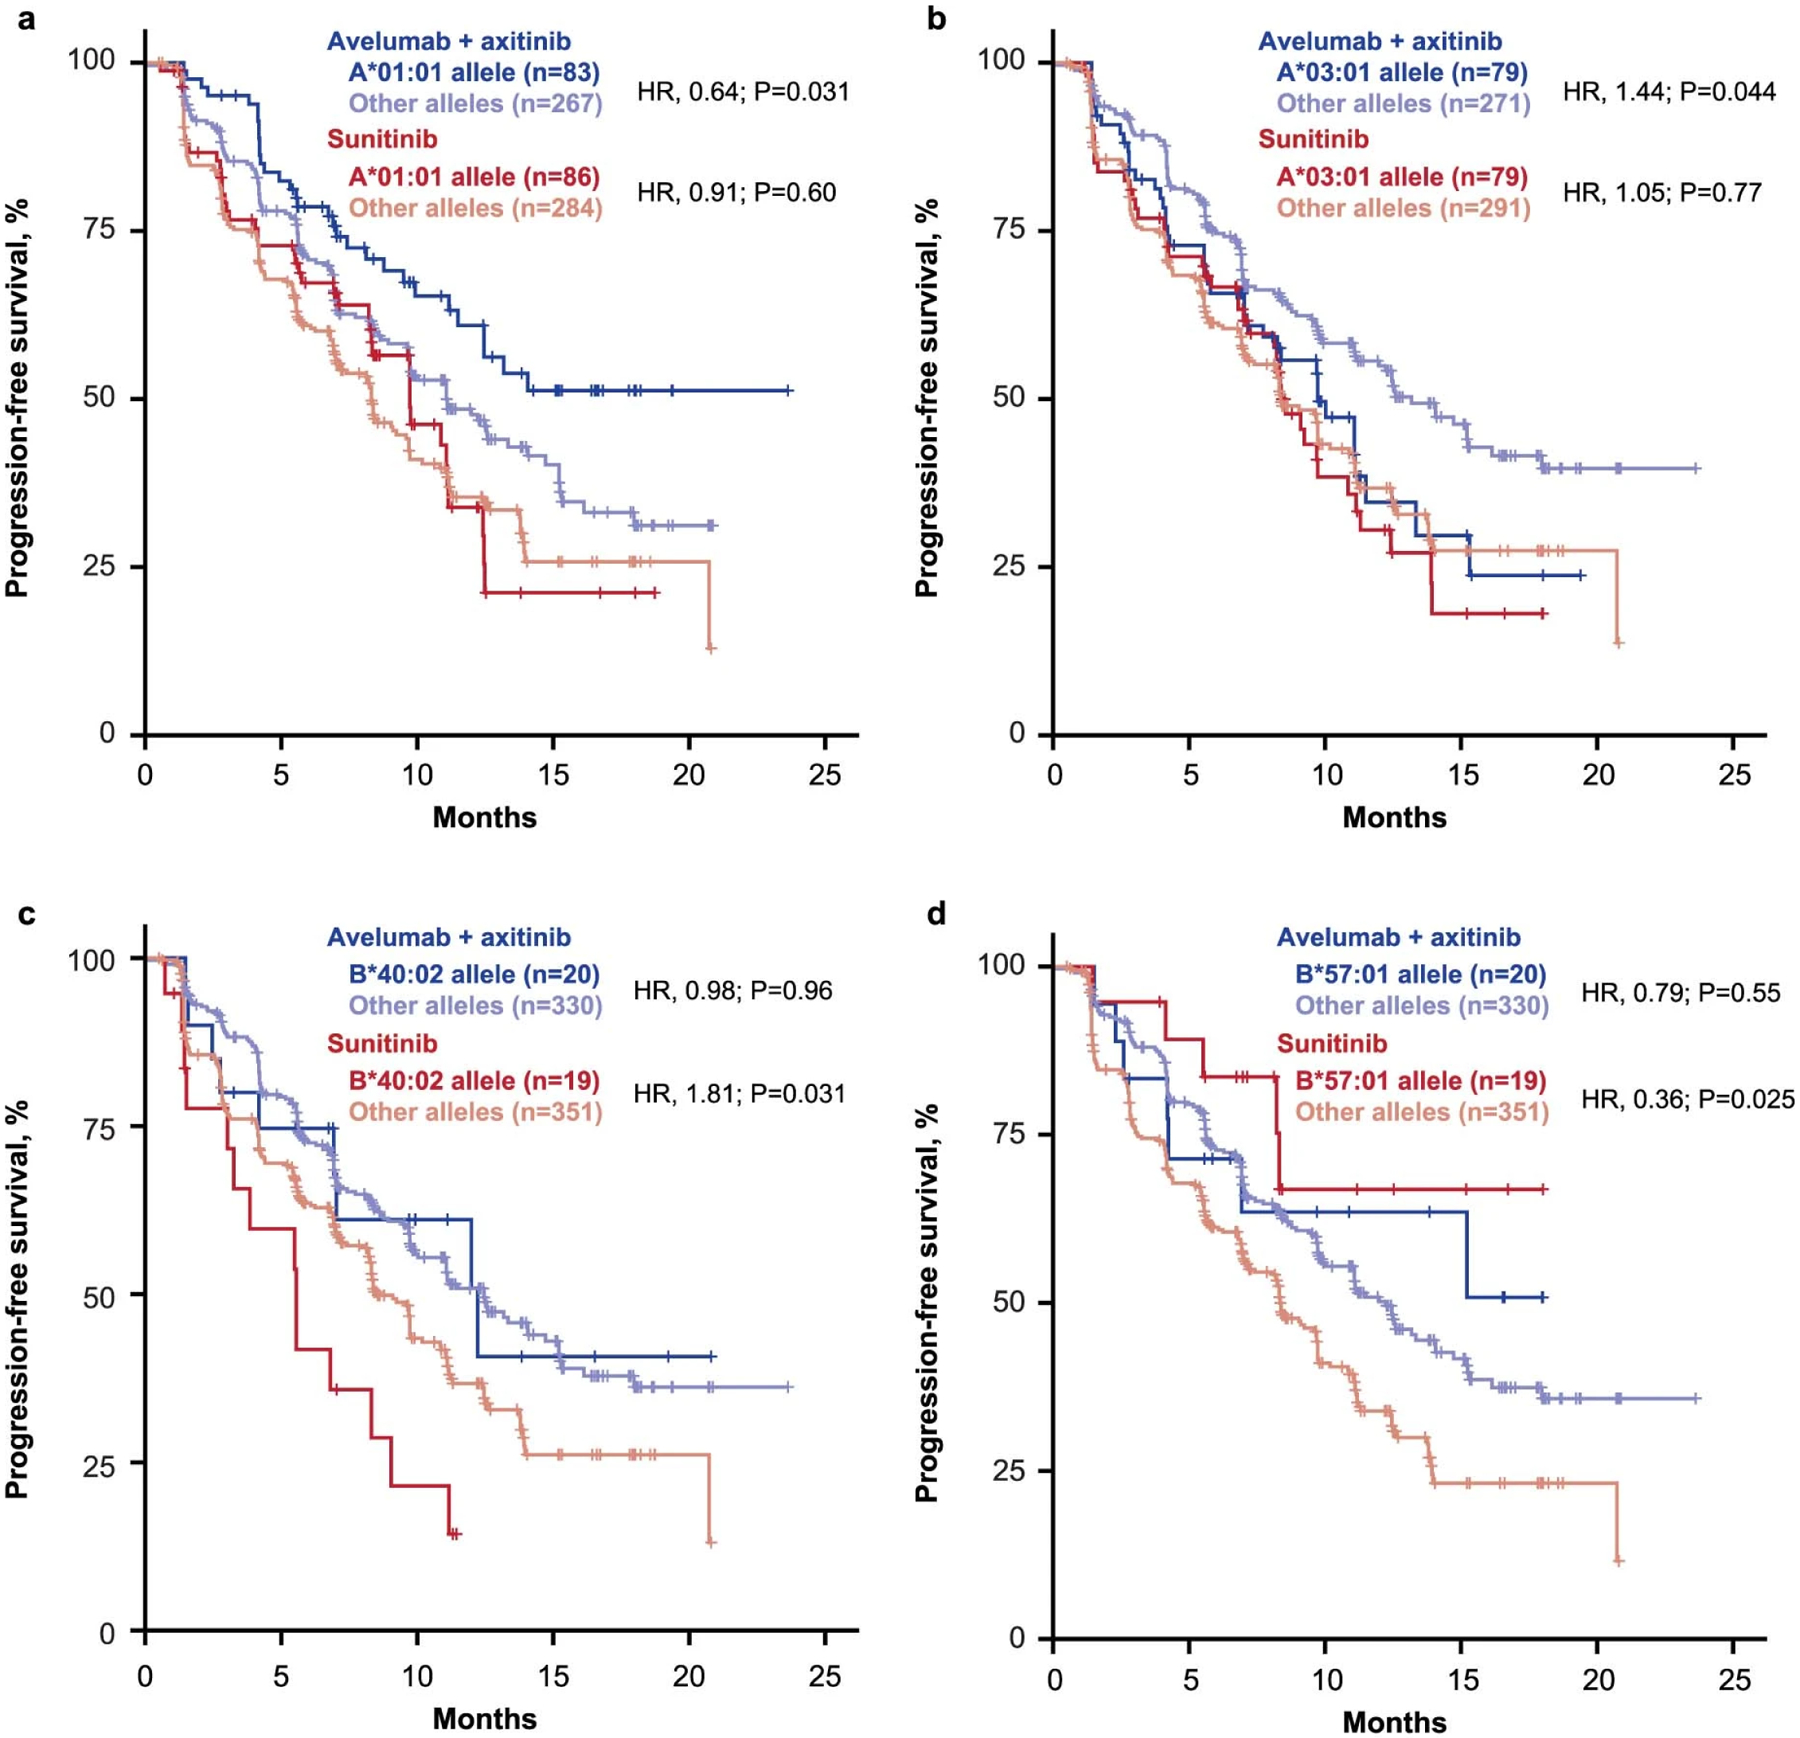
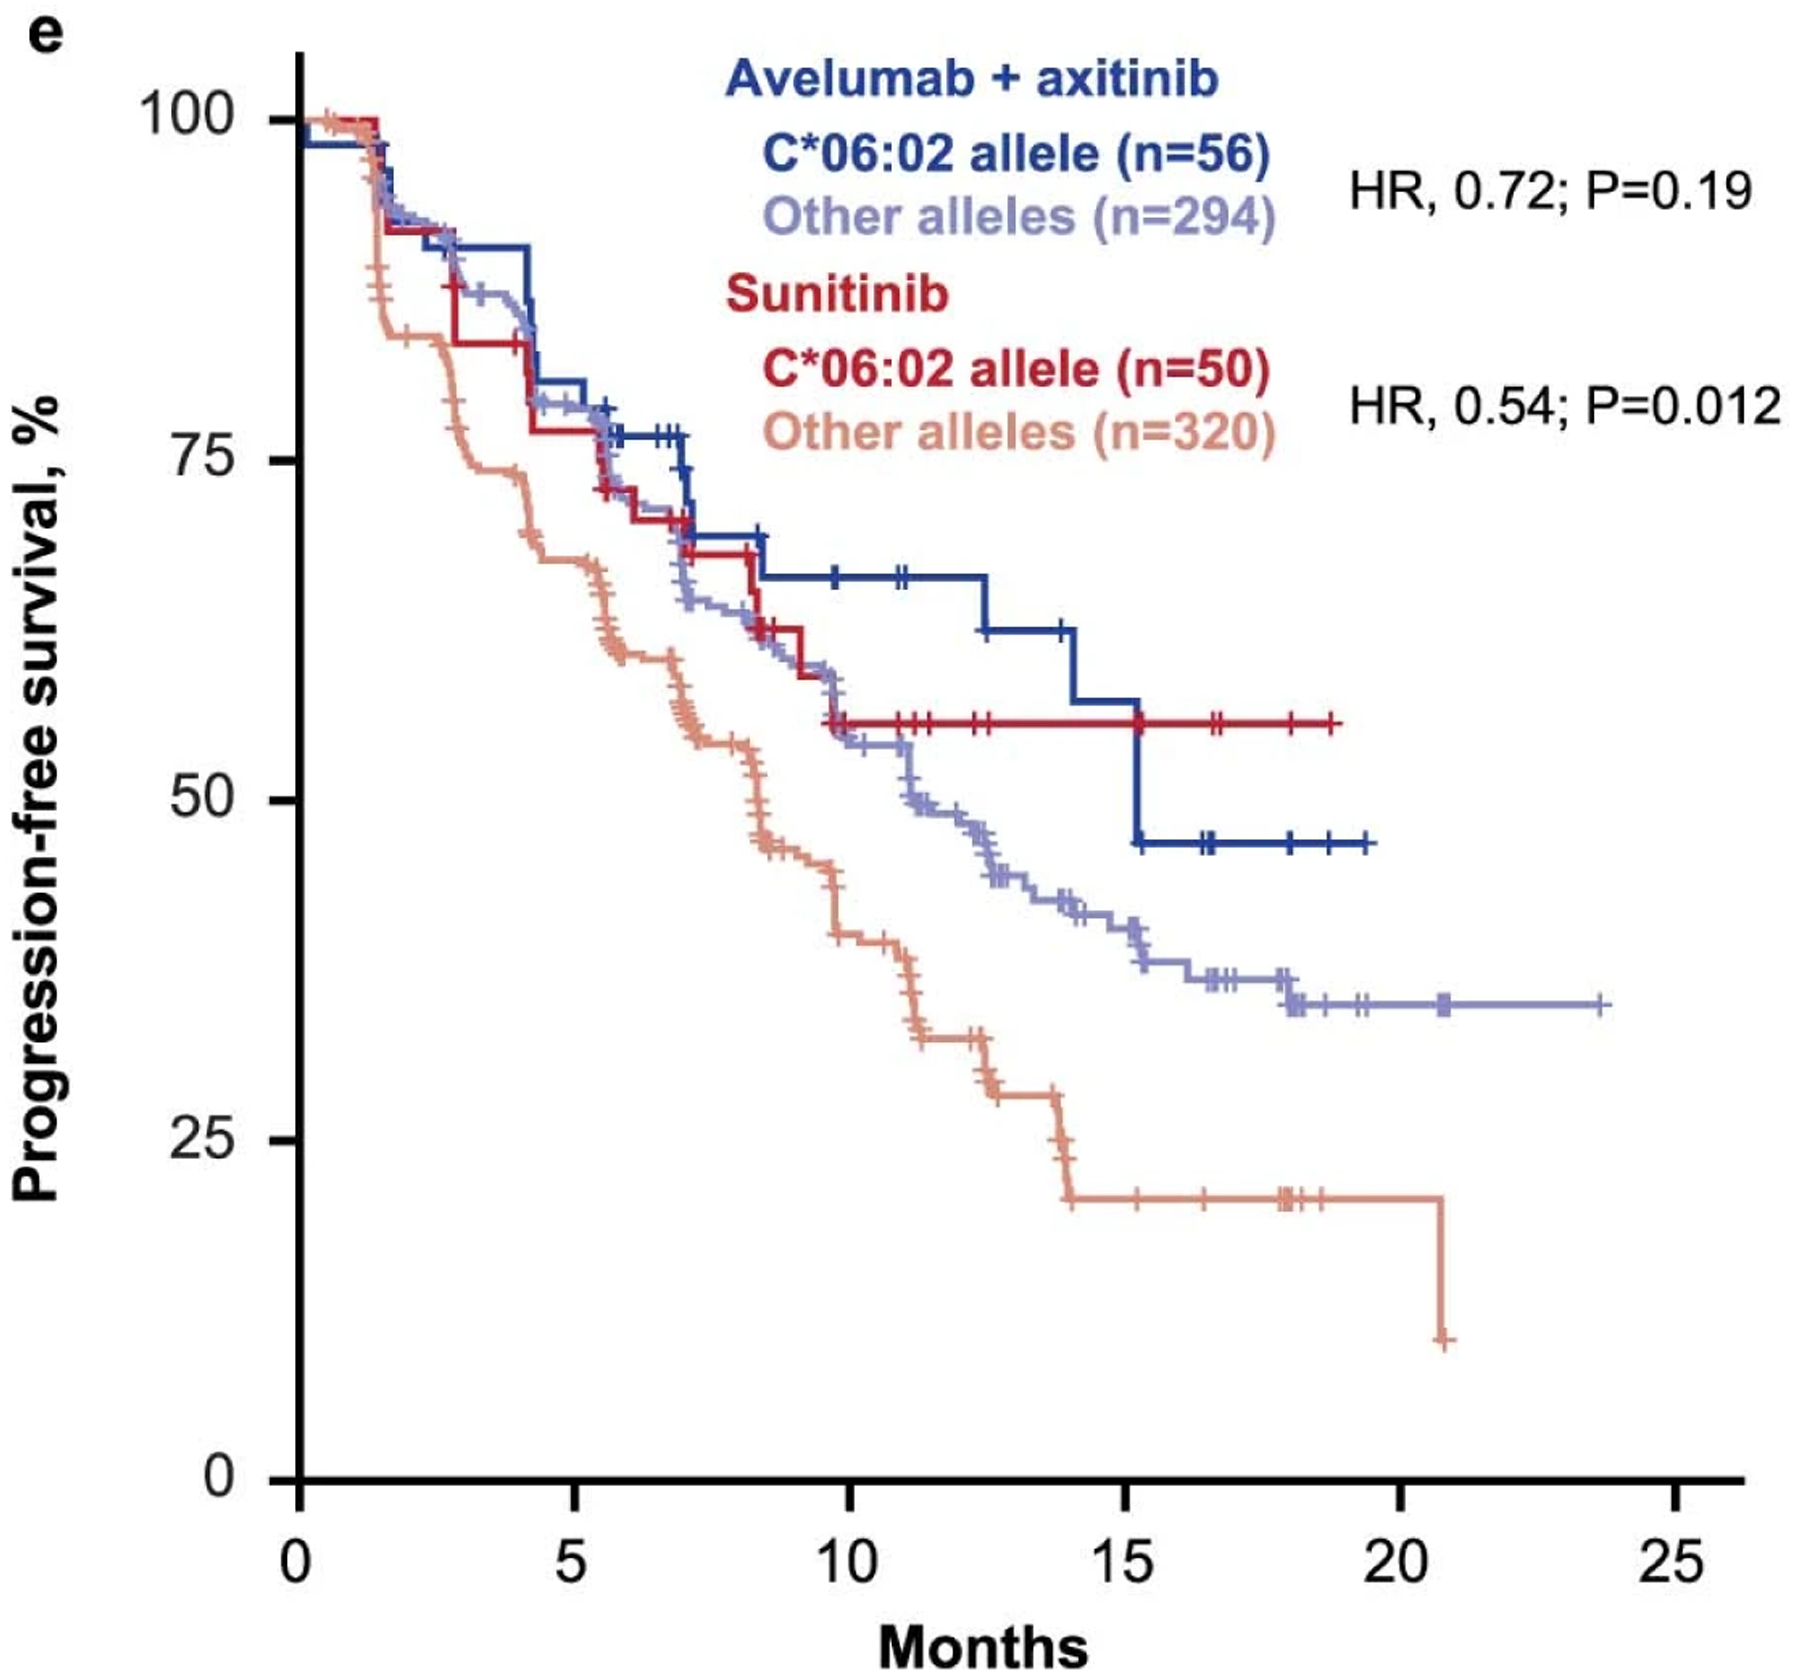
Cox proportional hazards model was used, and the Other alleles group was the reference group. Two-sided Wald test was used for P values. No multiple hypothesis adjustment was made.
Extended Data Fig. 9: Effect of Fcγ receptor gene polymorphisms on progression-free survival.
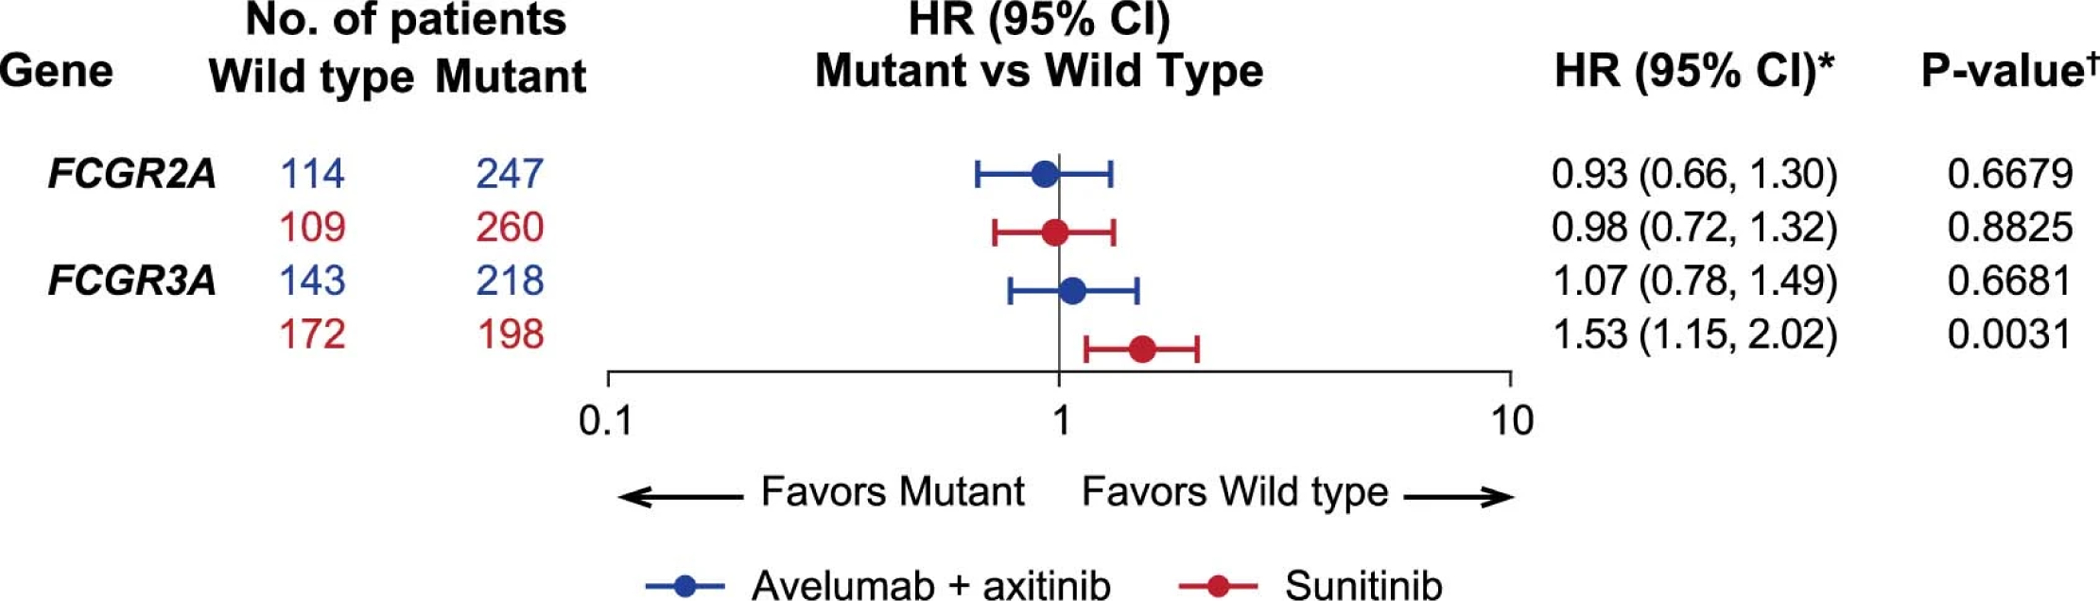
*Cox proportional hazards model with wild type as the reference group was used to calculate HR and 95% CI. An HR < 1 indicates better survival in the mutant group, while an HR > 1 indicates better survival in the wild type group. †Two-sided log-rank test was performed to compare between wild type and mutant groups.
Extended Data Fig. 10: Impact of PTEN mutation in combination with other mutations of interest on progression-free survival (PFS) in the (left) avelumab + axitinib and (right) sunitinib arm.
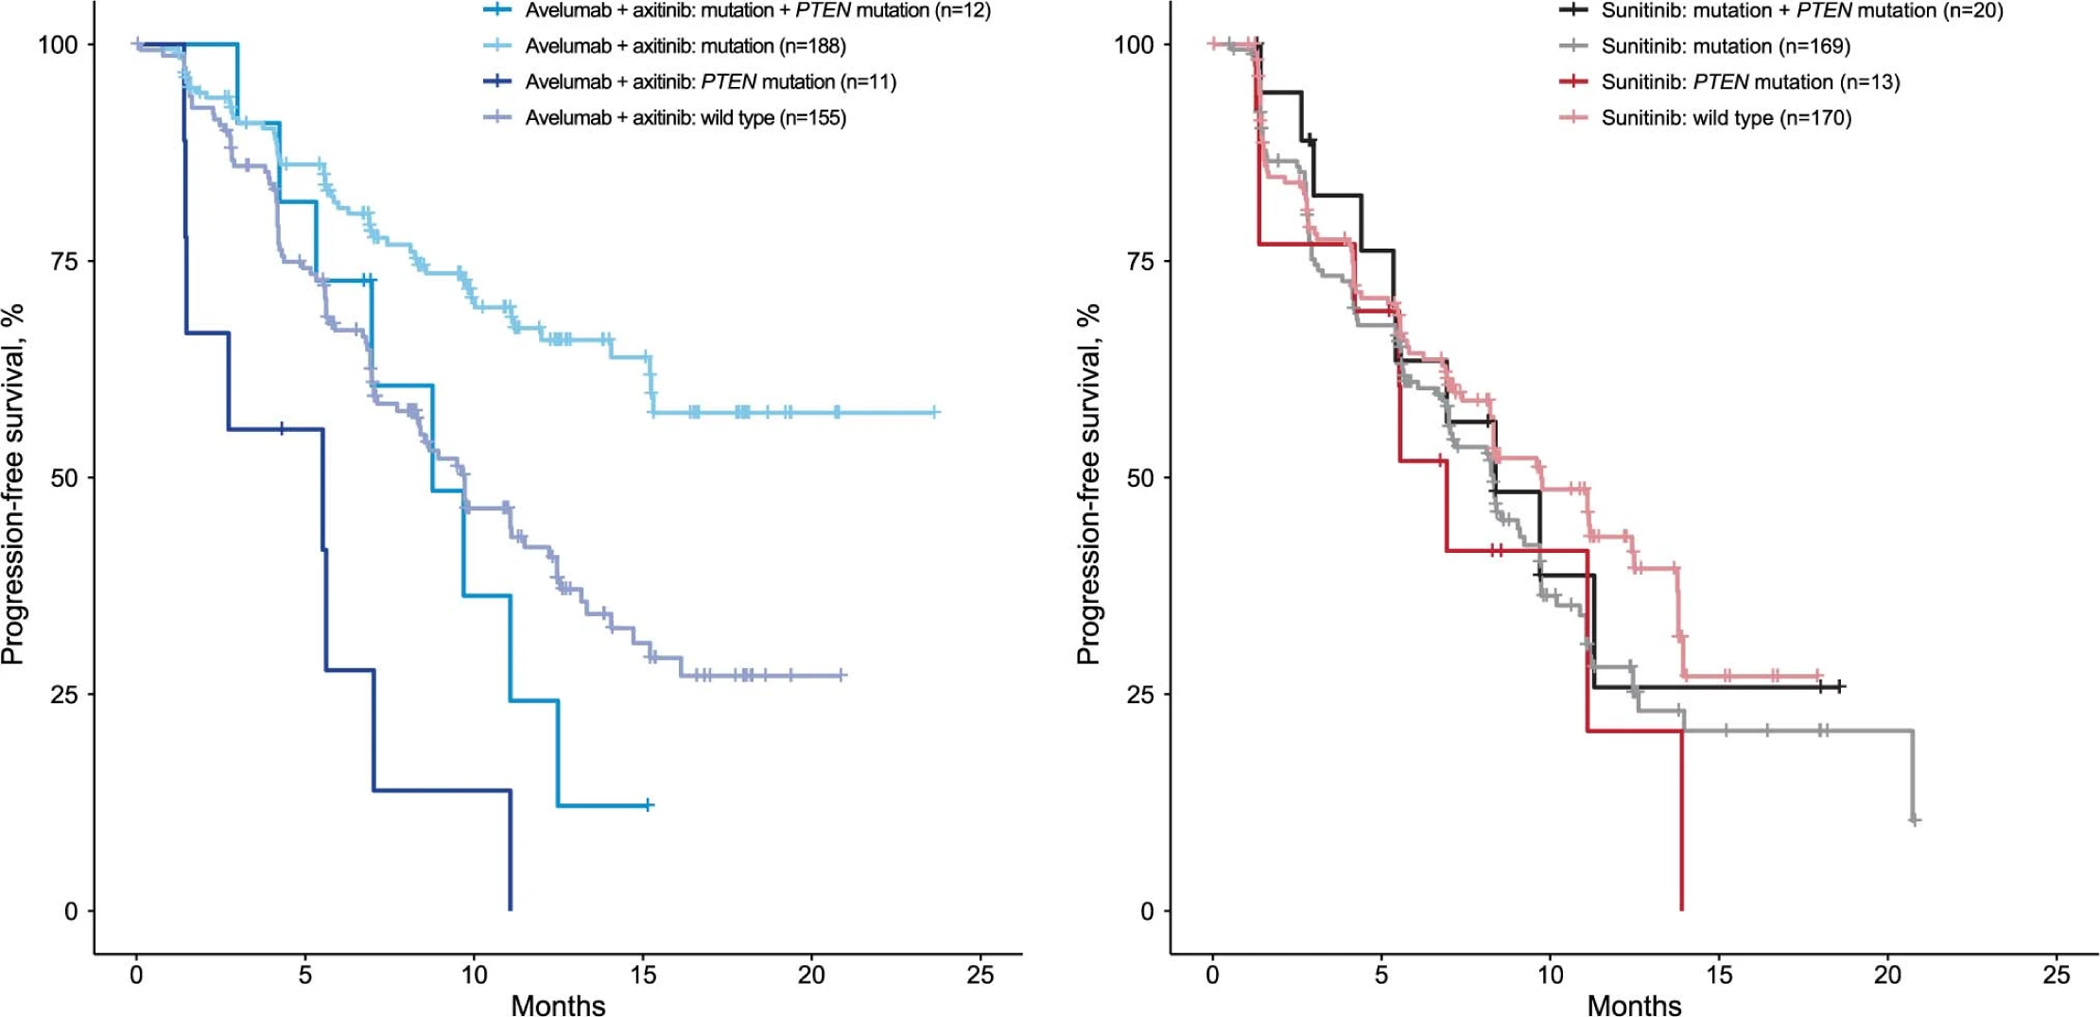
Kaplan-Meier analysis was done to evaluate the association of PFS and the presence of PTEN mutations in combination with other mutations of interest (Cox proportional hazards model).
Supplementary Material
Acknowledgments
The authors thank the patients and their families, and the investigators, co-investigators, and study teams at each of the participating centers. The authors also thank R.-Y. Tzeng, D. Eleuteri, E. Conley, and J. Imus for their assistance with programming, and Y. Waumans, K. Marien, and D. Peeters from Histogenex. This trial was sponsored by Pfizer, Inc, New York, NY, USA, and is part of an alliance between Pfizer and Merck KGaA, Darmstadt, Germany. Patients treated at Memorial Sloan Kettering Cancer Center were supported in part by Memorial Sloan Kettering Cancer Center Support Grant/Core Grant (P30 CA008748). Medical writing support was provided by S. Rosebeck of ClinicalThinking, Inc, Hamilton, NJ, USA, and funded by Pfizer, Inc, New York, NY, USA, and Merck KGaA, Darmstadt, Germany.
Competing interests
R.J.M. reports a consulting or advisory role for Pfizer, Novartis, Eisai, Exelixis, Merck, Genentech, Incyte, Lilly, and Roche; research funding from Pfizer (Institution), Bristol-Myers Squibb (Institution), Eisai (Institution), Novartis (Institution), Genentech (Institution), and Roche (Institution); and reimbursement for travel, accommodations, and expenses from Bristol-Myers Squibb.
P.B.R. is an employee of Pfizer.
T.P. reports personal fees from AZ, BMS, Eisai, Roche/Genentech, Seattle Genetics, MSD, GSK, Pfizer, Astellas, Merck Serono, Novartis, Ferring, Exelixis. Grants from AZ and Roche outside the submitted work.
L.A. reports a consulting/advisory role for Novartis (Institution), Amgen (Institution), Bristol-Myers Squibb (Institution), Ipsen (Institution), Roche (Institution), Pfizer (Institution), Astellas Pharma (Institution), Merck (Institution), MSD (Institution), AstraZeneca (Institution), Exelixis (Institution), Corvus Pharmaceuticals (Institution), Peloton therapeutics (Institution) and research funding from Bristol-Myers Squibb (Institution).
J.B.H. reports grants and institutional fees from BMS, MSD, Novartis, and Neon Therapeutics, and institutional fees from Pfizer, Roche/Genentech, Bayer, Amgen, Immunocore, Sanofi, Seattle Genetics, Gadeta BV, GSK, Celsius Therapeutics, and AstraZeneca/Medimmune outside the submitted work.
J.L. reports personal fees from Eisai, Roche/Genentech, Secarna, Pierre Fabre, EUSA Pharma, MSD, GSK, and Kymab, and grants and personal fees from BMS, Pfizer, and Novartis outside the submitted work.
X.J.M. is an employee of Pfizer.
K.A.C. is an employee of Pfizer.
M.U. has nothing to disclose.
S.P. reports a consulting/advisory role for Genentech, Aveo, Eisai, Roche, Pfizer, Novartis, Exelixis, Ipsen, BMS, Astellas
B.A. reports personal fees from Amgen, grants and personal fees from Astellas, grants and personal fees from AstraZeneca, grants and personal fees from Bayer, grants and personal fees from Bristol-Myers Squibb, personal fees from Ferring, grants from Ipsen, grants and personal fees from Janssen, grants and personal fees from MSD, grants and personal fees from Pfizer, grants and personal fees from Roche, grants and personal fees from Sanofi outside the submitted work.
G.G. has nothing to disclose.
M.T.C. reports personal fees from Eisai Medical Research Inc, EMD Serono, Inc., Apricity Health LLC, Pfizer Inc., Genentech, Inc., and Taiho Pharmaceutical Company, Inc., outside the submitted work.
K.P. has nothing to disclose.
J.L.L. reports grants and personal fees from Pfizer Korea, other from Eisai Korea, and personal fees from Ipsen Korea, Janssen, Sanofi Aventis, Novartis Korea, Astellas Korea, and BMS Korea outside the submitted work.
S.H. is an employee of Pfizer.
X.W. is an employee of Pfizer.
W.Z. is an employee of Pfizer.
J.W. is an employee of Pfizer.
A.C. is an employee of Pfizer.
A.d.P. is an employee of Pfizer.
A.C.D. is an employee of Pfizer.
T.K.C. reports grants received during the conduct of the study from Pfizer; personal fees received outside the conduct of the study from Agensys, Alexion, Alligent, American Society of Clinical Oncology, Analysis Group, AstraZeneca, Bayer, Bristol-Myers Squibb, Celldex, Cerulean, Clinical Care Options, Corvus, Dana-Farber Cancer Institute, EMD Serono, Eisai, Exelixis, Foundation Medicine, Genentech/Roche, GlaxoSmithKline, Harborside Press, Heron, Ipsen, Kidney Cancer Association, Kidney Cancer Journal, L-path, Lancet Oncology, Lilly, Merck, Michael J. Hennessy Associates, National Comprehensive Cancer Network, Navinata Health, New England Journal of Medicine, Novartis, Peloton Therapeutics, Pfizer, PlatformQ Health, Prometheus Laboratories, Sanofi/Aventis, Seattle Genetics/Astellas, and UpToDate; grants received outside the conduct of the study from AstraZeneca, Bayer, Bristol-Myers Squibb, Calithera, Cerulean, Corvus, Eisai, Exelixis, Foundation Medicine, Genentech/Roche, GlaxoSmithKline, Ipsen, Merck, Novartis, Peloton Therapeutics, Pfizer, Prometheus Laboratories, Takeda, and Tracon; and medical writing and editorial assistance provided by ClinicalThinking, Envision Pharma Group, Fishawack Group of Companies, Health Interactions, and Parexel and funded by pharmaceutical companies.
Role of the funding source.
The trial was sponsored by Pfizer, Inc, and is part of an alliance between Pfizer and Merck KGaA, Darmstadt, Germany. Pfizer and Merck KGaA provided the study drugs. The investigators worked with Pfizer on the trial design, collection and analysis of data, and interpretation of results. Datasets were reviewed by the authors, and all authors participated fully in developing and reviewing the report for publication. Funding for a professional medical writer with access to the data was provided by the sponsors. All authors had full access to all data, and the first author had final responsibility for the decision to submit for publication. The authors vouch for the completeness and accuracy of the data and its analysis, and the fidelity of the trial to the protocol and statistical analysis plan.
Data availability
All relevant data are available and are included with the manuscript. Clinical response data are in Supplementary Table 11. CD8 summary IHC data are in Supplementary Table 12. Normalized RNA-seq data are in Supplementary Table 13. RNA-seq deconvolution data (ImmuneNet) are in Supplementary Table 14. Gene sets analyzed in this study are in Supplementary Table 15. Pathway scores are in Supplementary Table 16. HLA subtypes in JAVELIN Renal 101 patients are in Supplementary Table 17. WES data summary statistics are in Supplementary Table 18. MATH scores are in Supplementary Table 19. FCGR2A and FCGR3A mutation data are in Supplementary Table 20. Gene mutation status data are in Supplementary Table 21. Databases used in this analysis included TCGA (doi:10.1038/nature12222) and MSigDB (doi:10.1093/bioinformatics/btr260). In addition, subject to certain criteria, conditions and exceptions, Pfizer will also provide access to the related individual anonymized participant data. Please also see https://www.pfizer.com/science/clinical-trials/trial-data-and-results for more information.
References
- 1.Heery CR, O’Sullivan-Coyne G, Madan RA, et al. Avelumab for metastatic or locally advanced previously treated solid tumours (JAVELIN Solid Tumor): a phase 1a, multicohort, dose-escalation trial. The Lancet Oncology. 2017;18(5):587–598. doi: 10.1016/S1470-2045(17)30239-5 [DOI] [PMC free article] [PubMed] [Google Scholar]
- 2.Motzer RJ, Penkov K, Haanen J, et al. Avelumab plus Axitinib versus Sunitinib for Advanced Renal-Cell Carcinoma. N Engl J Med. 2019;380(12):1103–1115. doi: 10.1056/NEJMoa1816047 [DOI] [PMC free article] [PubMed] [Google Scholar]
- 3.McDermott DF, Huseni MA, Atkins MB, et al. Clinical activity and molecular correlates of response to atezolizumab alone or in combination with bevacizumab versus sunitinib in renal cell carcinoma. Nature Medicine. 2018;24(6):749. doi: 10.1038/s41591-018-0053-3 [DOI] [PMC free article] [PubMed] [Google Scholar]
- 4.The Cancer Genome Atlas Research Network. Comprehensive molecular characterization of clear cell renal cell carcinoma. Nature. 2013;499(7456):43–49. doi: 10.1038/nature12222 [DOI] [PMC free article] [PubMed] [Google Scholar]
- 5.Ayers M, Lunceford J, Nebozhyn M, et al. IFN-γ-related mRNA profile predicts clinical response to PD-1 blockade. J Clin Invest. 2017;127(8):2930–2940. doi: 10.1172/JCI91190 [DOI] [PMC free article] [PubMed] [Google Scholar]
- 6.Choueiri TK, Larkin J, Oya M, et al. Preliminary results for avelumab plus axitinib as first-line therapy in patients with advanced clear-cell renal-cell carcinoma (JAVELIN Renal 100): an open-label, dose-finding and dose-expansion, phase 1b trial. The Lancet Oncology. 2018;19(4):451–460. doi: 10.1016/S1470-2045(18)30107-4 [DOI] [PubMed] [Google Scholar]
- 7.Avelumab in Metastatic or Locally Advanced Solid Tumors (JAVELIN Solid Tumor) - Full Text View - ClinicalTrials.gov. AccessedApril 3, 2020. https://clinicaltrials.gov/ct2/show/NCT01772004
- 8.Chew G-L, Campbell AE, De Neef E, et al. DUX4 Suppresses MHC Class I to Promote Cancer Immune Evasion and Resistance to Checkpoint Blockade. Developmental Cell. 2019;50(5):658–671.e7. doi: 10.1016/j.devcel.2019.06.011 [DOI] [PMC free article] [PubMed] [Google Scholar]
- 9.Geng LN, Yao Z, Snider L, et al. DUX4 Activates Germline Genes, Retroelements, and Immune Mediators: Implications for Facioscapulohumeral Dystrophy. Developmental Cell. 2012;22(1):38–51. doi: 10.1016/j.devcel.2011.11.013 [DOI] [PMC free article] [PubMed] [Google Scholar]
- 10.Smith KGC, Clatworthy MR. FcγRIIB in autoimmunity and infection: evolutionary and therapeutic implications. Nature Reviews Immunology. 2010;10(5):328–343. doi: 10.1038/nri2762 [DOI] [PMC free article] [PubMed] [Google Scholar]
- 11.Choueiri TK, Albiges L, Haanen JBAG, et al. Biomarker analyses from JAVELIN Renal 101: Avelumab + axitinib (A+Ax) versus sunitinib (S) in advanced renal cell carcinoma (aRCC). JCO. 2019;37(15_suppl):101–101. doi: 10.1200/JCO.2019.37.15_suppl.101 [DOI] [Google Scholar]
- 12.Choueiri TK, Figueroa DJ, Fay AP, et al. Correlation of PD-L1 tumor expression and treatment outcomes in patients with renal cell carcinoma receiving sunitinib or pazopanib: results from COMPARZ, a randomized controlled trial. Clin Cancer Res. 2015;21(5):1071–1077. doi: 10.1158/1078-0432.CCR-14-1993 [DOI] [PubMed] [Google Scholar]
- 13.Rini BI, Plimack ER, Stus V, et al. Pembrolizumab plus Axitinib versus Sunitinib for Advanced Renal-Cell Carcinoma. N Engl J Med. 2019;380(12):1116–1127. doi: 10.1056/NEJMoa1816714 [DOI] [PubMed] [Google Scholar]
- 14.Motzer RJ, Tannir NM, McDermott DF, et al. Nivolumab plus Ipilimumab versus Sunitinib in Advanced Renal-Cell Carcinoma. New England Journal of Medicine. 2018;378(14):1277–1290. doi: 10.1056/NEJMoa1712126 [DOI] [PMC free article] [PubMed] [Google Scholar]
- 15.Nakano O, Sato M, Naito Y, et al. Proliferative Activity of Intratumoral CD8+ T-Lymphocytes As a Prognostic Factor in Human Renal Cell Carcinoma: Clinicopathologic Demonstration of Antitumor Immunity. Cancer Res. 2001;61(13):5132–5136. [PubMed] [Google Scholar]
- 16.Barnes TA, Amir E. HYPE or HOPE: the prognostic value of infiltrating immune cells in cancer. British Journal of Cancer. 2017;117(4):451–460. doi: 10.1038/bjc.2017.220 [DOI] [PMC free article] [PubMed] [Google Scholar]
- 17.Hubler MJ, Kennedy AJ. Role of lipids in the metabolism and activation of immune cells. J Nutr Biochem. 2016;34:1–7. doi: 10.1016/j.jnutbio.2015.11.002 [DOI] [PMC free article] [PubMed] [Google Scholar]
- 18.Coates CJ, Decker H. Immunological properties of oxygen-transport proteins: hemoglobin, hemocyanin and hemerythrin. Cell Mol Life Sci. 2017;74(2):293–317. doi: 10.1007/s00018-016-2326-7 [DOI] [PMC free article] [PubMed] [Google Scholar]
- 19.Masiero M, Simões FC, Han HD, et al. A core human primary tumor angiogenesis signature identifies the endothelial orphan receptor ELTD1 as a key regulator of angiogenesis. Cancer Cell. 2013;24(2):229–241. doi: 10.1016/j.ccr.2013.06.004 [DOI] [PMC free article] [PubMed] [Google Scholar]
- 20.Robinson G, Parker M, Kranenburg TA, et al. Novel mutations target distinct subgroups of medulloblastoma. Nature. 2012;488(7409):43–48. doi: 10.1038/nature11213 [DOI] [PMC free article] [PubMed] [Google Scholar]
- 21.Crompton BD, Stewart C, Taylor-Weiner A, et al. The genomic landscape of pediatric Ewing sarcoma. Cancer Discov. 2014;4(11):1326–1341. doi: 10.1158/2159-8290.CD-13-1037 [DOI] [PubMed] [Google Scholar]
- 22.Gröbner SN, Worst BC, Weischenfeldt J, et al. The landscape of genomic alterations across childhood cancers. Nature. 2018;555(7696):321–327. doi: 10.1038/nature25480 [DOI] [PubMed] [Google Scholar]
- 23.Oberg JA, Glade Bender JL, Sulis ML, et al. Implementation of next generation sequencing into pediatric hematology-oncology practice: moving beyond actionable alterations. Genome Med. 2016;8(1):133. doi: 10.1186/s13073-016-0389-6 [DOI] [PMC free article] [PubMed] [Google Scholar]
- 24.Hugo W, Zaretsky JM, Sun L, et al. Genomic and Transcriptomic Features of Response to Anti-PD-1 Therapy in Metastatic Melanoma. Cell. 2016;165(1):35–44. doi: 10.1016/j.cell.2016.02.065 [DOI] [PMC free article] [PubMed] [Google Scholar]
- 25.Riaz N, Havel JJ, Makarov V, et al. Tumor and Microenvironment Evolution during Immunotherapy with Nivolumab. Cell. 2017;171(4):934–949.e16. doi: 10.1016/j.cell.2017.09.028 [DOI] [PMC free article] [PubMed] [Google Scholar]
- 26.Sharma V, Harafuji N, Belayew A, Chen Y-W. DUX4 Differentially Regulates Transcriptomes of Human Rhabdomyosarcoma and Mouse C2C12 Cells. PLOS ONE. 2013;8(5):e64691. doi: 10.1371/journal.pone.0064691 [DOI] [PMC free article] [PubMed] [Google Scholar]
- 27.Ribas A Adaptive Immune Resistance: How Cancer Protects from Immune Attack. Cancer Discov. 2015;5(9):915–919. doi: 10.1158/2159-8290.CD-15-0563 [DOI] [PMC free article] [PubMed] [Google Scholar]
- 28.Szolek A, Schubert B, Mohr C, Sturm M, Feldhahn M, Kohlbacher O. OptiType: precision HLA typing from next-generation sequencing data. Bioinformatics. 2014;30(23):3310–3316. doi: 10.1093/bioinformatics/btu548 [DOI] [PMC free article] [PubMed] [Google Scholar]
- 29.Data4Cure - Home. AccessedApril 30, 2020. https://www.data4cure.com/
- 30.Newman AM, Liu CL, Green MR, et al. Robust enumeration of cell subsets from tissue expression profiles. Nature Methods. 2015;12(5):453–457. doi: 10.1038/nmeth.3337 [DOI] [PMC free article] [PubMed] [Google Scholar]
- 31.Langfelder P, Horvath S. WGCNA: an R package for weighted correlation network analysis. BMC Bioinformatics. 2008;9(1):559. doi: 10.1186/1471-2105-9-559 [DOI] [PMC free article] [PubMed] [Google Scholar]
- 32.Andersen PK, Gill RD. Cox’s Regression Model for Counting Processes: A Large Sample Study. The Annals of Statistics. 1982;10(4):1100–1120. [Google Scholar]
- 33.Therneau TM, Grambsch PM. Modeling Survival Data: Extending the Cox Model. Springer-Verlag; 2000. doi: 10.1007/978-1-4757-3294-8 [DOI] [Google Scholar]
- 34.Liberzon A, Birger C, Thorvaldsdóttir H, Ghandi M, Mesirov JP, Tamayo P. The Molecular Signatures Database Hallmark Gene Set Collection. Cell Systems. 2015;1(6):417–425. doi: 10.1016/j.cels.2015.12.004 [DOI] [PMC free article] [PubMed] [Google Scholar]
- 35.Liberzon A, Subramanian A, Pinchback R, Thorvaldsdóttir H, Tamayo P, Mesirov JP. Molecular signatures database (MSigDB) 3.0. Bioinformatics. 2011;27(12):1739–1740. doi: 10.1093/bioinformatics/btr260 [DOI] [PMC free article] [PubMed] [Google Scholar]
- 36.Roland CL, Lynn KD, Toombs JE, Dineen SP, Udugamasooriya DG, Brekken RA. Cytokine Levels Correlate with Immune Cell Infiltration after Anti-VEGF Therapy in Preclinical Mouse Models of Breast Cancer. PLOS ONE. 2009;4(11):e7669. doi: 10.1371/journal.pone.0007669 [DOI] [PMC free article] [PubMed] [Google Scholar]
- 37.Choueiri TK, Fishman MN, Escudier B, et al. Immunomodulatory Activity of Nivolumab in Metastatic Renal Cell Carcinoma. Clin Cancer Res. 2016;22(22):5461–5471. doi: 10.1158/1078-0432.CCR-15-2839 [DOI] [PMC free article] [PubMed] [Google Scholar]
- 38.Brauer MJ, Zhuang G, Schmidt M, et al. Identification and Analysis of In Vivo VEGF Downstream Markers Link VEGF Pathway Activity with Efficacy of Anti-VEGF Therapies. Clin Cancer Res. 2013;19(13):3681–3692. doi: 10.1158/1078-0432.CCR-12-3635 [DOI] [PubMed] [Google Scholar]
- 39.Fehrenbacher L, Spira A, Ballinger M, et al. Atezolizumab versus docetaxel for patients with previously treated non-small-cell lung cancer (POPLAR): a multicentre, open-label, phase 2 randomised controlled trial. The Lancet. 2016;387(10030):1837–1846. doi: 10.1016/S0140-6736(16)00587-0 [DOI] [PubMed] [Google Scholar]
- 40.Scheller J, Chalaris A, Schmidt-Arras D, Rose-John S. The pro- and anti-inflammatory properties of the cytokine interleukin-6. Biochimica et Biophysica Acta (BBA) - Molecular Cell Research. 2011;1813(5):878–888. doi: 10.1016/j.bbamcr.2011.01.034 [DOI] [PubMed] [Google Scholar]
- 41.Russo L, Esposito D, Lamy F-X, et al. Characteristics, treatment patterns and safety events from 4 cohorts of advanced or metastatic cancer patients based on health care claims data. JCO. 2018;36(15_suppl):e13603–e13603. doi: 10.1200/JCO.2018.36.15_suppl.e13603 [DOI] [Google Scholar]
- 42.Ha H, Debnath B, Neamati N. Role of the CXCL8-CXCR1/2 Axis in Cancer and Inflammatory Diseases. Theranostics. 2017;7(6):1543–1588. doi: 10.7150/thno.15625 [DOI] [PMC free article] [PubMed] [Google Scholar]
- 43.Zelenay S, van der Veen AG, Böttcher JP, et al. Cyclooxygenase-Dependent Tumor Growth through Evasion of Immunity. Cell. 2015;162(6):1257–1270. doi: 10.1016/j.cell.2015.08.015 [DOI] [PMC free article] [PubMed] [Google Scholar]
- 44.Powles T, Nickles D, Van Allen E, et al. Immune biomarkers associated with clinical benefit from atezolizumab (MPDL3280a; anti-PD-L1) in advanced urothelial bladder cancer (UBC). Journal for ImmunoTherapy of Cancer. 2015;3(2):P83. doi: 10.1186/2051-1426-3-S2-P83 [DOI] [Google Scholar]
- 45.Zou H, Hastie T. Regularization and Variable Selection via the Elastic Net. Journal of the Royal Statistical Society Series B (Statistical Methodology). 2005;67(2):301–320. [Google Scholar]
- 46.Love MI, Huber W, Anders S. Moderated estimation of fold change and dispersion for RNA-seq data with DESeq2. Genome Biology. 2014;15(12):550. doi: 10.1186/s13059-014-0550-8 [DOI] [PMC free article] [PubMed] [Google Scholar]
Associated Data
This section collects any data citations, data availability statements, or supplementary materials included in this article.
Supplementary Materials
Data Availability Statement
All relevant data are available and are included with the manuscript. Clinical response data are in Supplementary Table 11. CD8 summary IHC data are in Supplementary Table 12. Normalized RNA-seq data are in Supplementary Table 13. RNA-seq deconvolution data (ImmuneNet) are in Supplementary Table 14. Gene sets analyzed in this study are in Supplementary Table 15. Pathway scores are in Supplementary Table 16. HLA subtypes in JAVELIN Renal 101 patients are in Supplementary Table 17. WES data summary statistics are in Supplementary Table 18. MATH scores are in Supplementary Table 19. FCGR2A and FCGR3A mutation data are in Supplementary Table 20. Gene mutation status data are in Supplementary Table 21. Databases used in this analysis included TCGA (doi:10.1038/nature12222) and MSigDB (doi:10.1093/bioinformatics/btr260). In addition, subject to certain criteria, conditions and exceptions, Pfizer will also provide access to the related individual anonymized participant data. Please also see https://www.pfizer.com/science/clinical-trials/trial-data-and-results for more information.