

Abstract
Herein we report the use of fluorescence anisotropy decay for measuring the rotation of six shape-persistent molecular rotors with central naphthalene (2), anthracene (3a, 3b and 3c), tetracene (4), and pentacene (5) rotators axially linked by triple bonds to bulky trialkylsilyl groups of different size. Steady-state and time-resolved polarization measurements carried out in mineral oil confirmed that the vibrationally-resolved lowest energy absorption bands are characterized by a transition dipole moment oriented along the short acene axes, in the direction of the alkyne linkers. Fluorescence lifetimes increased significantly with increasing acene size and moderately with a decrease in the size of the trialkylsilyl group. The fluorescence anisotropy decay for all compounds in mineral oil with a viscosity of ca. 21.6 cP at 40 °C was completed within the fluorescence lifetime, so that the rotational time constants could be obtained via their rotational correlation times, which increased with silyl protecting group size rather than acene size, indicating that polarization decay is determined by tumbling of the molecular rotor about the long acene axis. These results suggest that monitoring the rotational motion of bis(silylethynyl)acenes in restricted media should be possible for media with viscosity values on the order of 21.6 cP or greater.
Graphical Abstract
INTRODUCTION
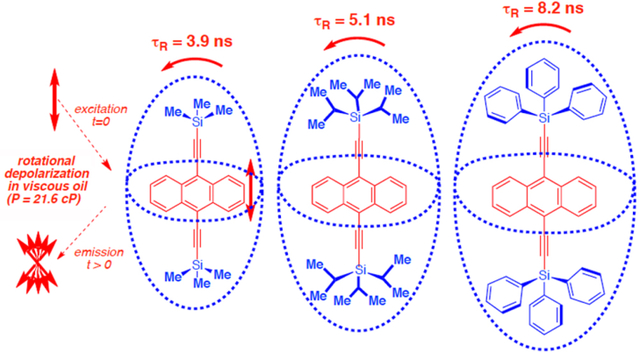
Over the last few years, there has been substantial progress in the design and characterization of molecular rotors in the solid state.1,2 We have shown that dumbbell-shaped molecules with small rotating groups linked by triple bonds to bulky substituents constitute a robust design.1 For example, variable temperature 2H NMR studies show that crystals of 1,4-bis(2-triphenylsilylethynyl)benzene 1 (Scheme 1) display phenylene rotation in the form of 180° flips with correlation times of ca. 166 ns at 298 K.3 Considering that many other analogs have been documented,1,2b–d we became interested in the potential installation of these and other molecular rotors in confined viscous media, such as monolayers and membranes where internal and whole body rotation may occur within similar time scales. With that in mind, we decided to explore a set of molecular rotors designed to determine their whole-body dynamics in a viscous medium by taking advantage of time-resolved fluorescence anisotropy decay.4 This method and other closely related ones have been used extensively to observe the rotation of biomacromolecules,5 polymers,6 and small molecules.7 Time-resolved fluorescence anisotropy decay relies on the rapid generation of polarized emission from a suitable fluorophore followed by the loss of polarization as a result of molecular rotation. The first step relies on the use of a short pulse of linearly polarized light, which selectively excites molecules that happen to have a component of their transition dipole moment for absorption aligned with the direction of polarization. The fluorescence anisotropy measured immediately after pulsed excitation reflects the highest anisotropy, which may be positive or negative depending on the relative orientation of the transition dipole moments associated with excitation and emission, and evolves as a function of time as the emitting molecules reach a randomly oriented (isotropic) state. It should be noted that additional depolarization mechanisms such as energy transfer may compete with random rotation of the chromophore and should also be considered.8 We selected the six molecular rotors shown in Scheme 1. These were built with shape-persistent stators of different bulk, including trimethylsilyl (TMS, 29 and 3a10a), triisopropylsilyl (TIPS, 3b,10b 411 and 59), and triphenylsilyl (TPS, 3c10c). As in the case of 1, these were linked by triple bonds to substituted acene rotators that include naphthalene (2), anthracene (3a, 3b and 3c), tetracene (4) and pentacene (5). Knowing that all these acenes have their lowest energy transition dipole moments aligned with the axis of the triple bonds as indicated with 2 (1La states in the Platt notation),4b,12 we expected that the decay of their fluorescence anisotropy would occur as a function of rotation about the x/y axes. We assumed that molecular rotors 2-5 can be viewed as a set of prolate-shaped molecules with sizes determined primarily by the bulk of the silyl substituents, with Ph > iPr > Me. After determining the absorption and emission characteristics of 2-5 in dilute pentane solutions we carried out analogous measurements in mineral oil where we also carried out steady state and time-resolved polarization measurements. Our results are consistent with the emission of these molecules being polarized along the dialkyne acene z-axis, and we were able to determine that the polarization decay of molecular rotors 2-5 in viscous mineral oil can be fit to single exponential functions in the nanosecond regime. We confirmed that rotational correlation times are determined by the size of the stator, rather than by the size and nature of the acene rotators.
Scheme 1.

RESULTS AND DISCUSSION
Molecular rotors with napthalene (2)9 and anthracene (3)10 rotators were synthesized via Sonogashira coupling between the appropriate TMS-, TIPS-, or TPS-acetylene and the corresponding dibromoacenes according to literature precedent. Compounds 411 and 59 were also synthesized by previously established methods by a double nucleophilic attack of TIPS acetylide on the corresponding tetracene- and pentacene-quinones followed by SnCl2 re-aromatization. All five compounds were characterized by conventional analytical methods, which are included in the SI section. It should be pointed out that compounds 4 and 5 had to be covered in tinfoil in order to avoid degradation by reaction with singlet oxygen when exposed to light. The photophysics of all molecular rotors were analyzed in dilute solution in pentane and in mineral oil using a spectrofluorimeter equipped with picosecond laser diodes and polarization accessories. Solutions in mineral oil were prepared by dissolving the compound of interest in spectrophotometric grade hexane followed by the addition of mineral oil and removal of the volatile solvent by rotary evaporation before attaining the desired concentration by diluting with additional oil. This procedure assisted in dissolving the compounds, which would otherwise take many days to fully dissolve. However, it must be acknowledged that there is some uncertainty in the composition of the oil solutions. A gravimetric estimate suggests that the amount of hexane in the mineral oil solutions is within an upper limit of 3 weight percent.
The UV-Vis absorption and fluorescence excitation and emission spectra of 3a in mineral oil are included in Figure 1 as representative examples of compounds 2-5 (Figures S1–S6). The UV-Vis (Figure 1a) and fluorescence excitation (Figure 1b, solid dark blue) spectra have an excellent agreement with each other and the lowest energy transition displays a clear mirror image relation with a strong 0–0 overlap for all compounds. As shown in Figures S1–S6, no significant differences were observed between the spectra obtained in pentane and those measured in mineral oil with two main spectral bands observed for all compounds in the series. A high-energy transition (HE) with relatively narrow overlapping peaks with maxima that ranged from 249 nm for 2 to 309 nm for 5, as summarized in Table 1 (Figures S1–S6) and a lower energy transition (LE) with the characteristic vibrational structure of the rigid acene chromophores with a maximum intensity that ranged from 349 nm for 2 to 642 nm for 5 (Table 1). As expected, the absorption and emission maxima red shift as the number of rings in the acene chromophore increases from two to five (Table 1).
Figure 1.

a) UV-Vis absorption spectrum and b) fluorescence excitation (solid dark blue) and fluorescence emission (dashed light blue) spectra of 9,10-bis(TMS-ethynyl)anthracene 3a in mineral oil. Fluorescence excitation and emission spectra were normalized at the 0–0 transition. UV-Vis and fluorescence spectra were obtained in 9.4 μM and 0.9 μM mineral oil solutions, respectively. The excitation scan was collected at 468 nm and the emission scan obtained by excitation at 272 nm with a λ ≥ 350 nm cutoff filter.
Table 1.
Fluorescence and UV-Vis absorption data for molecular rotors 2, 3a-3c, 4 and 5 in mineral oil including absorption maxima at the lowest energy (UV-λLE) and the most intense high energy (UV-λHE) transitions. Also included are the fluorescence maxima measured at 0–0 transition (Fluor-λF), fluorescence lifetimes (τF), maximum steady-state fluorescence anisotropy values at the low energy transitions [rmax(LE)] and high [rmax(HE)], fundamental fluorescence anisotropy r0 (r at t=0), and fluorescence anisotropy decay time constants (τr).
| Molecular Rotor | UV-λHE (nm) | UV-λLE (nm) | Fluor-λF (nm) | τ1Fa (ns) | τ2Fa (ns) | rmax(HE) | rmax(LE) | r0 (ns) | τrf (ns) | εHEg (× 104 M−1cm−1) | εLEg (× 104 M−1cm−1) |
|---|---|---|---|---|---|---|---|---|---|---|---|
| 2 | 249 | 349 | 350 | 1.90b | -- | −0.05 | 0.20 | 0.14 | 3.27 b,e | 4.46 | 3.06 |
| 3a | 271 | 440 | 440 | 5.39c | -- | 0.03 | 0.13 | 0.28 | 3.92b | 14.29 | 5.19 |
| 3b | 273 | 441 | 441 | 4.91c | -- | 0.06 | 0.17 | 0.29 | 5.08b | 13.31 | 6.45 |
| 3c | 269 | 446 | 446 | 1.11c | 4.46 | 0.05 | 0.23 | 0.30 | 8.19b | 11.14 | 6.45 |
| 4 | 292 | 535 | 534 | 3.67d | 10.42 | 0.05 | 0.11 | 0.38 | 5.66c | 14.07 | 3.61 |
| 5 | 309 | 642 | 643 | 3.57d | 19.29 | 0.04 | 0.06 | 0.27 | 5.15c | 16.75 | 3.47 |
Bolded number indicates that the component accounted for more than 97% of the fluorescence decay.
Fluorescence lifetimes and fluorescence anisotropy decay were recorded by excitation with picosecond pulsed diode lasers at wavelengths of:
300 nm
375nm and
510 nm.
The mineral oil used as a solvent was emissive at 368 nm when excited at 300 nm. The lifetime measurements of solutions of 2 in mineral oil displayed biexponential decays with a 1.90 ns lifetime that was attributed to 2 and a second lifetime of 18.04 ns that matched with the decay of an oil blank and was attributed to the oil itself.
Instrumental response functions were not incorporated into the fitting of these decays and their precision is limited.
Molar absorption coefficients were established in pentane.
As summarized in Table 1, the fluorescence lifetimes of molecular rotors 2-5 obtained in mineral oil using a time correlated single photon counting (TCSPC) spectrometer with pulsed diode lasers (Table 1) are either monoexponential (2, 3a, and 3b) or biexponential (3c, 4, and 5) as indicated in Table 1. Good fits, residuals and autocorrelation of residual were obtained for all compounds and are shown along with the instrument response function in Figures S13–S18 for pentane and S19-S24 for mineral oil. For biexponential decays, the longer component accounted for more than 97% of the decay. These major components vary by a factor of 10, from 1.90 ns in the case of 1,4-bis(TMS-ethynyl)naphthalene rotator 2 up to 19.29 ns for 6,13-bis(TIPS-ethynyl)pentacene rotator 5. Changing the trialkylsilyl group in the stator from TMS to TIPS to TPS in the case of anthracenes 3a, 3b and 3c resulted in relatively small variations where the lifetimes shorten as the stator size increases, from 5.39 ns in the case of the 9,10-bis(TMS-ethynyl)anthracene 3a down to 4.46 ns in the case of the larger 9,10-bis(TPS-ethynyl)anthracene 3c. With a lifetime of 10.42 ns, the 5,12-bis(TIPS-ethynyl)tetracene rotator falls in between the two neighboring compounds in the acene series.
Following the spectroscopic characterization of molecular rotors 2–5 we set out to measure their steady-state fluorescence anisotropy to determine whether mineral oil is viscous enough to slow down their whole-body rotational dynamics to the time scale of their lifetimes in the ca. 2–20 ns range. To that end, fluorescence anisotropy “r” is defined by the Equations 1 and 2,
| Eq. 1 |
| Eq. 2 |
vertical (0°). The value G is a correction factor that accounts for the difference in the instrument’s sensitivity to horizontally and vertically polarized light. The fluorescence anisotropy r in solution is determined by photoselection and can range from a maximum positive value of 0.4 to a maximum negative value of −0.2.4 Positive values indicate a preference for emission to occur parallel to the excitation polarization and are expected to occur when absorption and emission occur from the same excited state. By contrast, negative values indicate a preference for emission to occur perpendicular to excitation, as is expected when the states involved absorption and emission are different and have orthogonal transition dipole moments.4,11
Figure 2 shows the steady-state fluorescence anisotropy of 3a as a function of wavelength overlaid with its steady-state fluorescence excitation and emission spectra in mineral oil. The solid dark orange line reveals a complex fluorescence anisotropy pattern when emission is detected at 468 nm (marked with a * in Figure 2). We interpret changes in fluorescence anisotropy as a function of excitation wavelength as an indication of overlapping transitions to higher excited states with dipole moment directions that are aligned either parallel or perpendicular to the lowest energy transition responsible for the emission at 468 nm. As shown in Figure 2, the fluorescence anisotropy of the emission signal when excited either at 272 nm (marked with •) or at 413 nm (°) is straightforward. The solid light orange line shows a small negative fluorescence anisotropy over the entire emission band, while the solid medium orange line reflects a much larger positive fluorescence anisotropy over the same wavelengths. The constant values for emission anisotropy indicate that emission over those wavelengths occurs from the same excited state, and therefore have the same polarization. It is known that this transition has a dipole moment oriented along the z-axis that in this case is parallel to the dialkyne axle (Figure 1). 4,11
Figure 2.

Steady state fluorescence anisotropy (solid lines) overlaid with the excitation (dark blue dotted line) and emission (light blue dotted line) spectra of 3a (0.9 μM in mineral oil). The solid dark orange line is the fluorescence anisotropy of 3a detected at 468 nm (*) and the medium orange line is the fluorescence anisotropy for excitation at 413 nm (°). The light orange line is the fluorescence anisotropy for excitation at 272 nm (•).
The time-resolved fluorescence anisotropy values of molecular rotors 2, 3a, 3b, 3c, 4, and 5 were collected by excitation with picosecond laser diodes at 300 nm (2), 375 nm (3a, 3b and 3c), where IXY represents the fluorescence intensity of the sample when the excitation polarizer is set to X and the emission polarizer is set to Y. The subscripts H and V indicate the orientations of the polarizers: H for horizontal (90°) and V for and 510 nm (4 and 5). G-factors were calculated by integration of the HV and HH fluorescence decays. While all decays in mineral oil occurred within time scales that are comparable to the corresponding excited state lifetimes, their fundamental anisotropies, r0 = r at t=0, were shown to be less than the ideal maximum of r0 = 0.4 expected by photoselection. This observation is consistent with the fact that excitation in the case of 2, 3a, 3b and 3c had to be carried out at wavelength (λ=300 nm and 375 nm) where there is some overlap between the lowest energy transitions and a weaker band with an orthogonal dipole moment. By contrast, a nearly ideal fundamental fluorescence anisotropy of ro=0.38 could be obtained by excitation of TIPS-tetracene 4 at 510 nm while TIPS pentacene showed a smaller value of ro=0.27 despite selective excitation of the lowest energy band. A possible explanation for this relatively low value may be that there is a rapid loss of polarization as a result of partial aggregation in mineral oil. Due to the already weak signal of compound 5, we were not able to test this hypothesis using a more dilute solution.
The time constants for polarization anisotropy decay measured with the same conditions as those used in the lifetime measurement are reasonably well described by a single exponential function, as shown in Figure 3c for compound 3a and in Figures S7–S12 for the other molecular rotors. Although the precision of the fitting is not ideal as we lacked an instrument response function that would help account for deviations at early times, the qualitative τr values summarized in Table 1 make it possible to draw useful qualitative conclusion regarding the relative rotational dynamics of the molecules studied. As shown in Table 1, the τr range from 3.3 ns in the case of 2 to 8.19 ns in the case of 3c. We note that these values should be considered a lower limit as the concentrations used in these experiments are close to the range where one may have a contribution from radiative energy transfer to the anisotropy decay.8 When the τr values are analyzed as shown in Figure 4 as a function of the calculated principal moments of inertia, one can see that they cluster as a function of the size of the stator (red dots), rather than by the size of the acene rotators (open circles). Thus, molecular rotors 2 and 3a with TMS stators with moments of inertial of ca. 7×10³ AMU*Å2 along the y-axis have time constants in the range of 3–4 ns. Similarly, molecular rotors 3b, 4, and 5 with TIPS stators have corresponding moments of inertia of ca. 18×103 AMU*Å2 and have similar fluorescence anisotropy decays with time constants in the range of 5–6 ns. Finally, molecular rotor 3c with a TPS stator has the largest moments of inertial of ca. 30×103 AMU*Å2 and the longest fluorescence anisotropy decay, with a time constant of 8.2 ns. Correlation times based on the calculated moment of inertia and assuming an absolute viscosity value of η ≥ 21.6 cP fell into the same groupings, but with time constant values that are systematically longer.13,14 This systematic inaccuracy likely also stems from the fact that rotation in high-viscosity solvents is more accurately accounted for by molecular volume, rather than moments of inertia.12 However, an analysis based on moments of inertia is still useful to illustrate which of the axes of rotation is most responsible for the rotational depolarization. Based on the above, we interpret the trend in rotational correlation times in Figure 4 as a confirmation that the loss of polarization is a result of rotation around the molecular rotor expected x- and y-axis (Figure 1). 12
Figure 3.

a) Fluorescence decay (dark blue) and instrument response function (IRF) (light blue) of 3a (0.9 mM in mineral oil) for excitation at 375 nm and emission at 440 nm. b) Residuals for the fluorescence lifetime decay fit. c) Time-resolved fluorescence anisotropy decay (orange, solid) with the fitted decay curve overlaid (black, dashed). Fluorescence anisotropy decay measurements were taken with the same conditions as the lifetime measurement.
Figure 4.

Rotational correlation times of compounds 2-5 as compared to their own calculated moments of inertia for rotation around the x- and y-axis (red) and around z-axis (light orange). The moment of inertia of the isolated acene rotators that would correspond to rotation about the z-axis are shown with open circles.
Based on the information shown in Table 1 one can see that the values for the steady state fluorescence anisotropy ranging from ca. 0.20 in the case of 2 to 0.04 in the case of 5 (Table 1) can be explained in terms of the fundamental fluorescence anisotropy r0 observed at the excitation wavelength and the excited states lifetimes (τF). For example, a relatively large steady state fluorescence anisotropy value is observed in the case of 2 primarily because the fluorescence anisotropy decay (τr=3.27 ns) lasts well beyond the lifetime of the excited state (τF=1.9 ns), such that all the emission collected at the steady state retains some degree of polarization. By contrast, a significant loss in the steady state fluorescence anisotropy of 0.04 in the case of 5 is the result of an excited state lifetime that is much longer (19.12 ns) than the time that it takes for polarization to be lost (5.15 ns), such that part of the emission is no longer polarized.
CONCLUSIONS
Molecular rotors 2-5 featuring acene rotators linked by an acetylene axle to trialkylsilyl- and triarylsilyl-substituted stators showed the expected spectroscopic behavior with a good match between absorption and fluorescence excitation spectra and an excellent overlap between the 0–0 vibrational transition of the lowest energy excitation band. The fluorescence lifetimes of molecular rotors 2-5 increased primarily with increasing acene size and secondarily decreasing stator size. Steady state fluorescence anisotropy measurements as a function of excitation wavelength in mineral oil with an absolute viscosity of 21.61 at 40 °C revealed a series of overlapping bands with transition dipole moments in orthogonal directions. As expected, excitation in the lowest energy band resulted in all cases in a positive fluorescence anisotropy consistent with absorption and emission with same polarization, which is known to be in the direction of the short acene molecular z-axis as defined in Figure 1. Despite suffering from limited precision due to the lack of an experimental instrumental response function, monoexponential time-resolved fluorescence anisotropy decays plotted against the moments of inertia corresponding to rotation about both the x/y- and z-axes of compounds 2-5 showed a strong correlation with the moment of inertia associated with whole body rotation about the x/y-axes. Results presented here suggest that fluorescence anisotropy decay will be a suitable method for observing rotation of bis(silylethynyl)acenes in restricted media with viscosity greater than or similar to that of mineral oil.
EXPERIMENTAL SECTION
IR Spectra were acquired on a PerkinElmer Spectrum Two spectrometer equipped with a universal ATR sampling accessory. Compounds 2,9 3a,10a 3b,10b 3c,10c 4,11 and 59 were synthesized by previously established methods. Solutions of 4 and 5 were kept wrapped in tinfoil to prevent photodegradation. Spectrophotometric grade pentane and mineral oil for fluorescence and UV-Vis studies were commercially available and used without further purification. Solutions in mineral oil were prepared by dissolving the compound of interest in hexanes, mixing that solution with mineral oil, removing the hexanes by rotary evaporation, and then diluting the resulting mineral oil solution to the desired concentration. All fluorescence lifetime measurements in mineral oil were taken with an emission polarizer set to the magic angle (54.7°) in order to account for any fluorescence anisotropy caused by the polarization of the excitation laser. UV-Vis spectra were obtained using an Ocean Optics Flame Spectrometer with DH-MINI UV-Vis-NIR light source and Oceanview software package. Fluorescence spectra were obtained using an Edinburgh Instruments FLS 920 spectrometer equipped with a 450 W ozone-free xenon arc lamp for steady state measurements, as well as EPLED-300, EPL-375, and EPL-510 picosecond pulsed laser diodes for lifetime measurements. Fluorescence data were collected using the F900 software package.
Supplementary Material
ACKNOWLEDGMENT
This work was supported by National Science Foundation grant DMR-1700471.
Footnotes
ASSOCIATED CONTENT
Supporting Information
Photophysical characterization and calculated moments of inertia of 2, 3a-3c, 4 and 5 (PDF). The Supporting Information is available free of charge on the ACS Publications website.
Parts of this manuscript are adapted from the Ph.D. dissertation of M. E. Howe.15
REFERENCES
- 1.a) Howe ME; Garcia-Garibay MA The Roles of Intrinsic Barriers and Crystal Fluidity in Determining the Dynamics of Crystalline Molecular Rotors and Molecular Machines. J. Org. Chem, 2019, 84, 9835–9849. [DOI] [PubMed] [Google Scholar]; b) Vogelsberg CS; Garcia-Garibay MA Crystalline molecular machines: function, phase order, dimensionality, and composition. Chem. Soc. Rev, 2012, 41, 1892–1910. [DOI] [PubMed] [Google Scholar]; c) Karlen SD; Garcia-Garibay MA Amphidynamic crystals: Structural blueprints for molecular machines. Top. Curr. Chem, 2005, 262, 179−227. [Google Scholar]
- 2.a) Kottas GS; Clarke LI; Horinek D; Michl J Artificial Molecular Rotors. Chem. Rev, 2005, 105, 1281−1376. [DOI] [PubMed] [Google Scholar]; b) Kushida S; Smarsly E; Bojanowski NM; Wacker I; Schröder RR; Oki O; Yamamoto Y; Melzer C; Bunz UHF Dipole-Switchable Poly(para-phenyleneethynylene)s: Ferroelectric Conjugated Polymers. Angew. Chem., Int. Ed, 2018, 57, 17019− 17022. [DOI] [PubMed] [Google Scholar]; c) Kaleta J; Wen J; Magnera TF; Dron PI; Zhu C; Michl J Structure of a monolayer of molecular rotors on aqueous subphase from grazing-incidence X-ray diffraction. Proc. Natl. Acad. Sci. U. S. A, 2018, 115, 9373−9378. [DOI] [PMC free article] [PubMed] [Google Scholar]; d) Dron PI; Zhao K; Kaleta J; Shen Y; Wen J; Shoemaker RK; Rogers CT; Michl J Bulk Inclusions of Pyridazine-Based Molecular Rotors in Tris(o- phenylenedioxy)cyclotriphosphazene (TPP). Adv. Funct. Mater, 2016, 26, 5718−5732. [Google Scholar]; e) Yoshida Y; Shimizu Y; Yajima T; Maruta G; Takeda S; Nakano Y; Hiramatsu T; Kageyama H; Yamochi H; Saito G Molecular Rotors of Coronene in Charge-Transfer Solids. Chem. Eur. J, 2013, 19, 12313–12324. [DOI] [PubMed] [Google Scholar]; f) Horinek D; Michl J Molecular dynamics of a grid-mounted molecular dipolar rotor in a rotating electric field. Proc. Natl. Acad. Sci. U. S. A, 2005, 102, 14175−14180. [DOI] [PMC free article] [PubMed] [Google Scholar]; g) Vacek J; Michl J Artificial Surface-Mounted Molecular Rotors: Molecular Dynamics Simulations. Adv. Funct. Mater, 2007, 17, 730−739. [Google Scholar]; h) Thomas JC; Schwartz JJ; Hohman JN; Claridge SA; Auluck HS; Serino AC; Spokoyny AM; Tran G; Kelly F; Mirkin CA; Gilles J; Osher SJ; Weiss PS Defect tolerant aligned dipoles within two-dimensional lattices. ACS Nano, 2015, 9, 4734−4742. [DOI] [PubMed] [Google Scholar]
- 3.Karlen SD: Reyes H; Taylor RE; Khan SI; Hawthorne MF; Garcia-Garibay MA Symmetry and Dynamics of Molecular Rotors in Amphidynamic Molecular Crystals. Proc. Nat. Acad. Sci. USA, 2010, 107, 14973–14978. [DOI] [PMC free article] [PubMed] [Google Scholar]
- 4.a) Lackowicz JR Principles of Fluorescence Spectroscopy, 3rd ed.; Springer: Boston, 2006. [Google Scholar]; b) Michl J; Thulstrup EW Spectroscopy with Polarized Light: Solute Alignment by Photoselection, Liquid Crystal, Polymers, and Membranes, 1st ed.; Wiley: Hoboken, 1995. [Google Scholar]
- 5.a) Tramier M; Coppey-Moisan M Fluorescence Anisotropy Imaging Microscopy for Homo-FRET in Living Cells. Method Cell Biol, 2008, 85, 395–414. [DOI] [PubMed] [Google Scholar]; b) Lakowicz JR; Cherek H; Kuśba J; Gryczynski I; Johnson ML Review of fluorescence anisotropy decay analysis by frequency-domain fluorescence spectroscopy. J. Fluoresc, 1993, 3, 103–116. [DOI] [PubMed] [Google Scholar]; c) Bucci E; Steiner RF Anisotropy decay of fluorescence as an experimental approach to protein dynamics. Biophysical Chemistry, 1988, 30, 199–224. [DOI] [PubMed] [Google Scholar]; d) Feinstein E; Deikus G; Rusinova E; Rachofsky EL; Ross JBA; Laws WR Constrained Analysis of Fluorescence Anisotropy Decay: Application to Experimental Protein Dynamics. Biophys J, 2003, 84, 599–611. [DOI] [PMC free article] [PubMed] [Google Scholar]; e) Rocha S; Kogan M; Beke-Somfai T; Nordén B Probing Microscopic Orientation in Membranes by Linear Dichroism. Langmuir, 2016, 32, 2841–2846. [DOI] [PubMed] [Google Scholar]
- 6.a) Chee CK; Hunt BJ; Rimmer S; Soutar I; Swanson L Time-resolved fluorescence anisotropy studies of the cononsolvency of poly(N-isopropyl acrylamide) in mixtures of methanol and water. Soft Matter, 2011, 7, 1176–1184. [Google Scholar]; b) Soutar I; Swanson L Time-resolved luminescence anisotropy studies of the relaxation behavior of polymers. 2. On the intramolecular mobility of poly(butyl methacrylate) in dilute solution. Polym Int, 2006, 55, 729–739. [Google Scholar]; c) Fowler M; Duhamel J; Qiu XP; Korchagina E; Winnik FM Temperature Response of Aqueous Solutions of Pyrene End-Labeled Poly(N-isopropyl acrylamide)s Probed by Steady-State and Time-Resolved Fluorescence. J. Polym. Sci. B, Polym. Phys, 2018, 56, 308–318. [Google Scholar]; d) Little H; Wang J; Duhamel J; Li X; Nagula M; Maurizot V; Huc I Simplification in the Acquisition and Analysis of Fluorescence Decays Acquired with Polarized Emission for Time-Resolved Fluorescence Anisotropy Measurements. Anal. Chem, 2019, Just Accepted. [DOI] [PubMed] [Google Scholar]
- 7.a) Barkley MD; Kowalczyk AA; Brand L Fluorescence decay studies of anisotropic rotations of small molecules. J. Chem. Phys, 1981, 75, 3581–3593. [Google Scholar]; b) Inamdar SR; Mannekutla JR; Mulimani BG; Savadatti MI Rotational dynamics of nonpolar laser dyes. Chemical Physics Letters, 2006, 429, 141–146. [Google Scholar]; c) Kumbhakar M; Mukherjee T; Pal H Temperature effect on the fluorescence anisotropy decay dynamics of Coumarin-153 dye in Triton-X-100 and Brij-35 micellar solutions. Photochem Photobiol, 2005, 81, 588–594. [DOI] [PubMed] [Google Scholar]; d) Yefimova SL; Tkacheva TN; Kasian NA Study of the combined effect of ibuprofen and cholesterol on the microviscosity and ordering of model lipid membranes by timeresolved measurement of fluorescence anisotropy decay. Journal of Applied Spectroscopy, 2017, 84, 284–290. [Google Scholar]; e) Szubiakowski J; Balter A; Nowak W; Wisniewski K; Aleksandrzak K Substituent-sensitive anisotropic rotations of 9-acetoxy-10-phenylanthracenes: fluorescence anisotropy decay and quantum-mechanical study. Chemical Physics Letters, 1999, 313, 473–483. [Google Scholar]; f) Koninti RK; Sappati S; Satpathi S; Gavvala K; Hazra P Spectroscropy and Dynamics of Cryptolepine in the Nanocavity of Cucurbit[7]uril and DNA. Chem. Phys. Chem, 2016, 17, 506–515. [DOI] [PubMed] [Google Scholar]
- 8.Prazeres TJV; Fedorov A; Barbosa SP; Martinho JMG; Berberan-Santos MN J. Phys. Chem. A 2008, 112, 5034–5039. [DOI] [PubMed] [Google Scholar]
- 9.Fudickar W; Linker T Why Triple Bonds Protect Acenes from Oxidation and Decomposition. J. Am. Chem. Soc, 2012, 134, 15071–15082. [DOI] [PubMed] [Google Scholar]
- 10.a) Li Y; Köse ME; Schanze KS Intramolecular Triplet Energy Transfer in Anthracene-Based Platinum Acetylide Oligomers. J. Phys. Chem. B, 2013, 117, 9025–9033. [DOI] [PubMed] [Google Scholar]; b) Goldsmith RH; Vura-Weis J; Scott AM; Borkar S; Sen A; Ratner MA; Wasielewski MR Unexpectedly Similar Charge Transfer Rates through Benzo-Annulated Bicyclo[2.2.2]octanes. J. Am. Chem. Soc, 2008, 130, 7659–7669. [DOI] [PubMed] [Google Scholar]; c) Takahashi K; Reiko H; Daisuke N; Shiki N; Norihisa K; Akihide K Photoluminescence and Electroluminescence of 9,10-Bis(silylethynyl)anthracene. J. Photopolym. Sci. Technol, 2005, 18, 65–68. [Google Scholar]
- 11.Odom SA; Parkin SR; Anthony JE Tetracene Derivatives as Potential Red Emitters for Organic LEDs. Org. Lett, 2003, 5, 4245–4248. [DOI] [PubMed] [Google Scholar]
- 12.(a) Platt JR Classification of Spectra of Cata-condensed Hydrocarbons, J. Chem. Phys. 1949, 17, 484–495. [Google Scholar]; (b) Levitus M; Garcia-Garibay MA Polarized Electronic Spectroscopy and Photophysical Properties of 9,10-Bis(phenylethynyl)anthracene. J. Phys. Chem, 2000, 104, 8632–8637. [Google Scholar]
- 13.Kawski A Fluorescence Anisotropy: Theory and Applications of Rotational Depolarization. Crit. Rev. Anal. Chem, 1993, 23, 459–529. [Google Scholar]
- 14.Correlation times of 23, 26, 49, 71, 49, and 53 ns were calculated for 2, 3a, 3b, 3c, 4, and 5, respectively, using equations 165 and 166 from reference 12. These times are noticeably longer than those recorded experimentally in Table 3, but the discrepancy is not unexpected given the authors note that “For small molecules in liquid solutions, the experimentally determined rotational-correlation times are often 5 or 10 times shorter than those calculated on the stick-boundary condition.” The viscosity for these calculations was based on the Certificate of Analysis provided by the manufacturer for the batch used in these experiments. The certificate reported a kinematic viscosity of 25.32 cSt at 40 °C and a specific gravity of 0.8535, which correspond to an absolute viscosity of 21.61 cP.
- 15.Howe ME Fluorescence and Rotational Dynamics of Amphidynamic Crystals. Ph.D. Dissertation, University of California–Los Angeles, CA, December 2019. [Google Scholar]
Associated Data
This section collects any data citations, data availability statements, or supplementary materials included in this article.