Abstract
Introduction
The main purpose of the research was to develop, optimize and characterize tobramycin sulphate loaded chitosan nanoparticles based gel in order to ameliorate its therapeutic efficacy, precorneal residence time, stability, targeting and to provide controlled release of the drug.
Methods
Box-Behnken design was used to optimize formulation by 3-factors (chitosan, STPP and tween 80) and 3-levels. Developed formulation was subjected for characterizations such as shape and surface morphology, zeta potential, particle size, in vitro drug release studies, entrapment efficiency of drug, visual inspection, pH, viscosity, spreadability, drug content, ex vivo transcorneal permeation studies, ocular tolerance test, antimicrobial studies, isotonicity evaluation and histopathology studies.
Results
Based on the evaluation parameters, the optimized formulation showed a particle size of 43.85 ± 0.86 nm and entrapment efficiency 91.56% ± 1.04, PDI 0.254. Cumulative in vitro drug release was up to 92.21% ± 1.71 for 12 hours and drug content was found between 95.36% ± 1.25 to 98.8% ± 1.34. TEM analysis unfolded spherical shape of nanoparticles. TS loaded nanoparticulate gel exhibited significantly higher transcorneal permeation as well as bioadhesion when compared with marketed formulation. Ocular tolerance was evaluated by HET-CAM test and formulation was non-irritant and well-tolerated. Histopathology studies revealed that there was no evidence of damage to the normal structure of the goat cornea. As per ICH guidelines, stability studies were conducted and were subjected for 6 months.
Conclusion
Results revealed that the developed formulation could be an ideal substitute for conventional eye drops for the treatment of bacterial keratitis.
Keywords: HET-CAM Test, tobramycin sulphate, transcorneal permeation study, histopathology, infectious keratitis, nanoparticles
1. INTRODUCTION
Infectious keratitis can be described as an acute or chronic condition in which infection and inflammation of the cornea occur which is accompanied by pain, light sensitivity, reduced vision, tearing, swelling around the eyes and even loss of vision in severe cases. The disease progresses very rapidly and can cause the destruction of cornea completely within 24-48 hours with some virulent bacteria [1, 2]. Infectious keratitis can take many forms like Bacterial keratitis mainly caused by Pseudomonas aeruginosa and Staphylococcus aureus, Fungal keratitis caused by Aspergillus, Candida or Fusarium, Parasitic keratitis caused by Acanthamoeba and viral keratitis primarily caused by herpes simplex virus. Bacterial keratitis is at the top in causing vision-threatening keratitis [3]. It is characterized by an interruption of epithelium cells of cornea that permits the entrance of bacterias like, Pseudomonas aeruginosa and Staphylococcus aureus which invade the corneal stroma [4]. After penetration, the proliferation starts and the enzymes are released to facilitate their penetration which causes destruction and melting of cornea which can even lead to visual loss [5]. Extended use of contact lenses and eye injury is the most common cause of corneal epithelial breakdown and risk factor bacterial keratitis [6].
Tobramycin sulphate is an aminogylcoside derived from Streptomyces tenebratius. It is effective against Gram-negative infections predominantly against species of Pseudomonas. Tobramycin sulphate does not pass through the gastrointestinal tract like all aminogylcosides and is given intravenously, intramuscularly and through ophthalmic route [7, 8]. It works by binding to the 30S and 50S of the bacteria and the formation of the 70S complex is averted. As a consequence, mRNA cannot be translated into protein and it corroborates cell death [9, 10].
Conventional eye drops have numerous anatomical and physiological curtailments viz. low ocular bioavailability, rapid nasolacrimal drainage, tear dynamics, frequent instillation of dosage form and various dynamic barriers which poses challenges and impediment in extensive ocular drug permeation [11, 12]. To overcome these challenges, nanoparticles can be developed by polymers that are mucoadhesive and biocompatible in nature. Polymeric nanoparticles can be elucidated as the submicron colloidal drug carriers system which consists of polymers that are biocompatible, biodegradable, non-immunogenic and non-toxic [13]. Chitosan nanoparticles possess favorable biological characteristics viz. site-specific targeting, mucoadhesive nature, high surface-to-volume ratio, non-toxicity and prevents dose dumping through the controlled and sustained release of the drug [14].
In the current investigation, we endeavored to develop, optimize and characterize prolong release mucoadhesive tobramycin sulphate loaded chitosan nanoparticulate based gel formulation to ameliorate therapeutic effect, prolong pre-corneal residence time, increase stability, targeting, provide a controlled release and curtail dosing frequency of the drug.
2. MATERIALs AND METHODS
2.1. Materials
Tobramycin sulphate was obtained as a gift sample from Cadila Pharmaceuticals Limited, Ahmadabad, India. Chitosan (85% deacetylated) was procured from Sigma Aldrich Pvt. Ltd., Mumbai, India. Sodium tripolyphosphate (STPP) and tween 80 were obtained from Loba Chemie Pvt. Ltd. (Mumbai, India) and glacial acetic acid from S.D Fine-Chem Pvt. Ltd. (Mumbai, India), respectively.
3. METHODOLOGY
3.1. Optimization of Formulation Variables and Process Variables
For the optimization of polymer concentration, the ionotropic gelation technique was used. The concentration of chitosan was foremostly optimized by taking different concentrations ranging as shown in Table 1. Similarly, distinct concentrations of sodium tripolyphosphate (cross-linking agent) were used and the other parameters were kept constant as given in Table 1. Likewise, the concentration of surfactant i.e. tween 80 was optimized with various concentrations. Different stirring speeds were taken to formulate the nanoparticles so as to optimize the best one. For the optimization of polymer to cross-linking agent ratio, chitosan was varied without changing TPP concentration. On taking different volume ratios of chitosan to STPP i.e. from 3:1 to 6:1, volume ratio 5:1 was selected as optimum, since it did not lead to any flocculation or aggregation [15, 16]. Optimization of formulation variables and process variables are depicted in Table 1.
Table 1.
Optimization of formulation variables and process variables.
| S. No. | Code |
Chitosan
(% W/V) |
TPP
(% W/V) |
Tween 80
(% V/V) |
Stirring Speed (RPM) |
|---|---|---|---|---|---|
| Optimization of Polymer Concentration | |||||
| 1 | DP1 | 0.01 | 0.2 | 0.6 | 3000 |
| 2 | DP2 | 0.0125 | 0.2 | 0.6 | 3000 |
| 3 | DP3 | 0.05 | 0.2 | 0.6 | 3000 |
| 4 | DP4 | 0.075 | 0.2 | 0.6 | 3000 |
| Optimization of Cross-linking Agent Concentration | |||||
| 5 | TP1 | 0.05 | 0.1 | 0.6 | 3000 |
| 6 | TP2 | 0.05 | 0.2 | 0.6 | 3000 |
| 7 | TP3 | 0.05 | 0.3 | 0.6 | 3000 |
| 8 | TP4 | 0.05 | 0.4 | 0.6 | 3000 |
| Optimization of Surfactant Concentration | |||||
| 9 | TW1 | 0.05 | 0.2 | 0.5 | 3000 |
| 10 | TW2 | 0.05 | 0.2 | 0.6 | 3000 |
| 11 | TW3 | 0.05 | 0.2 | 0.7 | 3000 |
| 12 | TW4 | 0.05 | 0.2 | 0.8 | 3000 |
| Optimization of Stirring Speed | |||||
| 13 | SS1 | 0.05 | 0.2 | 0.6 | 1500 |
| 14 | SS2 | 0.05 | 0.2 | 0.6 | 2000 |
| 15 | SS3 | 0.05 | 0.2 | 0.6 | 2500 |
| 16 | SS4 | 0.05 | 0.2 | 0.6 | 3000 |
4. PREPARATION OF TOBRAMYCIN SULPHATE LOADED CHITOSAN NANOPARTICLES
For preparation, chitosan nanoparticles ionotropic gelation technique was employed. Chitosan was weighed accurately and dissolved in 1% v/v glacial acetic acid and drug was incorporated in it. In distilled water, STPP and tween 80 were dissolved, to which drug solution containing chitosan was drop-wise added via microsyringe. The solution was stirred continuously using mechanical stirrer at 3000 rpm (Remi Motors-RO-122, New Delhi, India) at room temperature, which leads formation of chitosan nanoparticles. Subsequently, pH was adjusted to 7.4 and then centrifuged at 12000 rpm for 20 minutes using refrigerated centrifuge (Remi, C-24BL, New Delhi, India) [17, 18]. Table 2 depicts the table for the formulation of tobramycin sulphate loaded chitosan nanoparticles.
Table 2.
Box-Behnken design for formulation development of tobramycin sulphate loaded chitosan nanoparticles.
| Run | X1(%) | X2(%) | X3(%) |
|---|---|---|---|
| 1 | -1 (0.03) | -1 (0.15) | 0 (0.6) |
| 2 | -1 (0.07) | 1 (0.15) | 0 (0.6) |
| 3 | 1 (0.03) | -1 (0.25) | 0 (0.6) |
| 4 | 1 (0.07) | 1 (0.25) | 0 (0.6) |
| 5 | -1 (0.03) | 0 (0.2) | -1 (0.55) |
| 6 | -1 (0.07) | 0 (0.2) | 1 (0.55) |
| 7 | 1 (0.03) | 0 (0.2) | -1 (0.65) |
| 8 | 1 (0.07) | 0 (0.2) | 1 (0.65) |
| 9 | 0 (0.05) | -1 (0.15) | -1 (0.55) |
| 10 | 0 (0.05) | -1 (0.25) | 1 (0.55) |
| 11 | 0 (0.05) | 1 (0.15) | -1 (0.65) |
| 12 | 0 (0.05) | 1 (0.25) | 1 (0.65) |
| 13 | 0 (0.05) | 0 (0.2) | 0 (0.6) |
| 14 | 0(0.05) | 0 (0.2) | 0(0.6) |
| 15 | 0(0.05) | 0 (0.2) | 0(0.6) |
5. STATISTICAL EXPERIMENTAL DESIGN FOR FORMULATION OPTIMIZATION
5.1. Box-Behnken Design
To optimize tobramycin sulphate loaded chitosan nanoparticles, Statease Design-Expert Software (Version 8.0.4 Stat-Ease, Inc., Minneapolis, MN) was employed in the study with 13 run and 3-factor, 3-level Box-Behnken factorial design (BBD). BBD has substantial significance that it circumvents experiments carried out under extreme conditions and doesn’t require combinations for which all factors are concurrently at their lowest or highest points, for which there might be the occurrence of unsatisfactory results [19]. The independent variables were; polymer concentration i.e. the concentration of chitosan (X1), concentration of surfactant (X2), concentration of cross-linking agent (X3), and dependent variables viz. particle size (Y1) and entrapment efficiency (Y2) which are contemplated as eminent factors in the formation of the formulation [20]. These independent variables and their concentration are shown in Table 3.
Table 3.
Formulation variables and their levels for development of chitosan nanoparticles.
| S. No. | Variables | Levels | ||
|---|---|---|---|---|
| +1 | 0 | -1 | ||
| 1 | Chitosan Concentration (X1) | 0.03% | 0.05% | 0.07% |
| 2 | Concentration of TPP (X2) | 0.15% | 0.2% | 0.25% |
| 3 | Concentration of Tween 80 (X3) | 0.55% | 0.6% | 0.65% |
6. PREPARATION OF TOBRAMYCIN SULPHATE LOADED CHITOSAN NANOPARTICLES BASED GEL
As a vehicle of incorporation for tobramycin sulphate loaded chitosan nanoparticles, gel base was used. All formulations of polymeric nanoparticles were incorporated into a gel base by employing dispersion technique that utilized Carbopol 934 and HPMC K4M. For the purpose of cross-linking of polymers and swelling, gelling agents HPMC K4M and carbopol 934 were added and kept at room temperature for 4 hours. Nanoparticles were added to the gel with constant unidirectional mixing and then air bubbles were removed by sonication [21]. In the polymeric mixture, triethanolamine was incorporated so as to amplify the cross-linking between polymers. To balance the viscosity, glycerol was added to the gel and pH adjustment was done to 7.4 ± 0.1 with 0.1 N NaOH. Volume was made up with distilled water and was stirred continuously for gel formulation [22]. The formulation table for the gel is depicted in Table 4.
Table 4.
Formulation table for tobramycin sulphate loaded chitosan nanoparticles based gel.
| Formulation Code |
Chitosan
Nanoparticles |
Carbopol 934 | HPMC K4M | Glycerol (ml) | Methyl Paraben | Triethanolamine (ml) |
0.1 N NaOH
(ml) |
Distilled
Water |
|---|---|---|---|---|---|---|---|---|
| F1 | 4 ml | 0.5% | 0.5% | 5 | 0.25% | 2.5 | 2.5 | q. s. |
| F2 | 4 ml | 0.5% | 1.0% | 5 | 0.25% | 2.5 | 2.5 | q. s. |
| F3 | 4 ml | 0.5% | 1.5% | 5 | 0.25% | 2.5 | 2.5 | q. s. |
| F4 | 4 ml | 1.0% | 1.0% | 5 | 0.25% | 2.5 | 2.5 | q. s. |
| F5 | 4 ml | 1.0% | 1.5% | 5 | 0.25% | 2.5 | 2.5 | q. s. |
| F6 | 4 ml | 1.5% | 0.5% | 5 | 0.25% | 2.5 | 2.5 | q. s. |
| F7 | 4 ml | 1.5% | 1.0% | 5 | 0.25% | 2.5 | 2.5 | q. s. |
| F8 | 4 ml | 1.5% | 1.5% | 5 | 0.25% | 2.5 | 2.5 | q. s. |
| F9 | 4 ml | 2.0% | 0.5% | 5 | 0.25% | 2.5 | 2.5 | q. s. |
| F10 | 4 ml | 2.0% | 1.0% | 5 | 0.25% | 2.5 | 2.5 | q. s. |
| F11 | 4 ml | 2.0% | 1.5% | 5 | 0.25% | 2.5 | 2.5 | q. s. |
| F12 | 4 ml | 2.0% | 2.0% | 5 | 0.25% | 2.5 | 2.5 | q. s. |
| F13 | 4 ml | 0.5% | 2.0% | 5 | 0.25% | 2.5 | 2.5 | q. s. |
7. CHARACTERIZATION OF TOBRAMYCIN SULPHATE LOADED CHITOSAN NANOPARTICLES
7.1. Preparation of Calibration Curve
Determination of λ max of Tobramycin Sulphate. To determine the absorption maximum, the stock solution was prepared by weighing 200 mg drug and dissolved in 25 ml of volumetric flask with distilled water. 10 ml of standard stock solution was taken. Serial dilutions with concentrations 10 to 90 mg/ml were prepared by transferring 0.1 to 0.9 ml of the stock solution in a test tube and 1ml of 0.1% w/v ascorbic acid in dimethylsulfoxide (DMSO) was added and volume was completed to 10ml with DMSO. Solutions were heated for 30 mins in a boiling water bath to give colored products. The resultant solutions were scanned at 390 nm against blank reagent. UV-visible spectrophotometer (JASCO V-530 UV/VIS spectrophotometer, Kyoto, Japan) was used to analyze samples. Absorbance versus drug concentration graphs were constructed 390 nm [23].
7.2. Drug Excipient Compatibility Studies
For the determination of compatibility studies of drugs with polymer, Fourier Transform Infrared Spectroscopy (FT-IR) (Perkin Elmer RX1 model) was used and spectra of tobramycin sulphate, chitosan and tobramycin sulphate-loaded chitosan nanoparticles were analyzed. 1 mg of sample and potassium bromide was mixed in the ratio of 1:5 and pellets were prepared at high compaction pressure. In the spectral region of 450-4000 cm-1, the IR spectra of the pellets were obtained and the revolution was 4 cm-1. The pellets were examined and the spectra were compared with individual polymer spectra and pure drug spectra [24].
7.3. Shape and Surface Morphology
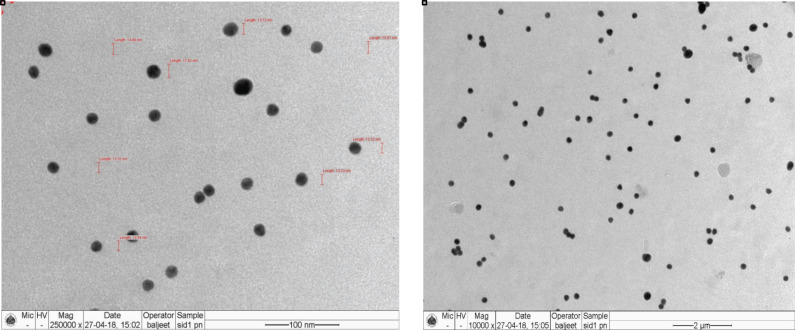
Transmission Electron Microscopy (TEM) is a vital characterization tool for directly imaging nanomaterials to obtain quantitative measures of particle and/or grain size, size distribution, and morphology. TEM (FEI Tecnai TF20) was used for the morphological examination of tobramycin sulphate loaded chitosan nanoparticles. For the preparation of TEM samples, a drop of nanoparticle was deposited on a 400 mesh copper grid coated by an amorphous carbon film and was allowed to air-dried. Nanoparticles were analyzed at 250000X and 10000X magnifications and by voltage acceleration of 200 kV [25, 26].
7.4. Particle Size, Particle Size Distribution and Polydispersity Index
To determine particle size distribution and Polydispersity Index (PDI) of nanoparticles, laser scattering technique using Malvern nano S90 (Malvern Instruments, UK) was utilized. In the analyzing chamber, supernatant incorporated with nanoparticles were poured in the cuvette. Analysis of average particle size and polydispersity index was conducted at an angle of 90oC at 25oC [27].
7.5. Zeta Potential Measurement
Zeta potential is a requisite criterion for the stability of nanoparticles and measures the surface charge of particles. For the measurement of the zeta potential of the nanoparticles, electrophoretic mobility of the particles was determined. Nanoparticles were poured in a U-type tube at the temperature of 25oC in Zetasizer (3000HS Malvern Instruments) for the estimation [28].
7.6. Drug Entrapment Efficiency
Nanoparticle suspension was centrifuged at 12000 rpm for 30 minutes at 20°C using refrigerated centrifuge (Remi, C-24BL, New Delhi, India). The supernatant was collected and frozen at -20oC for 24 hours and then lyophilized at the temperature of -55°C for 24 hours using lyophilizer (C-Gen Biotech, Pune). Obtained nanoparticles were crushed and suspended in 1% glacial acetic acid to extract the drug from nanoparticles. For assessment of the encapsulated drug, the colorimetric method was employed by coupling with ascorbic acid and dimethylsulfoxide (DMSO) and analyzed at 390 nm using UV spectrophotometer [29]. For the calculation of drug entrapment, efficiency of chitosan nanoparticles following equation was used.

7.7. In Vitro Drug Release Studies
In vitro drug release studies were conducted on a dialysis membrane having a pore size of 2.4 nm and weight 12000-14000 Da. The membrane was mounted in Franz Diffusion cell. In a donor compartment, 4 ml of nanoparticulate suspension (equivalent to 120 mg of tobramycin sulphate) was added. In the receiver compartment, STF (pH 7.4) was utilized as a medium. The whole assembly was thermoregulated at 37°C ± 1°C under continuous magnetic stirring. A measured volume of sa-mples was withdrawn from the medium and substituted with buffer simultaneously to perpetuate sink condition. Cumulative percentage in vitro drug release was calculated and the graph was plotted along with time [30].
8. CHARACTERIZATION OF TOBRAMYCIN SULPHATE LOADED CHITOSAN NANOPARTICLES BASED GEL
8.1. Physicochemical Evaluation
Physicochemical evaluation of gel was done on the basis of visual inspection, pH determination, viscosity and spreadability. The formulation was visually scrutinized for color, clarity and homogeneity. For pH determination, digital pH meter was used and an accurate quantity of gel was dispersed in distilled water and estimation of pH was done. To analyze the rheological properties of TS loaded CNP gel Brookfield viscometer was used. Spindle and rpm were based on visual viscosity found at room temperature. Spreadability was determined by the parallel plate method. The gel was kept on the glass plate having a diameter of 1 cm and on the upper glass plate was kept over it with a weight of 500 g. Spreading of the gel was observed [31].
8.2. Drug Content
Drug content was evaluated by taking 10 mg of tobramycin sulphate nanoparticle loaded gel and dissolved in STF followed by spectrophotometrically and calorimetric estimation of the formulation [32].
8.3. In Vitro Drug Release Studies
In vitro drug release of nanoparticle loaded gel was determined by utilizing FRANZ Diffusion (FD) cell. The temperature was kept at 37oC ± 0.5oC and maintained throughout. Dialysis membrane 70 with pore size 2.4 nm was installed on the FD cell. 3.14 cm2 was the surface area of the membrane for release. STF having a pH of 7.4 was utilized as a receptor medium and in the donor compartment, prepared gel was placed. At fixed interludes, 5 ml of sample was drawn from the receiver compartment and an equal amount of STF was added so that sink conditions could be maintained. Withdrawn samples were subjected to the estimation of drug release and cumulative % drug release was calculated [33].
8.4. Ex Vivo Transcorneal Permeation Study
FD cell was employed for the estimation of ex vivo transcorneal permeation studies. The whole eyeball of the goat was procured from local abattoir located in Noida, Uttar Pradesh and transferred to the laboratory in cold conditions by maintaining the temperature at 4°C. Cornea and sclera tissue of 2-4 mm was carefully excised within 30 mins of slaughtering and washed with cold saline. The excised cornea was placed in-between receptor and donor compartment of the FD cell. STF was filled in the receptor compartment and aliquot of aqueous drug-loaded nanoparticulate suspension and commercially available marketed eye drops was placed on the cornea for comparative studies. 1 ml of the sample was withdrawn from receptor chamber at defined time intervals and thereafter, refilled with equivalent quantity of STF. The samples were evaluated by colorimetric method using UV-visible spectrophotometer [34]. The permeation % was calculated as follows:
8.5. Bioadhesion Studies
Bioadhesion studies were done to determine the capability of developed formulation to adhere to the biological tissue for a prolonged period. The goat cornea was placed on the glass slide and kept on the glass beaker containing simulated tear fluid in such a manner that it remains in continuous contact with STF and continuous stirring using magnetic stirring. A drop of the developed formulation was placed on the cornea. To observe bioadhesion, a drop of water-soluble dye was placed over the ocular tissue and visually observed at specified time intervals up to 12 hours [35].
8.6. Ocular Tolerance Test
HET-CAM test (the Hen’s Egg Test or Huhner-Embroynen-Test) was performed for the assessment of irritation potential of tobramycin sulphate chitosan nanoparticles based gel. The test was done by using fresh fertilized hen’s egg procured from local poultry farm weighing between 50-60 g. Eggs were incubated for 3 days at 37 ± 0.5°C and 40 ± 5% relative humidity and rotated after every 12 hours. On 3rd day, 3ml of albumin was withdrawn from an egg and was sealed afterwards. A window was created on the 10th day of 2 x 2 cm in size by which sodium hydroxide (positive control), normal saline (negative control) and drug-loaded chitosan nanoparticles based gel (test formulation) were installed. After the defined time interval, vascular responses/injuries were observed and scores were reported according to the scoring scheme given in Table 5 [36].
Table 5.
Scoring scheme for HET-CAM test.
| Effect | Score | Inference |
|---|---|---|
| No visible hemorrhage | 0 | Non irritant |
|
Just visible membrane
Discoloration |
1 | Mild irritant |
| Structures are covered partially due to membrane discoloration or hemorrhage | 2 | Moderately irritant |
| Structures are covered totally due to membrane discoloration or hemorrhage | 3 | Severe irritant |
8.7. Anti-microbial Activity
To access biological activity of the tobramycin sulphate loaded chitosan nanoparticles and tobramycin sulphate solution, relative anti-microbial studies were performed against Pseudomonas aeruginosa and Staphylococcus aureus. For study agar diffusion, test was done and was followed by a cup plate technique. In this technique, nutrient agar media was made and sterilized. 0.5 ml of test organism was inoculated in 10 ml agar medium and poured into sterile petridish at a maintained temperature and in sterile conditions. With a sterile cork borer, holes about 8 mm were cut in the inoculated solidified agar. Tobramycin sulphate (standard solution) and developed formulation (test solution) were poured into agar plate and incubated at 37oC. The zone of inhibition was calculated while comparing it with the control [37].
8.8. Isotonicity Evaluation
For isotonicity evaluation, tobramycin sulphate loaded chitosan nanoparticles were mixed with few drops of re-suspended RBC’S of mice and observed with an inverted microscope at ×45 magnification. The concentration of isotonic solution was (0.9% w/v NaCl), hypertonic solution (0.15% w/v NaCl) and hypotonic solution (0.04% w/v NaCl). The same procedure was followed by the marketed preparation, isotonic solution (negative control) and hypertonic as well as hypotonic solution (positive control) to check the shape and size of RBC’S [38].
8.9. Sterility Studies
Sterility is an essential requirement of ocular formulations since contaminations may lead to eye infections. According to the IP method (1996), the direct inoculation method was used to perform the sterility testing on the eye dosage form. 1 ml of developed tobramycin sulphate loaded chitosan nanoparticles based gel was transferred to freshly prepared soybean casein digest medium (10 ml) and fluid thioglycollate medium (10 ml) separately. The media with inoculation was mixed the medium properly and incubated for 14 days at 20oC-25oC and 30oC-35oC, respectively.
8.10. Histopathology Studies
Irritation potential was analyzed by fresh goat cornea was used that was incubated with tobramycin sulphate loaded chitosan nanoparticle-based gel. Goat cornea was obtained from a local abattoir and stored in phosphate-buffered saline. The cornea was removed at stipulated incubation time and washed with phosphate-buffered saline. After washing, the cornea was instantly kept at 8% v/v formalin solution. With an alcohol gradient, the tissue was dehydrated and was kept in melted paraffin and was solidified to form block. Cross-section of the block was cut and staining was done with eosine and haematoxyline, and the modifications were observed microscopically [39].
8.11. Drug Release Kinetics Studies
To determine kinetic studies and the mechanism of drug release, distinct kinetic models were employed. The kinetic models used were zero order equation as cumulative amount of drug release vs. time, first-order equation as log percentage of drug remaining vs. time, Higuchi’s model equation as percentage of drug release vs. square root of time and Korsmeyer’s equation as log percentage drug release vs. log time to evaluate the drug release mechanism [40].
8.12. Stability Studies
For stability studies, the optimized nanoparticulate gel formulation was subjected to different temperature conditions. The prepared tobramycin sulphate loaded chitosan nanoparticles based gel was filled into amber glass vials and closed with air-tight plastic closure. The samples were stored at 25 ± 2°C, 4 ± 1°C, 37 ± 2°C, 60 ± 2°C, and 75 ± 5% relative humidity for 6 months to observe the stability i.e. color, pH, drug content, viscosity, particle size and in vitro release. The protocols to evaluate the stability studies were in compliance as per ICH guidelines [41].
9. RESULTS AND DISCUSSION
9.1. Optimization of Formulation Variables and Process Variables
For the optimization of polymer concentration, it was observed that particle size was increased and the entrapment of drug was decreased by increasing the drug to polymer ratio. When the concentration of chitosan was raised from 0.01 to 0.05% w/v, amplified entrapment was observed because a number of nanoparticles were formed which lead to the increased entrapment of drugs. But on further increment from 0.05 to 0.075% w/v, drug entrapment decreased which might be due to an increase in viscosity that may hinder the diffusion of drug in chitosan solution. Moreover, the optimization of cross-linking agent concentration, TP3 was the optimized concentration as it led to better entrapment, low particle size and PDI. Since higher quantity of STPP could gelate more chitosan, thus relatively higher amount could be entrapped yielding comparatively large particles. The optimized concentration of the surfactant was found to be 0.6%. In TW2, the particle size was smallest with high efficiency of drug entrapment and low PDI. The optimized stirring speed was 3000 rpm, which achieved the smallest particle size of 65.32 ± 1.88 nm. The higher shear obtained on increasing the stirring speed reduced the particle size. For the optimization of polymer and cross-linking agent ratio, different ratios were optimized and ratio of 5:1 showed the best results. On decreasing the ratio, an increase in turbidity was observed, which indicates increment in particle size. Optimization of formulation variables and process variables on the basis of particle size, entrapment efficiency and PDI are tabulated in Table 6.
Table 6.
Optimization of formulation variables and process variables.
| S. No. | Code | Particle Size (nm) ± S.D. | Entrapment Efficiency (%) ± S.D. | PDI |
|---|---|---|---|---|
| Optimization of Polymer Concentration | ||||
| 1 | DP1 | 89.24±0.75 | 75.46%±0.94 | 0.631 |
| 2 | DP2 | 67.33±1.34 | 83.11%±1.42 | 0.529 |
| 3 | DP3 | 60.43±1.85 | 91.056%±1.93 | 0.254 |
| 4 | DP4 | 128.1±2.01 | 80.23%±1.87 | 0.556 |
| Optimization of Cross-linking Agent Concentration | ||||
| 5 | TP1 | 93.32±0.95 | 68.44%±1.22 | 0.551 |
| 6 | TP2 | 79.44±0.77 | 71.11%±1.37 | 0.722 |
| 7 | TP3 | 73.85±0.86 | 91.56%±1.04 | 0.254 |
| 8 | TP4 | 132.2±1.63 | 82.65%±1.54 | 0.341 |
| Optimization of Surfactant Concentration | ||||
| 9 | TW1 | 142.1±1.21 | 82.11%±1.52 | 0.752 |
| 10 | TW2 | 81.11±1.26 | 90.21%±1.73 | 0.375 |
| 11 | TW3 | 95.47±0.54 | 85.24%±1.48 | 0.996 |
| 12 | TW4 | 98.45±1.59 | 76.59%±0.72 | 0.894 |
| Optimization of Stirring Speed | ||||
| 13 | SS1 | 298.7±0.37 | 80.18%±1.35 | 0.931 |
| 14 | SS2 | 132.1±1.52 | 75.22%±1.27 | 0.573 |
| 15 | SS3 | 84.42±0.94 | 70.46%±0.79 | 0.751 |
| 16 | SS4 | 65.32±1.88 | 91.59%±1.75 | 0.397 |
10. Statistical analysis of experimental data
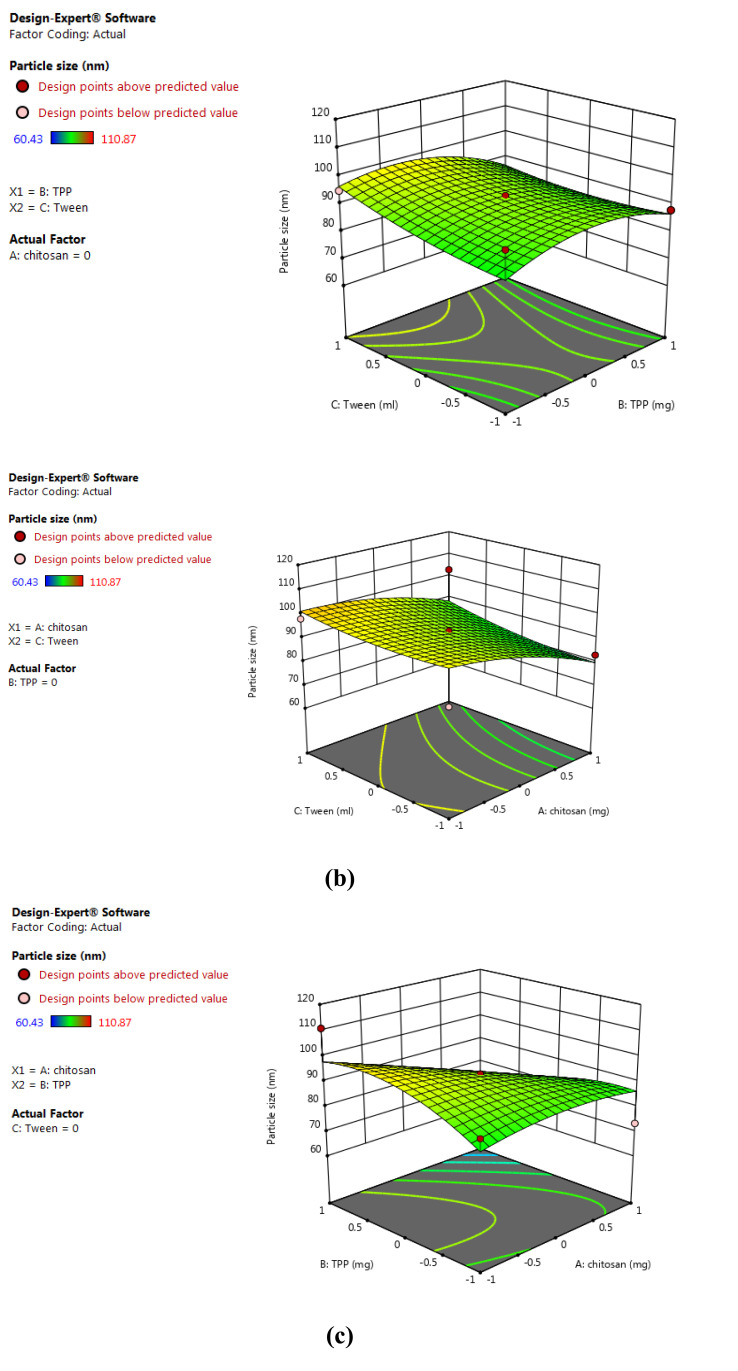
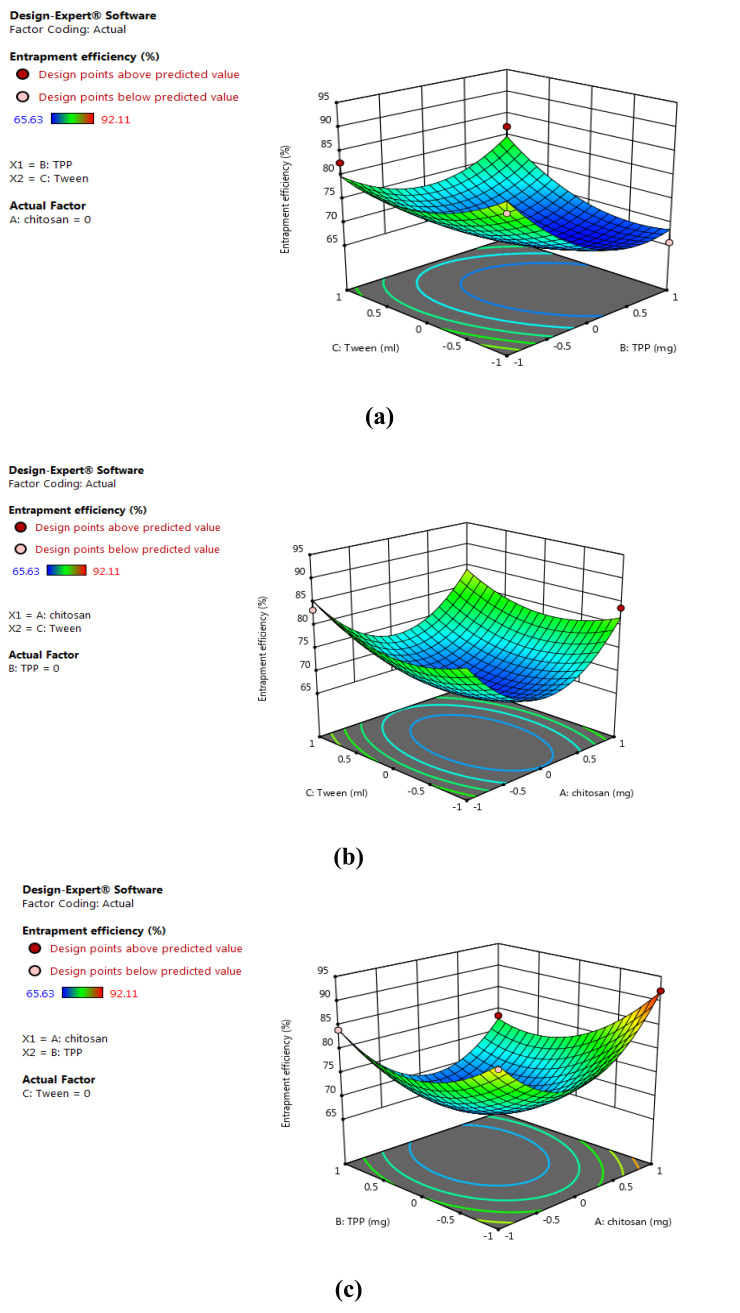
BBD 3-factor, 3-level was used and 13 runs were conducted for the preparation of tobramycin sulphate loaded chitosan nanoparticles using and evaluated the effects of independent variables on the dependent variables. BBD validated substantial beneficial information and usefulness of statistical design for the design and conduct of experiments. Independent variables had significantly influenced the observed responses for % EE and particle size. Polynomial equations were statistically validated by ANOVA and the model was found to be significant with F value of 6.14 for particle size and 12.49 for % EE. 3-D model graphs of response surface analyses were plotted for the depiction of the effects of factors that were predetermined on the response of particle size and entrapment efficiency as shown in Figs. (1) and (2). The model developed from multiple linear regression to estimate the particle size (Y1) and% EE (Y2) can be represented mathematically as:
Fig. (1).
3D surface model graph showing effects of factors on particle size. (a) X1 and X2 at mid-level of X3; (b) X1 and X3 at mid-level of X2; (c) X2 and X3 at mid-level of X1. (A higher resolution / colour version of this figure is available in the electronic copy of the article).
Fig. (2).
3D surface model graph showing effects of factors on % entrapment efficiency. (a) X1 and X2 at mid-level of X3; (b) X1 and X3 at mid-level of X2 and (c) X2 and X3 at mid-level of X1. (A higher resolution / colour version of this figure is available in the electronic copy of the article).
Y1 = +93.11- 7.83 X1- 2.05 X2 + 2.90 X3 – 8.57 X1X2 + 1.46 X1X3- 2.72 X2X3- 3.17 X12 – 6.42 X22 + 1.97 X32 (1)
Y2 = +86.92- 0.3261 X1- 4.15 X2 + 1.53 X3 – 2.93 X1X2 – 0.3703 X1X3 + 4.09 X2X3 + 11.60 X12 + 6.64 X22 + 4.68 X32 (2)
The equations (1) and (2) depicts the quantitative effects of factor X1, X2 and X3 on the responses Y1 and Y2.
The sign of the coefficient represents the influence of factors on the response as a positive sign (+) designates a synergistic effect and negative sign (-) signifies antagonist effect.
10.1. Preparation of Calibration Curve of Tobramycin Sulphate.
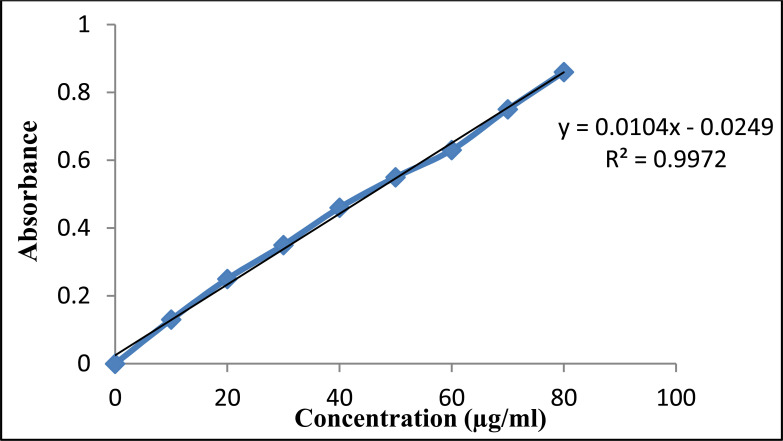
Tobramycin sulphate lacks UV absorbing chromophore and has a high polar nature due to which its analysis becomes a major challenge. The colorimetric method was used by coupling tobramycin sulphate with ascorbic acid and dimethylsulfoxide to give color compound. The calibration curve of tobramycin sulphate was prepared by and the observed equation for a straight line was y = 0.0104 x -0.00249 with a regression coefficient of 0.9972 at 390 nm as shown in Fig. (3).
Fig. (3).
Standard calibration curve of tobramycin sulphate at 390 nm. (A higher resolution / colour version of this figure is available in the electronic copy of the article).
10.2. Drug Excipient Compatibility Studies
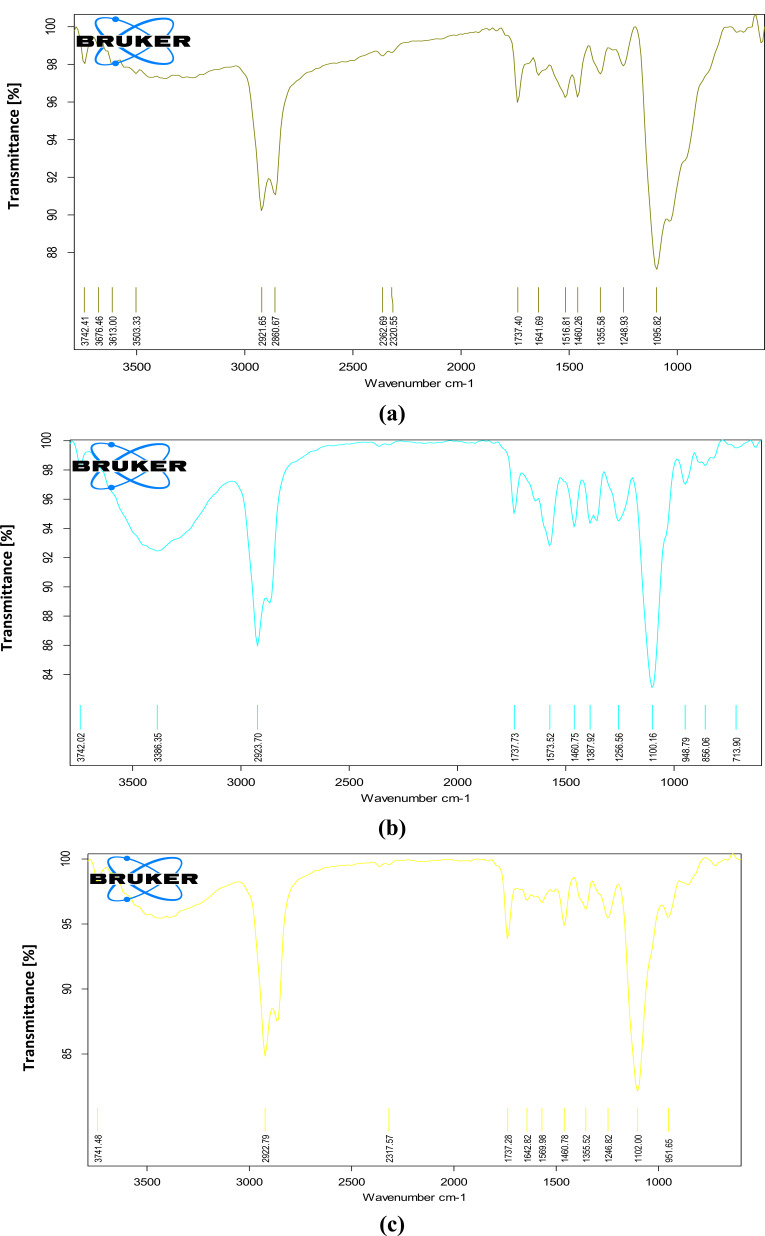
Compatibility studies of drug and excipient were done to check any potential interaction between drug and excipient prior to the preparation of polymeric nanoparticles. Fourier-transform Infrared spectroscopy was utilized to obtained spectra of chitosan, pure drug and their physical mixture (1:1). The individual FTIR spectra of polymer and drug and their combination showed the characteristic peaks as shown in Fig. (4). In the spectra of pure chitosan, the strong and wide peak in the 3500-3300 cm-1 area is ascribed to hydrogen-bonded O-H stretching vibration. The sharp peak at 2923 cm-1 belongs to C-H stretching, 1737 cm-1 (ester carbonyl stretching band) and peak at 1573 cm-1 are due to carbonyl (C=O) bond stretching. At 1100 cm-1 there is a sharp peak showing C-O stretching of secondary alcohol. Spectra of tobramycin sulphate exhibit sharp peak at 2921 cm-1 because of C-H stretching vibration of hydrocarbons and low-intensity peak at 1460 cm-1 depicting CH2 bending of alkane. A slight peak at 1246 cm-1 (C-O stretching of ester) and broader intensity peak is observed at 1095 cm-1 which is attributed to alcoholic C-O stretching. In the combination of chitosan and tobramycin sulphate, peaks at 2922 cm-1, 1737 cm-1, 1460 cm-1, 1246 cm-1 and 1100 cm-1 overlap each other. Any kind of interaction between drugs and polymers was not observed [42].
Fig. (4).
Drug Excipient compatibility studies: (a) Fourier-transform infra-red spectrum of tobramycin sulphate, (b) Spectrum of chitosan, (c) Spectrum of tobramycin sulphate and chitosan. (A higher resolution / colour version of this figure is available in the electronic copy of the article).
10.3. Shape and Surface Morphology
Tobramycin sulphate loaded polymeric nanoparticles were visualized for surface morphology and particle size through TEM at the different magnifications 250000X and 10000X. The average size of the particles was found to be below 100 nm, indicating the best suitability for ocular delivery as particles on nanoscale can easily permeate through the cornea. Chitosan loaded nanoparticles exhibited uniform size distribution without any aggregation, which might be ascribed to the optimal amalgamation of the ratio of drugs with polymer and stirring speed. The optimum concentration of polymer accompanied with optimal stirring speed (3000 rpm) could certainly disintegrate the formed nanoparticles. Whereas due to higher concentration of polymer the solution becomes viscous that might hinder the disintegration of particles by stirring and results in increment in particle size. The particles were spherical in shape and appearance was smooth as interpreted from Fig. (5) [43].
Fig. (5).
TEM images for tobramycin sulphate loaded chitosan nanoparticles. (A higher resolution / colour version of this figure is available in the electronic copy of the article).
10.4. Particle Size Distribution and Polydispersity Index (PDI)
Dynamic Light Scattering technique was used to assess the particle size and polydispersity index (PDI) of the prepared nanoparticulate formulation. The range of particle size was between 60.43 ± 1.25 nm to 110.87 ± 0.94 nm. The lowest particle size obtained was 60.43 ± 1.25 nm and PDI 0.254 ± 0.74, which indicated ideal significance for ocular delivery as there was easy permeation of the nanoparticles. The average consistency of particles is determined by PDI and greater values commensurate to larger size distribution of particle in the sample. Nanoparticle aggregation is specified by PDI along with the uniformity and efficiency of particle surface modifications. The particle size
10.5. Zeta Potential Measurement
The storage stability of colloidal dispersion is predicted by the estimation of zeta potential. Generally, aggregation of particles barely transpires for charged particles i.e. for particles having greater zeta potential will disperse and resist aggregation because of electric repulsion. The observed zeta potential range was found between +21.56 ± 1.12 to +35.74 ± 0.95 mV, that might be ascribed to the positive charges on surfactant’s mixture and polymer matrices as depicted in Table 6. Steric stability to the nanoparticles is also provided by tween 80.
10.6. Drug Entrapment Efficiency
The entrapment efficiency of tobramycin sulphate nanoparticles was evaluated and data is shown in Table 6. The lowest entrapment efficiency of drug was 61.376% ± 2.03 whereas formulation F13 91.56% ± 1.93 being the highest. The nature of polymer and solubility of drug in polymer determines the effectiveness entrapment of the drug. Since tobramycin sulphate is freely soluble in water and chitosan is a hydrophilic polymer, thus more drugs could be entrapped into matrices of a polymer. The concentration of chitosan was adequate for the entrapment of higher amount of drug, apart from nature of polymer and drug. When the concentration of polymer was additionally escalated, dwindle in entrapment was distinguished, which might be due to excessive viscosity of polymeric solution that impedes the dispersal of the drug in polymer matrices. The concentration of cross-linking agent has a substantial contribution in greater entrapment of drug, despite optimum chitosan concentration [44]. More amount of polymer could be gelate by higher concentration of cross-linking agents, therefore escalating entrapment of drugs into nanoparticles.
10.7. In Vitro Drug Release Studies
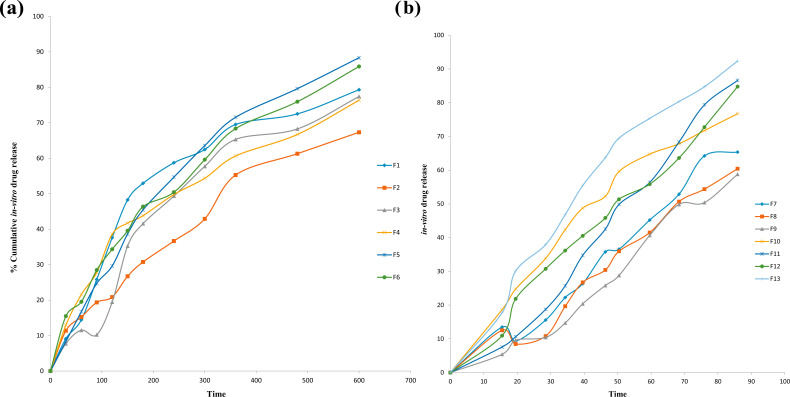
To carry out in vitro drug release studies, the dialysis diffusion bag technique was utilized. The release of drugs from the developed formulations ranged from 58.78% ± 0.57 to 92.21% ± 1.71 for 12 hours and depended on the ratio of drug to polymer. The drug release profile of tobramycin sulphate nanoparticles manifested that the formulations exhibited initial burst release of 5.42% ± 1.78, that might be due to absorbed drug onto polymer surface and sustained release of 92.21% ± 1.71 up to 12 hours. Formulation F13 shows the maximum drug release. Sustained release of drugs was up to 12 hours, as the drug steadily gets diffused through the surface of polymer core. The pattern of sustained release of drugs up to 12 hours would promote reduced frequency of dosing. Fig. (6) shows the graphical representation of in vitro drug release profile of tobramycin sulphate from chitosan nanoparticles.
Fig. (6).
Cumulative in vitro release study. (a) Cumulative in vitro release study tobramycin sulphate loaded polymeric nanoparticles of formulation F1 to F6. (b) Cumulative in vitro release study tobramycin sulphate loaded polymeric nanoparticles of formulation F7 to F13. (A higher resolution / colour version of this figure is available in the electronic copy of the article).
11. CHARACTERIZATION PARAMETERS FOR TOBRAMYCIN SULPHATE LOADED CHITOSAN NANOPARTICLES BASED GEL
11.1. Physiochemical Evaluation
All the nanoparticulate gel formulations were clear, transparent with an absence of grittiness and aggregates that indicated excellent homogeneity. The pH of all prepared formulation was found to be in an acceptable range of 7.1 to 7.4, which could easily tolerate upon installation without causing any irritation. The viscosity of the formulations was found between 19500 to 65000 cps. Viscosity depended on the amount of polymers is used in the formulation. If the viscosity of nanoparticulate gel system is high, ocular shear rate will also be high during blinking which may cause irritation in the eye. While if viscosity is low, the shear rate during blinking will also be low, this may cause drainage of the formulation. Therefore, the formulation with optimal viscosity provides easy installation into the eyes without any drainage or irritation. The administration of ophthalmic preparations should influence possible pseudoplastic behavior on the pre-corneal film. The spreadability of the formulations was found between 4.1-6.9 g.cm/sec. The spreadability of the formulations clearly signifies that the gel can easily spread on the ocular surface. The result physiochemical evaluation of all 13 formulations has complied in Table 8.
Table 8.
Complied results of the organoleptic evaluation and physical properties of developed tobramycin sulphate loaded chitosan nanoparticles based gel.
| S. No. | Formulations | Homogeneity | Grittiness | pH | Spreadability g⋅cm/sec | Viscosity (cps) | Drug Content |
|---|---|---|---|---|---|---|---|
| 1 | F1 | +++ | - | 7.31 | 4.1 | 19500 | 83.36 ± 0.57 |
| 2 | F2 | ++ | - | 7.2 | 4.9 | 22000 | 91.75 ± 1.46 |
| 3 | F3 | +++ | - | 7.3 | 4.1 | 29035 | 96.11 ± 0.64 |
| 4 | F4 | +++ | - | 7.1 | 4.7 | 32100 | 93.32 ± 1.82 |
| 5 | F5 | +++ | - | 7.23 | 5.5 | 39802 | 82.41 ± 0.72 |
| 6 | F6 | ++ | - | 7.4 | 5.1 | 43700 | 97.13 ± 0.32 |
| 7 | F7 | ++ | - | 7.15 | 5.6 | 48900 | 96.82 ± 1.91 |
| 8 | F8 | +++ | - | 7.3 | 6.2 | 52900 | 94.01 ± 0.21 |
| 9 | F9 | +++ | - | 7.35 | 5.1 | 55321 | 79.29 ± 0.69 |
| 10 | F10 | +++ | - | 7.4 | 6.5 | 59033 | 96.36 ± 1.25 |
| 11 | F11 | +++ | - | 7.2 | 6.5 | 61500 | 95.92 ± 1.44 |
| 12 | F12 | ++ | - | 7.3 | 6.8 | 62000 | 94.61 ± 1.12 |
| 13 | F13 | +++ | - | 7.4 | 6.9 | 65000 | 97.52 ± 1.34 |
+ Satisfactory, ++ good, +++ Very good; - no grittiness.
11.2. Drug Content
The drug content for the developed tobramycin sulphate loaded nanoparticulate gel was in between 79.29% ± 0.69 to 97.52% ± 1.34. The examination of drug content exhibited that drug-loaded nanoparticulate gel was evenly and appropriately distributed in formulations as given in Table 7.
Table 7.
Compiled characterization of tobramycin sulphate loaded chitosan nanoparticles.
| S. No. | Formulations | Average particle size ± S.D | Zeta Potential ± S.D |
Polydispersity
Index ± S.D |
Entrapment
Efficiency ± S.D |
|---|---|---|---|---|---|
| 1 | F1 | 85.63 ± 2.13 | 21.64 ± 1.64 | 0.522 ± 1.31 | 78.381 ± 0.73 |
| 2 | F2 | 79.82 ± 1.48 | 35.74 ± 0.95 | 0.426 ± 1.84 | 86.382 ± 1.29 |
| 3 | F3 | 109.32 ± 1.73 | 22.26 ± 0.53 | 6.379 ± 0.58 | 81.638 ±1.43 |
| 4 | F4 | 103.77 ± 0.85 | 33.56 ± 0.68 | 3.841 ± 2.01 | 75.968 ± 0.84 |
| 5 | F5 | 68.73 ± 0.93 | 26.49 ± 1.95 | 2.936 ± 0.73 | 61.376 ± 2.03 |
| 6 | F6 | 105.13 ± 0.79 | 35.71 ± 2.11 | 2.848 ± 0.59 | 83.864 ± 1.84 |
| 7 | F7 | 79.22 ± 1.62 | 21.56 ± 1.12 | 4.822 ± 1.36 | 79.382 ± 1.44 |
| 8 | F8 | 110.87 ± 0.94 | 32.24 ± 2.34 | 5.739 ± 0.47 | 85.399 ± 0.79 |
| 9 | F9 | 99.42 ± 1.44 | 27.96 ± 0.76 | 8.265 ± 1.63 | 86.274 ± 1.83 |
| 10 | F10 | 84.57 ± 0.53 | 36.69 ± 0.97 | 4.274 ± 2.07 | 74.288 ± 2.11 |
| 11 | F11 | 97.32 ± 1.34 | 31.38 ± 1.52 | 0.996 ± 1.43 | 83.732 ± 0.68 |
| 12 | F12 | 75.35 ± 2.01 | 26.55 ± 0.91 | 3.543 ± 1.35 | 81.745 ± 1.74 |
| 13 | F13 | 60.43 ± 1.25 | 28.37 ± 1.32 | 0.254 ± 0.74 | 91.56 ± 1.93 |
and PDI of formulations have been depicted in Table 7.
11.3. In Vitro Release Studies
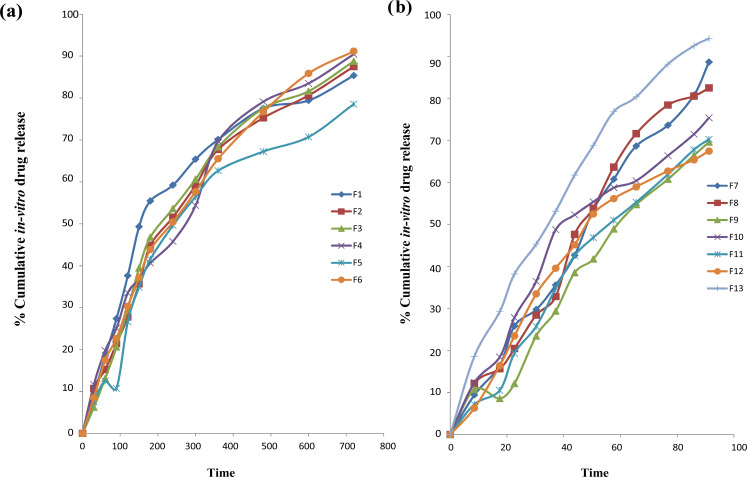
In vitro release studies were conducted on FD cell for formulations F1 to F13 in pH 7.4. The drug release from formulation F9, F10, F11 and F12 was less due to more concentration of carbopol and because of that drug was not able to diffuse completely through the barrier of a thick gel. The release of drug-loaded formulations varied from 69.97% to 94.21% for 12 hours. The drug release pattern of tobramycin sulphate loaded nanoparticulate gel displayed initial burst of formulations up to 6.24% ± 1.78 that might be due to absorbed drugs on surface of polymer. Sustained release of the 92.21% ± 1.71 was up to 12 hours because of the slow diffusion of drugs through the surface of polymer. After administration of formulation in the ocular region, the release pattern could cause instantaneous drug release and sustained release of 12 hours so as to provide lower dosing frequency. Fig. (7) shows the graphical representation of in vitro drug release from nanoparticulate gel.
Fig. (7).
Cumulative in vitro release study. (a) Cumulative in vitro release study tobramycin sulphate loaded polymeric nanoparticles based gel for formulation F1 to F6. (b) Cumulative in vitro release study tobramycin sulphate loaded polymeric nanoparticles based gel of formulation F7 to F13. (A higher resolution / colour version of this figure is available in the electronic copy of the article).
11.4. Ex Vivo Transcorneal Permeation Studies
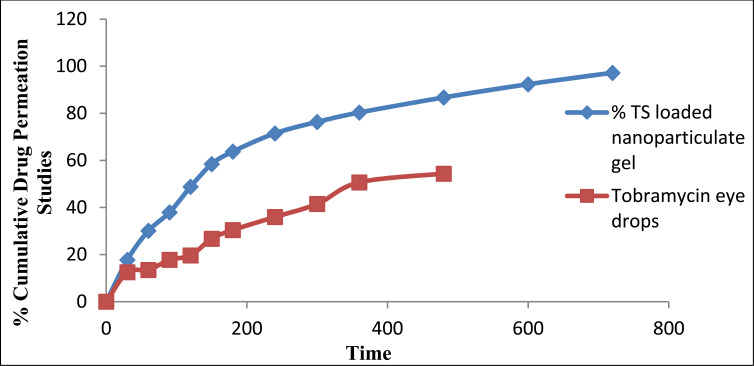
Ex vivo transcorneal permeation studies conducted for batch F13 as smaller particle size, shape, surface morphology, polydispersity index, drug content, in vitro release, viscosity, spreadability were shown best by this formulation. TS loaded nanoparticulate gel exhibited significant enhancement in permeation 92.21% ± 0.84 up to 14 hours than compared to the marketed formulation as shown in Fig. (8). Ameliorated permeation could be ascribed to protracted retention due to mucoadhesive nanoparticles as there was interaction of ions between positive amino groups of chitosan and negatively charged mucin [45].
Fig (8).
Transcorneal permeation profiles of tobramycin sulphate from optimized nanoparticles based gel using excised goat corneas. (A higher resolution / colour version of this figure is available in the electronic copy of the article).
11.5. Bioadhesion Studies
The objective of the bioadhesion studies was to observe the nature of nanoparticles loaded gel adherence to the corneal membrane so that it should be able to solve the drainage problem juxtapose to conventional eye drops. The developed formulation (F13) exhibits satisfactory results for bioadhesion study which shows that the developed formulation instilled into the eye will remain intact in the ocular cavity. In the formulation, the optimum concentration of carbopol 934 and HPMC K4M assisted to amplify the bioadhesion time on the corneal surface up to 10 hours [46].
11.6. Ocular Irritancy Test (HET-CAM Test)
The developed formulation was tested for ocular irritancy test by checking hen’s egg chorioallantoic membrane that is said to be sensitive, quick and economic. Investigating incubated eggs is on the boundary of in vitro and in vivo testing and there is no ethical conflict as well as no legal obligations. Veins, arteries and capillaries are included in the chorioallantoic membranes of chick that give a similar response to trauma with complete inflammation process as it is shown in conjunctival tissue of the eye of rabbit. Tobramycin sulphate loaded chitosan nanoparticles based gel was subjected to test by this method by comparing it with normal saline. The mean score for normal saline was obtained as 0 for the duration of 24 hours. The developed nanoparticles based gel was non-irritant up to 1 hour whereas the score was found to be 0.33 up to 24 hours. Therefore, results represent that the formulation was non-irritant and could be well tolerated and that be attributed to biocompatibility and non-immunogenicity of chitosan, the natural polymer.
11.7. Antimicrobial Studies
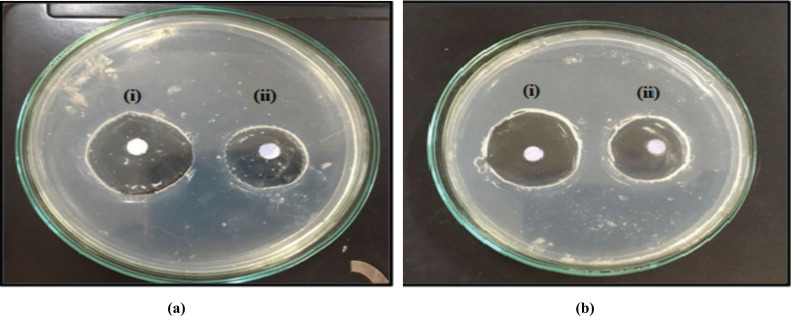
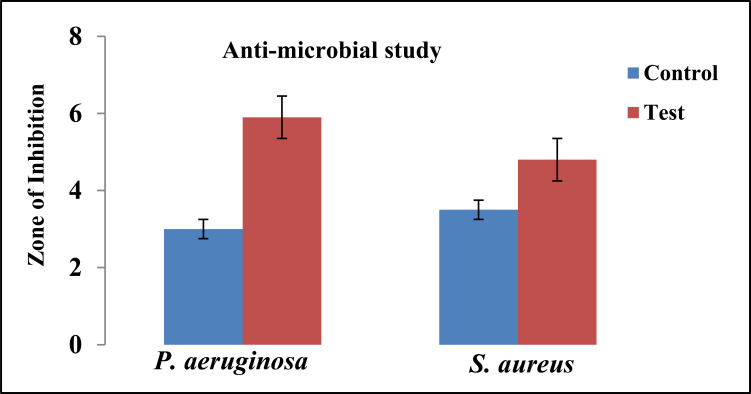
The antimicrobial studies were carried out by using Pseudomonas aeruginosa and Staphylococcus aureus as test microorganisms. The study indicates that the tobramycin sulphate polymeric nanoparticles loaded gel showed a good zone of inhibition. An overall value of the diameter of zone of inhibition against Pseudomonas aeruginosa for F13 was found to be 5.8 cm which was higher than Staphylococcus aureus for F13 was 3.9 cm and compared with the marketed formulation. The pictorial presentation of antimicrobial studies shown in Fig. (9) and the graph for the zone of inhibition is depicted in Fig. (10). A good inhibition was shown by tobramycin sulphate nanoparticles based gel contrary to marketed drops of tobramycin, which could be ascribed to sustained drug release from nanoparticulate gel that could help to maintain MIC for a prolonged period of time.
Fig. (9).
Images of antibacterial activity of tobramycin sulphate nanoparticle loaded gel (a) Inhibition against Pseudomonas aeruginosa and (b) Inhibition against Staphylococcus aureus (i) Test (ii) Control. (A higher resolution / colour version of this figure is available in the electronic copy of the article).
Fig. (10).
Data representing the zone of inhibition of P. aeruginosa and S. aureus, by tobramycin sulphate loaded chitosan nanoparticles based gel. (A higher resolution / colour version of this figure is available in the electronic copy of the article).
11.8. Isotonicity Evaluation
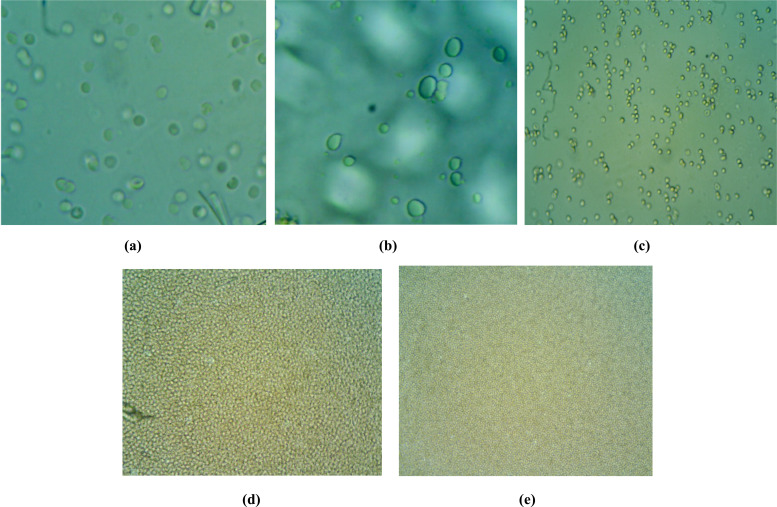
The isotonicity test was conducted to check whether the solutions given in the eye do not cause any kind of irritation and ocular tissue damage. TS nanoparticulate gel formulation (F13) was subjected to the evaluation of isotonicity test and was compared with the marketed ophthalmic preparation for isotonic solution (0.9% w/v NaCl), hypertonic solution and hypotonic solution. In a hypotonic solution, the bursting of cells was observed and in a hypertonic solution, there was no shrinkage of cells. In an isotonic solution, there was no shrinkage and bursting of cells. Therefore, for ophthalmic preparations, the conditions should be isotonic and it was confirmed that the prepared formulation was isotonic to eye as shown in Fig. (11).
Fig. (11).
Microscopic images for isotonicity test (a) Blood cells with developed tobramycin sulphate nanoparticles loaded gel (b) Blood cells with marketed tobramycin sulphate eye drop (c) Blood cells with isotonic solution (d) Blood cells with hypertonic solution (e) Blood cells with hypotonic solution. (A higher resolution / colour version of this figure is available in the electronic copy of the article).
11.9. Sterility Studies
The soya bean casein medium was utilized for the detection of anaerobic bacteria and fungi whereas fluid thioglycollate was used for the detection of aerobic bacteria. No turbidity and microbial growth were perceived in the sample of soya bean casein digest and fluid thioglycollate medium. Further, the medium was checked for microbial growth on different strains such as Pseudomonas aeruginosa and Staphylococcus aureus.
11.10. Histopathology Studies
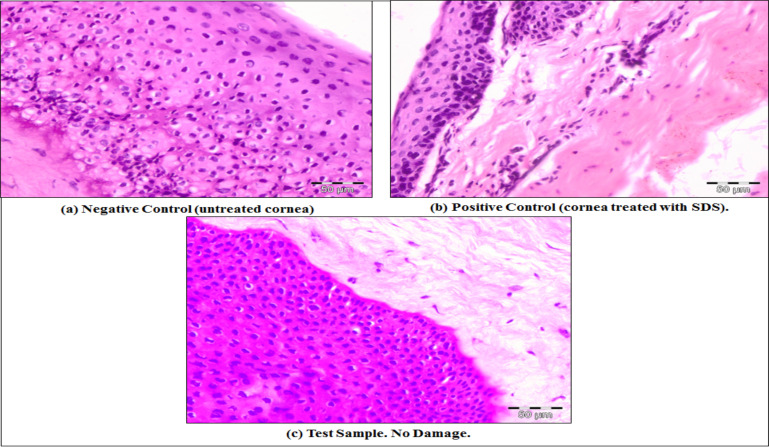
For histopathology studies sections of goat, the cornea was utilized. For negative control, the untreated cornea was used and positive control cornea was treated with 0.1% sodium dodecyl sulfate (SDS). In the positive control, there was high epithelial damage to the cornea and negative control showed normal epithelial cells. In the test sample, there was no evidence of damage to the normal structure. Test sample when compared with marketed eye drops, showed better results than the marketed eye drops, as in the test sample, there was no evidence of damage while in the marketed eye drops slight damage in the epithelium layer was observed [47]. Histopathological sections of goat cornea with negative control (untreated cornea), positive control (cornea treated with 0.1% SDS) and test sample (treated with Tobramycin sulphate nanoparticle loaded gel) are illustrated in Fig. (12).
Fig. (12).
Comparative histopathological sections of goat cornea (a) Negative control (untreated cornea) (b) Positive control (cornea treated with 0.1% SDS), (c) Test sample (treated with tobramycin sulphate nanoparticle loaded gel). (A higher resolution / colour version of this figure is available in the electronic copy of the article).
11.11. Release Kinetics
Data collected from in vitro release study was fitted into various kinetic models. It was found that formulation F13 was primarily elucidated by zero-order as the plots manifested the highest linearity (R2 = 0.9723) which was followed by Higuchi’s equation (R2 = 0.9657) and then first order (R2 = 0.9146). Korsmeyer-Peppas equation specified good linearity (R2 = 0.9606) with release exponent ‘n’ 1.103 as shown in Table 9. Formulation F13 demonstrated zero-order release on fitting the data for in vitro drug release in different equations. Release component ‘n’ acquired by Korsmeyer-Peppas equation was 0.9606 which manifests the anomalous (non-fickian) diffusion which illustrated that the release of the drug was controlled by both phenomena swelling controlled release and diffusion-controlled release.
Table 9.
Release kinetics parameters for tobramycin sulphate nanoparticles loaded gel.
| Zero Order | First Order | Higuchi’s Equation | Korsmeyer’s Peppas Equation | ||||
|---|---|---|---|---|---|---|---|
| K | R2 | K | R2 | K | R2 | N | R2 |
| 0.1894 | 0.9723 | 0.0015 | 0.9146 | 4.1056 | 0.9657 | 1.103 | 0.9606 |
11.12. Stability Studies
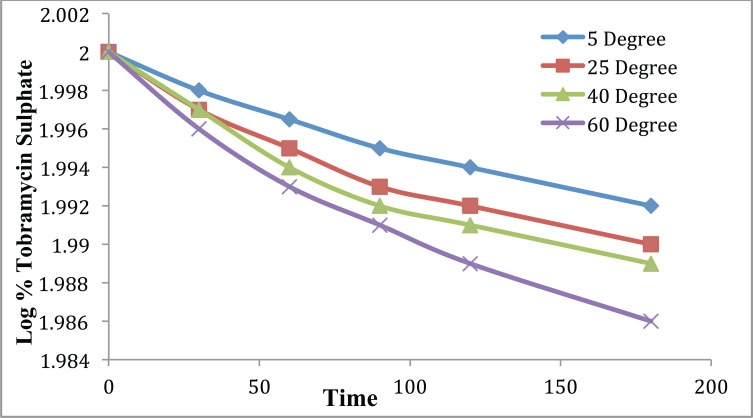
Stability studies were conducted for 6 months and samples were stored at varying temperatures 5 ± 1°C, 25 ± 2°C, 40 ± 2°C, 60 ± 2°C and 75 ± 5% RH to access their stability. The developed formulation was analyzed for appearance, pH, viscosity, particle size, PDI, drug content and spreadability for 6 months. It was observed that developed formulation rationalizes all characterization parameters after 6 months as well. A slight change was observed in the formulation at 60oC. Stability study data for formulation F13 have been compiled in Table 10 at various temperatures and Table 11 depicts slope and degradation constant of tobramycin sulphate loaded chitosan nanoparticles based gel. Fig. (13) illustrates the Log% of tobramycin sulphate remaining vs. time for formulation F13.
Table 10.
Stability data for optimized formulation.
| Time in Days | % Drug Remained | Log% Drug Remained |
|---|---|---|
| 5 ± 1°C | ||
| 0 | 100 | 2 |
| 30 | 99.655 | 1.998 |
| 60 | 99.218 | 1.996 |
| 90 | 98.762 | 1.994 |
| 180 | 98.196 | 1.992 |
| 25 ± 2°C | ||
| 0 | 100 | 2 |
| 30 | 99.545 | 1.998 |
| 60 | 99.025 | 1.995 |
| 90 | 98.577 | 1.993 |
| 180 | 97.909 | 1.99 |
| 40 ± 2°C | ||
| 0 | 100 | 2 |
| 30 | 99.469 | 1.997 |
| 60 | 98.879 | 1.995 |
| 90 | 98.121 | 1.991 |
| 180 | 97.763 | 1.99 |
| 60 ± 2°C | ||
| 0 | 100 | 2 |
| 30 | 99.472 | 1.997 |
| 60 | 98.559 | 1.993 |
| 90 | 97.711 | 1.989 |
| 180 | 96.645 | 1.985 |
Table 11.
Slope and Degradation constant of tobramycin sulphate loaded chitosan nanoparticles based gel.
| Temperature | Slope |
Degradation
Constant, K |
Log K | 1/T x 10-3 | Log K + 4 |
|---|---|---|---|---|---|
| 5°C | 2.56 x 10⁻⁵ | 0.543 x 10⁻⁴ | -4.3412 | 3.576987 | 0.1208 |
| 25°C | 3.83 x 10⁻⁵ | 0.788 x 10⁻⁴ | -4.8768 | 3.367123 | 0.1532 |
| 40°C | 4.55 x 10⁻⁵ | 1.342 x 10⁻⁴ | -3.9975 | 3.149811 | 0.1942 |
| 60°C | 7.89 x 10⁻⁵ | 1.754 x 10⁻⁴ | -3.7231 | 3.053865 | 0.2374 |
Fig. (13).
Log % of tobramycin sulphate remaining vs. time for formulation F13. (A higher resolution / colour version of this figure is available in the electronic copy of the article).
11.13. Shelf Life Determination (Arrhenius Plot)
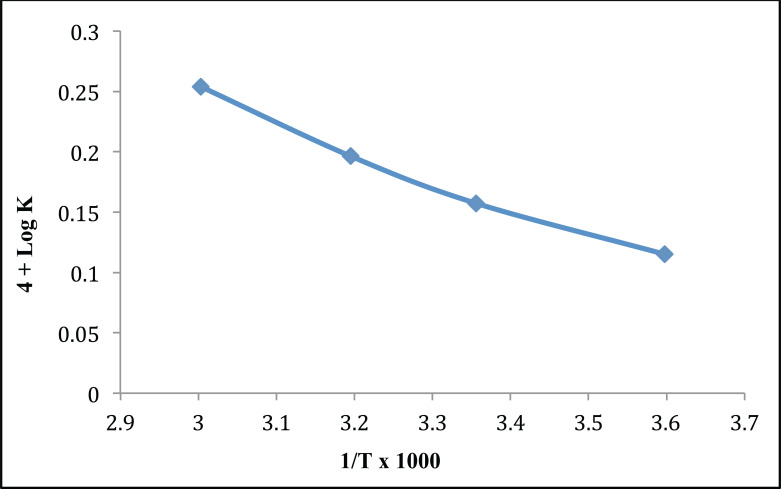
From the value of the Arrhenius plot, a value of log K i.e. -4.2347 was obtained by extrapolation. Graphical representation of the Arrhenius plot is illustrated in Fig. (14). Optimized formulation shows the shelf life in range of 3.45 years. Therefore, arbitrary shelf life of 3 years can be allocated to the formulations.
Fig. (14).
Arrhenius plot for optimized tobramycin sulphate loaded chitosan nanoparticles based gel. (A higher resolution / colour version of this figure is available in the electronic copy of the article).
CONCLUSION
Tobramycin sulphate loaded chitosan nanoparticles based gel was successfully formulated using the ionotropic gelation technique. The developed formulation was evaluated for all parameters and has shown a feasible substitute in comparison to conventional eye drop by enhancing the contact time, increased corneal permeation, sustained release and enhanced drug retention. The ease of administration coupled with its ability to provide sustained release for more than 12 hours could result in less dosing frequency. The results demonstrated the effective use of developed formulation as a controlled release preparation for the treatment of bacterial keratitis.
Current and Future Developments
Current conventional liquid ophthalmic dosage forms are inadequate to overcome complications related to natural ocular mechanism viz. lachrymal secretion, rapid nasolacrimal drainage, tear dynamics, blurred vision and low bioavailability of topically applied drug, thus decreased therapeutic efficacy. To address these challenges, tobramycin sulphate loaded chitosan nanoparticulate gel was developed which has exhibited advantageous biological attributes such as enhanced contact time, site-specific targeting, sustained release, high corneal permeation and enhanced drug retention. The current investigation demonstrated effectiveness of tobramycin sulphate nanoparticles on bacterial keratitis by characterization parameters viz. ex-vivo transcorneal permeation studies, ocular irritancy test, antimicrobial studies, isotonicity evaluation and histopathology studies. In future, there is need of further investigation by detailed animal study of developed nanoparticles. After successful in vivo studies, it could be worked on human beings with clinical trials for bacterial keratitis.
Acknowledgements
Declared none.
Ethics Approval and Consent to Participate
Not applicable.
Human and Animal Rights
No animals/humans were used for studies that are basis of this research.
Consent for Publication
Not applicable.
Availability of Data and Materials
The authors confirm that the data supporting the findings of this study are available within the article.
Funding
None.
Conflict of Interest
The authors declare no conflict of interest, financial or otherwise.
REFRENCEs
- 1.Sridhar P, Sridhar M. Diagnosis & Management of Microbial Keratitis.
- 2.Hadassah J., Praveen K. Asit bacterial keratitis –causes, symptoms and treatment keratitis. UK: IntechOpen; 2012. pp. 15–30. [Google Scholar]
- 3.Schaefer F., Bruttin O., Zografos L., Guex-Crosier Y. Bacterial keratitis: a prospective clinical and microbiological study. Br. J. Ophthalmol. 2001;85(7):842–847. doi: 10.1136/bjo.85.7.842. [DOI] [PMC free article] [PubMed] [Google Scholar]
- 4.Dart J.K.G., Seal D.V. Pathogenesis and therapy of Pseudomonas aeruginosa keratitis. Eye (Lond.) 1988;2(Suppl.):S46–S55. doi: 10.1038/eye.1988.133. [DOI] [PubMed] [Google Scholar]
- 5.Stern G.A., Lubiniewski A., Allen C. The interaction between Ps. aeruginosa and the corneal epithelium. Arch. Ophthalmol. 1985;103:1221. doi: 10.1001/archopht.1985.01050080133033. [DOI] [PubMed] [Google Scholar]
- 6.Kreger A.S. Pathogenesis of Pseudomonas aeruginosa ocular diseases. Rev. Infect. Dis. 1983;5(5) Suppl. 5:S931–S935. doi: 10.1093/clinids/5.Supplement_5.S931. [DOI] [PubMed] [Google Scholar]
- 7.Brogden R.N., Pinder R.M., Sawyer P.R., Speight T.M., Avery G.S. Tobramycin: a review of its antibacterial and pharmacokinetic properties and therapeutic use. Drugs. 1976;12(3):166–200. doi: 10.2165/00003495-197612030-00002. [DOI] [PubMed] [Google Scholar]
- 8.Smolin G., Okumoto M., Wilson F.M., II The effect of tobramycin on Pseudomonas keratitis. Am. J. Ophthalmol. 1973;76(4):555–560. doi: 10.1016/0002-9394(73)90748-4. [DOI] [PubMed] [Google Scholar]
- 9.Davis B.D. Mechanism of bactericidal action of aminoglycosides. Microbiol. Rev. 1987;51(3):341–350. doi: 10.1128/mr.51.3.341-350.1987. [DOI] [PMC free article] [PubMed] [Google Scholar]
- 10.Hartmut L. Tobramycin: a review of therapeutic uses and dosing schedules. Curr. Ther. Res. Clin. Exp. 1998;59(7):420–453. doi: 10.1016/S0011-393X(98)85082-0. [DOI] [Google Scholar]
- 11.Sampath K., Debjit B., Shravan P., Shweta S. Recent challenges and advances in ophthalmic drug delivery system. Pharma Innov. 2012;1(4):1–15. [Google Scholar]
- 12.Gaudana R., Ananthula H.K., Parenky A., Mitra A.K. Ocular drug delivery. AAPS J. 2010;12(3):348–360. doi: 10.1208/s12248-010-9183-3. [DOI] [PMC free article] [PubMed] [Google Scholar]
- 13.Silva M.M., Calado R., Marto J., Bettencourt A., Almeida A.J., Gonçalves L.M.D. Chitosan Nanoparticles as a mucoadhesive drug delivery system for ocular administration. Mar. Drugs. 2017;15(12):370–386. doi: 10.3390/md15120370. [DOI] [PMC free article] [PubMed] [Google Scholar]
- 14.Sharare N., Zahra P., Omid A., Aydin B., Hoda M. Chitosan nanoparticles and their applications in drug delivery: a review. Curr Res Drug Dis. 2014;1(1):17–25. doi: 10.3844/crddsp.2014.17.25. [DOI] [Google Scholar]
- 15.Krishnamoorthy K., Mahalingam M. Selection of a suitable method for the preparation of polymeric nanoparticles: multi-criteria decision making approach. Adv. Pharm. Bull. 2015;5(1):57–67. doi: 10.5681/apb.2015.008. [DOI] [PMC free article] [PubMed] [Google Scholar]
- 16.Sarvesh B., Vibha C. Nano Converg. 2016;3(3):14–20. [Google Scholar]
- 17.Huang W.F., Gary C.P., Tang C.Y., Yang M. Optimization strategy for encapsulation efficiency and size of drug loaded silica xerogel/polymer core-shell composite nanoparticles prepared by gelation-emulsion method. Polym. Eng. Sci. 2018;58(5):742–751. doi: 10.1002/pen.24609. [DOI] [Google Scholar]
- 18.Neha G., Upendra N., Shubhini S. Fabrication and in vitro characterization of polymeric nanoparticles for Parkinson’s therapy: a novel approach. Braz. J. Pharm. Sci. 2014;50(4):869–876. doi: 10.1590/S1984-82502014000400022. [DOI] [Google Scholar]
- 19.Ferreira S.L.C., Bruns R.E., Ferreira H.S., et al. Box-Behnken design: an alternative for the optimization of analytical methods. Anal. Chim. Acta. 2007;597(2):179–186. doi: 10.1016/j.aca.2007.07.011. [DOI] [PubMed] [Google Scholar]
- 20.Nandhakumar S., Dhanaraju M., Pavankumar C., Sundar V. Optimization of paclitaxel loaded poly (-caprolactone) nanoparticles using Box Behnken design. Beni-Suef University. J. Basic Appl. Sci. 2017;6:362–373. doi: 10.1016/j.bjbas.2017.06.002. [DOI] [Google Scholar]
- 21.Jani R., Jani K., Setty C.M., Patel D. Preparation and evaluation of topical gel of valdecoxib. Int. J. Pharm. Sci. Drug Res. 2010;2(1):51–54. [Google Scholar]
- 22.Niyaz B., Kalyani P., Divakar G. Formulation and evaluation of gel containing fluconazole-antifungal agent. Int J Drug Dev Res. 2011;3(4):109–128. [Google Scholar]
- 23.Shaza W.S., Elrasheed A.G., Kamal A.E.I. A colorimetric method for the determination of tobramycin. International J Drug Form Res. 2011;2(4):260–272. [Google Scholar]
- 24.Rabindra K., et al. Chiotsan nanoparticles loaded with thiocolchicoside. Pharma Chem. 2012;4(4):1619–1625. [Google Scholar]
- 25.Wang Y., Li P., Truong-Dinh Tran T., Zhang J., Kong L. Manufacturing techniques and surface engineering of polymer based nanoparticles for targeted drug delivery to cancer. Nanomaterials (Basel) 2016;6(2):1–18. doi: 10.3390/nano6020026. [DOI] [PMC free article] [PubMed] [Google Scholar]
- 26.Ririn, Amran IT, Nurlina, Asrul J. Preparation and in vitro drug release of sodium diclofenac nanoparticles using medium chain chitosan and tripolyphosphate. Int Res J Pharm. 2015;6(2):98–103. [Google Scholar]
- 27.Patel R., Gajra B., Parikh R.H., Gayatri P. Ganciclovir loaded chitosan nanoparticles: preparation and characterization. J. Nanomed. Nanotechnol. 2016;7(6):1–8. [Google Scholar]
- 28.Paresh N.P., Patel L.J., Patel J.K. Development and testing of novel temoxifen citrate loaded chitosan nanoparticles using ionic gelation method. Pharm. Sin. 2011;2(4):17–25. [Google Scholar]
- 29.Maryam K., Armita A. Preparation and in vitro evaluation of chitosan nanoparticles containing diclofenac using the ion-gelation method. Jundishapur J. Nat. Pharm. Prod. 2015;10(2):1–7. [Google Scholar]
- 30.Varma J.N., Kumar T.S., Prasanthi B., Ratna J.V. Formulation and characterization of pyrazinamide polymeric nanoparticles for pulmonary tuberculosis: efficiency for alveolar macrophage targeting. Indian J. Pharm. Sci. 2015;77(3):258–266. doi: 10.4103/0250-474X.159602. [DOI] [PMC free article] [PubMed] [Google Scholar]
- 31.Khan A.W., Kotta S., Ansari S.H., Sharma R.K., Kumar A., Ali J. Formulation development, optimization and evaluation of aloe vera gel for wound healing. Pharmacogn. Mag. 2013;9(1) Suppl. 1:S6–S10. doi: 10.4103/0973-1296.117849. [DOI] [PMC free article] [PubMed] [Google Scholar]
- 32.Prathima S., Prathyusha S., Parvathi M. Formulation and evaluation of in situ gelling system for ocular delivery of timolol maleate. Int J Pharm Chem Sci. 2014;3(1):81–89. [Google Scholar]
- 33.Puranik K.M., Tagalpallewar A.A. Voriconazole in situ gel for ocular drug delivery. SOJ Pharm. Pharm. Sci. 2015;2(2):1–10. doi: 10.15226/2374-6866/2/2/00128. [DOI] [Google Scholar]
- 34.Pescina S., Govoni P., Potenza A., Padula C., Santi P., Nicoli S. Development of a convenient ex vivo model for the study of the transcorneal permeation of drugs: histological and permeability evaluation. J. Pharm. Sci. 2015;104(1):63–71. doi: 10.1002/jps.24231. [DOI] [PubMed] [Google Scholar]
- 35.Laddha U.D., Nerpagar A., Mandan S. Enhancement of transcorneal permeation and sustain release of timolol maleate from developed and optimized in situ gel with better safety profile. J. Drug Deliv. Ther. 2017;7(7):84–86. [Google Scholar]
- 36.Spielmann H. HET-CAM test. Methods Mol. Biol. 1995;43:199–204. doi: 10.1385/0-89603-282-5:199. [DOI] [PubMed] [Google Scholar]
- 37.Qi L., Xu Z., Jiang X., Hu C., Zou X. Preparation and antibacterial activity of chitosan nanoparticles. Carbohydr. Res. 2004;339(16):2693–2700. doi: 10.1016/j.carres.2004.09.007. [DOI] [PubMed] [Google Scholar]
- 38.Ameeduzzafar, Imam SS, Abbas Bukhari SN, Ahmad J, Ali A. Formulation and optimization of levofloxacin loaded chitosan nanoparticle for ocular delivery: in-vitro characterization, ocular tolerance and antibacterial activity. Int. J. Biol. Macromol. 2018;108:650–659. doi: 10.1016/j.ijbiomac.2017.11.170. [DOI] [PubMed] [Google Scholar]
- 39.Ali Z., Sharma P.K., Warsi M.H. Fabrication and evaluation of ketorolac loaded cubosome for ocular drug delivery. J. Appl. Pharm. Sci. 2016;6(09):204–208. doi: 10.7324/JAPS.2016.60930. [DOI] [Google Scholar]
- 40.Kumar D., Jain N., Gulati N., Nagaich U. Nanoparticles laden in situ gelling system for ocular drug targeting. J. Adv. Pharm. Technol. Res. 2013;4:9–17. doi: 10.4103/2231-4040.107495. [DOI] [PMC free article] [PubMed] [Google Scholar]
- 41.Mohammadi Z., Dorkoosh F.A., Hosseinkhani S., et al. Stability studies of chitosan-DNA-FAP-B nanoparticles for gene delivery to lung epithelial cells. Acta Pharm. 2012;62(1):83–92. doi: 10.2478/v10007-012-0008-z. [DOI] [PubMed] [Google Scholar]
- 42.Qi L., Xu Z., Jiang X., Hu C., Zou X. Preparation and antibacterial activity of chitosan nanoparticles. Carbohydr. Res. 2004;339(16):2693–2700. doi: 10.1016/j.carres.2004.09.007. [DOI] [PubMed] [Google Scholar]
- 43.Andreas Z. Microspheres and nanoparticles used in ocular delivery systems. Adv. Drug Deliv. Rev. 1995;16:61–73. doi: 10.1016/0169-409X(95)00017-2. [DOI] [Google Scholar]
- 44.de Campos A.M., Diebold Y., Carvalho E.L., Sánchez A., Alonso M.J. Chitosan nanoparticles as new ocular drug delivery systems: in vitro stability, in vivo fate, and cellular toxicity. Pharm. Res. 2004;21(5):803–810. doi: 10.1023/B:PHAM.0000026432.75781.cb. [DOI] [PubMed] [Google Scholar]
- 45.Satish M., Pravat K.S. Topical delivery of acetazolamide by encapsulating in mucoadhesive nanoparticles. Asian J Pharm Sci. 2017;12(6):550–557. doi: 10.1016/j.ajps.2017.04.005. [DOI] [PMC free article] [PubMed] [Google Scholar]
- 46.Silva M.M., Calado R., Marto J., Bettencourt A., Almeida A.J., Gonçalves L.M.D. Chitosan Nanoparticles as a Mucoadhesive Drug Delivery System for Ocular Administration. Mar. Drugs. 2017;15(12):370. doi: 10.3390/md15120370. [DOI] [PMC free article] [PubMed] [Google Scholar]
- 47.Jain G.K., Pathan S.A., Akhter S., et al. Microscopic and spectroscopic evaluation of novel PLGA-chitosan Nanoplexes as an ocular delivery system. Colloids Surf. B Biointerfaces. 2011;82(2):397–403. doi: 10.1016/j.colsurfb.2010.09.010. [DOI] [PubMed] [Google Scholar]
Associated Data
This section collects any data citations, data availability statements, or supplementary materials included in this article.
Data Availability Statement
The authors confirm that the data supporting the findings of this study are available within the article.


