

SUMMARY
Glycine levels are inversely associated with branched-chain amino acids (BCAAs) and cardiometabolic disease phenotypes, but biochemical mechanisms that explain these relationships remain uncharted. Metabolites and genes related to BCAA metabolism and nitrogen handling were strongly associated with glycine in correlation analyses. Stable isotope labeling in Zucker fatty rats (ZFRs) shows that glycine acts as a carbon donor for the pyruvate-alanine cycle in a BCAA-regulated manner. Inhibition of the BCAA transaminase (BCAT) enzymes depletes plasma pools of alanine and raises glycine levels. In high-fat-fed ZFRs, dietary glycine supplementation raises urinary acyl-glycine content and lowers circulating triglycerides but also results in accumulation of long-chain acyl-coenzyme As (acyl-CoAs), lower 5’ adenosine monophosphate-activated protein kinase (AMPK) phosphorylation in muscle, and no improvement in glucose tolerance. Collectively, these studies frame a mechanism for explaining obesity-related glycine depletion and also provide insight into the impact of glycine supplementation on systemic glucose, lipid, and amino acid metabolism.
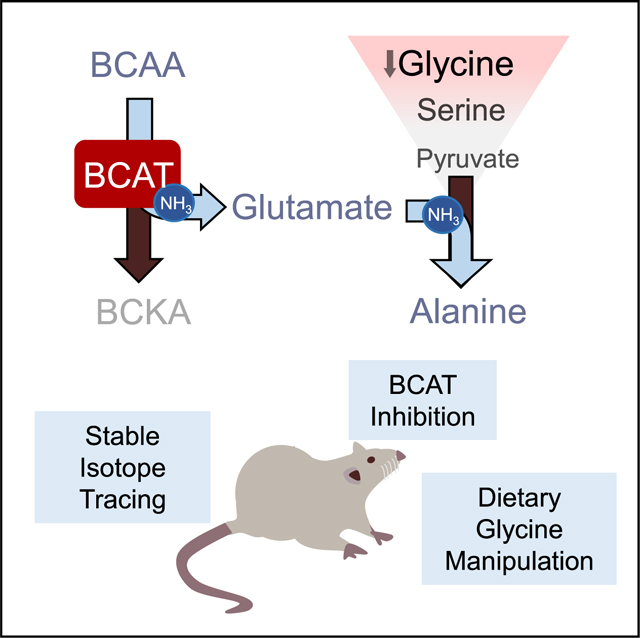
In Brief
White et al. provide a mechanism to explain why glycine levels are inversely associated with branched-chain amino acid (BCAA) levels and cardiometabolic disease phenotypes. Static metabolomics and stable isotope tracing technologies are used to demonstrate that glycine acts as a carbon donor for the pyruvate-alanine cycle in a BCAA-regulated manner.
Graphical Abstract
INTRODUCTION
Recent studies from our laboratory and others have demonstrated a strong association of branched-chain amino acids (BCAAs) with obesity, insulin resistance, and type 2 diabetes (Huffman et al., 2009; Laferrère et al., 2011; Newgard, 2017; Newgard et al., 2009; Tai et al., 2010; Wang et al., 2011; White et al., 2016). Interestingly, elevations in BCAA in obese and insulin-resistant subjects are consistently accompanied by decreases in circulating glycine levels. Moreover, glycine abundance displays a strong inverse association with BMI in humans (Baker et al., 2015; Butte et al., 2015; Felig et al., 1969; Kraus et al., 2016; Lee et al., 2015; Lips et al., 2014; Newgard et al., 2009; White et al., 2016; White and Newgard, 2019), and both bariatric surgery and exercise-based weight loss interventions raise circulating glycine levels while lowering BCAAs and their metabolites (Glynn et al., 2015; Gralka et al., 2015; Lips et al., 2014; Magkos et al., 2013; Laferrère et al., 2011). Furthermore, glycine is positively associated with insulin sensitivity (Gall et al., 2010; Huffman et al., 2009; Lustgarten et al., 2013; Thalacker-Mercer et al., 2014), healthy blood lipid profiles (Ding et al., 2015), and 10-year hypertension-free survival (Dietrich et al., 2016). Conversely, low glycine is associated with greater risk of acute myocardial infarction (Ding et al., 2015) and predicts future development of impaired glucose tolerance and type 2 diabetes (Floegel et al., 2013; Wang-Sattler et al., 2012). A causal link between BCAA supply and glycine levels was demonstrated in a study in which feeding of Zucker fatty rats (ZFRs) with a BCAA-restricted chow diet caused a clear increase in skeletal muscle and plasma glycine levels (White et al., 2016). Normalization of glycine levels in ZFRs fed the BCAA-restricted diet was associated with elevated urinary acyl-glycine excretion, accompanied by marked lowering of short- and medium-chain acyl-coenzyme A (acyl-CoA) species in skeletal muscle, a lower respiratory exchange ratio (RER) indicative of more efficient fatty acid oxidation, and improved skeletal muscle insulin sensitivity (White et al., 2016). However, the mechanism underlying the decline in glycine abundance in response to obesity and increased BCAA levels remains to be defined.
Limited understanding in this area may be related to the many diverse biological fates and roles of glycine (Hall, 1998; Kraus et al., 2016). It functions as an inhibitory neurotransmitter and a co-substrate for the formation of acyl-glycines, ammonia, bile acids, creatine, collagen, dimethylglycine, formate, glucose, glutathione, hippurate, oxalate, porphyrins, purine nucleotides, proteins, sarcosine, and serine (Hall, 1998). Two current hypotheses regarding the mechanism responsible for glycine depletion in obesity are that (1) obesity-related oxidative stress drives an increase in the rate of glutathione synthesis, leading to glycine depletion; and (2) obesity-driven acyl-CoA accumulation stimulates higher rates of acyl-glycine conjugation as a means of relieving mitochondrial substrate stress (Floegel et al., 2013). However, rates of glutathione synthesis are sharply reduced in patients with type 2 diabetes compared to non-diabetic controls (Sekhar et al., 2011), and urinary acyl-glycine levels are reduced in ZFRs and overweight humans compared to lean controls (Glynn et al., 2015; White et al., 2016). Thus, it is likely that other mechanisms account for glycine depletion in obesity.
Five recent genome-wide association studies (GWASs) found that circulating glycine levels are strongly associated with variants in the gene encoding carbamoyl phosphate synthase 1 (CPS1) (Demirkan et al., 2015; Hartiala et al., 2016; Matone et al., 2016; Mittelstrass et al., 2011; Xie et al., 2013), the rate-limiting enzyme in the urea cycle. Importantly, the rs715 CPS1 variant, which is associated with lower levels of urea cycle intermediates and elevated glycine, is also significantly associated with protection from coronary artery disease (Hartiala et al., 2016). These findings suggest that the glycine-CPS1 association and obesity-related glycine depletion may be linked through maintenance of nitrogen balance, but this idea has not been tested experimentally.
Herein, we investigated the underlying causes of glycine depletion in obesity and tested the metabolic impact of feeding a glycine-supplemented diet to ZFRs. Our findings are consistent with a model in which the obesity-associated increase in BCAA levels activates a glycine-depleting, inter-organ pyruvate-alanine shuttle in an effort to dispose of excess NH3 generated by BCAA transamination.
RESULTS
Association of Glycine with Genetic Components of Nitrogen Balance
To broaden our understanding of the factors regulating glycine metabolism, we carried out a GWAS of plasma glycine levels in 1,381 subjects of European-American descent from a large cardiovascular cohort referred for cardiac catheterization (CATHGEN) (Kraus et al., 2015). In agreement with prior reports (Demirkan et al., 2015; Hartiala et al., 2016; Mittelstrass et al., 2011; Wang-Sattler et al., 2012; Xie et al., 2013), we found 14 single-nucleotide polymorphisms (SNPs) in a region of chromosome 2, within and downstream of the 3′ UTR of the CPS1 gene, that meet the genome-wide significance threshold (p < 5 × 10⁻⁸) for associations with glycine (Figures 1A and 1B). No variants in any other region approached genome-wide significance (Figure 1A).
Figure 1. Association of Glycine with Genetic and Metabolic Components of NH3 Balance.

(A) Genome-wide Manhattan plot of the association of single-nucleotide polymorphisms (SNPs) with plasma glycine levels. The y axis shows the strength of association (−log10 p values), and the overall genome-wide significance threshold (p = 5 × 10⁻⁸) is represented by a red line.
(B) LocusZoom plot of the region on chromosome2 containing SNPs with genome-wide significant associations with plasma glycine. Colors indicate R2 for individual SNPs with the lead SNP rs4673546 (in purple). See also Figure S1.
(C) Heatmap showing correlations for 26 metabolites associated with glycine (FDR-adjusted p value < 0.01) in skeletal muscle samples from our previous BCAA restriction study in which Zucker lean rats (ZLRs) and Zucker fatty rats (ZFRs) were fed either a standard chow or 45% BCAA-restricted diet (White et al., 2016).
(D) Working model showing potential relationship between glycine and BCAA-derived NH3. Metabolites shown in blue and red are positively and negatively correlated with glycine in muscle, respectively. Insert shows relative mRNA expression of key enzymes in skeletal muscle compared to their expression in liver from ZFR.
Data are expressed as mean ± SEM, n = 5. ALAT2, alanine aminotransferase 2; BCAT, branched-chain aminotransferase; GS, glutamine synthetase; SDH, serine dehydratase; SHMT, serine-hydroxymethyltransferase.
The lead SNP in our study, rs4673546 (p = 7.8 × 10⁻²⁰), was found to be positively associated with glycine, as observed in a prior study of the KORA cohort (Mittelstrass et al., 2011). The 14 SNPs identified in our study comprised six linkage disequilibrium (LD) blocks that represented three multi-SNP LD blocks and three single SNPs (Figure S1A). To provide further insight into metabolite networks underlying the association of these SNPs with glycine, we identified lead SNPs from each of the six LD blocks and tested them for association with 57 other amino acid and acyl-carnitine metabolites. Only two SNPs were found to have associations with metabolites other than glycine. Our overall lead SNP, rs4673546, was positively associated with serine (p = 4.6 × 10⁻⁴), whereas rs2371030, which is negatively associated with glycine (p = 1.9 × 10⁻⁸), was found to be positively associated with the short-chain acyl-carnitine methylmalonyl/succinyl carnitine (ci4/C4-DC; p = 0.0019). Similar to previous reports of glycine-associated SNPs (Hartiala et al., 2016; Mittelstrass et al., 2011), we found larger effect size estimates in females than in males for all 14 SNPs and smaller p values for association in females for 10 of the 14 SNPs, despite a greater proportion of males in the study population (Figure S1B).
In an effort to fine-map the region, we next imputed genotypes for untyped variants within a 119-kb region spanning the 14 identified SNPs. From 166 imputed polymorphic SNPs, we identified 40 SNPs with genome-wide significant associations with glycine (Figure S1C). The most significantly associated SNP was rs715 (p = 4.6 × 10⁻²⁹), whereas rs4673546 ranked third (Figure S1C). All imputed genotypes fell into one of the three original multi-SNP LD blocks with the exception of rs715, which was only in moderate LD with the previously identified blocks. We therefore tested rs715 for association with additional metabolites and found it to be positively associated with serine (p = 1.7 × 10⁻⁴) and negatively associated with the fatty acid oxidation intermediate 3-hydroxy-hexadecanoyl/tetradecanoyl carnitine (C16-OH/C14-DC; p = 0.003).
Association of Glycine with Metabolites in the Pyruvate-Alanine Shuttle
In addition to GWAS, we also performed a correlation analysis using log-transformed skeletal muscle metabolite data to gain deeper insight into the glycine-related metabolite network. We used data from our previously reported study of BCAA restriction (White et al., 2016) to identify metabolites that tracked specifically with glycine, given the strong effects of both the genotypes (Zucker lean rats [ZLRs] versus ZFRs) and the diets (chow versus BCAA-restricted chow) on skeletal muscle glycine levels observed in this study. A heatmap of correlations for 26 metabolites associated with glycine (those meeting false discovery rate [FDR]-adjusted p value < 0.01) is displayed in Figure 1C. In addition to the anticipated strong inverse association of glycine with BCAA (leucine/isoleucine r = −0.48, p = 0.0005 and valine r = −0.46, p = 0.001) and even-chain acylcarnitines (r = −0.67, p < 0.0001 for C16) and the positive association with serine (r = 0.7, p < 0.0001), we found that alanine, which is generated by transamination of pyruvate to help export NH3 out of skeletal muscle, was the amino acid with the strongest inverse association with glycine (r = −0.50, p < 0.0003). In addition, the organic acid α-ketoglutarate (α-KG), which acts as a nitrogen acceptor in transamination reactions, including BCAA transaminase (BCAT)-catalyzed reactions, had a strong positive association with glycine (r = 0.44, p = 0.0014; Figure 1C).
Together, these genetic and metabolomics data highlight an association of glycine with nitrogen balance. In light of our previous observation that BCAA restriction raises glycine levels (White et al., 2016), we hypothesized that the transamination step catalyzed by BCAT could be a key component of this response. BCAT is expressed at high levels in skeletal muscle and functions to transfer NH3 from BCAA to α-KG to form glutamate, which in turn drives transamination of pyruvate to alanine in muscle to facilitate NH3 export to liver. An important source of pyruvate for this pathway in the obese insulin-resistant setting could be glycine, which can be converted readily to pyruvate by the combined actions of serine-hydroxymethyltransferase (SHMT) and serine dehydratase (SDH) (Figure 1D). Importantly, we find that skeletal muscle expresses levels of SHMT and SDH similar to those found in liver (Figure 1D). An additional benefit of activating this pathway lies in the NH4 generated by the SDH reaction, which can be used in the glutamine synthetase (GS) reaction to convert glutamate to glutamine, a second major route of NH3 export (Figure 1D). By these mechanisms, one molecule of glycine can provide intermediates for two distinct pathways that export two molecules of BCAA-derived NH3. Thus, we hypothesized that the inverse relationship between elevated BCAA and low glycine levels in obesity could be explained by intense utilization of glycine to support the pyruvate-alanine cycle and glutamine production in order to transfer BCAA-derived NH3 from skeletal muscle to the liver (Figure 1D).
Indeed, tracing of N15 distribution kinetics in plasma, skeletal muscle (a site of high BCAT activity), and liver (a site of low BCAT activity) following administration of a bolus of [U-13C,15N] M+6 valine to lean Wistar rats supports our alanine-centric model by showing that BCAA-derived NH3 is rapidly distributed to form M1 isotopomers of alanine, glutamate, and aspartate in skeletal muscle, with significant labeling of M1 alanine in the plasma pool (Figure 2). Labeling of these pools in hepatic tissue was negligible, as expected based on low levels of BCAT expression in liver. We note that while our mass spectrometry (MS)-based approach cannot differentiate between labeled nitrogen and carbon, it is highly unlikely that the M+1 labeling of alanine, aspartate, and glutamate is derived from the 13C-labeled carbon skeleton of valine. In the initial step of BCAA catabolism, nitrogen is removed from 15N/13C-labeled valine and directly transferred to α-KG to form 15N-labeled glutamate, which can then be converted to alanine or aspartate by alanine aminotransferase and aspartate aminotransferase (AST), respectively. In contrast, 13C-labeled valine and ketoisovalerate (KIV) carbon skeletons are not directly used to synthesize alanine, aspartate, or glutamate. Rather, the carbon in alanine is derived from pyruvate in a reaction catalyzed by alanine transaminase that uses the 15N-label from glutamate as the nitrogen donor, but not the labeled carbons. Supporting this interpretation, a recent study demonstrated that labeling of glucose, lactate, and glutamine from an extended (>2 h) infusion of 13C valine into mice was negligible (Neinast et al., 2019). Also, we see negligible appearance of isotopomers other than M+1 that might be derived from 13C labeling of alanine, aspartate, or glutamate (Figure S2; Data S1).
Figure 2. Valine Tracing in Skeletal Muscle, Liver, and Plasma.

(A) Labeling scheme depicting the transfer of labeled carbon (in green) and nitrogen (in blue with yellow highlight), from valine to KIV, glutamate, aspartate, and alanine pools in lean Wistar rats that received an intraperitoneal injection of 100 mg/kg [U-13C, 15N]valine (i.e., M+6).
(B–F) N15- and C13-label enrichment data in plasma (red), skeletal muscle (blue), and liver (yellow) for valine, α-ketoisovalerate (KIV), glutamate, aspartate, and alanine.
Data are expressed as mean ± SEM, n = 3 rats per time point. See also Figure S2 and Data S1.
Glycine Is a BCAA-Responsive Carbon Source for Alanine Synthesis In Vivo
To directly test whether glycine serves as a carbon source for the proposed NH3 disposal pathway, we performed a primed continuous infusion of [U-13C]-labeled (M+2) glycine in unrestrained conscious ZFRs and measured 13C labeling of the M+2 forms of plasma glycine, serine, pyruvate, and alanine (Figure 3A). In line with our model, M+2 isotopomers of serine, pyruvate, and alanine were detected in plasma within 10 min of the initiation of the glycine infusion and continued to rise thereafter (Figure 3A). Enrichment of the glycine and alanine pools reached near steady state after 60 min of infusion, whereas enrichment of serine and pyruvate were still rising at that time point (Figure 3A). To test whether BCAA directly influence carbon flow through this pathway, we began a valine infusion 90 min after the start of the glycine infusion. Valine infusion caused no change in glycine enrichment and no significant change in M+2 labeling of serine or pyruvate from 13C-labeled glycine (Figures 3A and S3A). However, we observed a sharp increase in the M+2 enrichment of the alanine pool in the 30-min period immediately following the onset of the valine infusion (Figure 3A). This amounted to a 10-fold increase in labeling of alanine when we compared the slope for the 30-min immediately prior to (60–90) and after (90–120) initiation of the valine infusion (p < 0.05; Figure 3B).
Figure 3. Glycine Is Used for Alanine Synthesis in a BCAA-Regulated Manner.

(A) M+2 enrichment data from primed continuous infusions of ZFRs with [U-13C] glycine for 120 min and unlabeled valine co-infused with the labeled glycine beginning at T (= 90 min (shaded in gray). The schematic summary above the graphs depict the transfer of labeled carbon (black with green highlight), from glycine to alanine.
(B) Slope for alanine label enrichment for the 30 min immediately prior to (60–90; white bar) and after (90–120, gray bar) the initiation of the valine infusion. Data are expressed as mean ± SEM, n = 3, *p < 0.05. Lean Wistar rats were treated with the BCAT inhibitor LY3351337 (10 mg/kg) or vehicle (CTL) once daily for 3 days via intraperitoneal (IP) injection. The final dose was administered 1 h prior to tissue and plasma harvest.
(C) Plasma amino acids (AA).
(D) Skeletal muscle (Skm) amino acids.
(E) Liver amino acids.
(F) Skeletal muscle organic acids (OA).
(G) Liver organic acids (OA).
All data are expressed as mean ± SEM, n = 8 animals per group. *p < 0.05, **p < 0.01, and ***p < 0.001. See also Figure S3.
Together these data demonstrate that glycine is employed in vivo as a carbon source for generating alanine via sequential conversion to serine and pyruvate and that utilization of glycine in this pathway is directly influenced by BCAA supply.
BCAT Inhibition Raises Circulating Glycine Levels in Lean Rats
To determine whether the transamination of BCAA by BCAT directly influences glycine abundance in vivo, we next employed LY3351337, a BCAT inhibitor that has a half-life of 5.1 h in male rats and displays similar potency toward purified BCAT1 (half maximal inhibitory concentration, IC50 2.1 nM) and BCAT2 (IC50 1.7 nM) in vitro. LY3351337 does not influence the activity of other transaminases such as alanine aminotransferase (ALAT) or AST (unpublished data).
Inhibiting BCAT, the first step of BCAA catabolism, in lean Wistar rats for 3 days with 10 mg/kg LY3351337 did not affect food intake or body weight (Figure S3B) but increased plasma BCAA levels by ∼2.5-fold compared to vehicle-treated rats (Figure 3C). This was accompanied by a significant reduction in plasma levels of the nitrogen acceptors alanine and glutamate/glutamine, but not aspartate/asparagine, or the urea cycle intermediates ornithine, citrulline, or arginine in the LY3351337-treated group. Importantly, these effects occurred concomitant with a significant increase in plasma glycine (p < 0.05, Figure 3C). Thus BCAA transamination exerts an influence over circulating glycine levels even in lean healthy animals.
In skeletal muscle, a tissue with high levels of BCAT expression and activity (Hutson et al., 1992), LY3351337 treatment of lean rats raised BCAA levels and lowered levels of alanine and glutamine/glutamate, consistent with what we observed in plasma (Figure 3D). There was also an effect to lower aspartate/asparagine in these tissues. However, tissue glycine levels were unchanged. In liver, a tissue with little to no BCAT activity (Hutson et al., 1992), LY3351337 treatment was also associated with higher levels of the BCAAs and lower alanine, but levels of glutamate/glutamine, aspartate/asparagine, or other amino acids were unchanged (Figure 3E). There was no effect of BCAT inhibition on lactate, pyruvate, or α-KG levels in skeletal muscle (Figure 3F). However, liver lactate levels were lower in LY3351337-treated rats (Figure 3G). Effects of LY3351337 on amino acid and organic acid levels in kidney, another tissue with high BCAT activity (Hutson et al., 1992), mirrored those in skeletal muscle (Figures S3C and S3D). These data show that in lean rats, inhibition of BCAA transamination increases the plasma glycine pool but does not impact tissue glycine levels. The experiment also demonstrates that BCAA influence tissue and circulating glutamate/glutamine and alanine pools. Consistent with our N15-tracing experiment in Figure 2, we also observed effects on the tissue asparagine/aspartate pool that were not reflected in the circulation.
BCAT Inhibition Raises Plasma and Tissue Glycine in Obese Rats
To further test the inter-relationships among BCAA and related metabolites in the setting of obesity, where BCAA levels are spontaneously increased (White et al., 2016), we next treated ZFRs for 10 days with LY3351337. This treatment lowered weight gain and food intake during the study period (Figures 4A and 4B). As commonly observed with interventions that lower weight gain, these effects of LY3351337 were accompanied by improved glucose and insulin excursions during an intraperitoneal glucose tolerance test (Figures 4C and 4D). LY3351337 treatment had a much more pronounced effect on circulating BCAA levels in ZFRs compared to lean rats. Indeed, in ZFRs, LY3351337 caused a 12-fold increase in leucine/isoleucine and a 6-fold increase in valine levels (p < 0.001; Figure 4E). This effect occurred absent any change in plasma branched-chain alpha-ketoacid (BCKA) levels (Figure S4A). As observed in lean rats, treatment of ZFRs with LY3351337 also prompted a >50% reduction in the plasma alanine (p < 0.01) and glutamate/glutamine (p < 0.05) pools (Figure 4E) without altering levels of aspartate/asparagine or the urea cycle intermediates in circulation. Importantly, LY3351337 treatment of ZFRs also led to a 3-fold rise in circulating glycine (p < 0.001; Figure 4E). This was associated with an increase in plasma serine levels (p < 0.01; Figure 4E), an effect not observed in lean rats.
Figure 4. Effect of BCAT Inhibition on Nitrogen Handling and Glycine in ZFR.

14 week-old ZFR (fa/fa) were treated with the BCAT inhibitor LY3351337 (10 mg/kg) or vehicle (CTL) once daily for 10 days via IP injection. The final dose of LY3351337 was administered 1 h prior to tissue and plasma harvest.
(A) Body weight.
(B) Daily food intake.
(C) Glucose excursion during a 1g/kg intraperitoneal glucose tolerance test.
(D) Insulin excursion during a 1g/kg intraperitoneal glucose tolerance test.
(E) Plasma amino acids (AA).
(F) Skeletal muscle (Skm) amino acids.
(G) Skeletal muscle (Skm) organic acids (OA).
(H) Liver organic acids (OA).
(I) Model of BCAA-driven glycine depletion. Metabolites lowered by LY3351337 treatment are shown in red whereas metabolites increased by LY3351337 treatment are shown in blue. ALAT, alanine aminotransferase 1/2; ARG1, arginase 1; ASL1, argininosuccinate lyase ASL1, argininosuccinate synthase 1; BCAT, branched-chain aminotransferase; CPS1, carbamoyl phosphate synthase 1; OTC, ornithine transcarbamylase.
All data are expressed as mean ± SEM, n = 7 animals per group. *p < 0.05, **p < 0.01, and ***p < 0.001. See also Figure S4.
The effect of BCAT inhibition was also more striking in skeletal muscle of obese compared to lean rats (Figure 4F). In addition to causing a strong rise in tissue BCAA levels, LY3351337 treatment of ZFRs caused an 80% decrease in the alanine, glutamate/glutamine, and aspartate/asparagine pools (Figure 4F). Interestingly, BCAT inhibition also lowered levels of the urea cycle intermediates ornithine, citrulline, and arginine in skeletal muscle of ZFRs (Figure 4F), an effect not observed in lean rats (Figure 3D). These effects were accompanied by an increase in skeletal muscle glycine content (p < 0.05). These data demonstrate that in addition to making major contributions to alanine, glutamate/glutamine, and aspartate production, BCAA-derived NH3 can also contribute to formation of urea cycle intermediates in the skeletal muscle. This only occurs in the setting of obesity, where BCAA levels are elevated and disposal in other tissues such as adipose tissue is impaired, suggesting the presence of skeletal muscle-intrinsic urea cycle activity. Supporting this idea, we detected mRNA expression of all urea cycle genes in skeletal muscle, albeit at a much lower level than found in liver (Figure S4B).
In liver, the LY3351337-mediated rise in hepatic BCAA content (p < 0.001; Figure S4C) was also paralleled by decreases in alanine (p < 0.01) and aspartate/asparagine (p < 0.001) and increased glycine levels (p < 0.05). As observed in lean rats, hepatic levels of glutamate/glutamine and the urea cycle intermediates were unchanged (Figure S4C).
In ZFRs, BCAT inhibition resulted in a 3-fold increase in skeletal muscle pyruvate content (p < 0.001; Figure 4G), in parallel with lowering of lactate and pyruvate content in liver (Figure 4H) and elevations in the levels of hepatic α-KG (p < 0.05). This result is consistent with a model in which BCAT inhibition leads to reduced pyruvate-alanine shuttle flux in skeletal muscle, resulting in higher levels of pyruvate in muscle and reduced alanine supply to the liver, resulting in lower flux though alanine aminotransferase (ALAT), a reaction that produces pyruvate and glutamate from alanine and α-KG (Figure 4I).
Glycine Supplementation Alters Skeletal Muscle NH3 Pools in ZFR
Collectively, the results of our BCAT inhibitor experiments summarized in Figures 3 and 4 and our stable isotope tracing studies in Figures 2 and 3 support a model wherein BCAA-derived NH3, after transfer to α-KG to form glutamate, has several distal fates in skeletal muscle. First, it can be used for transamination of pyruvate to form alanine. Second, amidation of glutamate with free NH4 in the glutamate synthetase (GS) reaction forms glutamine, which can also readily leave the muscle tissue. Third, it can be used to form aspartate via transamination of oxaloacetate by AST. Fourth, in the setting of obesity, it can fuel skeletal muscle urea cycle activity via metabolism of aspartate by the urea cycle enzyme argininosuccinate synthase (ASS) or via generation of free NH4 from glutamate dehydrogenase (GDH)-mediated deamidation of glutamate, which subsequently enters the urea cycle through CPS1 (Figure 4I).
Based on these observations, we hypothesized that glycine supplementation of ZFR would result in reduced skeletal muscle urea cycle activity due to shunting of BCAA-derived NH3 into alanine and glutamine and away from glutamate and aspartate. To test this hypothesis, we fed ZFRs for 9 weeks with a standard chow diet or a glycine-supplemented chow diet that contained 150% more glycine than the standard chow diet (Table S1). Feeding ZFRs the glycine-supplemented diet led to a 50% increase in circulating glycine (p < 0.001) but had no impact on plasma levels of other amino acids (Figure 5A). Weight gain, food intake, activity levels, and metabolic rate were also unaffected by the glycine-supplemented diet (data not shown).
Figure 5. Glycine Supplementation Alters Skeletal Muscle Nitrogen Handling in ZFR.

Six-week-old male ZFRs (fa/fa) were fed a custom control diet (CHOW) or a glycine-supplemented diet (GLY) for 10 weeks.
(A) Amino acid concentrations measured in whole blood.
(B) Skeletal muscle (Skm) amino acids (AA).
All data are expressed as mean ± SEM, n = 10 animals per group. *p < 0.05, **p < 0.01, and ***p < 0.001. See also Table S1.
In skeletal muscle, dietary glycine supplementation raised glycine (p < 0.001) and serine (p < 0.05) levels (Figure 5B), consistent with rapid interconversion of glycine to serine by SHMT. Importantly, glycine supplementation also led to a significant decrease in BCAA levels and a robust lowering of the urea cycle intermediates ornithine (p < 0.01), citrulline (p < 0.05), and arginine (p < 0.05) (Figure 5B). These data demonstrate that glycine availability influences skeletal muscle NH3 trafficking.
Dietary Glycine Enhances Acyl-Glycine Excretion and Lowers Circulating Triglycerides in HF-Fed ZFRs
We have previously demonstrated that feeding ZFRs a BCAA-restricted diet increases muscle glycine levels and lowers muscle acyl-CoA levels while promoting excretion of acetyl-glycine in the urine. These data suggest that glycine availability directly affects acyl-CoA accumulation in muscle (White et al., 2016). Here, we tested the idea that increasing glycine levels by dietary supplementation could be a strategy for overcoming lipid overload. We fed ZFR a high-fat (HF) diet or a HF-diet supplemented with glycine (HFG) to 150% of the level in the HF diet (Table S1). Over a 9-week feeding period, weight gain and food intake (Figure 6A) were not different in ZFRs fed the HF or HFG diets. As observed in chow-fed ZFRs, glycine supplementation raised circulating glycine levels (p < 0.001; Figure 6B) without affecting other plasma amino acids (Figure S5A). Consistent with our hypothesis, feeding ZFRs the HFG diet significantly increased urinary content of the three most abundant acyl-glycine species, C2 acetyl-glycine (p < 0.05)), C5 isovaleryl/2-methylbutyrylglycine (p < 0.001), and C4/Ci4 butyryl/isobutyryl-glycine (p < 0.01; Figure 6C). There was no effect of glycine supplementation on C6 hexanoyl-glycine excretion, which may reflect a chain-length preference of the glycine acyltransferase (GLYAT) enzyme, reminiscent of that reported for carnitine acyl-transferase (CrAT) (Seiler et al., 2014). In addition to raised urinary acyl-glycine excretion, HFG-fed ZFRs showed a reduction in circulating triglycerides compared to animals fed the non-supplemented HF diet (p < 0.05; Figure 6D). Plasma cholesterol, non-esterified fatty acids (NEFAs), glycerol, and ketones were not different in ZFRs fed the two diets (data not shown).
Figure 6. Effect of Glycine Supplementation on Metabolic Parameters in HF-Fed ZFRs.

Six-week-old male ZFRs (fa/fa) were fed a custom high-fat (HF) diet or a glycine-supplemented HF diet (HFG) for 10 weeks.
(A) Body weight and food intake.
(B) Glycine concentrations measured in whole blood.
(C) Urinary acyl-glycine content.
(D) Plasma triglycerides (TG).
(E) Liver even chain acyl-CoAs.
(F) Skeletal muscle (Skm) even chain acyl-CoAs.
(G) Skeletal muscle mitochondrial free carnitine.
(H) Skeletal muscle hydroxy (OH)/dicarboxyl (DC) acylcarnitines (ACs).
(I) Respiratory exchange ratio (RER) measured by indirect calorimetry, gray area corresponds to the dark phase.
(J) Glucose excursion during a 1g/kg intraperitoneal glucose tolerance test.
(K) Insulin excursion during a 1g/kg intraperitoneal glucose tolerance test.
All data are expressed as mean ± SEM. There were n = 10 and n = 9 animals per group for the HF and HF+GLY groups, respectively. *p < 0.05, **p < 0.01, and ***p < 0.001. See also Figure S5 and Table S1.
Divergent Effects of Dietary Glycine on Fatty Acid Metabolism in Liver and Muscle
We next examined the impact of glycine supplementation on intermediates of fatty acid oxidation in liver and skeletal muscle of HF-fed ZFRs. We observed significantly reduced levels of acetyl-CoA (p < 0.05) and butyryl CoA (p < 0.001) in liver of ZFR fed the HFG diet, accompanied by a significant reduction in levels of decanoyl CoA (p < 0.05). However, we observed no change in hepatic long-chain acyl-CoA in response to glycine supplementation (Figure 6E). These data align with our observation of higher rates of urinary excretion of short chain acyl-glycines (Figure 6C), and suggest that glycine supplementation improves clearance of short and medium-chain, but not long-chain acyl-CoAs in liver.
In contrast, HFG feeding caused an increase in levels of long and very long even-chain acyl-CoAs in skeletal muscle absent any change in short-chain acyl-CoAs (Figure 6F). This occurred in concert with an increase in free carnitine (Figure 6G) and a decrease in a wide array of even-chain hydroxy/dicarboxyl acyl-carnitines, which are intermediates of beta-oxidation (Figure 6H). This profile suggests that glycine supplementation impairs conversion of fatty acyl-CoA metabolites to acylcarnitines in skeletal muscle, thus slowing fatty acid oxidation. Accordingly, HFG-fed ZFRs displayed an increase in RER relative to HF-fed ZFRs (Figure 6I), indicative of lower rates of fatty acid oxidation. We also observed decreased phosphorylation of 5’ adenosine monophosphate-activated protein kinase (AMPK) on Thr172 in muscle (FigureS5B). Oxygen consumption and heat production were not affected by the diets (Figure S5C). However, there was a trend for increased lactate levels (p = 0.08; Figure S5D) in HFG-fed ZFRs, consistent with the effect of dietary glycine supplementation to increase RER.
In addition to these effects on fatty acid metabolites, glycine supplementation on the HF-diet background also lowered levels of the urea cycle intermediate arginine in skeletal muscle and tended to lower ornithine (p = 0.054; Figure S5E). However, there was no effect on skeletal muscle lactate, pyruvate, α-KG, fumarate, citrate, succinate, or malate (Figure S5F). Since glycine conjugation with arginine is the primary step in creatine synthesis, and elevated levels of skeletal muscle phospho-creatine is a mechanism that could explain our finding of impaired fatty acid oxidation via inhibition of AMPK, we also measured skeletal muscle creatine, phospho-creatine, and ATP content (Figure S5G), as well as levels of guanidinoacetate (Figure S5H), the primary metabolite formed by conjugation of glycine and arginine. The HFG diet had no effect on the levels of any of these intermediates in skeletal muscle.
Glycine Repletion Does Not Improve Glucose Intolerance in HF-Fed ZFRs
To determine the effect of the HFG diet on systemic glucose handling in ZFRs, we carried out a glucose tolerance test (GTT). Here, we observed that feeding of the HFG diet did not improve glucose tolerance and in fact resulted in a significant increase in glucose excursion at one time point (90 min, p < 0.05) compared to ZFRs fed the HF diet (Figures 6J and 6K). There were no differences in insulin levels between the groups during the GTT (Figure 6K). Taken together, the data in Figures 6J and 6K provide clear evidence that dietary supplementation of HF diet with glycine does not improve glucose disposal in ZFRs.
DISCUSSION
Our findings provide insight into the long-standing enigma of obesity-related glycine depletion (Felig et al., 1969; Newgard et al., 2009; Kraus et al., 2016). We propose that the obesity-related increase in skeletal muscle BCAA flux through BCAT activates the pyruvate-alanine cycle and glutamine generation as mechanisms for removal of excess BCAA-derived NH3 from skeletal muscle (Figure 1D). Our model further holds that BCAA-driven activation of the pyruvate-alanine cycle creates a pull on glycine and serine to replenish pyruvate via the SHMT and SDH reactions, leading to the fall in glycine levels. This proposal is congruent with early work on the influence of various amino acids on skeletal muscle alanine release (Garber et al., 1976). Our NH3 buffering model of obesity-related glycine depletion is based upon five key experimental observations reported here: (1) glycine is inversely associated with alanine and BCAA and positively associated with serine and α-KG in skeletal muscle of Zucker rats (Figure 1); (2) infusion of 13C-labeled glycine leads to appearance of label in serine, pyruvate, and alanine pools, and co-infusion of valine causes a rapid and robust increase in alanine labeling (Figure 3); (3) BCAT inhibition raises glycine and serine levels while coordinately affecting intermediates of both the pyruvate-alanine and urea cycles (Figures 3 and 4); (4) dietary supplementation of glycine diverts NH3 away from skeletal muscle aspartate formation and urea cycle intermediates (Figure 5); and (5) studies with 15N valine summarized in Figure 2 show robust enrichment of 15N alanine in skeletal muscle.
We note that the glycine-SHMT-SDH pathway seems tailored to facilitate BCAA-derived NH3 export. First, it is efficient. By providing both the pyruvate carbon skeleton that can be transaminated to alanine as well as free NH4 that can be used to convert glutamate to glutamine, each molecule of glycine can be used to export two molecules of NH3 from skeletal muscle (Figure 1D). Second, it is present in the right location. Both SHMT and SDH are present in the mitochondria, where they are co-localized with the mitochondrial isoform of branched-chain aminotransferase (BCATm or BCAT-2), the primary BCAT isoform in skeletal muscle. Finally, the glycine-SHMT-SDH pathway is sensitive to nitrogen load. NH4 is an allosteric activator of SDH (Chen et al., 2012; Holzer et al., 1964), and levels of SDH protein are upregulated by dietary protein content (Anderson et al., 1968; Ogawa et al., 1991), specifically by leucine (Zhong et al., 2007). Together, these observations provide additional support for the model developed herein.
In addition to developing a new model to explain glycine depletion, we also tested the hypothesis that glycine supplementation would improve glucose and lipid handling in HF-fed ZFRs by preventing accumulation of fatty acid metabolites, analogous to the salutary effects of carnitine supplementation or BCAA restriction in obesity models (Makowski et al., 2009; Muoio et al., 2012; Noland et al., 2009; White et al., 2016). The idea was shown to be partially correct in that glycine supplementation raised acyl-glycine excretion and decreased short- and medium-chain acyl-CoAs in the liver of HF-fed ZFRs while also lowering circulating triglycerides. However, we also observed increases in a subset of long-chain acyl-CoA species and decreased long-chain acyl-carnitine concentrations in skeletal muscle, which when coupled with observations of increased free carnitine and increased RER, suggest that glycine supplementation impairs fatty acid utilization by blunting mitochondrial import at the carnitine palmitoyl-transferase 1 (CPT1) step.
How can the unexpected findings from our glycine supplementation studies be reconciled with our prior report of an effect of dietary BCAA restriction to restore muscle glycine levels and improve insulin sensitivity while enhancing fatty acid oxidation and muscle glucose disposal (White et al., 2016)? A key difference between our prior BCAA restriction studies and the current glycine supplementation studies, both performed in ZFRs, is that the BCAA restriction experiments caused a sharp decrease in circulating BCAA to levels found in ZLR control animals, whereas glycine supplementation did not. Thus, although glycine supplementation helps to relieve nitrogen accumulation in skeletal muscle of ZFRs and enhances excretion of acyl-glycine adducts, it does not alter metabolism of the large pool of BCAA. Rather it enhances BCAA-derived NH3 export to the liver in the form of the gluconeogenic amino acids alanine and glutamine, likely contributing to increased hepatic glucose production.
In addition, we show that glycine supplementation has a unique effect to decrease the phosphorylation state/activity of AMPK, which is expected to result in less phosphorylation and increased activity of acetyl-CoA carboxylase (ACC), leading to increased levels of malonyl CoA and inhibition of CPT1. The urea cycle enzyme ASS has been reported to stimulate fatty acid oxidation in liver by producing AMP in close proximity to AMPK (Madiraju et al., 2016). Here, we demonstrate that glycine supplementation lowers skeletal muscle urea cycle intermediates and AMPK phosphorylation on Thr172 in concert with impairment of fatty acid oxidation, suggesting a possible role for the urea cycle in regulation of mitochondrial fuel selection in extrahepatic tissues such as skeletal muscle. Future studies are warranted to test this possibility.
Although our model provides a seemingly relevant physiological context for the GWAS finding reported here and by others (Demirkan et al., 2015; Hartiala et al., 2016; Matone et al., 2016; Xie et al., 2013) of the strong association of glycine levels with SNPs in and downstream of the 3′ UTR of the CPS1 gene, it remains unclear how these SNPs actually regulate glycine levels. It also remains to be demonstrated that CPS1 expression or activity is altered by these SNPs. It is plausible that variants impacting the activity of CPS1, the first committed step in the urea cycle, could alter the pace of alanine production in skeletal muscle for export to the liver. Evidence for such coupling of skeletal muscle alanine production to hepatic urea cycle activity is present in patients with chronic hepatic insufficiency, where hyperammonemia resulting from impaired hepatic NH3 handling is associated with low plasma alanine levels and low alanine release from skeletal muscle (Ganda and Ruderman, 1976). Consistent with this model, individuals harboring the rs715 SNP in the GeneBank cohort were found to have low plasma levels of urea cycle intermediates and elevated plasma levels of glycine (Hartiala et al., 2016). However, an equally plausible explanation may be that elevations in free NH4 resulting from low CPS1 activity cause feedback inhibition on the glycine cleavage system, which generates NH4 while degrading glycine. Future studies are warranted to investigate these possibilities.
In conclusion, we identify mechanistic links among obesity-driven increases in BCAA, reduced glycine levels, perturbations in lipid metabolism, and the development of insulin resistance. Our data support a role for glycine as a key substrate for driving the pyruvate-alanine cycle to remove excess NH3 generated by obesity-associated increases in BCAA transamination in skeletal muscle. Importantly, while restoration of a normal muscle glycine pool likely contributes to the improvement in insulin sensitivity observed in response to BCAA restriction as we have previously reported (White et al., 2016), the current findings suggest that dietary glycine supplementation alone, which fails to lower elevated levels of BCAA, is unlikely to be an effective therapeutic intervention for obesity-related cardiometabolic diseases.
STAR ⋆METHODS
Detailed methods are provided in the online version of this paper and include the following:
RESOURCE AVAILABILITY
Lead Contact
Further information and requests for resources and reagents should be directed to and will be fulfilled by the Lead Contact, Christopher B. Newgard (chris.newgard@duke.edu).
Materials Availability
This study did not generate any new unique reagents.
Data and Code Availability
This study did not generate any unique dataset or code.
EXPERIMENTAL MODEL AND SUBJECT DETAILS
Glycine GWAS
A sequential cohort of 2022 subjects was selected from the CATHGEN biorepository of cardiac catheterization patients at Duke University (Durham, NC) (Shah et al., 2010). Blood was obtained from participants’ femoral artery after a minimum of six hours fasting, immediately processed to separate plasma, and frozen at −80°C. All CATHGEN participants provided informed, written consent for participation in the CATHGEN biorepository at the time of enrollment. The Duke Institutional Review Board (IRB) approved the CATHGEN biorepository. The Illumina Human Omni1-Quad Infinium Bead Chip (Illumina, San Diego, CA, USA) was used for genotyping following the manufacturer’s protocol using 200 nanograms of DNA. Genotypes were called using Illumina’s GenomeStudio software. SNPs were removed for having a low call frequency (< 98%), minor allele frequency < 0.01, or Hardy-Weinberg disequilibrium (p < 10−6), yielding 771,341 autosomal SNPs for analysis. Subjects were excluded if they were of non-European-American ancestry, had < 98% call rate for all SNPs, mismatched between clinical and genotypic gender, or were related to other included samples. The final analysis set included 1381 subjects (921 males, 460 females) with a mean (sd) age of 63.1 (11.6) years. Genotypes were imputed using Impute2 (Howie et al., 2009), applying Phase 1 data from the 1000 Genomes Project (Auton et al., 2015) as a reference panel and restricting to SNPs present in HapMap (Frazer et al., 2007).
Animal Studies
All procedures were approved and carried out in accordance with regulations set forth by the Duke University Institutional Animal Care and Use Committee. Male rats were obtained from Charles River Laboratories, individually housed in a 12 hour light:dark cycle with ad libitum access to food and water, and acclimated for two weeks to the custom control low fat (LF) diet used in our prior study (White et al., 2016) (A11072001, Research Diets, New Brunswick, NJ).
For glycine tracing studies, seven days prior to the tracing experiments, 13 week-old male Zucker-fatty rats (ZFR) were anesthetized with 2% isoflurane (Butler Schein, Dublin OH), and polyethylene catheters were aseptically placed in the left carotid artery (advanced to the aortic arch) or the right jugular vein as described (White et al., 2016). Primed continuous infusions were performed in conscious unrestrained animals using 1,2-13C Glycine (Cambridge Isotope Laboratories Inc), administered in sterile saline at a rate of 6 mg/kg/min for first 10 minutes followed by a 110 minute infusion at 1.2 mg/kg/min. At T = 90 minutes valine (Sigma) was co-infused with the 1,2-13C glycine for 30 minutes at a rate of 3 mg/kg/min. Blood was sampled at T = 0, 10, 30, 60, 90, 110, and 120 minutes for stable isotope-resolved metabolomics. Rats were then anesthetized with Isoflurane and euthanized.
For valine tracing studies 14 week-old lean male Wistar rats were administered a 100mg/kg bolus of 15N, U-13C Valine (Cambridge Isotope Laboratories Inc) in sterile saline via intraperitoneal injection. Plasma and tissue samples were obtained from rats euthanized by exsanguination at the indicated times following intraperitoneal administration of Nembutal (80mg/kg), and used for stable isotope-resolved metabolomics. Tissues were rapidly excised, weighed, and freeze clamped in liquid nitrogen and then stored at −80°C until further analysis.
For BCAT inhibitor studies, 14 week-old lean male Wistar rats received a daily intraperitoneal (IP) injection of LY3351337 (10mg/kg) or DMSO vehicle for 3 days. In a separate set of studies, 14 week-old male ZFR received a daily IP injection of LY3351337 (10mg/kg) or DMSO vehicle for 10 days. Plasma and tissue samples used for biochemical analyses were obtained from lean Wistar rats and ZFR on days 3 and 10, respectively. Rats were euthanized in the fed state precisely 1 hr following the administration of the final dose of LY3351337 (10mg/kg) or vehicle by exsanguination following IP administration of Nembutal (80mg/kg). Tissues were rapidly excised, weighed, and freeze clamped in liquid nitrogen and then stored at −80°C until further analysis.
For glycine supplementation studies, six week-old male ZFR from Charles River Laboratories were placed on one of four diets for 10 weeks: the custom control diet used in our prior study (White et al., 2016) (A11072001, Research Diets, New Brunswick, NJ), a glycine-supplemented diet (GLY; A13050101, Research Diets, New Brunswick, NJ)), a high fat (HF) diet (40% Kcal from fat diet; A13050102, Research Diets, New Brunswick, NJ), or a HF glycine-supplemented diet (HFG, A13050103, Research Diets, New Brunswick, NJ). In both glycine-supplemented diets, glycine content was 150% of the control diets. To ensure equal nitrogen content across diets a small amount of all other amino acids (except leucine, isoleucine, valine, phenylalanine, and tyrosine) was removed (Table S1). Food intake and weight gain were monitored weekly. A non-fasting blood sample was taken after 9 weeks on the diets at 9 am to determine the diet effect on circulating amino acid concentrations. Plasma and tissue samples used for biochemical analysis were derived from rats euthanized in the fed state at week 15 by exsanguination following IP administration of Nembutal (80mg/kg). Tissues were rapidly excised, weighed, and freeze clamped in liquid nitrogen and then stored at −80°C until further analysis.
METHOD DETAILS
Indirect Calorimetry
In the HFG diet study, indirect calorimetry was performed in a cohort of ZFR in week 8 using an eight-chamber Oxymax system (Columbus Instruments; Columbus, OH). ZFR were acclimatized to the system for 24 hr prior to measurement. Recordings were made while food and water was freely accessible. Urine was also collected from the Oxymax chambers for measurement of urinary acylglycine levels.
Glucose tolerance testing
In both the ZFR BCAT inhibitor and HFG diet studies, a 1 g/kg intraperitoneal glucose tolerance test was performed ZFR following a 16 hour fast with free access to water. Blood samples were obtained from the tail vein before the glucose injection and at the indicated time points after the glucose load. Glucose levels were measured with a BD Logic glucose meter and insulin concentrations were determined in plasma samples using a Meso Scale Discovery® mouse/rat insulin kit. For the BCAT inhibitor study in ZFR, glucose tolerance testing was carried out on day 7 of treatment 1 hour after the administration of LY3351337. For the HFG diet study in ZFR, glucose tolerance testing was carried out at week 8.
Metabolite profiling
For stable isotope-resolved metabolite profiling, plasma metabolites (20 μL) were extracted by sequential 500 μL additions of −20°C MeOH, chilled water, and chloroform. After each addition, samples were vortexed for 30 s. Frozen tissues were pulverized under liquid nitrogen using a mortar and pestle. Metabolites were then extracted using sequential 500 μL additions of −20°C MeOH, chilled water, and chloroform. After each addition, tissue lysates were processed with Tissue Lyser (QIAGEN) for 60 s at 30Hz. Plasma and tissue extracts were then centrifuged at 4°C and 14,400xg for 20 minutes and the clarified aqueous phase was transferred to a fresh Eppendorf and stored at −80°C until processing for GC-MS analysis. For GC-MS analysis, the extracted tissue and plasma metabolites were dried under N2 gas-flow at 37°C using an evaporator. Amino and organic acids were derivatized via methoximation and silylation (Ahn and Antoniewicz, 2011), metabolites were resuspended in 25 μL of methoxylamine hydrochloride (2% (w/v) in pyridine) and incubated at 40°C for 90 minutes on a heating block. After brief centrifugation, 35 μL of MTBSTFA + 1% TBDMS was added and the samples were incubated at 60°C for 30 minutes. GC-MS analysis was performed on an Agilent 7890B GC system equipped with a HP-5MS capillary column connected to an Agilent 5977A Mass Spectrometer. Mass isotopomer distributions were obtained by integration of ion chromatograms (Antoniewicz et al., 2007) and corrected for natural isotope abundances (Fernandez et al., 1996). Metabolites monitored were glycine (m/z 246–250); serine (m/z 390–394); pyruvate (m/z 174–178); alanine (m/z 260–264); valine (m/z 288–294); KIV (m/z 202–208); glutamate (m/z 432–438); and aspartate (m/z 418–423).
Amino acids were measured in whole blood, liver and gastrocnemius muscle, and organic acids, acyl-carnitine and acyl-CoA levels were measured in liver and gastrocnemius muscle by targeted mass spectrometry methods as previously described (Ferrara et al., 2008; Ronnebaum et al., 2006; Young et al., 2007). Amino acid, acyl-carnitine, acyl-CoA, acetyl-glycine, and guanidinoacetate profiling was performed by tandem mass spectrometry (MS/MS) (An et al., 2004; Ferrara et al., 2008; Newgard et al., 2009; Ronnebaum et al., 2006; Young et al., 2007). Organic acids in liver and gastrocnemius muscle samples were analyzed by gas chromatography-mass spectrometry (GS-MS) on a TRACE ISQ instrument (Thermo Electron Corporation) (Ronnebaum et al., 2006; Newgard et al., 2009). All MS analyses employed stable-isotope-dilution with internal standards from Isotec, Cambridge Isotopes Laboratories, and CDN Isotopes. A list of all internal standards used in these studies has been published previously (Ferrara et al., 2008; Newgard et al., 2009; Young et al., 2007).
Other plasma analytes were measured on a Beckman DxC600 autoanalyzer, using reagents for lactate, total cholesterol, and triglycerides from Beckman, and non-esterified fatty acids (NEFA) and ketones (total and 3-hydroxybutyrate) from Wako (Richmond, VA). Glycerol was measured using reagents modified from TG-B by Roche Diagnostics (Indianapolis, IN).
For quantitation of skeletal muscle ATP, creatine, and phospho-creatine, metabolites were extracted from 10mg of skeletal muscle in 0.5 M HClO4 (1 mM EDTA) then neutralized with 2.2 M KHCO3. ATP, Creatine and PCr content was then determined using enzymatic spectrophotometric assays (Harris et al., 1974). Briefly, for ATP and PCr, 25 μl of muscle extract is added to buffer containing 100 mM triethanolamine (pH 7.4), 10 mM magnesium acetate, 1 mM EDTA, 1 mM DTT, 1 mM NADP, 40 μM ADP, 5 mM glucose, and yeast G6PDH. Hexokinase and creatine kinase are then added sequentially and change in absorbance is monitored for both reactions at 340nM. For creatine, 25 μl of muscle extract was added to buffer containing 100 mM glycine, 5 mM magnesium acetate, 30 mM KCl, 1.5 mM ATP, 1 mM PEP, 150μM NADH, LDH and pyruvate kinase. Creatine kinase was then added and change in absorbance monitored at 340nM. Total creatine is calculated as the sum of creatine and PCr.
Gene expression analysis
For measurement of liver and skeletal muscle gene expression, RNA was extracted from liver tissue using an RNeasy kit from QIAGEN. RNA was reverse transcribed using the Bio-Rad iScript cDNA synthesis kit. qPCR was performed with Applied Biosystems TaqMan® gene expression assays for SHMT1 (Rn01751636_m1), SHMT2(Rn01768052_g1), SDH (Rn01499872_m1), CPS1 (Rn00567109_m1), OTC (Rn00565169_m1), ASS1 (Rn00565808_g1), ASL (Rn01480437_g1), ARG1 (Rn00691090_m1), and PPIA (Rn00690933_m1) on a Viia 7 Real-Time PCR system (Applied Biosystems). Each sample was run in duplicate and normalized to Ppia.
Immunoblot analyses
Immunoblot analysis was performed with 30 μg of protein from gastrocnemius tissue lysates that were prepared in cell lysis buffer (Cell Signaling Technology) containing 1mM PMSF and phosphatase inhibitor cocktails 2 and 3 (Sigma). Anti–phospho-AMPKα T172 (#2535; Cell Signaling Technology) and anti-AMPKα (#2603; Cell Signaling Technology) antibodies were used to probe PVDF membranes for p-AMPK and total AMPK respectively. Membranes were visualized using the appropriate Alexa Fluor 680–conjugated secondary antibody and quantified using the Odyssey imaging system (LI-COR Biosciences).
QUANTIFICATION AND STATISTICAL ANALYSIS
Linear regression models were constructed to test each SNP for association with log-transformed metabolite values using PLINK v1.90 (Purcell et al., 2007). All models assumed an additive genetic effect and were adjusted for age, sex, and four Eigenstrat-derived principal components to account for potential population stratification (Price et al., 2006). For genome-wide analyses, SNPs were considered significant at a standard p value threshold of 5×10⁻⁸. For tests of lead SNPs with additional metabolites, a Bonferroni adjustment was applied for each metabolite separately; associations were considered significant at p < 0.0071 (0.05/7 SNPs). Manhattan plots were created using the R package qqman (Turner, 2014); plots of linkage disequilibrium (LD) were created using Locus-Zoom (Pruim et al., 2010) and Haploview v4.2 (Barrett et al., 2005). Lead SNPs for each LD block were identified using the Tagger algorithm and an r2 threshold of 0.6, as implemented in the Haploview software (de Bakker et al., 2005).
Unadjusted Pearson correlations were calculated on log-transformed skeletal muscle amino acid, organic acid, and acyl-carnitine data from our prior study (White et al., 2016), with data from all experimental groups considered jointly. Missing values were not imputed, while zero values were replaced with 1/2 * the minimum observed value for a given metabolite, then log-transformed. Three metabolites with > 25% of values either missing or zero were removed, leaving 85 metabolites for analysis. P values were adjusted using Benjamini and Hochberg’s false discovery rate method (Author et al., 1995). Analysis was performed using R v3.3.2.
All data are reported as mean ± the standard error of the mean. For animal studies which each involved two experimental groups an unpaired two-sided Student’s t test was performed in Microsoft Excel. In all cases a p value less than 0.05 was considered significant. The respective n for each analysis is reported in the figure legends.
Supplementary Material
KEY RESOURCES TABLE
| REAGENT or RESOURCE | SOURCE | IDENTIFIER |
|---|---|---|
| Antibodies | ||
|
| ||
| Anti-phospho-AMPKa T172 | Cell Signaling Technology | #2535; RRID:AB_331250 |
| anti-AMPKa | Cell Signaling Technology | #2603; RRID:AB_490795 |
|
| ||
| Chemicals, Peptides, and Recombinant Proteins | ||
|
| ||
| 15N, U- 13C Valine | Cambridge Isotopes Laboratories Inc. | CNLM-442-H-PK |
| 1,2-13C Glycine | Cambridge Isotopes Laboratories Inc. | CLM-1017-PK |
|
| ||
| Critical Commercial Assays | ||
|
| ||
| Mouse/Rat Insulin kit | Meso Scale Discovery | K152BZC |
|
| ||
| Experimental Models: Organisms/Strains | ||
|
| ||
| Zucker FattyFa/Fa Rats | Charles River Laboratories | N/A |
| Wistar Rats | Charles River Laboratories | N/A |
|
| ||
| Oligonucleotides | ||
|
| ||
| SHMT1 | Applied Biosystems | Rn01751636_m1 |
| SHMT2 | Applied Biosystems | Rn01768052_g1 |
| SDH | Applied Biosystems | Rn01499872_m1 |
| CPS1 | Applied Biosystems | Rn00567109_m1 |
| OTC | Applied Biosystems | Rn00565169_m1 |
| ASS1 | Applied Biosystems | Rn00565808_g1 |
| ASL | Applied Biosystems | Rn01480437_g1 |
| ARG1 | Applied Biosystems | Rn00691090_m1 |
| PPIA | Applied Biosystems | Rn00690933_m1 |
|
| ||
| Software and Algorithms | ||
|
| ||
| GenomeStudio | Illumina | N/A |
| PLINK v1.90 | Purcell et al., 2007 | N/A |
| R v3.3.2 | https://cran.r-project.org/bin/windows/base/old/3.3.2/ | N/A |
| LocusZoom | Pruim et al., 2010 | N/A |
| Haploview v4.2 | Barrett et al., 2005 | N/A |
| R package qqman | Turner, 2014 | N/A |
Highlights.
Glycine levels are inversely associated with cardiometabolic disease phenotypes
High BCAA levels trigger glycine use as a carbon donor for the pyruvate-alanine cycle
Inhibition of BCATs raises glycine levels
Glycine supplementation improves lipid homeostasis, but not glucose intolerance
ACKNOWLEDGMENTS
We would like to thank Helena Winfield, Jing Jing Niu, and Huaxia Cui for expert technical assistance. This work was supported by NIH grants NIDDK PO1-DK58398 and RO1-DK121710 (to C.B.N.), an American Diabetes Association Pathway to Stop Diabetes grant 1-16-INI-17 (to P.J.W.), and sponsored research agreements with Pfizer and Lilly (to C.B.N.).
Footnotes
DECLARATION OF INTERESTS
C.B.N. is a member of the Eli Lilly Global Diabetes Advisory Board. He was also the lead investigator of now-completed sponsored research agreements with Pfizer and Lilly that supported a portion of the studies described herein.
SUPPLEMENTAL INFORMATION
Supplemental Information can be found online at https://doi.org/10.1016/j.celrep.2020.108375.
REFERENCES
- Ahn WS, and Antoniewicz MR (2011). Metabolic flux analysis of CHO cells at growth and non-growth phases using isotopic tracers and mass spectrometry. Metab. Eng. 13, 598–609. [DOI] [PubMed] [Google Scholar]
- An J, Muoio DM, Shiota M, Fujimoto Y, Cline GW, Shulman GI, Koves TR, Stevens R, Millington D, and Newgard CB (2004). Hepatic expression of malonyl-CoA decarboxylase reverses muscle, liver and whole-animal insulin resistance. Nat. Med. 10, 268–274. [DOI] [PubMed] [Google Scholar]
- Anderson HL, Benevenga NJ, and Harper AE (1968). Associations among food and protein intake, serine dehydratase, and plasma amino acids. Am. J. Physiol. 214, 1008–1013. [DOI] [PubMed] [Google Scholar]
- Antoniewicz MR, Kelleher JK, and Stephanopoulos G. (2007). Accurate assessment of amino acid mass isotopomer distributions for metabolic flux analysis. Anal. Chem. 79, 7554–7559. [DOI] [PubMed] [Google Scholar]
- Author T, Benjamini Y, Hochberg Y, and Benjaminit Y. (1995). Controlling the false discovery rate: a practical and powerful approach to multiple testing. J. R. Stat. Soc. Ser. B 57, 289–300. [Google Scholar]
- Auton A, Brooks LD, Durbin RM, Garrison EP, Kang HM, Korbel JO, Marchini JL, McCarthy S, McVean GA, and Abecasis GR; 1000 Genomes Project Consortium (2015). A global reference for human genetic variation. Nature 526, 68–74. [DOI] [PMC free article] [PubMed] [Google Scholar]
- Baker PR 2nd, Boyle KE, Koves TR, Ilkayeva OR, Muoio DM, Houmard JA, and Friedman JE (2015). Metabolomic analysis reveals altered skeletal muscle amino acid and fatty acid handling in obese humans. Obesity (Silver Spring) 23, 981–988. [DOI] [PMC free article] [PubMed] [Google Scholar]
- Barrett JC, Fry B, Maller J, and Daly MJ (2005). Haploview: analysis and visualization of LD and haplotype maps. Bioinformatics 21, 263–265. [DOI] [PubMed] [Google Scholar]
- Butte NF, Liu Y, Zakeri IF, Mohney RP, Mehta N, Voruganti VS, Göring H, Cole SA, and Comuzzie AG (2015). Global metabolomic profiling targeting childhood obesity in the Hispanic population. Am. J. Clin. Nutr. 102, 256–267. [DOI] [PMC free article] [PubMed] [Google Scholar]
- Chen S, Xu XL, and Grant GA (2012). Allosteric activation and contrasting properties of L-serine dehydratase types 1 and 2. Biochemistry 51, 5320–5328. [DOI] [PubMed] [Google Scholar]
- de Bakker PIW, Yelensky R, Pe’er I, Gabriel SB, Daly MJ, and Altshuler D. (2005). Efficiency and power in genetic association studies. Nat. Genet. 37, 1217–1223. [DOI] [PubMed] [Google Scholar]
- Demirkan A, Henneman P, Verhoeven A, Dharuri H, Amin N, van Klinken JB, Karssen LC, de Vries B, Meissner A, Göraler S, et al. (2015). Insight in genome-wide association of metabolite quantitative traits by exome sequence analyses. PLoS Genet. 11, e1004835. [DOI] [PMC free article] [PubMed] [Google Scholar]
- Dietrich S, Floegel A, Weikert C, Prehn C, Adamski J, Pischon T, Boeing H, and Drogan D. (2016). Identification of serum metabolites associated with incident hypertension in the European prospective investigation into cancer and nutrition-potsdam study. Hypertension 68, 471–477. [DOI] [PubMed] [Google Scholar]
- Ding Y, Svingen GFT, Pedersen ER, Gregory JF, Ueland PM, Tell GS, and Nygård OK (2015). Plasma glycine and risk of acute myocardial infarction in patients with suspected stable angina pectoris. J. Am. Heart Assoc. 5, 5. [DOI] [PMC free article] [PubMed] [Google Scholar]
- Felig P, Marliss E, and Cahill GF Jr. (1969). Plasma amino acid levels and insulin secretion in obesity. N. Engl. J. Med. 281, 811–816. [DOI] [PubMed] [Google Scholar]
- Fernandez CA, Des Rosiers C, Previs SF, David F, and Brunengraber H. (1996). Correction of 13C mass isotopomer distributions for natural stable isotope abundance. J. Mass Spectrom. 31, 255–262. [DOI] [PubMed] [Google Scholar]
- Ferrara CT, Wang P, Neto EC, Stevens RD, Bain JR, Wenner BR, Ilkayeva OR, Keller MP, Blasiole DA, Kendziorski C, et al. (2008). Genetic networks of liver metabolism revealed by integration of metabolic and transcriptional profiling. PLoS Genet. 4, e1000034. [DOI] [PMC free article] [PubMed] [Google Scholar]
- Floegel A, Stefan N, Yu Z, Mühlenbruch K, Drogan D, Joost H-G, Fritsche A, Häring H-U, Hrabě de Angelis M, Peters A, et al. (2013). Identification of serum metabolites associated with risk of type 2 diabetes using a targeted metabolomic approach. Diabetes 62, 639–648. [DOI] [PMC free article] [PubMed] [Google Scholar]
- Frazer KA, Ballinger DG, Cox DR, Hinds DA, Stuve LL, Gibbs RA, Belmont JW, Boudreau A, Hardenbol P, Leal SM, et al. ; International HapMap Consortium (2007). A second generation human haplotype map of over 3.1 million SNPs. Nature 449, 851–861. [DOI] [PMC free article] [PubMed] [Google Scholar]
- Gall WE, Beebe K, Lawton KA, Adam K-P, Mitchell MW, Nakhle PJ, Ryals JA, Milburn MV, Nannipieri M, Camastra S, et al. ; RISC Study Group (2010). α-hydroxybutyrate is an early biomarker of insulin resistance and glucose intolerance in a nondiabetic population. PLoS ONE 5, e10883. [DOI] [PMC free article] [PubMed] [Google Scholar]
- Ganda OP, and Ruderman NB (1976). Muscle nitrogen metabolism in chronic hepatic insufficiency. Metabolism 25, 427–435. [DOI] [PubMed] [Google Scholar]
- Garber AJ, Karl IE, and Kipnis DM (1976). Alanine and glutamine synthesis and release from skeletal muscle. II. The precursor role of amino acids in alanine and glutamine synthesis. J Biol Chem 251, 836–843. [PubMed] [Google Scholar]
- Glynn EL, Piner LW, Huffman KM, Slentz CA, Elliot-Penry L, AbouAssi H, White PJ, Bain JR, Muehlbauer MJ, Ilkayeva OR, et al. (2015). Impact of combined resistance and aerobic exercise training on branched-chain amino acid turnover, glycine metabolism and insulin sensitivity in overweight humans. Diabetologia 58, 2324–2335. [DOI] [PMC free article] [PubMed] [Google Scholar]
- Gralka E, Luchinat C, Tenori L, Ernst B, Thurnheer M, and Schultes B. (2015). Metabolomic fingerprint of severe obesity is dynamically affected by bariatric surgery in a procedure-dependent manner. Am. J. Clin. Nutr. 102, 1313–1322. [DOI] [PubMed] [Google Scholar]
- Hall JC (1998). Glycine. JPEN J. Parenter. Enteral Nutr. 22, 393–398. [DOI] [PubMed] [Google Scholar]
- Harris RC, Hultman E, and Nordesjö LO (1974). Glycogen, glycolytic intermediates and high-energy phosphates determined in biopsy samples of musculus quadriceps femoris of man at rest. Methods and variance of values. Scand. J. Clin. Lab. Invest. 33, 109–120. [PubMed] [Google Scholar]
- Hartiala JA, Tang WH, Wang Z, Crow AL, Stewart AFR, Roberts R, McPherson R, Erdmann J, Willenborg C, Hazen SL, and Allayee H. (2016). Genome-wide association study and targeted metabolomics identifies sex-specific association of CPS1 with coronary artery disease. Nat. Commun. 7, 10558. [DOI] [PMC free article] [PubMed] [Google Scholar]
- Holzer H, Cennamo C, and Boll M. (1964). Product activation of yeast threonine dehydratase by ammonia. Biochem. Biophys. Res. Commun. 14, 487–492. [DOI] [PubMed] [Google Scholar]
- Howie BN, Donnelly P, and Marchini J. (2009). A flexible and accurate genotype imputation method for the next generation of genome-wide association studies. PLoS Genet. 5, e1000529. [DOI] [PMC free article] [PubMed] [Google Scholar]
- Huffman KM, Shah SH, Stevens RD, Bain JR, Muehlbauer M, Slentz CA, Tanner CJ, Kuchibhatla M, Houmard JA, Newgard CB, and Kraus WE (2009). Relationships between circulating metabolic intermediates and insulin action in overweight to obese, inactive men and women. Diabetes Care 32, 1678–1683. [DOI] [PMC free article] [PubMed] [Google Scholar]
- Hutson SM, Wallin R, and Hall TR (1992). Identification of mitochondrial branched chain aminotransferase and its isoforms in rat tissues. J. Biol. Chem. 267, 15681–15686. [PubMed] [Google Scholar]
- Kraus WE, Granger CB, Sketch MH Jr., Donahue MP, Ginsburg GS, Hauser ER, Haynes C, Newby LK, Hurdle M, Dowdy ZE, and Shah SH (2015). A guide for a cardiovascular genomics biorepository: the CATHGEN experience. J. Cardiovasc. Transl. Res. 8, 449–457. [DOI] [PMC free article] [PubMed] [Google Scholar]
- Kraus WE, Pieper CF, Huffman KM, Thompson DK, Kraus VB, Morey MC, Cohen HJ, Ravussin E, Redman LM, Bain JR, et al. (2016). Association of plasma small-molecule intermediate metabolites with age and body mass index across six diverse study populations. J. Gerontol. A Biol. Sci. Med. Sci. 71, 1507–1513. [DOI] [PMC free article] [PubMed] [Google Scholar]
- Laferrère B, Reilly D, Arias S, Swerdlow N, Gorroochurn P, Bawa B, Bose M, Teixeira J, Stevens RD, Wenner BR, et al. (2011). Differential metabolic impact of gastric bypass surgery versus dietary intervention in obese diabetic subjects despite identical weight loss. Sci. Transl. Med. 3, 80re2. [DOI] [PMC free article] [PubMed] [Google Scholar]
- Lee A, Jang HB, Ra M, Choi Y, Lee H-J, Park JY, Kang JH, Park K-H, Park SI, and Song J. (2015). Prediction of future risk of insulin resistance and metabolic syndrome based on Korean boy’s metabolite profiling. Obes. Res. Clin. Pract. 9, 336–345. [DOI] [PubMed] [Google Scholar]
- Lips MA, Van Klinken JB, van Harmelen V, Dharuri HK, ‘t Hoen PAC, Laros JFJ, van Ommen G-J, Janssen IM, Van Ramshorst B, Van Wagensveld BA, et al. (2014). Roux-en-Y gastric bypass surgery, but not calorie restriction, reduces plasma branched-chain amino acids in obese women independent of weight loss or the presence of type 2 diabetes. Diabetes Care 37, 3150–3156. [DOI] [PubMed] [Google Scholar]
- Lustgarten MS, Price LL, Phillips EM, and Fielding RA (2013). Serum glycine is associated with regional body fat and insulin resistance in functionally-limited older adults. PLoS ONE 8, e84034. [DOI] [PMC free article] [PubMed] [Google Scholar]
- Madiraju AK, Alves T, Zhao X, Cline GW, Zhang D, Bhanot S, Samuel VT, Kibbey RG, and Shulman GI (2016). Argininosuccinate synthetase regulates hepatic AMPK linking protein catabolism and ureagenesis to hepatic lipid metabolism. Proc. Natl. Acad. Sci. U. S. A. 113, 3423–3430. [DOI] [PMC free article] [PubMed] [Google Scholar]
- Magkos F, Bradley D, Schweitzer GG, Finck BN, Eagon JC, Ilkayeva O, Newgard CB, and Klein S. (2013). Effect of Roux-en-Y gastric bypass and laparoscopic adjustable gastric banding on branched-chain amino acid metabolism. Diabetes 62, 2757–2761. [DOI] [PMC free article] [PubMed] [Google Scholar]
- Makowski L, Noland RC, Koves TR, Xing W, Ilkayeva OR, Muehlbauer MJ, Stevens RD, and Muoio DM (2009). Metabolic profiling of PPARalpha−/− mice reveals defects in carnitine and amino acid homeostasis that are partially reversed by oral carnitine supplementation. FASEB J. 23, 586–604. [DOI] [PMC free article] [PubMed] [Google Scholar]
- Matone A, Scott-Boyer M-P, Carayol J, Fazelzadeh P, Lefebvre G, Valsesia A, Charon C, Vervoort J, Astrup A, Saris WHM, et al. (2016). Network analysis of metabolite GWAS hits: implication of CPS1 and the urea cycle in weight maintenance. PLoS ONE 11, e0150495. [DOI] [PMC free article] [PubMed] [Google Scholar]
- Mittelstrass K, Ried JS, Yu Z, Krumsiek J, Gieger C, Prehn C, Roemisch-Margl W, Polonikov A, Peters A, Theis FJ, et al. (2011). Discovery of sexual dimorphisms in metabolic and genetic biomarkers. PLoS Genet. 7, e1002215. [DOI] [PMC free article] [PubMed] [Google Scholar]
- Muoio DM, Noland RC, Kovalik J-P, Seiler SE, Davies MN, DeBalsi KL, Ilkayeva OR, Stevens RD, Kheterpal I, Zhang J, et al. (2012). Muscle-specific deletion of carnitine acetyltransferase compromises glucose tolerance and metabolic flexibility. Cell Metab. 15, 764–777. [DOI] [PMC free article] [PubMed] [Google Scholar]
- Neinast MD, Jang C, Hui S, Murashige DS, Chu Q, Morscher RJ, Li X, Zhan L, White E, Anthony TG, et al. (2019). Quantitative analysis of the whole-body metabolic fate of branched-chain amino acids. Cell Metab. 29, 417–429.e4. [DOI] [PMC free article] [PubMed] [Google Scholar]
- Newgard CB (2017). Metabolomics and metabolic diseases: where do we stand? Cell Metab. 25, 43–56. [DOI] [PMC free article] [PubMed] [Google Scholar]
- Newgard CB, An J, Bain JR, Muehlbauer MJ, Stevens RD, Lien LF, Haqq AM, Shah SH, Arlotto M, Slentz CA, et al. (2009). A branched-chain amino acid-related metabolic signature that differentiates obese and lean humans and contributes to insulin resistance. Cell Metab. 9, 311–326. [DOI] [PMC free article] [PubMed] [Google Scholar]
- Noland RC, Koves TR, Seiler SE, Lum H, Lust RM, Ilkayeva O, Stevens RD, Hegardt FG, and Muoio DM (2009). Carnitine insufficiency caused by aging and overnutrition compromises mitochondrial performance and metabolic control. J. Biol. Chem. 284, 22840–22852. [DOI] [PMC free article] [PubMed] [Google Scholar]
- Ogawa H, Fujioka M, Su Y, Kanamoto R, and Pitot HC (1991). Nutritional regulation and tissue-specific expression of the serine dehydratase gene in rat. J. Biol. Chem. 266, 20412–20417. [PubMed] [Google Scholar]
- Price AL, Patterson NJ, Plenge RM, Weinblatt ME, Shadick NA, and Reich D. (2006). Principal components analysis corrects for stratification in genome-wide association studies. Nat. Genet. 38, 904–909. [DOI] [PubMed] [Google Scholar]
- Pruim RJ, Welch RP, Sanna S, Teslovich TM, Chines PS, Gliedt TP, Boehnke M, Abecasis GR, and Willer CJ (2010). LocusZoom: regional visualization of genome-wide association scan results. Bioinformatics 26, 2336–2337. [DOI] [PMC free article] [PubMed] [Google Scholar]
- Purcell S, Neale B, Todd-Brown K, Thomas L, Ferreira MAR, Bender D, Maller J, Sklar P, de Bakker PIW, Daly MJ, and Sham PC (2007). PLINK: a tool set for whole-genome association and population-based linkage analyses. Am. J. Hum. Genet. 81, 559–575. [DOI] [PMC free article] [PubMed] [Google Scholar]
- Ronnebaum SM, Ilkayeva O, Burgess SC, Joseph JW, Lu D, Stevens RD, Becker TC, Sherry AD, Newgard CB, and Jensen MV (2006). A pyruvate cycling pathway involving cytosolic NADP-dependent isocitrate dehydrogenase regulates glucose-stimulated insulin secretion. J. Biol. Chem. 281, 30593–30602. [DOI] [PubMed] [Google Scholar]
- Seiler SE, Martin OJ, Noland RC, Slentz DH, DeBalsi KL, Ilkayeva OR, An J, Newgard CB, Koves TR, and Muoio DM (2014). Obesity and lipid stress inhibit carnitine acetyltransferase activity. J. Lipid Res. 55, 635–644. [DOI] [PMC free article] [PubMed] [Google Scholar]
- Sekhar RV, McKay SV, Patel SG, Guthikonda AP, Reddy VT, Balasubramanyam A, and Jahoor F. (2011). Glutathione synthesis is diminished in patients with uncontrolled diabetes and restored by dietary supplementation with cysteine and glycine. Diabetes Care 34, 162–167. [DOI] [PMC free article] [PubMed] [Google Scholar]
- Shah SH, Bain JR, Muehlbauer MJ, Stevens RD, Crosslin DR, Haynes C, Dungan J, Newby LK, Hauser ER, Ginsburg GS, et al. (2010). Association of a peripheral blood metabolic profile with coronary artery disease and risk of subsequent cardiovascular events. Circ. Cardiovasc. Genet. 3, 207–214. [DOI] [PubMed] [Google Scholar]
- Tai ES, Tan MLS, Stevens RD, Low YL, Muehlbauer MJ, Goh DLM, Ilkayeva OR, Wenner BR, Bain JR, Lee JJM, et al. (2010). Insulin resistance is associated with a metabolic profile of altered protein metabolism in Chinese and Asian-Indian men. Diabetologia 53, 757–767. [DOI] [PMC free article] [PubMed] [Google Scholar]
- Thalacker-Mercer AE, Ingram KH, Guo F, Ilkayeva O, Newgard CB, and Garvey WT (2014). BMI, RQ, diabetes, and sex affect the relationships between amino acids and clamp measures of insulin action in humans. Diabetes 63, 791–800. [DOI] [PMC free article] [PubMed] [Google Scholar]
- Turner SD (2014). qqman: an R package for visualizing GWAS results using Q-Q and manhattan plots. bioRxiv. 10.1101/005165. [DOI] [Google Scholar]
- Wang TJ, Larson MG, Vasan RS, Cheng S, Rhee EP, McCabe E, Lewis GD, Fox CS, Jacques PF, Fernandez C, et al. (2011). Metabolite profiles and the risk of developing diabetes. Nat. Med. 17, 448–453. [DOI] [PMC free article] [PubMed] [Google Scholar]
- Wang-Sattler R, Yu Z, Herder C, Messias AC, Floegel A, He Y, Heim K, Campillos M, Holzapfel C, Thorand B, et al. (2012). Novel biomarkers for pre-diabetes identified by metabolomics. Mol. Syst. Biol. 8, 615. [DOI] [PMC free article] [PubMed] [Google Scholar]
- White PJ, and Newgard CB (2019). Branched-chain amino acids in disease. Science 363, 582–583. [DOI] [PMC free article] [PubMed] [Google Scholar]
- White PJ, Lapworth AL, An J, Wang L, McGarrah RW, Stevens RD, Ilkayeva O, George T, Muehlbauer MJ, Bain JR, et al. (2016). Branched-chain amino acid restriction in Zucker-fatty rats improves muscle insulin sensitivity by enhancing efficiency of fatty acid oxidation and acyl-glycine export. Mol. Metab. 5, 538–551. [DOI] [PMC free article] [PubMed] [Google Scholar]
- Xie W, Wood AR, Lyssenko V, Weedon MN, Knowles JW, Alkayyali S, Assimes TL, Quertermous T, Abbasi F, Paananen J, et al. ; MAGIC Investigators; DIAGRAM Consortium; GENESIS Consortium; RISC Consortium (2013). Genetic variants associated with glycine metabolism and their role in insulin sensitivity and type 2 diabetes. Diabetes 62, 2141–2150. [DOI] [PMC free article] [PubMed] [Google Scholar]
- Young S, Struys E, Wood T, Young S, Struys E, and Wood T. (2007). Quantification of creatine and guanidinoacetate using GC-MS and LC-MS/MS for the detection of cerebral creatine deficiency syndromes. Curr. Protoc. Hum. Genet. Chapter 17, 17.3.1–17.3.18. [DOI] [PubMed] [Google Scholar]
- Zhong B, Sakai S, Saeki T, and Kanamoto R. (2007). Excess leucine intake induces serine dehydratase in rat liver. Biosci. Biotechnol. Biochem. 71, 2614–2617. [DOI] [PubMed] [Google Scholar]
Associated Data
This section collects any data citations, data availability statements, or supplementary materials included in this article.
Supplementary Materials
Data Availability Statement
This study did not generate any unique dataset or code.