

In this study, Hou et al. set out to study the molecular mechanism underlying therapy resistance to KRAS inhibitors. Using a PDAC mouse model engineered with an inducible oncogenic KRAS (KRAS*) allele, the authors identified USP21, a protein deubiquitinase, as a driver of KRAS*-independent PDAC growth that occurs via induction of macropinocytosis.
Keywords: KRAS, MARK3, USP21, macropinocytosis, targeted therapy resistance
Abstract
Activating mutations in KRAS (KRAS*) are present in nearly all pancreatic ductal adenocarcinoma (PDAC) cases and critical for tumor maintenance. By using an inducible KRAS* PDAC mouse model, we identified a deubiquitinase USP21-driven resistance mechanism to anti-KRAS* therapy. USP21 promotes KRAS*-independent tumor growth via its regulation of MARK3-induced macropinocytosis, which serves to maintain intracellular amino acid levels for anabolic growth. The USP21-mediated KRAS* bypass, coupled with the frequent amplification of USP21 in human PDAC tumors, encourages the assessment of USP21 as a novel drug target as well as a potential parameter that may affect responsiveness to emergent anti-KRAS* therapy.
Pancreatic cancer is the seventh leading cause of cancer deaths worldwide with a 5-yr survival rate of ∼7% (Bengtsson et al. 2020). The most common form of pancreas cancer, pancreatic ductal adenocarcinoma (PDAC), is driven and sustained by mutant oncogenic KRAS (KRAS*), which occurs in >90% of cases (Aguirre et al. 2003; Hingorani et al. 2003; Ying et al. 2012; Kimmelman 2015). The KRAS*-driven metabolic program is characterized by increased glucose uptake and glycolytic intermediates (Ying et al. 2012), which are used to produce macromolecules including amino acids, nucleotides, and lipids needed for cancer cell growth (Hay 2016). In the nutrient-deprived PDAC microenvironment, KRAS* also activates nutrient salvage pathways including autophagy (Yang et al. 2011; Perera et al. 2015) and macropinocytosis (Commisso et al. 2013) to fuel the high energetic demands of amino acids as carbon and nitrogen donors (Kamphorst et al. 2015; Palm et al. 2015).
Our recent work identified the deubiquitinase USP21 as a novel, frequently amplified PDAC oncogene that promotes cancer cell stemness via its deubiquitination and stabilization of transcription factor TCF7 in the nucleus (Hou et al. 2019). In an in vivo gain-of-function screen (Hou et al. 2020), USP21 emerged as the second top candidate that promotes tumor recurrence following KRAS* extinction in an inducible KRAS* PDAC model (iKPC model) (Ying et al. 2012). However, we unexpectedly found that USP21 enables KRAS* bypass via its actions in the cytoplasm rather than its nuclear function of TCF7-induced cancer stemness. Integrated analysis revealed that USP21 increases macropinocytosis via its regulation of microtubule affinity-regulating kinase 3 (MARK3), a kinase regulator of cytoskeleton dynamics that is central to the macropinocytotic process, thereby providing metabolic support following KRAS* extinction in PDAC cancer cells.
Results and Discussion
USP21 promotes the bypass of KRAS* dependency in PDAC cells
To identify cancer cell-autonomous and nonautonomous resistance mechanisms to KRAS* extinction, we conducted a gain-of-function screen of 284 epigenetic regulators in the iKPC PDAC mouse model genetically engineered with an inducible KrasG12D, conditional null allele for Tp53 knockout, and p48-Cre transgene (Ying et al. 2012; Hou et al. 2020). USP21 emerged as the second topmost KRAS* bypass hit with tumor formation incidence at 50%–70% ∼5 wk following KRAS* extinction (Fig. 1A–D). Enforced expression of wild-type (WT) USP21, but not an enzyme-dead (ED) mutant, promoted KRAS*-independent PDAC tumor growth in vivo (Fig. 1A,B) and colony formation in vitro (Fig. 1E,F, Supplemental Fig. S1A,B). USP21 escaper tumors were highly anaplastic and proliferative (Ki67) and showed decreased pERK levels relative to KRAS*-expressing tumors (Fig. 1D). Examination of KRAS* signaling pathway revealed that USP21 escapers consistently increased S6 phosphorylation compared with KRAS*-extinguished cells (Supplemental Fig. S1C). Escaper cells neither hyperactivated endogenous Kras, re-expressed KrasG12D transgene, nor up-regulated Yap1, which is an established mechanism for bypass of KRAS* dependency as shown previously (Supplemental Fig. S1D; Kapoor et al. 2014; Shao et al. 2014). Correspondingly, in the de novo USP21 escapers or USP21-overexpressing KRAS*-extinguished cells, we observed YAP1 phosphorylation at S127, which is known to decrease YAP1 activity, and no up-regulation of the canonical YAP1 target genes (Supplemental Fig. S1C,E–F). Moreover, cytoplasm-localized USP21 (NES USP21), but not nucleus-localized USP21 (NLS USP21) (Hou et al. 2019), enabled KRAS*-independent tumor growth (Supplemental Fig. S1G), indicating that USP21 drives KRAS* bypass via cytoplasmic target(s) rather than its actions on TCF7 in the nucleus (Hou et al. 2019). Thus, USP21 promotes KRAS* bypass through a cancer cell-intrinsic mechanism requiring its enzymatic functions in the cytoplasm that does not involve reactivation of KRAS* or known mechanisms of KRAS* bypass such as YAP1 activation.
Figure 1.
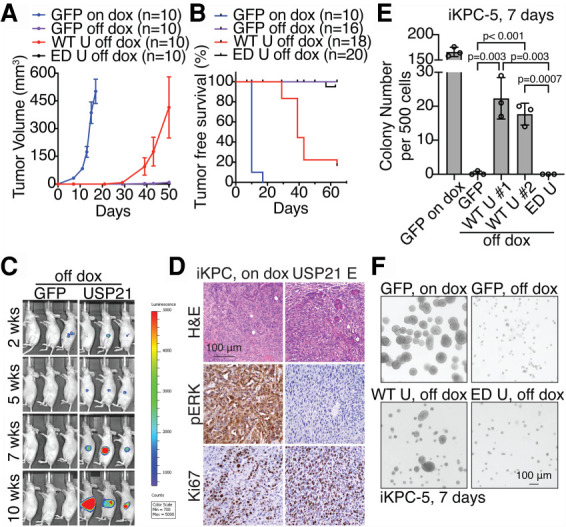
USP21 promotes PDAC cells to bypass the dependency of KRAS*. (A,B) Tumor growth analysis (A) and tumor-free survival analysis (B) comparing tumors with overexpression of GFP with dox feeding (GFP on dox), GFP without dox feeding (GFP off dox), WT USP21 without dox feeding (WT U off dox), and ED USP21 without dox feeding (ED U off dox). (C) Bioluminescent imaging of orthotopically transplanted GFP-overexpressing and WT USP21-overexpressing tumor cells without dox feeding. (D) Representative H&E and immunohistochemical (IHC) staining images of iKPC tumors and WT USP21 escapers. (E,F) KRAS*-independent colony formation analysis in Matrigel (E) and representative images (F) comparing iKPC cells overexpressing GFP, WT USP21 (#1 and #2 are two biological replicates), and ED USP21. GFP-overexpressing iKPC cells with dox is positive control. For A and E, data are represented as mean ± SEM. (Dox) Doxycycline. See also Supplemental Figure S1.
USP21 up-regulates mTOR signaling and macropinocytosis
To identify molecular mechanisms by which USP21 supports KRAS*-independent PDAC growth, RNA-seq profiling was performed at 3 d following KRAS* extinction, revealing enrichment of mTOR signaling signature in WT USP21-overexpressing PDAC cells compared with GFP-overexpressing or ED USP21-overexpressing cells (Fig. 2A). Western blot analysis confirmed activation of mTORC1 pathway factors including phosphorylated S6 kinase, S6, and ULK1, although the level of activation is lower than that achieved with KRAS* expression (Fig. 2B). Furthermore, the mTOR inhibitor rapamycin eradicated USP21-driven KRAS* bypass (Fig. 2C), implying that the ability of USP21 to sustain even low levels of mTOR signaling may support KRAS*-independent PDAC growth.
Figure 2.
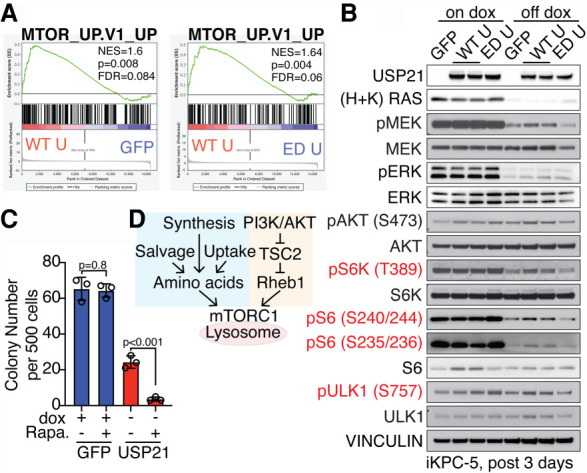
USP21 reactivates mTORC1 pathway after KRAS* extinction. (A) GSEA comparing iKPC cells overexpressing GFP, WT USP21, and ED USP21 at 3 d after KRAS* extinction showed enrichment of mTOR signaling pathway in the WT USP21-overexpressing group. (B) Western blot analysis of downstream targets of mTORC1 signaling pathway comparing GFP-overexpressing, WT USP21-overexpressing, and ED USP21-overexpressing iKPC cells with or without dox treatment for 3 d. (C) KRAS*-dependent and -independent colony formation analysis of GFP-overexpressing or WT USP21-overexpressing iKPC cells comparing DMSO and mTOR inhibitor rapamycin (Rapa.). Data are represented as mean ± SEM. (D) Schematic graph elucidating the regulation of mTORC1 signaling pathway activation. See also Supplemental Figure S2.
Optimal mTORC1 activation requires localization on the lysosome membrane, upstream PI3K–AKT signaling input, and adequate amino acids (Fig. 2D; Condon and Sabatini 2019). Immunofluorescence (IF) staining of mTOR and the lysosome marker LAMP1 revealed no changes in their colocalization by USP21 in KRAS*-extinguished PDAC cells (Supplemental Fig. S2A). Although PI3K/AKT signaling was slightly activated relative to controls in WT USP21-overexpressing PDAC cells, mTOR inhibitors Torin-2 and rapamycin suppressed pAKT levels (Supplemental Fig. S2B,C), indicating that AKT pathway activation is regulated by mTOR pathway as a result of positive feedback rather than by USP21. Moreover, neither forced expression of constitutively activated AKT (Yan et al. 2021) nor genetic activation of mTORC1 upstream signaling by Tsc2 depletion was able to drive KRAS* bypass; instead, Tsc2 depletion provoked cell death (Supplemental Fig. S2D–F). Together, these findings established that USP21 fails to activate mTORC1 upstream signaling directly and that the up-regulation of AKT/TSC2 signaling is insufficient to support KRAS* bypass.
To assess amino acid metabolism, metabolomic analysis at steady state was performed, revealing enrichment of several amino acid and nucleotide metabolism pathways in USP21-overexpressing PDAC cells relative to GFP-overexpressing controls at 3 d following KRAS* extinction (Fig. 3A). Consistently, transmission electron microscopic analysis (TEM) and IF staining revealed that USP21 (1) attenuated autophagosome formation and mitochondrial condensation (Supplemental Fig. S3A,B) and (2) decreased LC3 puncta formation consistent with decreased autophagosome (Supplemental Fig. S3C). Together, these cellular phenotypes are consistent with the ability of USP21 to relieve metabolic stress caused by KRAS* extinction.
Figure 3.
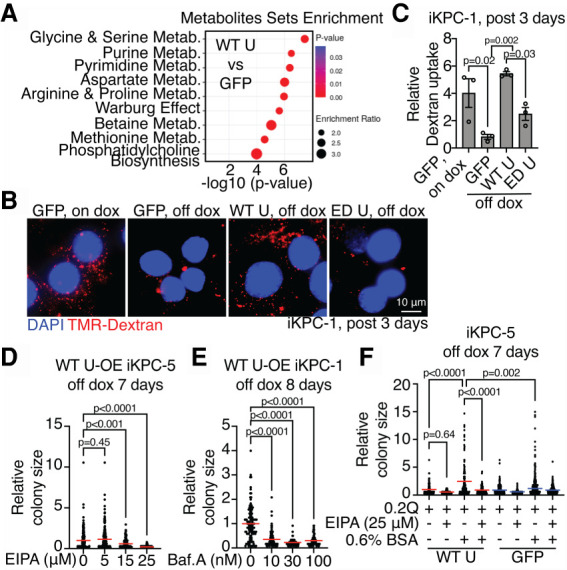
USP21 elevates macropinocytosis after KRAS* extinction. (A) Metabolite set enrichment analysis of metabolomic profiling data at steady state comparing GFP-overexpressing and WT USP21-overexpressing iKPC cells at day 3 after KRAS* extinction (n = 3). (Metab.) Metabolism. (B,C) Representative images (B) and the quantification of TMR-dextran particle uptake (C) comparing GFP-overexpressing, WT USP21-overexpressing, and ED USP21-overexpressing iKPC cells at day 3 after KRAS* extinction. GFP-overexpressing iKPC cells with dox is positive control. (D,E) KRAS*-independent colony formation analysis comparing WT USP21-overexpressing (OE) iKPC cells treated with EIPA (D) or Baf.A (E) at serial concentrations. (F) KRAS*-independent colony formation analysis of WT USP21-overexpressing and GFP-overexpressing iKPC cells cultured in medium supplemented with 0.2 mM glutamine. EIPA and 0.6% BSA were added as indicated. For C–F, data are represented as mean ± SEM. See also Supplemental Figures S3–S6.
Amino acid levels are determined by protein translation, de novo biosynthesis, transport via amino acid transporters (AATs), and scavenger mechanisms including macropinocytosis and autophagy (Bröer and Bröer 2017). Examination of de novo amino acid biosynthesis by metabolic tracing analysis using isotope-labeled glucose revealed the lack of changes in glucose-derived amino acids in USP21-overexpressing PDAC cells compared with controls (Supplemental Fig. S4A), although the oxidative pentose phosphate pathway (oxPPP) and coupled purine synthesis pathway have increased carbon incorporation (Supplemental Fig. S4B,C) and the NADPH level was elevated (Supplemental Fig. S4D). Additionally, USP21 did not rewire AAT expression patterns in a consistent manner (Supplemental Fig. S5A), or decrease nascent protein synthesis at day 3 following KRAS* extinction (Supplemental Fig. S5B). Since USP21 failed to impact de novo amino acid biosynthesis, specific AAT expression patterns, and protein synthesis, yet enforced USP21 suppressed autophagy, we hypothesized that USP21 may up-regulate a key scavenger mechanism operative in PDAC: macropinocytosis.
Consistent with previous work of KRAS* induction of macropinocytosis in PDAC (Commisso et al. 2013; Yao et al. 2019), KRAS* extinction decreased high-molecular-weight (MW) TMR-dextran uptake (Fig. 3B,C). USP21 partially sustained macropinocytosis activity in KRAS*-extinguished cells (Fig. 3B,C, Supplemental Fig. S6A,B). Conversely, inhibition of macropinocytosis by Na+/H+ exchanger inhibitor EIPA or H+ v-ATPase inhibitor bafilomycin A (Baf.A) abrogated the ability of USP21 to sustain KRAS*-independent PDAC colony growth (Fig. 3D,E) and impaired mTOR pathway activation (Supplemental Fig. S6C). Similar to KRAS*-expressing PDAC cells in low-nutrient conditions (Commisso et al. 2013), albumin supplementation rescued the proliferation deficiency of USP21-overexpressing PDAC colonies cultured in glutamine-low media without dox, while EIPA abolished the effect (Fig. 3F). Together, these findings point to enhanced macropinocytosis activity as a mechanism contributing to USP21-mediated bypass of KRAS* dependency.
USP21 promotes the bypass of KRAS* dependency via MARK3
To understand the mechanistic basis by which USP21 may regulate the cytoskeletal dynamics that are integral to macropinocytosis, we first examined key signaling molecules governing cytoskeleton dynamics such as the small GTPases Rac1 and RhoA (Egami et al. 2014; Recouvreux and Commisso 2017), revealing no changes in the activity by USP21 (Supplemental Fig. S6D–E). To identify the cytoplasmic substrate of USP21 that may regulate macropinocytosis, unbiased coimmunoprecipitation (co-IP)/ mass spectrometry (MS) analysis was performed using HA-tagged USP21 (HA-USP21) as the bait in escaper cells. Upon intersection of MS hits with a USP21 interactome data set (Sowa et al. 2009), MARK3 emerged as the sole interactor of USP21 (Fig. 4A), which is a known regulator of microtubule dynamics via its phosphorylation of microtubule-associated proteins (Fig. 4B; Matenia and Mandelkow 2009). We validated that USP21 interacts with and deubiquitinates MARK3 (Fig. 4C–E). Depletion of MARK3 dramatically impaired USP21-driven KRAS* bypass (Fig. 4F; Supplemental Fig. S7A–C); conversely, enforced MARK3 expression promoted KRAS*-independent colony formation (Fig. 4G; Supplemental Fig. S7D–E) and tumor growth (Fig. 4H). Moreover, depletion of MARK3 suppressed macropinocytosis in USP21 escaper cells (Fig. 5A,B), while autophagy marker LC3 puncta increased (Supplemental Fig. S8A). Conversely, MARK3 overexpression enhanced macropinocytosis in PDAC cells following KRAS* extinction (Fig. 5C,D) and attenuated autophagy (Supplemental Fig. S8B). Macropinocytosis inhibitors suppressed MARK3-driven KRAS* bypass (Fig. 5E). Since MARK3 regulates microtube dynamics, we interrupted microtubules by transient treatment of low-dose nocodazole, resulting in inhibition of macropinocytosis similar to EIPA and Baf.A treatments (Fig. 5F,G). Together, USP21-driven KRAS* bypass involves its regulation of MARK3-mediated microtubule dynamics, which fosters macropinocytosis.
Figure 4.
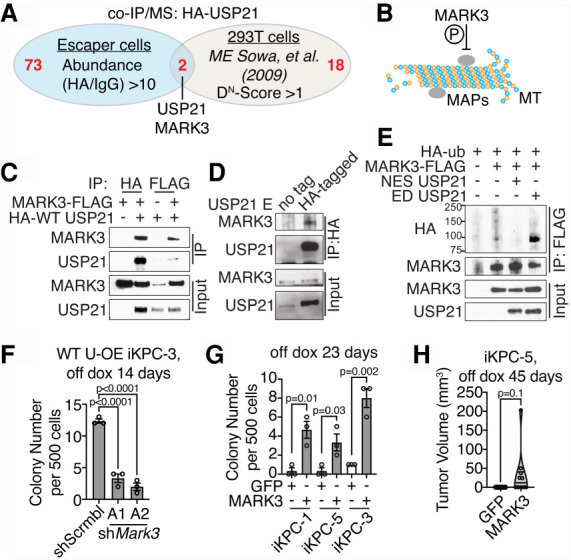
MARK3 interacts with USP21 and mediates USP21-driven KRAS* bypass. (A) Venn diagram intersecting our co-IP/MS data using HA-tagged WT USP21 as bait with a published USP21 interactome data set. (B) Schematic graph demonstrating MARK3 function. (C) Detection of USP21 and MARK3 interaction by co-IP/Western blot analysis in 293T cells. (D) Detection of endogenous MARK3 binding to USP21 in WT USP21-driven escapers. (E) Ubiquitination assay comparing MARK3 ubiquitination in 293T cells overexpressing NES USP21 and ED USP21. (F) KRAS*-independent colony formation assay of WT USP21-overexpressing (OE) iKPC cells comparing scramble control and MARK3 knockdown. (G,H) KRAS*-independent colony formation assay (G) and tumor formation assay (H) comparing iKPC cells overexpressing GFP and MARK3. For F and G, data are represented as mean ± SEM. See also Supplemental Figure S7.
Figure 5.
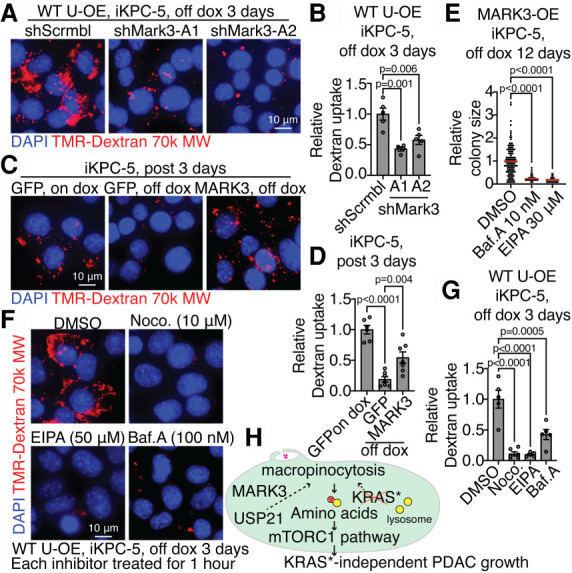
USP21 regulates macropinocytosis via MARK3. (A,B) Representative images (A) and the quantification of dextran particle uptake (B) comparing scramble control and MARK3 knockdown in WT USP21-overexpressing (OE) iKPC cells at day 3 after KRAS* extinction. (C,D) Representative images (C) and the quantification of dextran particle uptake (D) comparing GFP-overexpressing and MARK3-overexpressing iKPC cells at day 3 after KRAS* extinction. GFP-overexpressing iKPC cells with dox is positive control. (E) KRAS*-independent colony formation analysis comparing MARK3-overexpressing iKPC cells treated with DMSO, EIPA, and Baf.A. (F,G) Representative images (F) and the quantification of dextran particle uptake (G) comparing WT USP21-overexpressing iKPC cells treated with DMSO, nocodazole (Noco.), EIPA, and Baf.A at day 3 after KRAS* extinction. (H) Schematic graph illustrating mechanism of USP21 to support KRAS* bypass. For B, D, E, and G, data are represented as mean ± SEM. See also Supplemental Figure S8.
In this study, we identified USP21 as a potent driver of KRAS*-independent PDAC growth that sustains amino acid supply and the mTOR signaling pathway via MARK3-mediated up-regulation of macropinocytosis (Fig. 5H). The identification of these bypass mechanisms may help anticipate potential resistance to emerging anti-KRAS* therapies, particularly in those patients exhibiting amplification of the USP21 locus.
KRAS* signaling inhibition elevates autophagic flux (Bryant et al. 2019; Kinsey et al. 2019), which aligns with our observation of increased autophagosome formation following KRAS* extinction in PDAC. However, autophagy hyperactivation was found to be insufficient to provide enough amino acids or sustain mTOR signaling in KRAS*-extinguished PDAC cells. Instead, macropinocytosis proved to be required for KRAS*-independent tumor growth. Since lysosome activity is essential for both autophagy and macropinocytosis, lysosome inhibitors such as chloroquine (CQ) and hydroxychloroquine (HCQ) could block both processes to enhance the cytotoxic effect of KRAS* inhibitors and prevent resistance. Indeed, lysosome and KRAS* signaling inhibitors show synergistic antitumor activity in RAS-driven cancers (Bryant et al. 2019; Kinsey et al. 2019). Therefore, our work further supports clinical trials to evaluate the combination of KRAS and lysosome inhibitors in KRAS mutant cancers. While AATs are not consistently altered by USP21, it remains possible that alternative amino acid sourcing in addition to macropinocytosis could contribute to activation of the mTOR signaling pathway to support KRAS* bypass.
USP21 is up-regulated and frequently amplified in human PDAC (Hou et al. 2019). Our work identifies USP21 as a genetic factor that may influence responses to KRAS inhibitors. USP21 promotes oncogenesis via TCF7-mediated stemness and therefore serves as a possible therapeutic target whose inhibition may synergize with KRAS inhibitors in USP21-amplified/up-regulated PDAC patients. Notably, the dispensability of USP21 for mouse development (Pannu et al. 2015) strengthens the case for USP21 as a potential therapeutic target for cancer treatment. Thus, exploration of USP21 requirement in disease progression and KRAS* extinction resistance in spontaneous PDAC mouse models, and in the responses of PDAC patients receiving anti-KRAS* therapy, may further enhance our understanding of USP21's oncogenic roles and its potential as a prime or cooperative therapeutic target in PDAC.
Materials and methods
Transgenic mice
The iKPC PDAC mouse model has been described previously (Ying et al. 2012). All mouse-related experiments were reviewed and approved by the University of Texas MD Anderson Cancer Center's Institutional Animal Care and Use Committee (IACUC).
Cell culture
Establishment of primary iKPC PDAC cell lines and 2D and 3D cell culture was as described previously (Hou et al. 2020). We used tetracycline-free FBS (Takara) for cell culture. The PDAC colony size in Matrigel culture was quantified by ImageJ.
Plasmid information and lentivirus production
DNA sequence information for protein tags, shRNAs, sgRNA, and primers is listed in Supplemental Table S1. USP21 (BC090946.1) and MARK3 (NM_002376) were cloned in pHAGE lentivirus vector. HA and FLAG tags were added at the N terminus of the USP21 ORF and C terminus of the MARK3 ORF, respectively. HA-tagged ubiquitin was from Addgene. Information for USP21 variants NLS USP21 and NES USP21 was described in detail previously (Hou et al. 2019). Viruses were packaged using second-generation lentiviral systems.
In vivo cell transplant and tumor size measurement
Nude mice were purchased from Taconic or the Department of Experimental Radiation Oncology at MD Anderson Cancer Center. We transplanted half to 1 million iKPC cells subcutaneously or orthotopically in nude mice fed ad lib with normal water for KRAS* bypass assay or doxycycline water for KRAS*-dependent tumor growth. Subcutaneous tumor size was measured by caliper; orthotopic tumors were imaged by BLI or MRI imaging, and size was measured in ImageJ. Tumor volume was calculated as length × width × height/2.
RT-PCR, mRNA sequencing, and GSEA
The 7500 fast real-time PCR system was used to run RT-PCR. Data were analyzed by GraphPad Prism 7.0c. The parameter for mRNA sequencing was NGS 75-nt paired end using the Illumina next-generation sequencing HiSeq2000 instrument. Data were analyzed by GSEA software as previously described (Mootha et al. 2003; Subramanian et al. 2005). The data accession number is GSE178860.
Antibody information and protein assays
Antibody information is provided in Supplemental Table S2. Western blot, IHC, co-IP, and ubiquitination assays were performed as described previously (Hou et al. 2019).
Small molecule inhibitors, amino acids, and albumin
We purchased rapamycin, Torin-2, EIPA, nocodazole, and bafilomycin A from MedChemExpress, L-glutamine from Gibco, and bovine serum albumin (BSA) from Sigma. Concentrations and treatment times are shown in the figure legends.
Sample preparation for transmission electron microscopy
Samples were fixed with a solution containing 3% glutaraldehyde plus 2% paraformaldehyde in 0.1 M cacodylate buffer (pH 7.3), then washed in 0.1 M sodium cacodylate buffer and treated with 0.1% Millipore-filtered cacodylate-buffered tannic acid, postfixed with 1% buffered osmium, and stained en bloc with 1% Millipore-filtered uranyl acetate. The samples were dehydrated in increasing concentrations of ethanol, infiltrated, and embedded in LX-112 medium. The samples were polymerized for ∼3 d in a 60°C oven. Ultrathin sections were cut in a Leica Ultracut microtome (Leica), stained with uranyl acetate and lead citrate in a Leica EM stainer, and examined in a JEM 1010 transmission electron microscope (JEOL, USA, Inc.) at an accelerating voltage of 80 kV. Digital images were obtained using an AMT imaging system (Advanced Microscopy Techniques Corp.).
Metabolomic analysis at steady state, metabolic flux study, and NADPH detection
For metabolic flux study, we treated cells with isotope-labeled glucose (D-glucose-13C6 [≥99% atom; Cambridge Isotope Laboratories CLM-1396]) for 15 min prior to collection. Our sample preparation protocol was based on the one provided by the Mass Spectrometry Core at Beth Israel Deaconess Medical Center (Yuan et al. 2012, 2019). Briefly, cells were collected at the indicated time after aspirating off as much medium as possible. Four milliliters of 80% methanol was added to each 10-cm Petri dish. Dishes were immediately incubated for 15 min at −80°C, and then scraped on dry ice. Cells in methanol were transferred to 15-mL conical tubes on dry ice and centrifuged at full speed for 5 min at 4°C. Supernatant was transferred to new conical tubes as collection tubes on dry ice, while 500 µL of 80% methanol was added to resuspend the pellet. Mixtures were then transferred to 1.5-mL Eppendorf tubes on dry ice and centrifuged at full speed for 5 min at 4°C. Supernatant was transferred to collection tubes, and pellets were resuspended in 500 µL of 80% methanol and spun down for a second time. After pooling the three extractions, samples were completely dried by nitrogen evaporator. Samples were analyzed by AB/SCIEX6500/5500 QTRAP LC-MS/MS instrument at the Beth Israel Deaconess Medical Center Mass Spectrometry Core Facility.
NADPH assay was performed with the NADP/NADPH quantitation colorimetric kit (BioVision K347) according to the provided manufacturer's protocols.
Protein synthesis assay
Click-iT HPG Alexa Fluor 594 protein synthesis assay kit (Life Technologies, C10429) was used to detect newly synthesized proteins in iKPC cells. Images were captured using a Leica inverted microscope system (DMI8) and the signal intensity in the fluorescent channel was determined by ImageJ. The corrected total cell fluorescence [=integrated density − (area of selected cell × mean fluorescence of background readings)] was determined from 10 fields that were randomly selected from different regions across the entirety of each sample.
TMR-dextran assay
Cells were washed once in warmed PBS before incubation in serum-free RPMI medium with 1 mg/mL 70,000-MW TMR-dextran (Invitrogen D1818) for 30 min at 37°C. After incubation, cells were washed five times in cold PBS on ice and fixed in 4% polyformaldehyde promptly for 15 min. Cells were washed for another three times before mounting in VectaShield antifade mounting medium with DAPI (Vector Laboratories H-1200-10). Images were captured using a Leica inverted microscope system (DMI8) and analyzed using the “analyze particles” feature in ImageJ. The total particle area per cell was determined from three to six fields that were randomly selected from different regions across the entirety of each sample.
Glutamine deprivation assays
Cells were cultured in glutamine-free RPMI media supplemented with 10% dialyzed FBS and 0.2 mM glutamine. For rescue assays, 0.6% BSA was added to achieve a final concentration of total BSA at ∼0.8% in complete media. EIPA or DMSO was used as indicated. Images were captured using a Leica microscope system (DMIL LED) and colony size was analyzed using the “analyze particles” feature in ImageJ. The colony sizes were determined from three randomly selected fields from different regions across the entirety of each sample.
Small GTPase activity determination
We used G-LISA RhoA and Rac1 activation assay kits (Cytosleleton, Inc.) to detect active RhoA (BK-124) and Rac1 (K-128), respectively.
Statistical analysis
Statistical analysis was performed using the unpaired Student's t-test to generate two-tailed P-values, and nonparametric one-way ANOVA for group comparison.
Supplementary Material
Acknowledgments
We thank John M. Asara and Andrew Lemoff for technical assistance in metabolomic analysis; Kenneth Dunner Jr. for technical assistance in electron microscopy analysis; Howard Chang for technical assistance in tissue imaging; Zhaohui Xu, Ivonne Flores, Kun Zhao, Lucinette G. Marasigan, and Xiaoying Shang for mouse colony maintenance; and Dr. Haoqiang Ying, Dr. Guocan Wang, and Dr. Jian Hu for helpful discussions. MD Anderson's Small Animal Imaging Facility, Advanced Technology Genomics Core, High-Resolution Electron Microscopy Facility, and Metabolomics Facility were supported by Cancer Center Support Grant National Institutes of Health (NIH) P30 CA016672. P.H. is supported by the Seed Grant Program provided by the Hirshberg Foundation for Pancreatic Cancer Research. This project is supported by NIH R01 CA231349 (to Y.A.W.), NIH P01 CA117969 (to R.A.D.), and NIH R01 CA225955 (to R.A.D.).
Author contributions: R.A.D., Y.A.W., and P.H. conceived the study, performed the methodology, and acquired funding. P.H., X.M., Z.Y., Q.Z., L.T., P.L.L., W.Y., L.Y., X.Z., and Z.Y. performed the investigation and validated the results. P.H. wrote the original draft of the manuscript. R.A.D., D.S, A.C.K., and P.H. reviewed and edited the manuscript. D.S. reviewed the data. C.-J.W., J.L., and J.Z were responsible for the software used. S.J. maintained the mouse resources for the study. R.A.D. and Y.A.W. supervised the study.
Footnotes
Supplemental material is available for this article.
Article published online ahead of print. Article and publication date are online at http://www.genesdev.org/cgi/doi/10.1101/gad.348787.121.
Competing interest statement
A.C.K. has financial interests in Vescor Therapeutics, LLC. A.C.K. is an inventor on patents pertaining to KRAS-regulated metabolic pathways, redox control pathways in pancreatic cancer, targeting GOT1 as a therapeutic approach, and the autophagy control of iron metabolism. A.C.K. is on the Scientific Advisory Board of Rafael/Cornerstone Pharmaceuticals. A.C.K. is a consultant for Deciphera and Abbvie. R.A.D. is Founder and Advisor of Tvardi Therapeutics, Asylia Therapeutics, Stellanova Therapeutics, Nirogy Therapeutics, and Sporos Bioventures.
References
- Aguirre AJ, Bardeesy N, Sinha M, Lopez L, Tuveson DA, Horner J, Redston MS, DePinho RA. 2003. Activated Kras and Ink4a/Arf deficiency cooperate to produce metastatic pancreatic ductal adenocarcinoma. Genes Dev 17: 3112–3126. 10.1101/gad.1158703 [DOI] [PMC free article] [PubMed] [Google Scholar]
- Bengtsson A, Andersson R, Ansari D. 2020. The actual 5-year survivors of pancreatic ductal adenocarcinoma based on real-world data. Sci Rep 10: 16425. 10.1038/s41598-020-73525-y [DOI] [PMC free article] [PubMed] [Google Scholar]
- Bröer S, Bröer A. 2017. Amino acid homeostasis and signalling in mammalian cells and organisms. Biochem J 474: 1935–1963. 10.1042/BCJ20160822 [DOI] [PMC free article] [PubMed] [Google Scholar]
- Bryant KL, Stalnecker CA, Zeitouni D, Klomp JE, Peng S, Tikunov AP, Gunda V, Pierobon M, Waters AM, George SD, et al. 2019. Combination of ERK and autophagy inhibition as a treatment approach for pancreatic cancer. Nat Med 25: 628–640. 10.1038/s41591-019-0368-8 [DOI] [PMC free article] [PubMed] [Google Scholar]
- Commisso C, Davidson SM, Soydaner-Azeloglu RG, Parker SJ, Kamphorst JJ, Hackett S, Grabocka E, Nofal M, Drebin JA, Thompson CB, et al. 2013. Macropinocytosis of protein is an amino acid supply route in Ras-transformed cells. Nature 497: 633–637. 10.1038/nature12138 [DOI] [PMC free article] [PubMed] [Google Scholar]
- Condon KJ, Sabatini DM. 2019. Nutrient regulation of mTORC1 at a glance. J Cell Sci 132: jcs222570. 10.1242/jcs.222570 [DOI] [PMC free article] [PubMed] [Google Scholar]
- Egami Y, Taguchi T, Maekawa M, Arai H, Araki N. 2014. Small GTPases and phosphoinositides in the regulatory mechanisms of macropinosome formation and maturation. Front Physiol 5: 374. 10.3389/fphys.2014.00374 [DOI] [PMC free article] [PubMed] [Google Scholar]
- Hay N. 2016. Reprogramming glucose metabolism in cancer: can it be exploited for cancer therapy? Nat Rev Cancer 16: 635–649. 10.1038/nrc.2016.77 [DOI] [PMC free article] [PubMed] [Google Scholar]
- Hingorani SR, Petricoin EF, Maitra A, Rajapakse V, King C, Jacobetz MA, Ross S, Conrads TP, Veenstra TD, Hitt BA, et al. 2003. Preinvasive and invasive ductal pancreatic cancer and its early detection in the mouse. Cancer Cell 4: 437–450. 10.1016/S1535-6108(03)00309-X [DOI] [PubMed] [Google Scholar]
- Hou P, Ma X, Zhang Q, Wu CJ, Liao W, Li J, Wang H, Zhao J, Zhou X, Guan C, et al. 2019. USP21 deubiquitinase promotes pancreas cancer cell stemness via Wnt pathway activation. Genes Dev 33: 1361–1366. 10.1101/gad.326314.119 [DOI] [PMC free article] [PubMed] [Google Scholar]
- Hou P, Kapoor A, Zhang Q, Li J, Wu CJ, Li J, Lan Z, Tang M, Ma X, Ackroyd JJ, et al. 2020. Tumor microenvironment remodeling enables bypass of oncogenic KRAS dependency in pancreatic cancer. Cancer Discov 10: 1058–1077. 10.1158/2159-8290.CD-19-0597 [DOI] [PMC free article] [PubMed] [Google Scholar]
- Kamphorst JJ, Nofal M, Commisso C, Hackett SR, Lu W, Grabocka E, Vander Heiden MG, Miller G, Drebin JA, Bar-Sagi D, et al. 2015. Human pancreatic cancer tumors are nutrient poor and tumor cells actively scavenge extracellular protein. Cancer Res 75: 544–553. 10.1158/0008-5472.CAN-14-2211 [DOI] [PMC free article] [PubMed] [Google Scholar]
- Kapoor A, Yao W, Ying H, Hua S, Liewen A, Wang Q, Zhong Y, Wu CJ, Sadanandam A, Hu B, et al. 2014. Yap1 activation enables bypass of oncogenic Kras addiction in pancreatic cancer. Cell 158: 185–197. 10.1016/j.cell.2014.06.003 [DOI] [PMC free article] [PubMed] [Google Scholar]
- Kimmelman AC. 2015. Metabolic dependencies in RAS-driven cancers. Clin Cancer Res 21: 1828–1834. 10.1158/1078-0432.CCR-14-2425 [DOI] [PMC free article] [PubMed] [Google Scholar]
- Kinsey CG, Camolotto SA, Boespflug AM, Guillen KP, Foth M, Truong A, Schuman SS, Shea JE, Seipp MT, Yap JT, et al. 2019. Protective autophagy elicited by RAF → MEK → ERK inhibition suggests a treatment strategy for RAS-driven cancers. Nat Med 25: 620–627. 10.1038/s41591-019-0367-9 [DOI] [PMC free article] [PubMed] [Google Scholar]
- Matenia D, Mandelkow EM. 2009. The tau of MARK: a polarized view of the cytoskeleton. Trends Biochem Sci 34: 332–342. 10.1016/j.tibs.2009.03.008 [DOI] [PubMed] [Google Scholar]
- Mootha VK, Lindgren CM, Eriksson KF, Subramanian A, Sihag S, Lehar J, Puigserver P, Carlsson E, Ridderstråle M, Laurila E, et al. 2003. PGC-1α-responsive genes involved in oxidative phosphorylation are coordinately downregulated in human diabetes. Nat Genet 34: 267–273. 10.1038/ng1180 [DOI] [PubMed] [Google Scholar]
- Palm W, Park Y, Wright K, Pavlova NN, Tuveson DA, Thompson CB. 2015. The utilization of extracellular proteins as nutrients Is suppressed by mTORC1. Cell 162: 259–270. 10.1016/j.cell.2015.06.017 [DOI] [PMC free article] [PubMed] [Google Scholar]
- Pannu J, Belle JI, Förster M, Duerr CU, Shen S, Kane L, Harcourt K, Fritz JH, Clare S, Nijnik A. 2015. Ubiquitin specific protease 21 is dispensable for normal development, hematopoiesis and lymphocyte differentiation. PLoS One 10: e0117304. 10.1371/journal.pone.0117304 [DOI] [PMC free article] [PubMed] [Google Scholar]
- Perera RM, Stoykova S, Nicolay BN, Ross KN, Fitamant J, Boukhali M, Lengrand J, Deshpande V, Selig MK, Ferrone CR, et al. 2015. Transcriptional control of autophagy-lysosome function drives pancreatic cancer metabolism. Nature 524: 361–365. 10.1038/nature14587 [DOI] [PMC free article] [PubMed] [Google Scholar]
- Recouvreux MV, Commisso C. 2017. Macropinocytosis: a metabolic adaptation to nutrient stress in cancer. Front Endocrinol (Lausanne) 8: 261. 10.3389/fendo.2017.00261 [DOI] [PMC free article] [PubMed] [Google Scholar]
- Shao DD, Xue W, Krall EB, Bhutkar A, Piccioni F, Wang X, Schinzel AC, Sood S, Rosenbluh J, Kim JW, et al. 2014. KRAS and YAP1 converge to regulate EMT and tumor survival. Cell 158: 171–184. 10.1016/j.cell.2014.06.004 [DOI] [PMC free article] [PubMed] [Google Scholar]
- Sowa ME, Bennett EJ, Gygi SP, Harper JW. 2009. Defining the human deubiquitinating enzyme interaction landscape. Cell 138: 389–403. 10.1016/j.cell.2009.04.042 [DOI] [PMC free article] [PubMed] [Google Scholar]
- Subramanian A, Tamayo P, Mootha VK, Mukherjee S, Ebert BL, Gillette MA, Paulovich A, Pomeroy SL, Golub TR, Lander ES, et al. 2005. Gene set enrichment analysis: a knowledge-based approach for interpreting genome-wide expression profiles. Proc Natl Acad Sci 102: 15545–15550. 10.1073/pnas.0506580102 [DOI] [PMC free article] [PubMed] [Google Scholar]
- Yan L, Tu B, Yao J, Gong J, Carugo A, Bristow CA, Wang Q, Zhu C, Dai B, Kang Y, et al. 2021. Targeting glucose metabolism sensitizes pancreatic cancer to MEK inhibition. Cancer Res 81: 4054–4065. 10.1158/0008-5472.CAN-20-3792 [DOI] [PMC free article] [PubMed] [Google Scholar]
- Yang S, Wang X, Contino G, Liesa M, Sahin E, Ying H, Bause A, Li Y, Stommel JM, Dell'antonio G, et al. 2011. Pancreatic cancers require autophagy for tumor growth. Genes Dev 25: 717–729. 10.1101/gad.2016111 [DOI] [PMC free article] [PubMed] [Google Scholar]
- Yao W, Rose JL, Wang W, Seth S, Jiang H, Taguchi A, Liu J, Yan L, Kapoor A, Hou P, et al. 2019. Syndecan 1 is a critical mediator of macropinocytosis in pancreatic cancer. Nature 568: 410–414. 10.1038/s41586-019-1062-1 [DOI] [PMC free article] [PubMed] [Google Scholar]
- Ying H, Kimmelman AC, Lyssiotis CA, Hua S, Chu GC, Fletcher-Sananikone E, Locasale JW, Son J, Zhang H, Coloff JL, et al. 2012. Oncogenic Kras maintains pancreatic tumors through regulation of anabolic glucose metabolism. Cell 149: 656–670. 10.1016/j.cell.2012.01.058 [DOI] [PMC free article] [PubMed] [Google Scholar]
- Yuan M, Breitkopf SB, Yang X, Asara JM. 2012. A positive/negative ion-switching, targeted mass spectrometry-based metabolomics platform for bodily fluids, cells, and fresh and fixed tissue. Nat Protoc 7: 872–881. 10.1038/nprot.2012.024 [DOI] [PMC free article] [PubMed] [Google Scholar]
- Yuan M, Kremer DM, Huang H, Breitkopf SB, Ben-Sahra I, Manning BD, Lyssiotis CA, Asara JM. 2019. Ex vivo and in vivo stable isotope labelling of central carbon metabolism and related pathways with analysis by LC-MS/MS. Nat Protoc 14: 313–330. 10.1038/s41596-018-0102-x [DOI] [PMC free article] [PubMed] [Google Scholar]
Associated Data
This section collects any data citations, data availability statements, or supplementary materials included in this article.