

Abstract
Background
The number of patients living after a cancer diagnosis is increasing, especially after thyroid cancer (TC). This study aims at evaluating both the risk of a second primary cancer (SPC) in TC patients and the risk of TC as a SPC.
Methods
We analyzed two population‐based cohorts of individuals with TC or other neoplasms diagnosed between 1998 and 2012, in 28 Italian areas covered by population‐based cancer registries. Standardized incidence ratios (SIRs) of SPC were stratified by sex, age, and time since first cancer.
Results
A total of 38,535 TC patients and 1,329,624 patients with other primary cancers were included. The overall SIR was 1.16 (95% CI: 1.12–1.21) for SPC in TC patients, though no increase was shown for people with follicular (1.06) and medullary (0.95) TC. SPC with significantly increased SIRs was bone/soft tissue (2.0), breast (1.2), prostate (1.4), kidney (2.2), and hemolymphopoietic (1.4) cancers. The overall SIR for TC as a SPC was 1.49 (95% CI: 1.42–1.55), similar for all TC subtypes, and it was significantly increased for people diagnosed with head and neck (2.1), colon–rectum (1.4), lung (1.8), melanoma (2.0), bone/soft tissue (2.8), breast (1.3), corpus uteri (1.4), prostate (1.5), kidney (3.2), central nervous system (2.3), and hemolymphopoietic (1.8) cancers.
Conclusions
The increased risk of TC after many other neoplasms and of few SPC after TC questions the best way to follow‐up cancer patients, avoiding overdiagnosis and overtreatment for TC and, possibly, for other malignancies.
Keywords: cancer survivors, Italy, population‐based cancer registries, relative risk, second primary cancer, thyroid cancer
This is the first study able to calculate population‐based risk of thyroid cancers as a first or second tumor separately for different thyroid cancer histological types (i.e., follicular, medullary, and poorly differentiated). In a context of a large proportion of thyroid cancer cases due to overdiagnosis, the findings of the present study may help to more focused primary prevention and surveillance for side effects of treatments, thus avoiding overtreatment, particularly among younger women.
1. INTRODUCTION
The number of patients living after a cancer diagnosis is rising in Italy, 1 as well as in several other countries. 2 In particular, one of the largest 10‐year increases is foreseen for thyroid cancer (TC) patients (+79% between 2010 and 2020), 1 largely due to the impact of overdiagnosis on the rapidly increasing TC incidence, 3 , 4 the modest improvements of survival, 5 and substantially stable mortality rates. 3 The vast majority of people living after a TC diagnosis have the same life expectancy as the general population (i.e., they are cured), 6 in particular those who were overdiagnosed. 7 Notably, overdiagnosis of asymptomatic TC accounted for 75% of cases in Italian women and 63% in Italian men, between 1998 and 2012. 3
In Italy, more than 3.4 million people are living after a cancer diagnosis other than TC. 1 They may be at risk of developing a new primary cancer due to several reasons, including common etiologic factors (i.e., environmental exposures, genetics, and lifestyles), late effects of cancer treatments, and, possibly, enhanced surveillance. 8 , 9 In addition, several studies from Europe and the United States have reported a substantial risk of TC detection during other cancers follow‐up. 10 , 11 , 12 , 13 A higher than expected incidence rate of second primary cancer (SPC) in TC patients has been reported and recently confirmed. 13 , 14 In particular, an increased incidence has been consistently reported for breast cancer, 15 , 16 , 17 , 18 , 19 kidney cancer, 10 , 12 , 19 , 20 , 21 and lymphomas/leukemias. 10 , 12 , 21 , 22 The present study aimed to provide updated estimates of the risk of SPC after TC, as well as the risk of TC as SPC. In addition, we comprehensively explored the risks of TC as a first or SPC by sex, age, and time since first diagnosis. Evidence on the combination of TC with other cancers, as a first and second primary one, may help clarify whether the association is due to shared genetic or lifestyle risk factors, close anatomic proximity, treatment of the first cancer, or intensity of diagnostic activities.
2. MATERIALS AND METHODS
2.1. Study population
We analyzed data collected in 28 population‐based Italian cancer registries (CRs), covering over 22 million inhabitants (39% of the Italian population) (Appendix 1). All included CRs had been active for at least 10 years in the period of interest, that is 1998–2012. 3
First cancer and SPC were classified using international classifications for topography and morphology (ICD10 and ICD‐O‐3). 23 , 24 We analyzed 36 cancer sites or types (Appendix 2), but we excluded non‐melanoma skin cancer, cases detected at autopsy, and those known from death certificate only or with follow‐up time equal to zero. Third or subsequent malignant tumors were very rare (0.3% of all subjects) and cases diagnosed at the age of 85 years or more were, therefore, excluded. 24
Two cohorts were analyzed:
Cohort 1 (SPC after TC): included patients with a TC diagnosis evaluated for the incidence of a SPC other than TC, with overall 276,100 person‐years of observation (216,431 in women and 59,669 in men).
Cohort 2 (TC as SPC): included patients with cancers other than TC evaluated for TC incidence. TC cases diagnosed as a first tumor were excluded due to the international rules for multiple primaries definition adopted by Italian CRs. 24 , 25 Cohort 2 included 6,984,420 person‐years of observation (3,643,622 in women and 3,340,798 in men).
Observation started on the date of first cancer diagnosis and ended on the first date among: SPC, last known date of vital status, death, 31 December 2012, or the end of the most recent available year of full registration (Appendix 1).
2.2. Statistical analysis
Person‐years at risk (PY) were computed by first cancer site, histological type of TC, (i.e., papillary, follicular, medullary, and poorly differentiated including anaplastic), geographic area (North, Center, and South and Islands), sex, age group (0–4 years, …, 80–84 years), and calendar‐year group (1998–2002, 2003–2007, and 2008–2012). Observed cases included incident cancers reported to CRs during the above‐defined person‐years at risk. The expected number of cancer cases was computed by multiplying the cumulative person‐years of observation by the specific incidence rates for the strata in which person‐years were distributed. Observed SPC incidence among cancer patients was compared with expected numbers by means of standardized incidence ratio (SIR). Byar's approximation was applied to the exact Poisson distribution to calculate 95% confidence interval (CI).
SIRs were stratified by sex, follow‐up time (<2, 2–11, 12–35, 36–59, and 60+ months), and age at first cancer diagnosis (0–34, 35–54, and 55–84 years). This age stratification was chosen since the peak of TC incidence in Italy occurred in middle age, with approximately the same number of TC cases at ages 35–54 (17,043) and 55–84 (15,099) years (Appendix 1).
To minimize the impact of “intensive screening” in concurrence with the first cancer diagnosis, 24 , 25 , 26 which may detect other pre‐existing tumors, observed and expected cases during the synchronous period (2 months) were shown only in the analysis by follow‐up duration. All the other SIRs were, therefore, computed excluding observed cases and person‐years in the first 2 months after the first tumor. Excess absolute risk (EAR) was computed (with 95% CIs) subtracting the expected number of subsequent cancers in the general population from observed number; the difference was then divided by the PY and the number of cancer cases in excess (or deficit) was expressed per 1,000 PY. All analyses were conducted using the “MP‐SIR” session of SEER*Stat 8.3.6. 27
3. RESULTS
The study populations included 1,406,694 patients who had been diagnosed with cancer below the age of 85 years, between 1998 and 2012 (38,535 patients with TC and 1,368,159 with any other primary cancer) (Appendix 1), followed for a maximum of 15 years (median follow‐up <7 years). After TC diagnosis, the SIR of other cancers diagnosed in <2 months‐period (i.e., synchronous) was high (1.8, 95% CI: 1.4–2.3 in women and 2.7, 95% CI: 2.0–3.6 in men), even if they represented only 4% of all the tumors (Figure 1). At 12–59 months after TC diagnosis, the SIRs in both sexes were between 1.1 and 1.3, and they remained 1.2 even 5 years after TC. The SIR for TC <2 months after other neoplasm (8% of all such cases) was 2.6 in women and 6.6 in men, and it gradually decreased up to 1.3 (95% CI: 1.2–1.4) in women and 1.5 (95% CI: 1.3–1.7) in men after 5 or more years since first cancer diagnosis (Figure 1).
FIGURE 1.
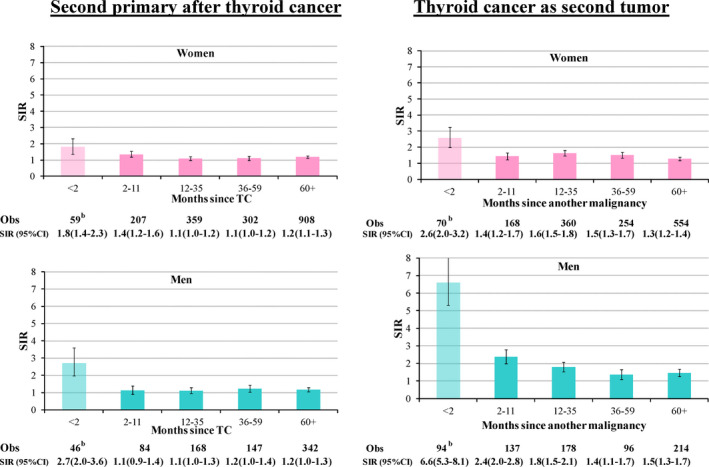
Riska of second primary cancer after thyroid cancer and risk of thyroid cancer as second tumor by time since the first tumor. Italy, 1998–2012. Obs, observed cases. aMeasured as standardized incidence ratio (SIR) and 95% confidence intervals (CIs). bExcluded from subsequent analyses (4% of cancer subsequent to TC and 8% of TC after another malignancy)
In Italy, the overall SIR of second metachronous (i.e., diagnosed after >2 months since TC) cancers after TC was 1.16 (95% CI: 1.12–1.21) (Table 1). Notably, for patients with follicular or medullary TC the SIRs were not higher than the general population (SIRs = 1.06 and 0.95, respectively). For all cancers and most individual cancer types, SIRs after TC were consistent in men and women. Breast cancer represented 35% of all cancers diagnosed after TC in women (628/1776, SIR = 1.2, 1.1–1.3), while prostate was 24% of all cancers in men (SIR = 1.4, 1.2–1.6). After TC, no significant SIR increase emerged for cancers of colon–rectum (286 cases, SIR = 1.0), lung (204 cases, SIR 1.0), head and neck (41 cases SIR = 0.8), and female genital organs (endometrial SIR = 1.1, cervix 0.7 or ovary 1.2). Conversely, elevated SIRs were observed for cancers of the kidney (SIR = 2.2), soft tissue cancers (SIR = 2.1), and the combination of hemolymphopoietic neoplasms (SIR = 1.4), as well as for most of the hemolymphopoietic subtypes (SIR = 2.7 for acute lymphoid leukemia, 1.6 for follicular non‐Hodgkin lymphomas, 1.5 for chronic lymphoid leukemia, and 1.4 for myelomas).
TABLE 1.
Risk a of second primary cancer after thyroid cancer by cancer type and sex. Italy, 1998–2012
| Women (PY 216,431) | Men (PY 59,669) | Women and men (PY 276,100) | ||||||||||
|---|---|---|---|---|---|---|---|---|---|---|---|---|
| Obs | SIR | 95% | CI | Obs | SIR | 95% | CI | Obs | SIR | 95% | CI | |
| All but skin and thyroid, after TC | 1776 | 1.16 | 1.11 | 1.22 | 741 | 1.16 | 1.08 | 1.25 | 2517 | 1.16 | 1.12 | 1.21 |
| After papillary TC | 1403 | 1.19 | 1.13 | 1.26 | 533 | 1.19 | 1.10 | 1.30 | 1936 | 1.19 | 1.14 | 1.25 |
| After follicular TC | 195 | 1.03 | 0.89 | 1.18 | 112 | 1.14 | 0.94 | 1.37 | 307 | 1.06 | 0.95 | 1.19 |
| After medullary TC | 57 | 1.02 | 0.77 | 1.32 | 40 | 0.87 | 0.62 | 1.19 | 97 | 0.95 | 0.77 | 1.16 |
| After poorly differentiated b TC | 24 | 2.07 | 1.32 | 3.08 | 11 | 1.25 | 0.62 | 2.23 | 35 | 1.71 | 1.19 | 2.38 |
| Second primary cancer (after TC) | ||||||||||||
| Head and neck | 11 | 0.5 | 0.3 | 0.9 | 30 | 1.0 | 0.7 | 1.5 | 41 | 0.8 | 0.6 | 1.1 |
| Oral cavity | 5 | 0.5 | 0.1 | 1.1 | 3 | 0.4 | 0.1 | 1.2 | 8 | 0.4 | 0.2 | 0.9 |
| Pharynx | 1 | 0.2 | 0.0 | 1.0 | 4 | 0.5 | 0.1 | 1.4 | 5 | 0.4 | 0.1 | 0.9 |
| Larynx | 5 | 1.0 | 0.3 | 2.4 | 23 | 1.6 | 1.0 | 2.4 | 28 | 1.4 | 1.0 | 2.1 |
| Esophagus | 5 | 0.9 | 0.3 | 2.1 | 6 | 0.9 | 0.3 | 2.0 | 11 | 0.9 | 0.5 | 1.7 |
| Stomach | 59 | 1.0 | 0.8 | 1.3 | 36 | 1.2 | 0.8 | 1.6 | 95 | 1.1 | 0.9 | 1.3 |
| Colon and rectum | 204 | 1.0 | 0.9 | 1.2 | 82 | 1.0 | 0.8 | 1.2 | 286 | 1.0 | 0.9 | 1.1 |
| Colon | 140 | 1.0 | 0.8 | 1.2 | 64 | 1.1 | 0.9 | 1.4 | 204 | 1.0 | 0.9 | 1.2 |
| Rectum | 64 | 1.1 | 0.9 | 1.4 | 18 | 0.7 | 0.4 | 1.0 | 82 | 1.0 | 0.8 | 1.2 |
| Liver | 27 | 0.9 | 0.6 | 1.2 | 21 | 0.8 | 0.5 | 1.2 | 48 | 0.8 | 0.6 | 1.1 |
| Gallbladder | 16 | 0.7 | 0.4 | 1.2 | 4 | 0.7 | 0.2 | 1.7 | 20 | 0.7 | 0.4 | 1.1 |
| Pancreas | 59 | 1.2 | 0.9 | 1.6 | 11 | 0.6 | 0.3 | 1.1 | 70 | 1.1 | 0.8 | 1.3 |
| Lung | 116 | 1.2 | 1.0 | 1.5 | 88 | 0.9 | 0.7 | 1.1 | 204 | 1.0 | 0.9 | 1.2 |
| Melanoma | 45 | 1.0 | 0.8 | 1.4 | 19 | 1.3 | 0.8 | 2.0 | 64 | 1.1 | 0.8 | 1.4 |
| Mesothelioma | 4 | 1.0 | 0.3 | 2.7 | 8 | 2.1 | 0.9 | 4.2 | 12 | 1.6 | 0.8 | 2.7 |
| Kaposi sarcoma | 1 | 0.6 | 0.0 | 3.6 | 0 | 0.0 | 0.0 | 2.2 | 1 | 0.3 | 0.0 | 1.7 |
| Bone and soft tissue | 17 | 1.8 | 1.1 | 2.9 | 9 | 2.5 | 1.1 | 4.7 | 26 | 2.0 | 1.3 | 3.0 |
| Soft tissue | 13 | 1.8 | 1.0 | 3.1 | 8 | 2.8 | 1.2 | 5.6 | 21 | 2.1 | 1.3 | 3.2 |
| Bone | 4 | 2.0 | 0.5 | 5.0 | 1 | 1.2 | 0.0 | 6.9 | 5 | 1.8 | 0.6 | 4.1 |
| Breast | 628 | 1.2 | 1.1 | 1.3 | 1 | 0.7 | 0.0 | 3.8 | 629 | 1.2 | 1.1 | 1.3 |
| Corpus uteri | 93 | 1.1 | 0.9 | 1.4 | 0 | 93 | 1.1 | 0.9 | 1.4 | |||
| Cervix uteri | 18 | 0.7 | 0.4 | 1.1 | 0 | 18 | 0.7 | 0.4 | 1.1 | |||
| Ovary | 62 | 1.2 | 0.9 | 1.5 | 0 | 62 | 1.2 | 0.9 | 1.5 | |||
| Prostate | 0 | 178 | 1.4 | 1.2 | 1.6 | 178 | 1.4 | 1.2 | 1.6 | |||
| Testis | 0 | 6 | 1.6 | 0.6 | 3.5 | 6 | 1.6 | 0.6 | 3.5 | |||
| Kidney and renal pelvis | 69 | 1.9 | 1.5 | 2.4 | 59 | 2.5 | 1.9 | 3.3 | 128 | 2.2 | 1.8 | 2.6 |
| Urinary bladder | 53 | 1.2 | 0.9 | 1.6 | 64 | 1.0 | 0.7 | 1.2 | 117 | 1.1 | 0.9 | 1.3 |
| Central nervous system | 17 | 0.7 | 0.4 | 1.2 | 15 | 1.6 | 0.9 | 2.6 | 32 | 1.0 | 0.7 | 1.4 |
| Hemolymphopoietic | 171 | 1.5 | 1.2 | 1.7 | 62 | 1.3 | 1.0 | 1.7 | 233 | 1.4 | 1.2 | 1.6 |
| Hodgkin lymphoma | 8 | 1.2 | 0.5 | 2.3 | 3 | 1.1 | 0.2 | 3.3 | 11 | 1.2 | 0.6 | 2.1 |
| Non‐Hodgkin lymphoma | 72 | 1.3 | 1.0 | 1.6 | 26 | 1.2 | 0.8 | 1.8 | 98 | 1.3 | 1.0 | 1.5 |
| Myeloma | 36 | 1.6 | 1.1 | 1.2 | 9 | 1.1 | 0.5 | 2.0 | 45 | 1.4 | 1.1 | 1.9 |
| CLL‐SLL | 19 | 1.4 | 0.8 | 2.2 | 12 | 1.8 | 0.9 | 3.1 | 31 | 1.5 | 1.0 | 2.2 |
| NHL, DLBC | 16 | 0.9 | 0.5 | 1.5 | 6 | 1.0 | 0.4 | 2.1 | 22 | 0.9 | 0.6 | 1.4 |
| NHL, Follicular | 17 | 1.6 | 1.0 | 2.6 | 5 | 1.7 | 0.5 | 3.9 | 22 | 1.6 | 1.0 | 2.5 |
| Acute L. Leukemia | 7 | 3.3 | 1.3 | 6.8 | 1 | 1.3 | 0.0 | 7.0 | 8 | 2.7 | 1.2 | 5.4 |
| Other and ill defined | 101 | 1.1 | 0.9 | 1.3 | 42 | 1.2 | 0.9 | 1.6 | 143 | 1.1 | 0.9 | 1.3 |
PY, Person‐years; Obs, observed cases. NHL, Non‐Hodgkin lymphoma; CLL‐SLL, chronic lymphoid leukemia‐small lymphocytic lymphoma; DLBC, diffuse large B‐cell.
Statistical significant associations are highlighted in bold.
Measured as standardized incidence ratio (SIR) and 95% confidence intervals (CIs). Age 0–84 years; second primary cancers diagnosed <2 months after first one were excluded.
Poorly differentiated including anaplastic.
For younger TC patients (age < 35 years), SIRs of all subsequent cancer types were 1.53 (1.27–1.83) (Table 2), 1.45 in women and 1.93 in men (Appendix 3). SIR decreased with aging to 1.12 (1.06–1.17) in TC patients aged 55 years or more (Table 2). This age‐related pattern was present for hemolymphopoietic neoplasms (SIR = 2.0 below 35 years, 1.3 at ≥ 55 years) and for prostate (1.7 at age 35–54 and 1.4 at ≥ 55 years) (Appendix 3). Variation according to age was not observed in women for secondary breast cancer (SIR ~1.2 at all age groups), melanoma, colorectal, or kidney cancer (SIR ~2 in all age groups).
TABLE 2.
Risk a of second primary cancer after thyroid cancer (TC) by cancer type and age. Italy, 1998–2012
| Age at first cancer (TC) | ||||||||||||
|---|---|---|---|---|---|---|---|---|---|---|---|---|
| 0–34 years | 35–54 years | 55–84 years | ||||||||||
| Obs | SIR | 95% | CI | Obs | SIR | 95% | CI | Obs | SIR | 95% | CI | |
| All but skin and thyroid, after TC | 123 | 1.53 | 1.27 | 1.83 | 833 | 1.21 | 1.13 | 1.29 | 1561 | 1.12 | 1.06 | 1.17 |
| After papillary TC | 102 | 1.56 | 1.27 | 1.89 | 683 | 1.23 | 1.14 | 1.32 | 1151 | 1.15 | 1.08 | 1.22 |
| After follicular TC | 13 | 1.51 | 0.80 | 2.58 | 80 | 1.11 | 0.88 | 1.38 | 214 | 1.03 | 0.90 | 1.18 |
| After medullary TC | 4 | 2.01 | 0.54 | 5.16 | 18 | 0.88 | 0.52 | 1.39 | 75 | 0.95 | 0.74 | 1.19 |
| After poorly differentiated b TC | 1 | 9.19 | 0.12 | 51.14 | 2 | 1.00 | 0.11 | 3.61 | 32 | 1.75 | 1.19 | 2.46 |
| Second primary cancer (after TC) c | ||||||||||||
| Head and neck | 3 | 2.1 | 0.4 | 6.0 | 10 | 0.5 | 0.3 | 1.0 | 28 | 0.9 | 0.6 | 1.3 |
| Stomach | 1 | 0.6 | 0.0 | 3.5 | 19 | 1.0 | 0.6 | 1.6 | 75 | 1.1 | 0.9 | 1.4 |
| Colon and rectum | 9 | 1.9 | 0.9 | 3.6 | 58 | 0.8 | 0.6 | 1.0 | 219 | 1.1 | 0.9 | 1.2 |
| Liver | 1 | 1.5 | 0.0 | 8.6 | 5 | 0.4 | 0.1 | 1.0 | 42 | 0.9 | 0.7 | 1.2 |
| Pancreas | 0 | 0.0 | 0.0 | 4.5 | 19 | 1.3 | 0.8 | 2.1 | 51 | 1.0 | 0.7 | 1.3 |
| Lung | 3 | 1.2 | 0.2 | 3.5 | 58 | 1.2 | 0.9 | 1.5 | 143 | 1.0 | 0.8 | 1.2 |
| Melanoma | 14 | 1.8 | 1.0 | 3.1 | 18 | 0.7 | 0.4 | 1.1 | 32 | 1.3 | 0.9 | 1.8 |
| Breast | 36 | 1.2 | 0.9 | 1.7 | 295 | 1.3 | 1.1 | 1.4 | 298 | 1.2 | 1.1 | 1.3 |
| Corpus uteri | 5 | 2.5 | 0.8 | 5.8 | 45 | 1.4 | 1.0 | 1.8 | 43 | 0.9 | 0.6 | 1.2 |
| Ovary | 5 | 1.9 | 0.6 | 4.4 | 26 | 1.2 | 0.8 | 1.8 | 31 | 1.1 | 0.7 | 1.6 |
| Prostate | 0 | 0.0 | 0.0 | 6.8 | 38 | 1.7 | 1.2 | 2.4 | 140 | 1.4 | 1.1 | 1.6 |
| Kidney and renal pelvis | 4 | 2.2 | 0.6 | 5.7 | 47 | 2.6 | 1.9 | 3.5 | 77 | 1.9 | 1.5 | 2.4 |
| Urinary bladder | 1 | 0.6 | 0.0 | 3.2 | 39 | 1.6 | 1.1 | 2.1 | 77 | 0.9 | 0.7 | 1.2 |
| Central nervous system | 3 | 1.5 | 0.3 | 4.3 | 12 | 1.1 | 0.6 | 1.9 | 17 | 0.9 | 0.5 | 1.4 |
| Hemolymphopoietic | 19 | 2.0 | 1.2 | 3.2 | 71 | 1.4 | 1.1 | 1.8 | 143 | 1.3 | 1.1 | 1.6 |
| Non‐Hodgkin lymphoma | 6 | 1.5 | 0.6 | 3.3 | 25 | 1.0 | 0.6 | 1.5 | 67 | 1.4 | 1.1 | 1.7 |
| Myeloma | 1 | 2.0 | 0.0 | 11.1 | 13 | 1.7 | 0.9 | 2.8 | 31 | 1.4 | 0.9 | 1.9 |
| Leukemia | 7 | 3.3 | 1.3 | 6.8 | 28 | 2.2 | 1.5 | 3.2 | 44 | 1.4 | 1.0 | 1.9 |
Obs, observed cases.
Statistical significant associations are highlighted in bold.
Measured as standardized incidence ratio (SIR) and 95% confidence intervals (CIs). Men and women; second primary cancers diagnoses <2 months after first one were excluded.
Poorly differentiated including anaplastic.
Cancer types with >30 cases in men and women.
TC as SPC was diagnosed more frequently than in the general population: overall SIR = 1.49 (95% CI: 1.42–1.55), 1.42 in women and 1.67 in men (Table 3). SIR ranged between 1.35 for follicular TC and 1.61 for medullary TC. SIR of TC after female breast cancer was 1.3 (1.2–1.4) and increased SIRs were also found after acute lymphoid leukemia (SIR = 6.1), bone cancers (4.3), kidney cancers (3.2), Hodgkin lymphomas (2.8), head and neck cancers (2.1), melanoma (2.0), lung cancers (1.8), all hemolymphopoietic neoplasms (1.8), prostate (1.5), colorectal (1.4), and endometrial cancers (1.4) (Table 3).
TABLE 3.
Risk a of thyroid cancers (TC) as second tumor by first cancer type and sex. Italy, 1998–2012
| Women (PY 3,643,622) | Men (PY 3,340,798) | Women and Men (PY 6,984,420) | ||||||||||
|---|---|---|---|---|---|---|---|---|---|---|---|---|
| Obs | SIR | 95% | CI | Obs | SIR | 95% | CI | Obs | SIR | 95% | CI | |
| TC after all neoplasms, but skin and TC | 1336 | 1.42 | 1.34 | 1.49 | 625 | 1.67 | 1.54 | 1.80 | 1961 | 1.49 | 1.42 | 1.55 |
| Papillary TC, as second | 1043 | 1.44 | 1.36 | 1.53 | 439 | 1.80 | 1.64 | 1.98 | 1482 | 1.53 | 1.46 | 1.61 |
| Follicular TC, as second | 117 | 1.40 | 1.16 | 1.68 | 56 | 1.26 | 0.95 | 1.64 | 173 | 1.35 | 1.16 | 1.57 |
| Medullary TC, as second | 58 | 1.58 | 1.20 | 2.04 | 42 | 1.66 | 1.19 | 2.24 | 100 | 1.61 | 1.31 | 1.96 |
| Poorly differentiated b TC, as second | 41 | 1.37 | 0.99 | 1.86 | 33 | 1.49 | 1.02 | 2.09 | 74 | 1.42 | 1.12 | 1.79 |
| Cancer types (first) | ||||||||||||
| Head and neck | 20 | 1.7 | 1.0 | 2.6 | 53 | 2.3 | 1.8 | 3.1 | 73 | 2.1 | 1.7 | 2.7 |
| Oral cavity | 6 | 1.1 | 0.4 | 2.4 | 18 | 4.0 | 2.4 | 6.3 | 24 | 2.4 | 1.5 | 3.6 |
| Pharynx | 7 | 2.4 | 1.0 | 4.9 | 7 | 1.8 | 0.7 | 3.7 | 14 | 2.1 | 1.1 | 3.4 |
| Larynx | 7 | 2.1 | 0.8 | 4.3 | 28 | 2.0 | 1.3 | 2.8 | 35 | 2.0 | 1.4 | 2.8 |
| Esophagus | 2 | 2.1 | 0.2 | 7.6 | 1 | 0.8 | 0.0 | 4.2 | 3 | 1.3 | 0.3 | 3.9 |
| Stomach | 18 | 0.9 | 0.5 | 1.4 | 12 | 0.9 | 0.5 | 1.6 | 30 | 0.9 | 0.6 | 1.3 |
| Colon and rectum | 135 | 1.3 | 1.1 | 1.5 | 95 | 1.7 | 1.4 | 2.1 | 230 | 1.4 | 1.3 | 1.6 |
| Colon | 86 | 1.2 | 1.0 | 1.5 | 66 | 1.7 | 1.4 | 2.2 | 152 | 1.4 | 1.2 | 1.6 |
| Rectum | 49 | 1.6 | 1.2 | 2.1 | 29 | 1.6 | 1.0 | 2.2 | 78 | 1.6 | 1.2 | 2.0 |
| Liver | 8 | 1.5 | 0.7 | 3.0 | 5 | 0.8 | 0.3 | 1.8 | 13 | 1.1 | 0.6 | 1.9 |
| Gallbladder | 6 | 1.7 | 0.6 | 3.7 | 3 | 2.3 | 0.5 | 6.7 | 9 | 1.9 | 0.9 | 3.5 |
| Pancreas | 4 | 0.9 | 0.2 | 2.3 | 2 | 1.0 | 0.1 | 3.6 | 6 | 0.9 | 0.3 | 2.0 |
| Lung | 29 | 1.8 | 1.2 | 2.5 | 37 | 1.8 | 1.2 | 2.4 | 66 | 1.8 | 1.4 | 2.2 |
| Melanoma | 60 | 1.5 | 1.2 | 2.0 | 47 | 3.6 | 2.6 | 4.8 | 107 | 2.0 | 1.7 | 2.5 |
| Mesothelioma | 1 | 1.6 | 0.0 | 8.7 | 1 | 1.5 | 0.0 | 8.2 | 2 | 1.5 | 0.2 | 5.5 |
| Kaposi sarcoma | 2 | 1.9 | 0.2 | 7.0 | 3 | 1.9 | 0.4 | 5.4 | 5 | 1.9 | 0.6 | 4.4 |
| Bone and soft tissue | 21 | 3.0 | 1.9 | 4.7 | 7 | 2.3 | 0.9 | 4.7 | 28 | 2.8 | 1.9 | 4.1 |
| Soft tissue | 11 | 2.2 | 1.1 | 3.9 | 6 | 2.6 | 0.9 | 5.7 | 17 | 2.3 | 1.3 | 3.7 |
| Bone | 10 | 5.6 | 2.7 | 10.3 | 1 | 1.3 | 0.0 | 7.5 | 11 | 4.3 | 2.2 | 7.8 |
| Breast | 583 | 1.3 | 1.2 | 1.4 | 1 | 0.8 | 0.0 | 4.4 | 584 | 1.3 | 1.2 | 1.4 |
| Corpus uteri | 87 | 1.4 | 1.1 | 1.7 | 0 | 87 | 1.4 | 1.1 | 1.7 | |||
| Cervix uteri | 32 | 1.2 | 0.8 | 1.7 | 0 | 32 | 1.2 | 0.8 | 1.7 | |||
| Ovary | 33 | 1.2 | 0.8 | 1.7 | 0 | 33 | 1.2 | 0.8 | 1.7 | |||
| Prostate | 0 | 147 | 1.5 | 1.3 | 1.8 | 147 | 1.5 | 1.3 | 1.8 | |||
| Testis | 0 | 12 | 1.8 | 0.9 | 3.2 | 12 | 1.8 | 0.9 | 3.2 | |||
| Kidney and renal pelvis | 67 | 3.2 | 2.5 | 4.0 | 54 | 3.1 | 2.4 | 4.1 | 121 | 3.2 | 2.6 | 3.8 |
| Urinary bladder | 32 | 1.2 | 0.8 | 1.6 | 62 | 1.1 | 0.9 | 1.4 | 94 | 1.1 | 0.9 | 1.4 |
| Central nervous system | 15 | 2.4 | 1.3 | 3.9 | 6 | 2.3 | 0.8 | 5.0 | 21 | 2.3 | 1.5 | 3.6 |
| Hemolymphopoietic | 128 | 1.8 | 1.5 | 2.1 | 55 | 1.7 | 1.2 | 2.2 | 183 | 1.8 | 1.5 | 2.0 |
| Hodgkin lymphoma | 25 | 2.6 | 1.7 | 3.8 | 13 | 3.5 | 1.9 | 6.0 | 38 | 2.8 | 2.0 | 3.9 |
| Non‐Hodgkin lymphoma | 69 | 1.9 | 1.5 | 2.4 | 22 | 1.4 | 0.9 | 2.1 | 91 | 1.7 | 1.4 | 2.1 |
| Myeloma | 10 | 1.0 | 0.5 | 1.9 | 5 | 1.1 | 0.4 | 2.6 | 15 | 1.0 | 0.6 | 1.7 |
| CLL‐SLL | 9 | 1.0 | 0.4 | 1.9 | 6 | 1.0 | 0.4 | 2.3 | 15 | 1.0 | 0.6 | 1.7 |
| NHL, DLBC | 17 | 2.0 | 1.2 | 3.2 | 5 | 1.3 | 0.4 | 3.1 | 22 | 1.8 | 1.1 | 2.7 |
| NHL, Follicular | 19 | 2.4 | 1.5 | 3.8 | 3 | 1.1 | 0.2 | 3.2 | 22 | 2.1 | 1.3 | 3.2 |
| Acute L. Leukemia | 4 | 3.4 | 0.9 | 8.7 | 6 | 13.2 | 4.8 | 28.7 | 10 | 6.1 | 2.9 | 11.2 |
| Other and ill defined | 53 | 1.3 | 1.0 | 1.7 | 22 | 1.2 | 0.7 | 1.8 | 75 | 1.3 | 1.0 | 1.6 |
PY, Person‐years; Obs, observed cases; NHL, Non‐Hodgkin lymphoma; CLL‐SLL, chronic lymphoid leukemia‐small lymphocytic lymphoma; DLBC, diffuse large B‐cell.
Statistical significant associations are highlighted in bold.
Measured as standardized incidence ratio (SIR) and 95% confidence intervals (CIs). Age 0–84 years; second primary cancers diagnosed <2 months after first one were excluded.
Poorly differentiated including anaplastic.
The most elevated SIRs for TC as SPC were observed when primary cancer was diagnosed below age 35 years (SIR = 2.69, 2.25–3.19) (Table 4), more elevated in men (3.6, 2.6–5.0) than in women (2.4, 2.0–3.0) (Appendix 4). In this age group, first tumors were hemolymphopoietic cancers in 52 out of 133 (39%) patients with SIR for TC = 4.3 overall and 3‐fold higher than expected for all major hemolymphopoietic cancers. The 35–54 and 55–84 years age groups showed similar SIRs for TC as SPC (1.50 and 1.41, respectively), after breast (1.2 and 1.4, respectively), and corpus uteri cancers (1.3 and 1.4). SIRs for TC decreased with age after colorectal cancer and kidney cancer (Table 4).
TABLE 4.
Risk a of thyroid cancers (TC) as second tumor by first cancer type and age. Italy, 1998–2012
| Age at first cancer | ||||||||||||
|---|---|---|---|---|---|---|---|---|---|---|---|---|
| 0–34 years | 35–54 years | 55–84 years | ||||||||||
| Obs | SIR | 95% | CI | Obs | SIR | 95% | CI | Obs | SIR | 95% | CI | |
| TC after all neoplasms, but skin and TC | 133 | 2.69 | 2.25 | 3.19 | 653 | 1.50 | 1.38 | 1.61 | 1175 | 1.41 | 1.33 | 1.49 |
| Papillary TC, as second | 114 | 2.67 | 2.21 | 3.21 | 550 | 1.51 | 1.38 | 1.64 | 818 | 1.46 | 1.37 | 1.57 |
| Follicular TC, as second | 8 | 2.52 | 1.08 | 4.96 | 42 | 1.32 | 0.95 | 1.79 | 123 | 1.32 | 1.10 | 1.57 |
| Medullary TC, as second | 2 | 2.03 | 0.23 | 7.34 | 24 | 1.68 | 1.08 | 2.51 | 74 | 1.58 | 1.24 | 1.98 |
| Poorly differentiated b TC, as second | 1 | 10.09 | 0.13 | 56.14 | 8 | 1.95 | 0.84 | 3.85 | 65 | 1.36 | 1.05 | 1.73 |
| Cancer types (first) c | ||||||||||||
| Head and neck | 1 | 1.6 | 0.0 | 9.0 | 23 | 2.2 | 1.4 | 3.3 | 49 | 2.1 | 1.5 | 2.8 |
| Stomach | 0 | 0.0 | 0.0 | 7.9 | 4 | 0.5 | 0.1 | 1.3 | 26 | 1.1 | 0.7 | 1.5 |
| Colon and rectum | 3 | 2.0 | 0.4 | 5.9 | 57 | 1.7 | 1.3 | 2.2 | 170 | 1.4 | 1.2 | 1.6 |
| Lung | 1 | 2.6 | 0.0 | 14.4 | 20 | 2.7 | 1.7 | 4.2 | 45 | 1.5 | 1.1 | 2.0 |
| Melanoma | 13 | 1.9 | 1.0 | 3.2 | 52 | 2.2 | 1.6 | 2.9 | 42 | 1.9 | 1.4 | 2.6 |
| Breast | 13 | 1.4 | 0.8 | 2.5 | 256 | 1.2 | 1.1 | 1.4 | 315 | 1.4 | 1.2 | 1.5 |
| Corpus uteri | 2 | 0.7 | 0.1 | 2.7 | 27 | 1.3 | 0.9 | 1.9 | 60 | 1.4 | 1.1 | 1.8 |
| Cervix uteri | 0 | 0.0 | 0.0 | 6.6 | 19 | 1.2 | 0.7 | 1.9 | 11 | 1.3 | 0.7 | 2.4 |
| Ovary | 2 | 0.9 | 0.1 | 3.3 | 18 | 1.4 | 0.9 | 2.3 | 13 | 1.0 | 0.5 | 1.7 |
| Prostate | 0 | 0.0 | 0.0 | 666.9 | 7 | 1.8 | 0.7 | 3.8 | 140 | 1.5 | 1.3 | 1.8 |
| Kidney and renal pelvis | 7 | 7.2 | 2.9 | 14.8 | 47 | 4.2 | 3.1 | 5.6 | 67 | 2.6 | 2.0 | 3.2 |
| Urinary bladder | 3 | 2.6 | 0.5 | 7.5 | 16 | 1.0 | 0.6 | 1.7 | 75 | 1.1 | 0.9 | 1.4 |
| Hemolymphopoietic | 52 | 4.3 | 3.2 | 5.6 | 60 | 1.8 | 1.4 | 2.3 | 71 | 1.2 | 0.9 | 1.5 |
| Hodgkin lymphoma | 28 | 4.5 | 3.0 | 6.6 | 8 | 1.6 | 0.7 | 3.2 | 2 | 0.9 | 0.1 | 3.1 |
| Non‐Hodgkin lymphoma | 12 | 3.1 | 1.6 | 5.5 | 33 | 1.9 | 1.3 | 2.6 | 46 | 1.5 | 1.1 | 2.0 |
| Leukemia | 12 | 5.8 | 3.0 | 10.2 | 15 | 2.1 | 1.2 | 3.5 | 12 | 0.8 | 0.4 | 1.4 |
Obs, observed cases.
Statistical significant associations are highlighted in bold.
Measured as standardized incidence ratio (SIR) and 95% confidence intervals (CIs). Men and women; second primary cancers diagnosed <2 months after first one were excluded.
Poorly differentiated including anaplastic.
Cancer types with ≥30 cases in men and women.
EAR after TC for all cancers was 1.28 per 1,000 PY (Table 5), 0.43 per 1,000 PY for breast cancer, 0.25 per 1,000 PY for kidney cancer, and 0.19 per 1,000 PY for prostate cancer. All other cancers showed EAR < 0.1 per 1,000 PY. EAR of TC as a SPC was 0.09 per 1,000 PY overall, 0.51 per 1,000 PY after bone, 0.36 after kidney, 0.35 after acute lymphoid leukemia, 0.31 after Hodgkin lymphoma, 0.23 after oral cavity and brain, 0.22 after melanoma and follicular NHL (Table 5).
TABLE 5.
Excess absolute risk (EAR) of second primary cancer in thyroid cancer (TC) patients and TC as second tumor by first cancer type a . Italy, 1998–2012
| Cancer types | Second primary cancer after TC | TC as second tumor | |||||
|---|---|---|---|---|---|---|---|
| EAR per 1000 py | 95% | CI | EAR per 1000 py | 95% | CI | ||
| All other neoplasms, but skin and thyroid | 1.28 | 0.79 | 1.77 | 0.09 | 0.08 | 0.11 | |
| Papillary TC | 1.35 | 0.84 | 1.85 | 0.07 | 0.06 | 0.09 | |
| Follicular TC | 0.58 | −0.92 | 2.09 | 0.01 | 0.00 | 0.01 | |
| Medullary TC | −0.47 | −3.16 | 2.22 | 0.01 | 0.00 | 0.01 | |
| Poorly differentiatedb TC | 9.37 | 0.07 | 18.67 | 0.00 | 0.00 | 0.01 | |
| Head and neck | −0.01 | −0.03 | 0.01 | 0.16 | 0.08 | 0.25 | |
| Oral cavity | −0.04 | −0.07 | 0.00 | 0.23 | 0.04 | 0.43 | |
| Pharynx | −0.03 | −0.06 | 0.00 | 0.17 | −0.04 | 0.39 | |
| Larynx | 0.03 | −0.02 | 0.08 | 0.13 | 0.02 | 0.24 | |
| Esophagus | 0.00 | −0.04 | 0.03 | 0.05 | −0.25 | 0.35 | |
| Stomach | 0.03 | −0.07 | 0.12 | −0.01 | −0.09 | 0.06 | |
| Colon and rectum | 0.01 | −0.08 | 0.09 | 0.07 | 0.03 | 0.12 | |
| Colon | 0.02 | −0.12 | 0.17 | 0.06 | 0.02 | 0.11 | |
| Rectum | −0.01 | −0.10 | 0.08 | 0.10 | 0.02 | 0.17 | |
| Liver | −0.04 | −0.11 | 0.04 | 0.02 | −0.11 | 0.14 | |
| Gallbladder | −0.03 | −0.08 | 0.02 | 0.15 | −0.11 | 0.41 | |
| Pancreas | 0.01 | −0.07 | 0.10 | −0.01 | −0.21 | 0.19 | |
| Lung | 0.03 | −0.11 | 0.17 | 0.12 | 0.04 | 0.20 | |
| Melanoma | 0.02 | −0.06 | 0.10 | 0.22 | 0.12 | 0.31 | |
| Mesothelioma | 0.02 | −0.02 | 0.05 | 0.08 | −0.36 | 0.53 | |
| Kaposi sarcoma | −0.01 | −0.02 | 0.01 | 0.11 | −0.15 | 0.37 | |
| Bone and soft tissue | 0.02 | 0.00 | 0.05 | 0.30 | 0.10 | 0.50 | |
| Soft tissue | 0.04 | 0.00 | 0.08 | 0.22 | 0.00 | 0.45 | |
| Bone | 0.01 | −0.01 | 0.03 | 0.51 | 0.08 | 0.95 | |
| Breast | 0.43 | 0.19 | 0.67 | 0.09 | 0.05 | 0.12 | |
| Corpus uteri | 0.03 | −0.06 | 0.13 | 0.10 | 0.00 | 0.20 | |
| Cervix uteri | −0.03 | −0.08 | 0.02 | 0.06 | −0.11 | 0.22 | |
| Ovary | 0.03 | −0.04 | 0.11 | 0.05 | −0.10 | 0.21 | |
| Prostate | 0.19 | 0.07 | 0.31 | 0.06 | 0.02 | 0.09 | |
| Testis | 0.01 | −0.01 | 0.03 | 0.08 | −0.04 | 0.19 | |
| Kidney and renal pelvis | 0.25 | 0.15 | 0.35 | 0.36 | 0.25 | 0.47 | |
| Urinary bladder | 0.03 | −0.08 | 0.13 | 0.02 | −0.02 | 0.06 | |
| Central nervous system | 0.00 | −0.06 | 0.05 | 0.23 | 0.03 | 0.43 | |
| Hemolymphopoietic | 0.04 | 0.02 | 0.07 | 0.13 | 0.08 | 0.19 | |
| Hodgkin lymphoma | 0.01 | −0.03 | 0.04 | 0.31 | 0.13 | 0.48 | |
| Non‐Hodgkin lymphoma | 0.07 | −0.02 | 0.17 | 0.14 | 0.06 | 0.22 | |
| Myeloma | 0.05 | −0.01 | 0.11 | 0.01 | −0.13 | 0.14 | |
| CLL‐SLL | 0.04 | −0.01 | 0.08 | 0.00 | −0.12 | 0.12 | |
| NHL, DLBC | 0.00 | −0.05 | 0.04 | 0.14 | −0.03 | 0.32 | |
| NHL, Follicular | 0.03 | −0.01 | 0.07 | 0.22 | 0.01 | 0.44 | |
| Acute L. Leukemia | 0.02 | 0.00 | 0.04 | 0.35 | 0.07 | 0.63 | |
| Other and ill defined | 0.05 | −0.07 | 0.16 | 0.04 | −0.02 | 0.11 | |
CI, confidence intervals. NHL, Non‐Hodgkin lymphoma; CLL‐SLL, chronic lymphoid leukemia‐small lymphocytic lymphoma; DLBC, diffuse large B‐cell.
Statistical significant associations are highlighted in bold.
Men and women, age 0–84 years; second primary cancers diagnosed <2 months after first one were excluded.
Poorly differentiated including anaplastic.
4. DISCUSSION
In Italy, TC patients have a 16% increased risk of experiencing a SPC, in comparison with the general population, slightly more than the corresponding figure in the United States (10%) 14 , 21 and South Korea (6%), 28 but less than in Denmark (31%), 10 Japan (44%), 11 and Switzerland (58% in men and 36% in women). 13 SIR in TC patients diagnosed in 1998–2012 corresponded to an excess incidence rate above 1 per 1,000 patients per year (i.e., 100/100,000). In addition, SIR of TC diagnosis after another cancer was 1.49, consistent with estimates in the United States (+50%). 12
Other authors have reported higher risks of papillary TC than of follicular TC after several neoplasms, in particular renal or breast cancers and leukemias/lymphomas. 19 However, in the present study, risks of SPC after papillary TC and of papillary TC as SPC are only slightly higher than corresponding risks for all TC (i.e., all other TC). Most notably, although rare, our data suggested that follicular or medullary TC were not associated with an excess of all SPC, while, as SPC, these two TC subtypes had similar SIRs than papillary or other TC. On the other hand, numbers for such types are quite small and possible associations, for example, as those in multiple endocrine neoplasia for medullary TC, may have not been evidenced.
Several studies reported an elevated risk of SPCs from the use of radioactive iodine (RAI) therapy in TC patients, 29 , 30 in particular in young patients. 31 This may explain the elevated incidence of acute lymphoid leukemia and other hemolymphopoietic neoplasms after TC treated with RAI. 30 However, increased risks after TC have been reported for different lymphoid and hematological neoplasms, 32 , 33 as well as for solid tumors. 30 In three large cohorts of TC cases diagnosed until 1995, 34 an increased risk of several solid tumors and leukemia's was found with increasing cumulative activity of administered iodine‐131 (131I). However, when contrasting those exposed and not exposed to 131I, significantly increased risks of SPC were only seen for bone and soft tissue cancers. 34 The association between soft tissue sarcomas and TC (as a first or second neoplasm) that emerged in our study is consistent with recent results reported in the USA. 12 , 14
Despite the methodological flaw comparing SIRs after TC and for TC as SPC, the bidirectional association between TC and hemolymphopoietic, kidney, and bone/soft tissue cancers is remarkable and consistent across sex and age groups. The highest SIRs were observed for bone cancer and acute lymphoid leukemia after TC, although with broad CI. Moreover, there were moderate bidirectional associations between thyroid and prostate (1.4 after TC and 1.5 of TC as SPC) or breast cancer (1.2 and 1.2). Notably in our study SIR of breast cancer after TC was 1.2, did not change with time since TC diagnosis, and was similar to what has been reported in Europe 10 and USA, 21 but lower than in Japan (2.0) 11 and Korea (2.5). 35
The consistent associations found between TC and other tumors may suggest the contribution of common risk factors, such as obesity, including genetic predisposition. 36 , 37 Nevertheless, in the present study the association of TC with the two most common overweight‐related neoplasms (i.e., colorectal and endometrial cancers) was limited, if any, and in line with previous results from comparable population‐based studies. 10 , 12 , 14 For some cancer types (e.g., breast or kidney cancer), the link with TC consistently persisted beyond 5 years since diagnosis 14 , 19 , 27 and can be driven, at least in part, by genetic predisposition and treatment exposures. 16 , 36
To disentangle potential biological associations between first and subsequent tumors seems beyond the capability of CR data, since they are probably mediated by complex interactions between genetic predispositions, lifestyle, and intensity of surveillance.
Even if a role of previous radiotherapy on thyroid gland (a radiosensitive organ) was a possible explanation of a small proportion of excess risk for TC as SPC, the finding of a 50% excess risk for TC as SPC may largely be explained by increased medical surveillance in oncologic patients and be accompanied by overdiagnosis. In fact, in a context of overdiagnosis estimated to be at least 70% of TC in Italy 3 as elsewhere, 9 most of the excess risk of TC as SPC (but possibly also of SPC after TC) may be due to the intensity of diagnostic activities in cancer patients. 7 , 38 In our study, the increased risk of TC after upper aerodigestive tract cancers (SIR = 2.1, Table 3), but not the opposite (SIR = 0.8, Table 1), supports the relationship between TC and diagnostic procedures of the neck. In Korea, the country with the highest TC incidence worldwide, SIRs for kidney cancer after TC increased with calendar period and paralleled TC increase in the general population. 28 For kidney cancer, the impact of enhanced screening (i.e., through abdominal ultrasound and imaging) has also been reported both in Korea 39 and elsewhere. 40 , 41
4.1. Strengths and weaknesses
The major strengths of this study are the population‐based design, the availability of the largest well‐documented TC series (>38,500 cases) in Europe, and the corresponding cohort of patients with other cancer types (1.4 million cases). Few other studies, 10 , 11 , 14 , 32 could similarly explore the bidirectional association between TC and other cancers. To the best of our knowledge, only another study has compared the association of TC with other cancers using population‐based data with specific attention to tumor histology and latency. 19 Our study is the first one capable of computing SIR separately for different TC histological types (i.e., follicular, medullary, and poorly differentiated) and more than 30 cancer types as a first or SPC.
Among the limitations, it should be mentioned that although Italian CRs were considered complete and accurate and cover one third of the population, 42 they do not cover the whole country. They may miss part of the substantial TC incidence variability among Italian regions. 3 Moreover, international comparisons of SIRs of second cancers suffer from the lack of a standardized cut‐off between metachronous (e.g., subsequent) and synchronous tumors. In the present study, we excluded cancers occurring in the 2 months after diagnosis (4% of those diagnosed after TC and 8% of TC as SPC). Their inclusion would have had a negligible impact for the overall SIR estimates. The same definition was used by some authors, 21 , 28 , 43 but other cut‐offs were also used (such as 6 months, 13 , 26 12 months, 12 , 17 or 5 years 14 ), suggesting the need of caution in comparisons between studies. Unfortunately, Italian cancer registries do not systematically collect information on stage at diagnosis or treatment (e.g., RAI), and we could not take these important factors into account. 12 , 34 , 44 The length of follow‐up (<15 years, median <7 years) precluded the assessment of longer term incidence of SPC. Finally, as a result of the large number of comparisons made, some SIRs may be spuriously statistically significant, calling for caution in the interpretation of results.
5. PUBLIC HEALTH CONSEQUENCES AND CONCLUSIONS
With the growing number of people living after a cancer diagnosis, the number of those developing a SPC will also increase, generating further medical and financial burdens for patients, families, and society. 45 Our findings may have potential implications for screening other neoplasms in patients with certain types of malignancies. In particular, TC patients need a comprehensive support, including surveillance for treatment side effects. However, overdiagnosis and overtreatment of TC should be avoided, particularly among younger women. 46 , 47
CONFLICT OF INTEREST
The authors have declared no competing interests.
ETHICS APPROVAL AND CONSENT TO PARTICIPATE
The Italian legislation identifies regional health authorities as collectors of personal data for surveillance purposes without explicit individual consent. The approval of a research ethic committee is not required, since this study is a descriptive analysis of anonymous aggregate data without any direct or indirect intervention on patients (Decreto del Presidente del Consiglio dei Ministri, 3/3/2017, Identificazione dei sistemi di sorveglianza e dei registri di mortalità, di tumori e di altre patologie, 17A03142, GU Serie Generale n.109 del 12‐05‐2017). Available at: https://www.gazzettaufficiale.it/eli/id/2017/05/12/17A03142/sg, last access: 16/08/2021.
Supporting information
Appendix S1‐S4
ACKNOWLEDGMENTS
The authors thank Mrs. Luigina Mei for editorial assistance.
Members of the AIRTUM Working Group: Antonietta Torrisi (Catania‐Messina‐Enna Cancer Registry, Catania); Rosa Vattiato (Romagna Cancer Registry, Meldola); Stefano Guzzinati (Veneto Tumor Registry, Padua); Claudia Cirilli (Modena Cancer Registry); Rosanna Cusimano (Palermo Cancer Registry); Michele Magoni (Brescia Cancer Registry); Simonetta Curatella (Cancer Registry of Latina province); Stefania Del Zotto (Friuli Venezia Giulia Cancer Registry); Alessio Gili (Umbria Cancer Registry); Teresa Intrieri (Tuscany Cancer Registry); Carlotta Sacerdote (Piedmont Cancer Registry, Turin); Maria Michiara (Parma Cancer Registry); Massimo Vicentini (Reggio Emilia Cancer Registry); Antonella Puppo (Liguria Region Cancer Registry); Maria Francesca Vitale (Naples Cancer Registry); Paolo Contiero (Varese Cancer Registry); Filippo Stroscio (Sassari Cancer Registry); Eugenia Spata (Ragusa Cancer Registry); Luciana Gatti (Mantova Cancer Registry); Anselmo Madeddu (Siracusa Cancer Registry); Roberto Rizzello (Trento Cancer Registry); Roberta Bosu (Nuoro Cancer Registry); Fabio Vittadello (Southtyrol Cancer Registry); Ivan Cometti (Sondrio Cancer Registry); Francesco Cuccaro (Barletta‐Andria‐Trani Cancer Registry); Giuseppe Sampietro (Bergamo Cancer Registry); Santo Scalzi (Catanzaro Cancer Registry); Gemma Gola (Como Cancer Registry); Anna Melcarne (Lecce Cancer Registry); Luca Cavalieri d’Oro (Monza‐Brianza Cancer Registry); Elisabetta Borciani (Piacenza Cancer Registry); Simona Carone (Taranto Cancer Registry); and Giuseppa Candela (Trapani Cancer Registry).
Crocetti E, Mattioli V, Buzzoni C, et al. Risk of thyroid as a first or second primary cancer. A population‐based study in Italy, 1998–2012. Cancer Med. 2021;10:6855–6867. 10.1002/cam4.4193
Funding Information
This work was supported by the Italian Association for Cancer Research (AIRC) (Grant no. 16921) and by the Italian Ministry of Health (Ricerca Corrente, RCR‐2020‐23670066, Alliance Against Cancer: Overdiagnosis, overtreatment, and outcome in cancer patients, WP 7). The funding sources had no involvement in the study design, in the collection, analysis and interpretation of data, in the writing of the report, and in the decision to submit the article for publication.
DATA AVAILABILITY STATEMENT
Research data are available from the corresponding author upon reasonable request, in agreement with AIRTUM guidelines.
REFERENCES
- 1. Guzzinati S, Virdone S, De Angelis R, et al. Characteristics of people living in Italy after a cancer diagnosis in 2010 and projections to 2020. BMC Cancer. 2018;18:169. [DOI] [PMC free article] [PubMed] [Google Scholar]
- 2. Bluethmann SM, Mariotto AB, Rowland JH, . Anticipating the “Silver Tsunami”: prevalence trajectories and comorbidity burden among older cancer survivors in the United States. Cancer Epidemiol Biomarkers Prev. 2016;25:1029‐1036. https://cebp.aacrjournals.org/content/25/7/1029.long [DOI] [PMC free article] [PubMed] [Google Scholar]
- 3. Dal Maso L, Panato C, Franceschi S, et al; for AIRTUM Working Group . The impact of overdiagnosis on thyroid cancer epidemic in Italy, 1998‐2012. Eur J Cancer. 2018;94:6‐15. [DOI] [PubMed] [Google Scholar]
- 4. Buzzoni C, Crocetti E, Guzzinati S, et al; AIRTUM Working Group . Cancer incidence and mortality trends from 2003 to 2014 in Italy. Tumori J. 2019;105:121‐137 [DOI] [PubMed] [Google Scholar]
- 5. Airtum Working Group . Italian cancer figures—report 2016. Survival of cancer patients in Italy. Epid Prev. 2017;41(Suppl 1). 10.19191/EP17.2S1.P001.017. [DOI] [PubMed] [Google Scholar]
- 6. Dal Maso L, Panato C, Tavilla A, et al; EUROCARE‐5 Working Group . Cancer cure for 32 cancer types: results from the EUROCARE‐5 study. Int J Epidemiol. 2020;49:1517‐1525. [DOI] [PubMed] [Google Scholar]
- 7. Vaccarella S, Franceschi S, Bray F, Wild CP, Plummer M, Dal Maso L. Worldwide thyroid‐cancer epidemic? The increasing impact of overdiagnosis. N Engl J Med. 2016;375:614‐617. [DOI] [PubMed] [Google Scholar]
- 8. Shieh Y, Eklund M, Sawaya GF, Black WC, Kramer BS, Esserman LJ. Population‐based screening for cancer: hope and hype. Nat Rev Clin Oncol. 2016;13:550‐565. [DOI] [PMC free article] [PubMed] [Google Scholar]
- 9. Li M, Dal Maso L, Vaccarella S. Global trends in thyroid cancer incidence and the impact of overdiagnosis. Lancet Diab Endocrinol. 2020;8:468‐470. [DOI] [PubMed] [Google Scholar]
- 10. Nielsen SF, Nordestgaard BG, Bojesen SE. Associations between first and second primary cancers: a population‐based study. CMAJ. 2012;184:E57‐E69. [DOI] [PMC free article] [PubMed] [Google Scholar]
- 11. Tabuchi T, Ito Y, Ioka A, Miyashiro I, Tsukuma H. Incidence of metachronous second primary cancers in Osaka, Japan: update of analyses using population‐based cancer registry data. Cancer Sci. 2012;103:1111‐1120. [DOI] [PMC free article] [PubMed] [Google Scholar]
- 12. Schonfeld SJ, Morton LM, Berrington de González A, Curtis RE, Kitahara CM. Risk of second primary papillary thyroid cancer among adult cancer survivors in the United States, 2000‐2015. Cancer Epidemiol. 2020;64:2000‐2015. [DOI] [PMC free article] [PubMed] [Google Scholar]
- 13. Feller A, Matthes KL, Bordoni A, et al; NICER Working Group . The relative risk of second primary cancers in Switzerland: a population‐based retrospective cohort study. BMC Cancer. 2020;20:51. 10.1186/s12885-019-6452-0. [DOI] [PMC free article] [PubMed] [Google Scholar]
- 14. Sung H, Hyun N, Leach CR, Yabroff KR, Jemal A. Association of first primary cancer with risk of subsequent primary cancer among survivors of adult‐onset cancers in the United States. JAMA. 2020;324:2521‐2535. [DOI] [PMC free article] [PubMed] [Google Scholar]
- 15. Joseph KR, Edirimanne S, Eslick GD. The association between breast cancer and thyroid cancer: a meta‐analysis. Breast Cancer Res Treat. 2015;152:173‐181. [DOI] [PubMed] [Google Scholar]
- 16. Nielsen SM, White MG, Hong S, et al. The breast‐thyroid cancer link: a systematic review and meta‐analysis. Cancer Epidemiol Biomarkers Prev. 2016;25:231‐238. [DOI] [PMC free article] [PubMed] [Google Scholar]
- 17. Izkhakov E, Barchana M, Liphshitz I, Silverman BG, Stern N, Keinan‐Boker L. Trends of second primary malignancy in patients with thyroid cancer: a population‐based cohort study in Israel. Thyroid. 2017;27:793‐801. [DOI] [PubMed] [Google Scholar]
- 18. Bolf EL, Sprague BL, Carr FE. A linkage between thyroid and breast cancer: a common etiology? Cancer Epidemiol Biomarkers Prev. 2019;28:643‐649. [DOI] [PubMed] [Google Scholar]
- 19. Lal G, Groff M, Howe JR, Weigel RJ, Sugg SL, Lynch CF. Risk of subsequent primary thyroid cancer after another malignancy: latency trends in a population‐based study. Ann Surg Oncol. 2012;19(6):1887‐1896. 10.1245/s10434-011-2193-2. [DOI] [PMC free article] [PubMed] [Google Scholar]
- 20. Van Fossen VL, Wilhelm SM, Eaton JL, McHenry CR. Association of thyroid, breast and renal cell cancer: a population‐based study of the prevalence of second malignancies. Ann Surg Oncol. 2013;20:1341‐1347. [DOI] [PubMed] [Google Scholar]
- 21. Kim C, Bi X, Pan D, et al. The risk of second cancers after diagnosis of primary thyroid cancer is elevated in thyroid microcarcinomas. Thyroid. 2013;23:575‐582. [DOI] [PMC free article] [PubMed] [Google Scholar]
- 22. Endo M, Liu JB, Dougan M, Lee JS. Incidence of second malignancy in patients with papillary thyroid cancer from surveillance, epidemiology, and end results 13 dataset. J Thyroid Res. 2018;2018:8765369. [DOI] [PMC free article] [PubMed] [Google Scholar]
- 23. Fritz A, Percy C, Jack A, et al. International Classification of Diseases for Oncology. 3rd ed. World Health Organization; 2000. [Google Scholar]
- 24. Airtum Working Group . Italian cancer figures—report 2013 multiple tumours. Epid Prev. 2013;37(suppl 1):1–152. [PubMed] [Google Scholar]
- 25. IARC‐IACR‐ENCR. International Rules for Multiple Primary Cancer (ICD‐O Third edition). 2004. International Report n. 2004/02. https://www.encr.eu/sites/default/files/pdf/MPrules_july2004.pdf. [Google Scholar]
- 26. Curtis RE, Ries LAG. Chapter 2. Methods. In: Curtis RE, Freedman DM, Ron E, et al. (eds). New Malignancies Among Cancer Survivors: SEER Cancer Registries, 1973‐2000. NIH Publ. No. 05‐5302. National Cancer Institute; 2006:9‐14. [Google Scholar]
- 27. National Cancer Institute Surveillance, Epidemiology, and End Results Program. SEER*Stat Software Version 8.3.6. Accessed March 10, 2021. https://www.seer.cancer.gov/seerstat. [Google Scholar]
- 28. Cho YY, Lim J, Oh CM, et al. Elevated risks of subsequent primary malignancies in patients with thyroid cancer: a nationwide, population‐based study in Korea. Cancer. 2015;121:259‐268. [DOI] [PubMed] [Google Scholar]
- 29. Iyer NG, Morris LG, Tuttle RM, Shaha AR, Ganly I. Rising incidence of second cancers in patients with low‐risk (T1N0) thyroid cancer who receive radioactive iodine therapy. Cancer. 2011;117:4439‐4446. [DOI] [PMC free article] [PubMed] [Google Scholar]
- 30. Yu CY, Saeed O, Goldberg AS, et al. A systematic review and meta‐analysis of subsequent malignant neoplasm risk after radioactive iodine treatment of thyroid cancer. Thyroid. 2018;28:1662‐1673. [DOI] [PubMed] [Google Scholar]
- 31. Marti JL, Jain KS, Morris LG. Increased risk of second primary malignancy in pediatric and young adult patients treated with radioactive iodine for differentiated thyroid cancer. Thyroid. 2015;25:681‐687. [DOI] [PMC free article] [PubMed] [Google Scholar]
- 32. Sandeep TC, Strachan MW, Reynolds RM, et al. Second primary cancers in thyroid cancer patients: a multinational record linkage study. J Clin Endocrinol Metab. 2006;91:1819‐1825. [DOI] [PubMed] [Google Scholar]
- 33. Molenaar RJ, Sidana S, Radivoyevitch T, et al. Risk of hematologic malignancies after radioiodine treatment of well‐differentiated thyroid cancer. J Clin Oncol. 2018;36:1831‐1839. [DOI] [PMC free article] [PubMed] [Google Scholar]
- 34. Rubino C, de Vathaire F, Dottorini ME, et al. Second primary malignanies in thyroid cancer patients. Br J Cancer. 2003;89:1638‐1644. https://www.ncbi.nlm.nih.gov/pmc/articles/PMC2394426/ [DOI] [PMC free article] [PubMed] [Google Scholar]
- 35. An JH, Hwangbo Y, Ahn HY, et al. A possible association between thyroid cancer and breast cancer. Thyroid. 2015;25:1330‐1338. [DOI] [PubMed] [Google Scholar]
- 36. Malchoff CD, Sarfarazi M, Tendler B, et al. Papillary thyroid carcinoma associated with papillary renal neoplasia: genetic linkage analysis of a distinct heritable tumor syndrome. J Clin Endocr Metab. 2000;85:1758‐1764. [DOI] [PubMed] [Google Scholar]
- 37. Sadeghi H, Rafei M, Bahrami M, Haghdoost A, Shabani Y. Attributable risk fraction of four lifestyle risk factors of thyroid cancer: a meta‐analysis. J Pub Health (Oxf). 2018;40:e91‐e98. [DOI] [PubMed] [Google Scholar]
- 38. Furuya‐Kanamori L, Bell KJL, Clark J, Glasziou P, Doi SAR. Prevalence of differentiated thyroid cancer in autopsy studies over six decades: a meta‐analysis. J Clin Oncol. 2016;34:3672‐3679. [DOI] [PubMed] [Google Scholar]
- 39. Bae JM. Epidemiological evidences on overdiagnosis of prostate and kidney cancers in Korean. Epidemiol Health. 2015;37:e2015015. [DOI] [PMC free article] [PubMed] [Google Scholar]
- 40. Glasziou PP, Jones MA, Pathirana T, Barratt AL, Bell KJ. Estimating the magnitude of cancer overdiagnosis in Australia. Med J Aust. 2020;212:163‐168. [DOI] [PMC free article] [PubMed] [Google Scholar]
- 41. Klotz L. Overdiagnosis in urologic cancer: for World Journal of Urology Symposium on active surveillance in prostate and renal cancer. World J Urol. 2021. 10.1007/s00345-020-03523-2. [DOI] [PubMed] [Google Scholar]
- 42. Bray F, Colombet M, Mery L, et al. Cancer Incidence in Five Continents, Vol. XI (Electronic Version). International Agency for Research on Cancer; 2017. Accessed March 15, 2021. http://ci5.iarc.fr. [Google Scholar]
- 43. Youlden DR, Baade PD. The relative risk of second primary cancers in Queensland, Australia: a retrospective cohort study. BMC Cancer. 2011;11:83. [DOI] [PMC free article] [PubMed] [Google Scholar]
- 44. Cappagli V, Caldarella A, Manneschi G, et al. Non thyroidal second primary malignancies in differentiated thyroid cancer patients: is the incidence increased comparing to the general population and could it be a radioiodine therapy consequence? Int J Cancer. 2020;147:2838‐2846. [DOI] [PubMed] [Google Scholar]
- 45. Finnerty BM, Brunaud L, Mirallie E, et al. Cost disparity between health care systems–it's not the surgeons: a cost analysis of thyroid cancer care between the United States and France. Surgery. 2016;159:132‐140. [DOI] [PubMed] [Google Scholar]
- 46. Vaccarella S, Lortet‐Tieulent J, Colombet M, et al; IICC‐3 Contributors . Global patterns and trends in incidence and mortality of thyroid cancer in children and adolescents: a population‐based study. Lancet Diab Endocrinol. 2021;9:144‐152. [DOI] [PubMed] [Google Scholar]
- 47. Lamartina L, Grani G, Durante C, Borget I, Filetti S, Schlumberger M. Follow‐up of differentiated thyroid cancer—what should (and what should not) be done. Nat Rev Endocrinol. 2018;14:538‐551. [DOI] [PubMed] [Google Scholar]
Associated Data
This section collects any data citations, data availability statements, or supplementary materials included in this article.
Supplementary Materials
Appendix S1‐S4
Data Availability Statement
Research data are available from the corresponding author upon reasonable request, in agreement with AIRTUM guidelines.