Abstract
The role of single nucleotide polymorphisms (SNPs) in the etiopathogenesis of cardiovascular diseases is well known. The effect of SNPs on disease predisposition has been established not only for protein coding genes but also for genes encoding microRNAs (miRNAs). The miR‐143/145 cluster is smooth muscle cell‐specific and implicated in the pathogenesis of atherosclerosis. Whether SNPs within the genomic sequence of the miR‐143/145 cluster are involved in cardiovascular disease development is not known. We thus searched annotated sequence databases for possible SNPs associated with miR‐143/145. We identified one SNP, rs41291957 (G > A), located −91 bp from the mature miR‐143 sequence, as the nearest genetic variation to this miRNA cluster, with a minor allele frequency > 10%. In silico and in vitro approaches determined that rs41291957 (A) upregulates miR‐143 and miR‐145, modulating phenotypic switching of vascular smooth cells towards a differentiated/contractile phenotype. Finally, we analysed association between rs41291957 and CAD in two cohorts of patients, finding that the SNP was a protective factor. In conclusion, our study links a genetic variation to a pathological outcome through involvement of miRNAs.
Keywords: atherosclerosis, coronary artery disease, genetics, microRNA, SNP
Subject Categories: Biomarkers, Cardiovascular System
The role of single nucleotide polymorphisms (SNPs) in the etiopathogenesis of cardiovascular diseases is well known. Here, we link a genetic variation to a pathological outcome through the study of pivot miRNAs involved in atherosclerosis development.

The paper explained.
Problem
The rates of Coronary artery disease (CAD), defined as atherosclerosis of the coronary arteries and its lethal comorbidities are the most common cause of mortality worldwide. A hallmark of atherosclerosis is neointimal formation, that depends to the hyperplasia of vascular smooth muscle cells (VSMCs), which induces a gradual narrowing of vessels that could lead to vessel occlusion. It is common knowledge, that VSMCs can undergo a plethora of phenotypical transformations modulating their phenotype from contractile/differentiate to proliferative/dedifferentiated in response to pathological stimuli. Despite this connection, the role of genetics in VSCM phenotypic transition and CAD development in very limited.
Results
An in silico analysis led us to select a genetic variation (rs41291957) located in the miR‐143/145 locus, which encodes a microRNA cluster known to be a fundamental player in VSMC phenotypic switch, leading to atherosclerosis development. Through bioinformatics, ectopic and genetic approaches, such as CRISPR/Cas9, and analysis of primary VSMCs from healthy donors, we demonstrated that rs41291957 positively modulates the expression of mature miR‐143 and miR‐145, altering the secondary structure of the related primary miRNA, thus increasing VSMC contractile/differentiation status. Then, we looked for possible association of rs41291957 in two different and independent populations of patients with stable coronary artery disease (CAD) and demonstrated how expression of the variant is associated with protection against chronic total occlusion and CAD.
Impact
Besides the evaluation of clinical variables, therapeutic decisions in CAD should also take into account genetic characteristics of the patient. The rs41291957 A‐allele variant could be a useful marker for CAD prognosis, therefore possibly represents a prognostic factor, helping the management of this disease.
Introduction
Coronary artery disease (CAD), or atherosclerosis of the coronary arteries, is the most common cause of mortality worldwide (Roger, 2007). The pathogenesis of CAD is complex and involves the interaction between circulating inflammatory cells (i.e., monocyte‐derived macrophages) and resident vascular cells (i.e., endothelial cells [ECs] and vascular smooth muscle cells [VSMCs]) (Libby, 2002; Weber & Noels, 2011), eventually resulting in plaque formation and coronary occlusion. CAD manifests with a wide spectrum of anatomical phenotypes, ranging from isolated, single coronary lesions to diffuse, multivessel disease with chronic total occlusion (CTO) (Glass & Witztum, 2001; Stone et al, 2005).
MicroRNAs (miRNAs, miRs) are short, non‐coding RNAs that regulate gene expression through either cleavage of mRNA targets or inhibition of protein translation (Bartel, 2004). Their role in cardiovascular (CV) diseases, including atherosclerosis (Quintavalle et al, 2011; Elia & Condorelli, 2015), CAD (Fichtlscherer et al, 2010; Elia & Quintavalle, 2017), acute myocardial infarction (MI) (Wang et al, 2010), heart failure (Goren et al, 2012) and hypertrophic cardiomyopathy (Roncarati et al, 2014), has been widely described. Among the different miRNAs involved in vascular pathologies (Stratton et al, 2019), the bicistronic miR‐143/145 cluster plays a major role in vessel development and vascular diseases, including atherosclerosis and pulmonary hypertension, through a proliferative effect on VSMCs and ECs (Boettger et al, 2009; Cordes et al, 2009; Elia et al, 2009, 2018; Xin et al, 2009; Quintavalle et al, 2010; Climent et al, 2015). As a consequence, relatively small variations in miR‐143 and miR‐145 levels can dramatically affect vascular homeostasis and CAD development (Faccini et al, 2017).
Recent studies have identified single nucleotide polymorphisms (SNPs) on miRNA‐containing loci; known as miR‐SNPs, they can modify either the processing of primary/precursor‐miRNAs or the binding of mature miRNAs to mRNA targets in an allelic‐specific fashion (Saunders et al, 2007; Mishra & Bertino, 2009). Different SNPs have been studied for their potential roles in the regulation of miRNAs and then cardiovascular diseases, and this list includes miR‐126, miR‐146, and miR‐155, among others (Elfaki et al, 2019). However, knowledge on the role of genetic variations in miR‐143/145 biology is limited, so it is conceivable that a miR‐SNP exists that influences the cluster’s expression and, consequently, CAD development. Here, we describe the biological properties, including the prognostic value in human CV diseases, of a miR‐143/145 SNP that we identified as significant, namely, rs41291957.
Results
Identification of SNP rs41291957 in the miR‐143/145 locus
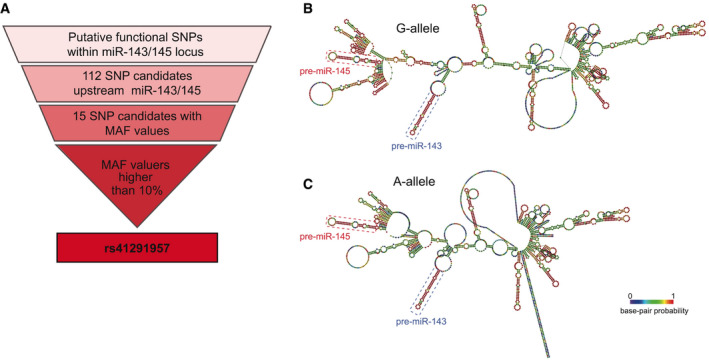
To uncover possible SNPs at the miR‐143/145 locus, we interrogated a public sequence database (ensembl.org), searching for variations located in the locus of interest. We focused on the first 300 bp upstream of miR‐143, the first gene of the cluster, identifying 112 SNPs, of which only 15 presented available minor allele frequency (MAF) values. We then filtered for variations with a MAF higher than 10%, identifying only one SNP with such a characteristic and, so, deemed of interest for further study: rs41291957 (G > A; distance: −91 from the mature miR‐143 sequence) (Fig 1A and Dataset EV1).
Figure 1. rs41291957 selection.
-
AGraphic representation of the workflow used to select rs41291957.
-
B, CSecondary structure prediction of the primary‐miR‐143/145 sequence, based on structural models of centromeric predictions of the miRNA primary sequences carrying the G‐ or A‐allele, based on base pair annealing probability (coloured boxes identify the precursor sequences for miR‐143 and miR‐145).
Secondary structure prediction
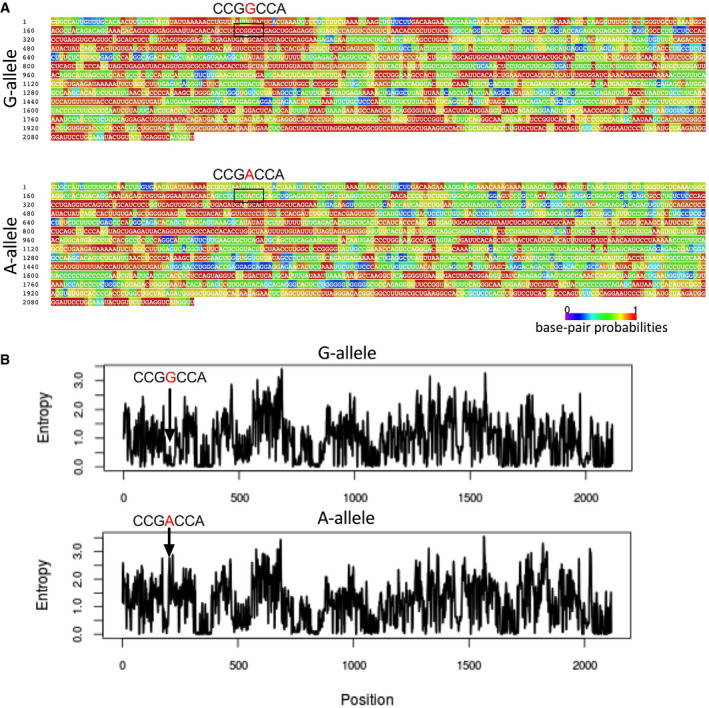
The miR‐143/145 cluster’s promoter is located −3 to −4 kb from the primary miRNA sequence (Cordes et al, 2009; Xin et al, 2009), whereas rs41291957 is localized within the miR‐143/145 primary transcript. So, it is conceivable that this variation has no influence on transcription of the miRNA cluster. We therefore asked whether rs41291957 might modulate the structure of this long transcript. With this aim, we performed in silico prediction of the cluster’s secondary structures for the reference (G) and minor (A) alleles. A significant difference in minimum free energy between the primary miRNAs of the two alleles was found (ΔG: G‐allele, −594.32 kcal/mol; A‐allele, −499.86 kcal/mol). The lower minimum free energy of the A‐allele highlighted a potentially less complex structure with greater accessibility for miRNA maturation enzymes (Fig 1B). Accordingly, the base pair probability values of the A‐allele were, in general, lower than those of the G‐allele (Fig EV1A). Moreover, the A‐allele had increased potential molecular entropy (Fig EV1B), a finding that could explain the altered loop formation at the beginning and end of the primary miRNA sequence (Fig 1B and C) and confirming the different energy stabilization of the global secondary structure.
Figure EV1. Thermodynamic analysis of the miR‐143/145 primary sequence.
-
ABase pair annealing probability using a centromeric prediction algorithm was carried out for the G‐ and A‐allele sequences (the base in red indicates the variation).
-
BEntropy level profiles of the G‐ and A‐allele transcripts.
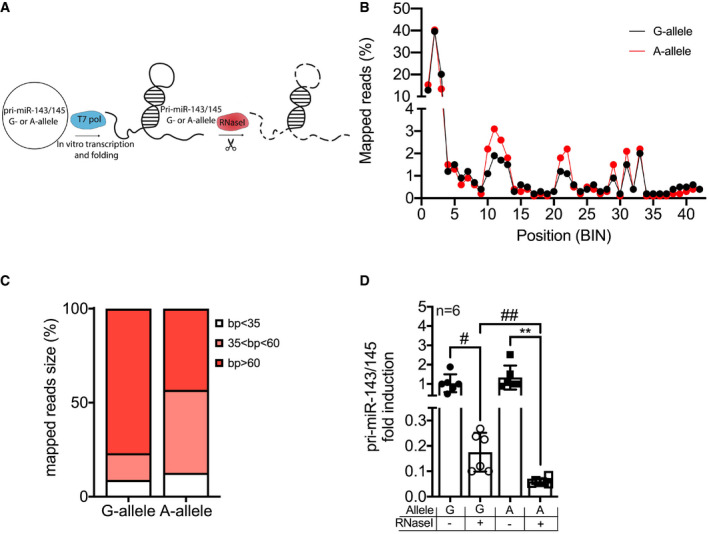
To corroborate this hypothesis, we evaluated in vitro whether there were differences in the structures of the pri‐miRs carrying the WT allele (G) and the rs41291957 variation (A). To address this, we performed in vitro transcription, folding and digestion with RNaseI, an enzyme that degrades linear RNA but not the duplex form (Fig 2A), and then employed TapeStation analysis to assess the sizes of the obtained fragments. We found that the SNP transcript generated an increased number of shorter segments (Fig EV2). Subsequently, the digested RNAs were processed for RNA sequencing, and the obtained reads aligned versus the reference sequences carrying either the WT (G) or the mutated (A) allele. This analysis indicated that the two pri‐miRNAs had different read enrichment profiles (Fig 2B), a finding strongly suggestive of the two RNAs having different secondary structures, as already indicated by the in silico modelling (Fig 1B). Furthermore, the presence of rs41291957 resulted in a higher number of short (bp < 35) and medium (35 > bp < 60) reads, confirming the differential digestion result obtained with RNaseI (Fig 2C). These observations were further validated by quantitative PCR (RT–qPCR) analysis, which clearly demonstrated an increased digestion rate for the rs41291957 sequence (Fig 2D). Of note, this finding is in line with a less stable secondary structure, as suggested by the thermodynamic profile (Fig EV1A and B).
Figure 2. Analysis of the secondary structure of the pri‐miR‐143/145 carrying the G‐ or A‐allele.
-
ACartoon showing the experimental setting for the RNaseI cleavage experiments.
-
BMapped reads (%) of RNaseI‐digested pri‐miR‐143/145 carrying G‐ (black line) or A‐allele (red line). The length of the primary miRNA was divided into blocks of 50 bp, defined as BIN.
-
CSizes of the mapped reads (%) for the RNaseI‐digested pri‐miR‐143/145 carrying G‐ or A‐allele; reads were divided into three groups: blocks < 35 bp (white), blocks > 35 bp and < 60 bp (red), and blocks > 60 bp (black).
-
DQuantification by RT–qPCR of RNaseI‐digested pri‐miR‐143/145 carrying G‐ or A‐allele, and not digested controls (n = 6).
Data information: Data are shown as mean ± standard deviation (SD) and n indicates the number of biological replicates. To compare means, one‐way ANOVA with Tukey's multiple comparisons test was used. #Adj P = 0.021, ##Adj P = 0.041, **Adj P = 0.015.
Figure EV2. TapeStation profiles of the G‐ and A‐allele digested pri‐miR‐143/145.
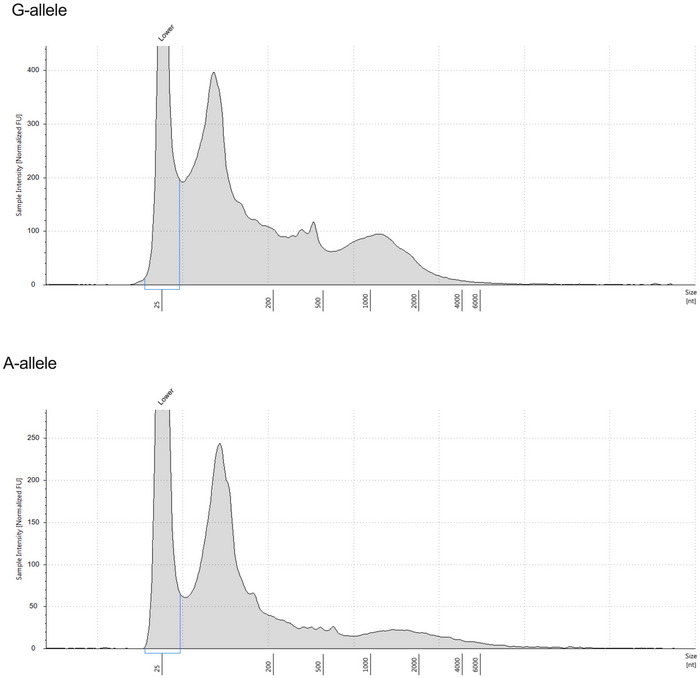
Altogether, modelling and in vitro results supported the hypothesis that the A‐allele facilitates the processing of miR‐143 and miR‐145 transcripts.
miR‐SNP rs41291957 and miR‐143/145 processing in vitro
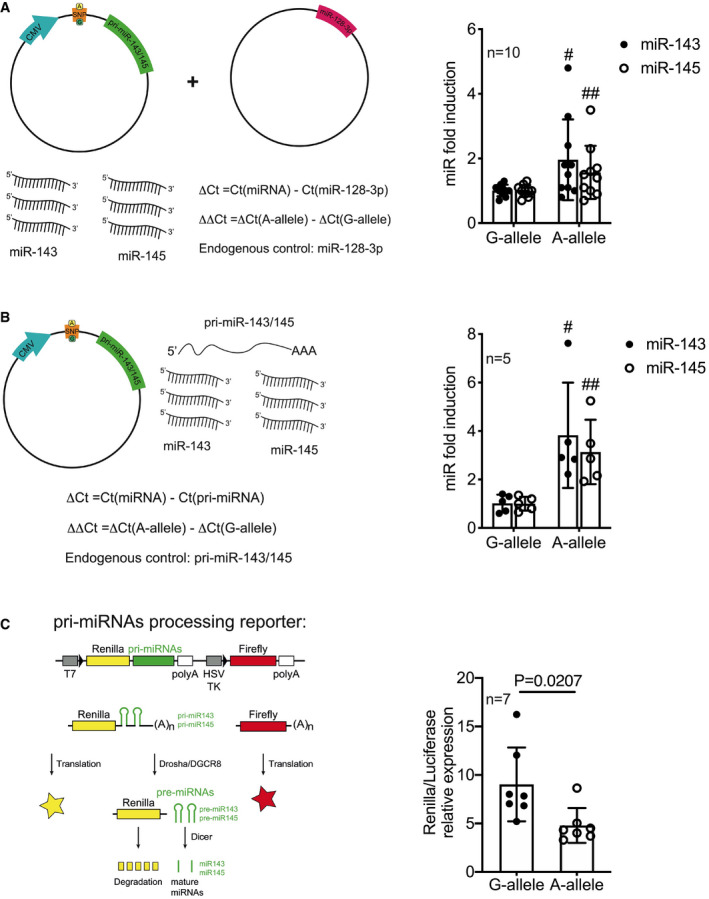
To assess whether the presence of rs41291957 affects miR‐143/145 abundancy, we cloned the primary bicistronic miR‐143/145 transcript in an expression vector, using the reference WT sequence, and then introduced the rs41291957 minor‐A‐allele by directed mutagenesis (Appendix Fig S1A). The constructs containing either the reference WT sequence (G) or the rs41291957 variant (A) were then transfected into HEK‐293T cells—which express endogenous miR‐143/145 at a low basal level—together with a plasmid carrying the mature sequence of an unrelated miRNA (i.e., miR‐128) in order to normalize the effects of transfection. We found that the presence of the A‐allele was associated with significantly increased levels of mature miR‐143 and miR‐145 (Fig 3A).
Figure 3. Mature miR‐143 and miR‐145 levels are increased by the presence of the A‐allele.
-
ACartoon showing the method utilized to quantify miR‐143 and miR‐145 levels in the presence of the A‐allele (left). Mature miRNA level quantification (RT–qPCR) in HEK‐293T cells transfected with vectors carrying the G‐ or A‐allele and normalized on miR‐128 (n = 10; right).
-
BCartoon showing the method utilized to quantify miR‐143 and miR‐145 maturation levels in the presence of the A‐allele (left). Mature miRNA level quantification (RT–qPCR) in HEK‐293T cells transfected with vectors carrying the G‐ or A‐allele and normalized on pri‐miR‐143/145 (n = 5; right).
-
CCartoon showing the reporter construct method utilized to quantify miR‐143 and miR‐145 processing (left). Quantification in HCASMCs transfected with vectors carrying the pri‐miR‐143/145 as 3′UTR G‐ or A‐allele and normalized on Luciferase signal (n = 7; right).
Data information: Data are shown as mean ± standard deviation (SD), and n indicates the number of biological replicates. To compare means, unpaired Student’s t‐test was used, considering data from G‐allele as control; For A: # P = 0.0286, ## P = 0.0456; For B: # P = 0.004, ## P = 0.000006.
We then assessed whether the variation might influence miRNA processing. We reasoned that since the G and A vectors differed only in the variation sequence and that transcription was guided by the cytomegalovirus (CMV) promoter, pri‐miR‐143/145 expression should not differ between the two plasmids; any difference in mature miR‐143 and ‐145 levels should, thus, depend only on miRNA processing. To test this hypothesis, the above‐mentioned constructs (for the G‐ and A‐alleles) were individually transfected in HEK‐293T cells, and mature miR‐143 and miR‐145 levels measured 48 h later by RT–qPCR and normalized on the pri‐miR‐143/145 (Fig 3B, left). The presence of the A‐allele was associated with significantly increased levels of mature miR‐143 and miR‐145 (Fig 3B, right). This finding was strongly indicative of increased processing of the immature miRNA harbouring the SNP.
To further corroborate the processing hypothesis, we utilized a ratiometric dual‐reporter construct (Psicheck2) that simultaneously expressed two chemiluminescent proteins, Renilla and Luciferase, driven by independent promoters (Fig 3C, left). In this reporter, the pri‐miRNA sequences—either WT or SNP—were inserted into the 3′‐UTR of the Renilla expression cassette, whereas the Luciferase gene expression remained unaltered. Thus, these constructs expressed a Renilla–pri‐miRNA fusion RNA. Cleavage of the fused pri‐miRNA by Drosha was expected to affect 3′UTRs, resulting in the removal of the polyadenylation tail, and consequentially leading to the degradation of Renilla mRNA. The luciferase signal allowed for the normalization of changes of individual cell transcriptional and translational activities. Thus, the Renilla/Luciferase firefly ratio negatively correlated with pri‐miRNA processing activity. Both constructs were transfected in WT human coronary artery SMCs (HCASMCs), and indeed, the presence of the A‐allele was associated with a reduced Renilla/Luciferase ratio, confirming the positive influence of this genetic variation on maturation of miR‐143 and miR‐145 (Fig 3C, right).
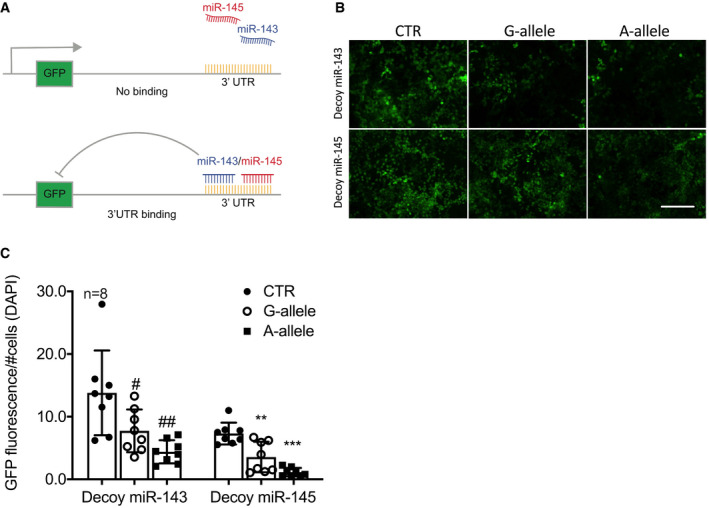
To strengthen the validity of these findings, we generated HEK‐293T cells that constitutively expressed decoy vectors in which green fluorescence protein (GFP) cDNA was linked 3′ to two complimentary tandem sequences containing the miRNA binding sites (Fig 4A and Table EV1), so that when either miR‐143 or miR‐145 bound the mimetic target, GFP was degraded and the fluorescent signal reduced (Climent et al, 2015). miR‐143 and miR‐145 decoy‐expressing cells—previously selected by FACS—were transduced with the above‐utilized vectors carrying the G‐ or A‐allele, and GFP intensity evaluated by microscopy; the resulting signal was then normalized for the number of cells (assessed with DAPI staining). We observed a strong reduction in total GFP signal in the presence of the reference allele compared to control vectors (Empty and G‐allele vectors). As expected, further GFP decay was measured in the A‐allele‐transduced population, supporting the functional capacity of this genetic variant to enhance the production of mature miR‐143 and miR‐145 (Fig 4B and Appendix Fig S2A). These findings confirmed that the total fluorescent signal of transduced cells was proportional to miRNA levels: CTR vector > G‐allele vector > A‐allele vector (Fig 4C).
Figure 4. Functionality studies of the A‐allele in cells.
-
ACartoon showing the mechanism of action of the utilized decoy system.
-
BHEK‐293T cells transduced with lentiviral particles harbouring either the miR‐143 or miR‐145 decoy sequence were transfected with empty (CTR), G‐allele, or A‐allele vectors. Images were taken 48‐h post‐transfection. Scale bar: 100 μm.
-
CRelative quantification normalized on the number of cells (DAPI signal) (n = 8).
Data information: Data are shown as mean ± standard deviation (SD), and n indicates the number of biological replicates. To compare means, one‐way ANOVA with Tukey's multiple comparisons test was used. #Adj P = 0.031, ##Adj P = 0.047, **Adj P = 0.048, ***P = 0.026.
Altogether, these results strongly supported the hypothesis that rs41291957 minor‐A‐allele aids miR‐143 and miR‐145 expression by increasing pri‐miRNA processing.
Insertion of miR‐SNP rs41291957 in CRISPR‐Cas9‐edited HEK‐293T cells increases miR‐143 and miR‐145 transcripts
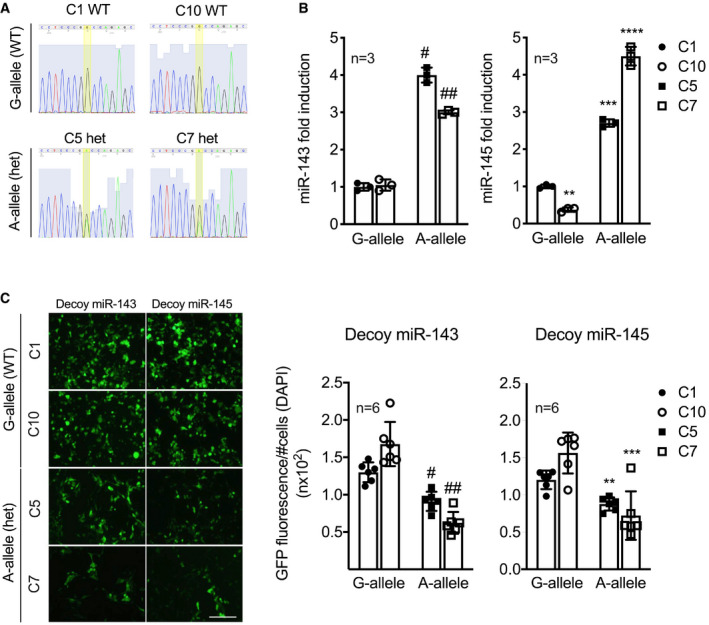
To further corroborate the findings obtained using constructs transiently carrying rs41291957, we adopted a CRISPR‐Cas9 gene‐editing approach based on homologous recombination, obtaining HEK‐293T cells stably carrying the allelic variation. We tested four potential single‐guide (sg)RNAs localized close to the variation site and employed the one with the greatest nicking capacity (Appendix Fig S3). Following transfection, several puromycin‐resistant clones were obtained and subsequently selected, expanded and screened by Sanger sequencing. Through this process, we identified two clones in which the variation was present in heterozygosis (G/A: C5 het; C7 het), whereas two clones with the G‐allele in homozygosis (G/G: C1 wt; C10 wt) were used as controls (Fig 5A). Then, we performed RT–qPCR analysis, normalizing the level of expression of both miRNAs on the endogenous housekeeping gene U6. We found increased expression of miR‐143 and miR‐145 in both clones carrying the A‐allele compared to WT ones (Fig 5B), demonstrating that the allelic variation positively modulated miRNA expression.
Figure 5. Genetically modified HEK‐293T cells carrying the rs41291957 variant and effect on miR‐143/145 levels.
-
ASanger sequence profiles of the CRISPR/Cas9‐mutated clones.
-
BLevels of miR‐143 and miR‐145 measured by RT–qPCR (n = 3).
-
CHEK‐293T clones were transduced with decoy miR‐143 and miR‐145 constructs. Then, 48‐h post‐infection, images were taken and processed: the GFP signal was quantified and normalized by the number of cells (DAPI) (n = 6). Scale bar: 50 μm.
Data information: Measurements were calculated as per cent of control (C1) as reference. Data are shown as mean ± standard deviation (SD), and n indicates the number of biological replicates. To compare means, one‐way ANOVA with Dunnett's multiple comparisons test was used in B and C. For B: #Adj P = 7 x 10⁻⁴, ##Adj P = 3.6 × 10⁻³, **Adj P = 0.017, ***Adj P = 5.6 × 10⁻⁴, ****Adj P = 4.7 × 10⁻³; For C: #Adj P = 0.011, ##Adj P = 1.4 × 10⁻⁴, **Adj P = 9.8 × 10⁻³, ***Adj P = 0.031. WT, wild‐type clones; het, heterozygote G/A clones.
To validate the biological activity of modulated miR‐143 and miR‐145 expression, the four clones were transiently transfected with decoy constructs for miR‐143 or miR‐145, working as described above (Fig 4A), and the fluorescence signal normalized for the number of (DAPI‐positive) cells 48 h later. According to expectations, clones expressing rs41291957 had a marked reduction in normalized fluorescence, a finding functionally explaining the increase in endogenous levels of miR‐143 and miR‐145 in the presence of the minor A‐allele (Fig 5C and Appendix Fig S2B).
Taken together, these results showed that miR‐SNP rs41291957 positively influenced the expression of miR‐143 and miR‐145 in genetically edited cells.
miR‐SNP rs41291957 increases the expression of miR‐143 and miR‐145 in HCASMCs, influencing their phenotypic characteristics
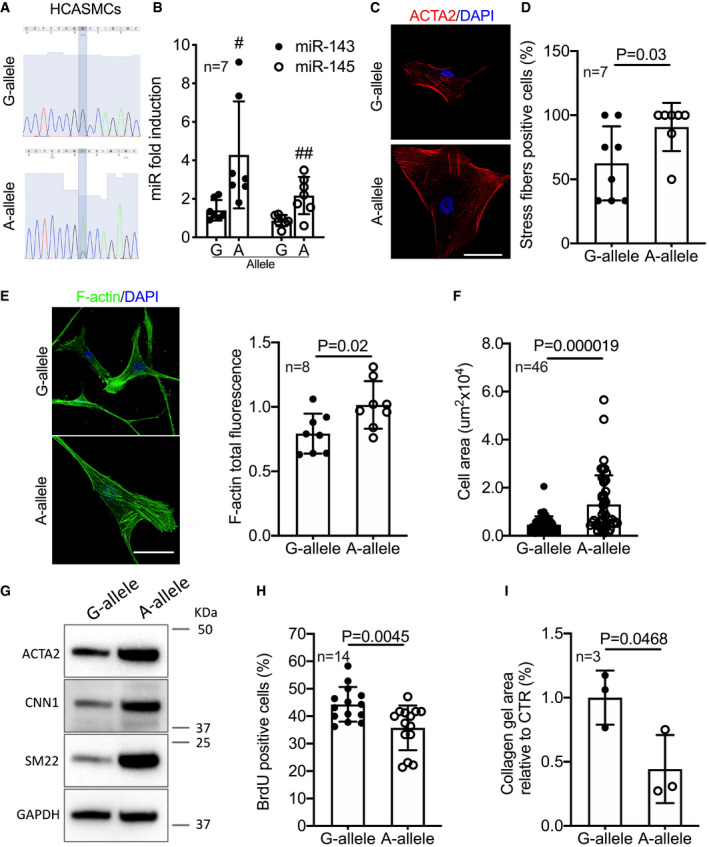
Thereafter, we investigated the impact of this genetic variant in primary HCASMCs. For this purpose, we took advantage of a previous genetic screening performed at the Quertermous laboratory (Liu et al, 2018). Among the reported lines, we identified two commercially available lots carrying the reference (G/G) or the mutated (G/A) rs41291957 allele obtainable from the same vendor (Fig 6A and Appendix Fig S4A). RNAs from both clones were collected at different passages and the levels of mature miR‐143 and miR‐145 measured by RT–qPCR. Data clearly showed that the A‐allele positively modulated miR‐143 and miR‐145 expression in HCASMCs (Fig 6B). Of note, cells carrying the A‐allele appeared phenotypically different from the control (G/G) ones. Indeed, they were wider and had a rearranged cytoskeleton (Fig 6C and Appendix Fig S4B), as demonstrated by an increase in the number of cells presenting highly organized smooth muscle actin (ACTA2) stress fibres (Fig 6D), findings suggestive of a more differentiated state.
Figure 6. Characteristics of HCASMCs carrying the A‐allele.
-
ASanger sequence profiles of the HCASMC primary lines.
-
BLevels of miR‐143 and miR‐145 measured by RT–qPCR (n = 7).
-
CRepresentative images of HCASMC clones stained for ACTA2 (representative images chosen for similarity to the global quantification). Scale bar: 10 μm.
-
DQuantification of actin signal fluorescence organized in stress fibres (n = 7).
-
ERepresentative images of HCASMC clones stained with phalloidin (representative images chosen for similarity to the global quantification). Scale bar: 10 μm. Quantification of actin signal fluorescence normalized on the total number of cells (n = 8).
-
FQuantification of cellular area of HCASMCs carrying the G and A‐allele (n = 46).
-
GExpression of human VSMC differentiation markers measured by Western blot for ACTA2, CNN1, and SM22 expression in G‐ and A‐allele cells. Representative images of at least three individual experiments.
-
HProliferation rate measured by BrdU incorporation assay (n = 14).
-
IGelatin contraction assay of HCASMCs carrying the G and A‐allele, stimulated with angiotensin II (n = 3).
Data information: Data are shown as mean ± standard deviation (SD) and n indicates the number of biological replicates. To compare means, unpaired Student’s t‐test was used considering data from G‐allele as control. For B: # P = 0.01, ## P = 0.002.
Source data are available online for this figure.
To address this in detail, we evaluated F‐actin organization (Fig 6E), finding that miR‐SNP rs41291957 promoted F‐actin organization and increased the area (Fig 6F) and external dimensions (Fig EV3A) of the cells. At the translational level, increased expression of ACTA2, CNN1 and SM22—markers of VSMC differentiation—was observed (Figs 6G and EV3B). Coherently, in the presence of this polymorphism there was less proliferation (Figs 6H and EV3C) and increased contractility upon stimulation with Angiotensin II (AngII) (Fig 6I), but no difference in migration (Fig EV3D).
Figure EV3. HCASMC biological feature analysis.
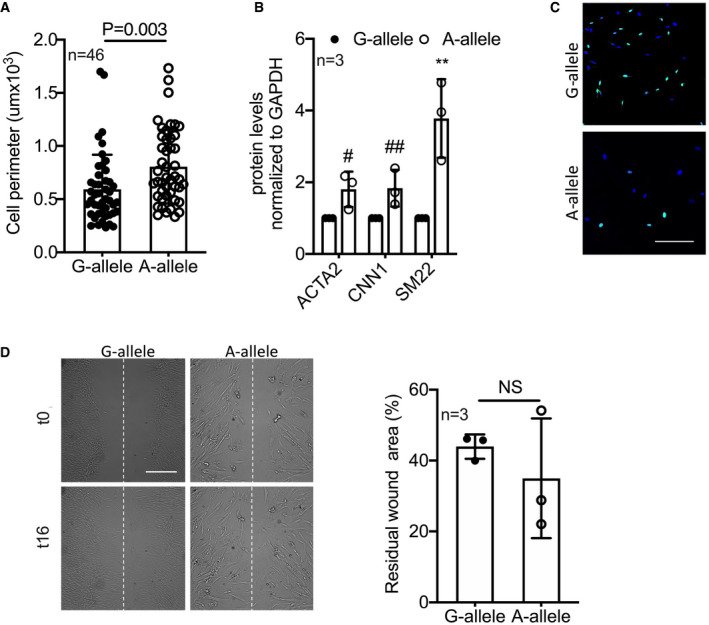
-
AQuantification of the perimeter of HCASMCs carrying the G‐ and A‐allele (n = 46).
-
BQuantification of Western blots in Fig 6G (n = 3).
-
CRepresentative picture of BrdU incorporating HCASMCs. Scale bar: 50 μm.
-
DMigration properties measured by scratch (n = 3). Scale bar 250 μm.
Data information: Data are shown as mean ± standard deviation (SD), and n indicates the number of biological replicates. To compare means, unpaired Student’s t‐test was used considering data from G‐allele as control. For B: # P = 0.0048, ## P = 0.0047, **P = 0.011. NS: not statistically significant.
Collectively, these results clearly suggested that the A‐allelic variant promoted a differentiated phenotype in human VSMCs by modulating expression of miR‐143 and miR‐145.
Inhibition of miRNA‐143 and miR‐145 blunts miR‐SNP rs41291957‐mediated HCASMC phenotype changes
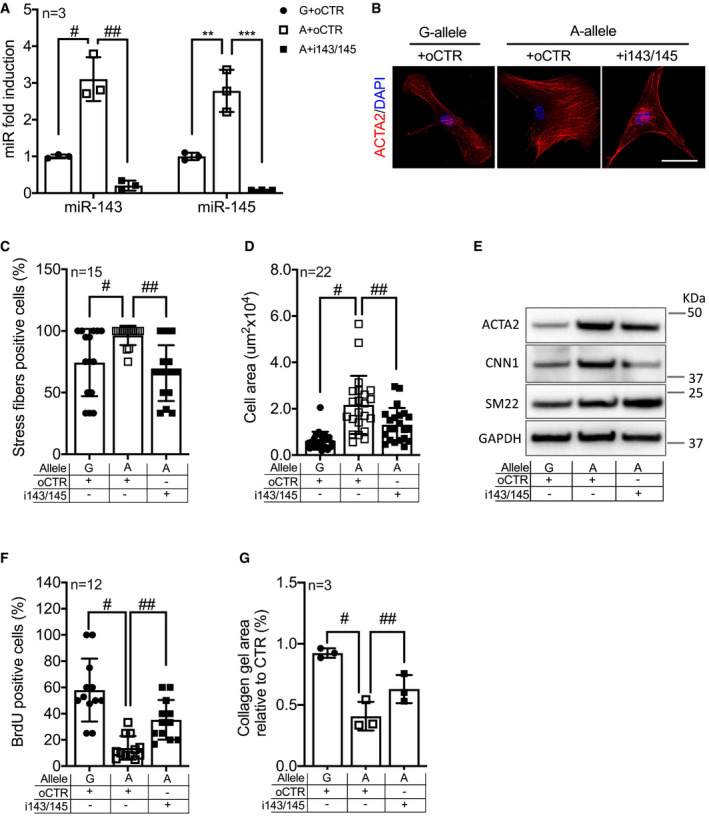
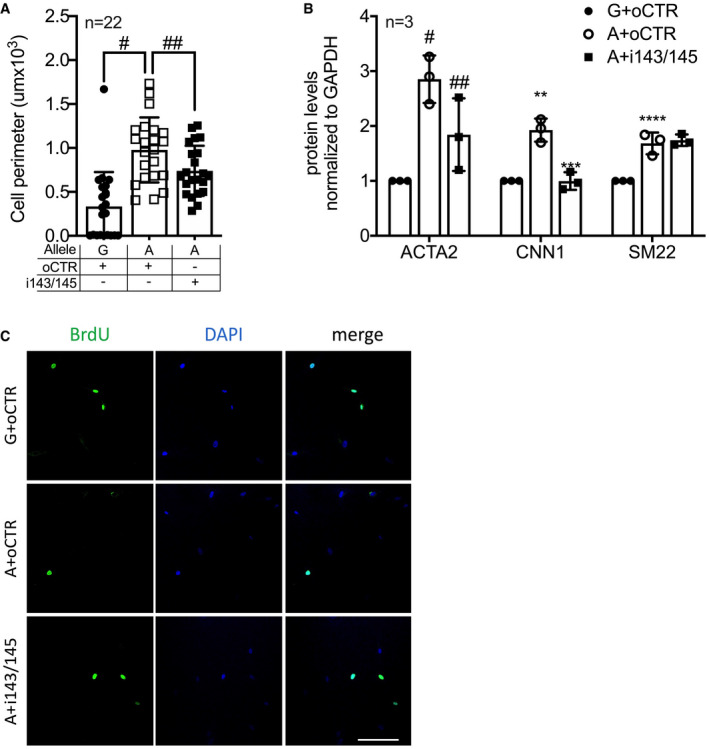
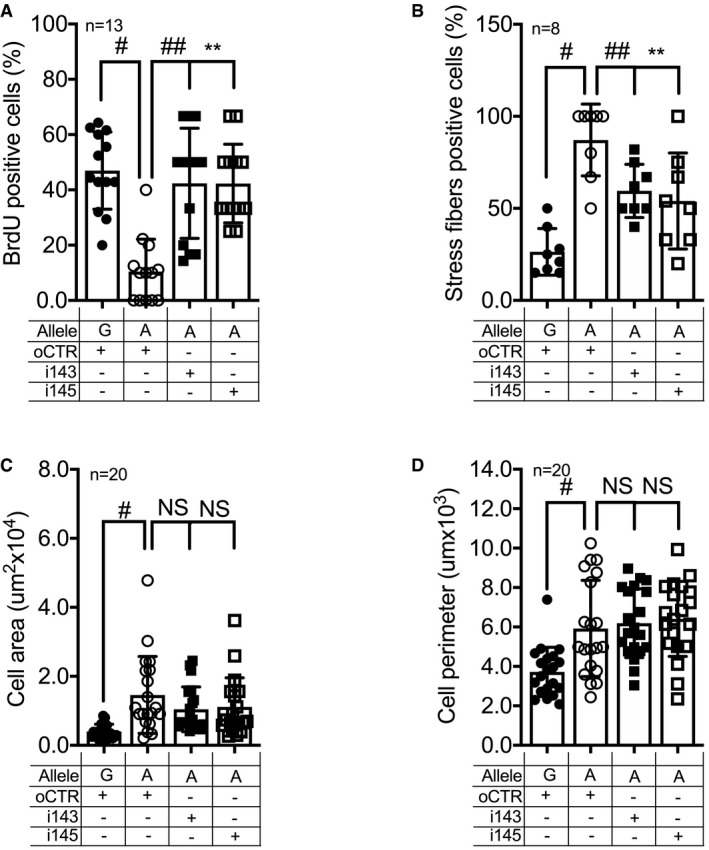
“Phenotypic rescue” experiments combining the use of two locked‐nucleotide anti‐miRs (LNAs) against both miRNAs (i143+i145) were carried out to demonstrate that the differentiated/contractile phenotype of A‐allele‐carrying HCASMCs (A‐HCASMCs) was dependent on miR‐143 and miR‐145 expression. First, RT–qPCR analysis confirmed the reduction of miR‐143 and miR‐145 in cells transduced with the anti‐miRNA oligonucleotides compared to control oligonucleotide‐transfected cells (Fig 7A). Normalization of miRNA expression blunted the biological effects of rs41291957 in mutant A‐HCASMCs, re‐establishing the features of the G‐allele‐carrying cells (G‐HCASMCs). This was already evident when observing ACTA2 organization in A‐HCASMCs transfected with the anti‐miRNA oligonucleotides (Fig 7B): Indeed, the percentage of stress fibres (Fig 7C) and the sizes (Figs 7D and EV4A) of these cells were comparable with those of G‐HCASMCs. From the molecular point of view, i143/145 A‐HCASMCs had normalized protein levels of ACTA2 and CNN1, but not SM22, which probably follows different kinetics (Figs 7E and EV4B). The findings strongly indicated it was possible to reinstate the differentiated state of WT HCASMCs by solely restoring the expression of the two miRNAs. Assessments of proliferation (Figs 7F and EV4C) and contractility (Fig 7G) confirmed this hypothesis. In contrast, inhibition of a single miRNA family member resulted in incomplete recovery of the features observed in HCASMCs carrying the G‐allele (Fig EV5). Thus, the impact of the genetic variant on VSMCs relies on both members of miRNA143/145 cluster rather than on a single miRNA.
Figure 7. miRNA‐143/145 silencing disrupts the effect of miR‐SNP rs41291957 in HCASMCs.
-
ALevels of miR‐143 and miR‐145 measured by RT–qPCR in the rescue setting (n = 3).
-
BRepresentative images of HCASMC clones stained for ACTA2 (representative images chosen for similarity to the global quantification). Scale bar: 10 μm.
-
CQuantification of actin signal fluorescence organized in stress fibres in the rescue setting (n = 15).
-
DQuantification of cellular area of HCASMCs in the rescue setting (n = 22).
-
EWestern blot for ACTA2, CNN1 and SM22 expression in the rescue setting. Representative images of at least three individual experiments.
-
FProliferation assay measured by BrdU incorporation in the rescue setting (n = 12).
-
GGelatin contraction assay of HCASMCs stimulated with angiotensin II in the rescue setting (n = 3).
Data information: Data are shown as mean ± standard deviation (SD), and n indicates the number of biological replicates. To compare means, one‐way ANOVA with Tukey’s multiple comparisons test was used. For A: #Adj P = 0.036, ##Adj P = 0.006, **Adj P = 0.049, ***Adj P = 0.017; For C: # P = 0.037, ## P = 0.0003; For D: # P = 0.0001, ## P = 0.033; For F: # P = 0.034, ## P = 0.015; For G: # P = 0.0002, ## P = 0.01.
Source data are available online for this figure.
Figure EV4. miR‐143 and miR‐145 inhibition affects HCASMCs biological features.
-
AQuantification of size of HCASMCs carrying either the G‐ or A‐allele transfected with a control oligonucleotide (oCTR) or after miR‐143/145 inhibition (i143/145) (n = 22).
-
BQuantification of Western blots in Fig 7E (n = 3).
-
CRepresentative picture of BrdU incorporation. Scale bar: 50 μm.
Data information: Data are shown as mean ± standard deviation (SD), and n indicates the number of biological replicates. To compare means, one‐way ANOVA with Tukey’s multiple comparisons test was used. For A: #Adj P = 0.0001, ##Adj P = 0.0475; For B: #Adj P = 0.032, ##Adj P = 0.033, **Adj P = 0.03, ***Adj P = 0.025, ****Adj P = 0.048.
Figure EV5. miRNA‐143 or 145 silencing partially rescues the effects of miR‐SNP rs41291957 on HCASMCs.
-
AProliferation assay measured by BrdU incorporation in the rescue setting (n = 13).
-
BQuantification of actin signal fluorescence organized in stress fibres in the rescue setting (n = 8).
-
CQuantification of cellular area of HCASMCs in the rescue setting (n = 20).
-
DQuantification of cellular perimeter of HCASMCs in the rescue setting (n = 20).
Data information: Data are shown as mean ± standard deviation (SD), and n indicates the number of biological replicates. To compare means, one‐way ANOVA with Tukey's multiple comparisons test was used. For A: #Adj P = 0.0001, ##Adj P = 0.0026, **Adj P = 0.0001; For B: #Adj P = 0.0001, ##Adj P = 0.039, **Adj P = 0.011; For C: # P = 0.0015; For D: # P = 0.0026. NS: not statistically significant.
Altogether, these findings proved that the effects of miR‐SNP rs41291957 on phenotypic switching in human VSMCs were directly dependent upon modulation of miRNA‐143/145 cluster expression.
miR‐SNP rs41291957 is protective for chronic total occlusion in CAD patients
High levels of expression of miR‐143 and miR‐145 are associated with a functional vascular phenotype (Boettger et al, 2009; Cheng et al, 2009; Cordes et al, 2009; Xin et al, 2009; Quintavalle et al, 2010; Lovren et al, 2012; Climent et al, 2015). Therefore, to assess the clinical relevance of the data obtained in vitro, we screened for rs41291957 in patients with stable CAD (selected and enrolled from the Neapolis and LURIC studies). Clinical and angiographic features of all patients and of patients stratified for rs41291957 genotypes are given in Tables EV2 and EV3.
In the Neapolis cohort, 18.9% of patients carried the rs41291957 A‐allele (AA+GA): this subgroup was associated with a significant reduction in the prevalence of CTO compared to patients homozygous for the G‐allele, despite the higher rate of concomitant diabetes (the correlation with diabetes, which was nominally significant, did not survive multiple‐testing correction). Furthermore, stratification of the Neapolis cohort for CTO revealed that those with this type of lesion had significantly more complex, bifurcated and thrombotic lesions together with an increased length of the applied stents (Table EV4). Upon multivariate analysis, rs41291957 variation (from GG to GA or AA), hypertension, and prior percutaneous coronary intervention were independently associated with the presence of CTO (Fig 8).
Figure 8. Association of chronic total occlusion with clinical and angiographic features in the Neapolis cohort.
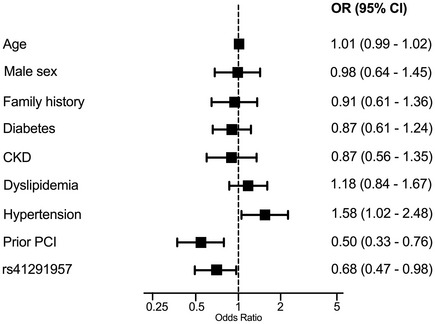
Age is presented per 1 year/point increase. CKD = chronic kidney disease, CI = confidence interval, OR = odds ratio, PCI = percutaneous coronary intervention.
Consistent with these data, 20.4% of LURIC‐cohort patients carried the rs41291957 A‐allele (AA+GA). Of note, this subgroup had significantly lower frequencies of previous and familial cases of MI and a lower prevalence of dyslipidaemia compared to patients with G‐allele homozygosis. Furthermore, rs41291957 was found to be significant in a multivariate analysis of CAD status adjusted for age, sex, type 2 diabetes, family history of MI, dyslipidaemia and hypertension (Table 1).
Table 1.
Multivariate association results for rs41291957 in LURIC study CAD patients.
| CHR | Pos | SNP | A1 | N | OR | 95% CI | P value | Phenotype |
|---|---|---|---|---|---|---|---|---|
| 5 | 148808390 | rs41291957 | A | 2,601 | 0.78 | 0.62–0.97 | 0.03 | CAD |
A1, Allele; CHR, chromosome; N, number of analysed individuals; OR, odds ratio; Pos, genomic position.
Collectively, these findings demonstrated that the A‐allele was directly associated with reduction of CAD events.
Discussion
In this study, we have determined a link between disease progression in stable CAD patients and a VSMC‐specific miR‐SNP—rs41291957—that affects miR‐143 and miR‐145 expression.
Following vascular injury, VSMCs switch from a contractile to a proliferative phenotype, a phenomenon associated with reduced levels of miR‐143 and miR‐145. This occurs via a complex molecular network involving the PDGF, TGF‐β and Notch pathways (Cheng et al, 2009; Elia et al, 2009; Boucher et al, 2011). Vascular delivery of both miRNAs has been reported to strongly reduce the development of vascular diseases, including atherosclerosis (Lovren et al, 2012) and stenosis (Cheng et al, 2009; Elia et al, 2009). The reasons for such remarkable effects might be several: upregulation of different direct targets involved in VSMC migratory and proliferative capacities (Quintavalle et al, 2010; Elia et al, 2018); modulation of cell types other than VSMCs, including endothelial cells (Hergenreider et al, 2012; Sala et al, 2014; Climent et al, 2015); and modulation of other non‐coding RNAs favouring neointimal formation (Hall et al, 2019; Farina et al, 2020).
Previous studies have assessed association between rs41291957 and disease outcome. No correlation was found in a Chinese population with sporadic congenital heart disease (Yang et al, 2014), but a significant correlation was observed for this SNP and cancer (Li et al, 2013; Wu et al, 2016), with rs41291957 speculated to be involved in regulating the activity of the miR‐143/145 promoter. However, since the promoter is located at a significant distance from the miR‐143/145 locus, a cis effect on the promoter is highly unlikely (Cordes et al, 2009; Xin et al, 2009). In contrast, we demonstrate here that the A‐allele variation modulates miR‐143/145 cluster maturation. A seminal study by Carlo M. Croce’s team showed that a single genetic variation in pri‐miR‐16‐1 bears functional consequences on miRNA maturation, increasing cancer susceptibility (Calin et al, 2005). Similarly, we determined that genetically modified cells as well as primary VSMCs carrying the rs41291957 variant had increased expression levels of miR‐143 and miR‐145, which in turn triggered a differentiated/contractile cellular phenotype.
Of importance for the clinical setting, we found that miR‐SNP rs41291957 was associated with the presence of a specific CAD phenotype in two large populations of stable CAD patients originating from different geographic areas and, therefore, of different ancestral origins. In the southern European Neapolis cohort, the analysed SNP protected against CTO development. CTO is defined as complete or nearly complete obstruction of a coronary artery, present for at least 3 months (Fraga et al, 2005). Whereas in the acute setting occlusion of collateral vessels develops suddenly, and adequate blood requirements may not be able to be restored, in CTO they develop gradually, limiting ischaemia and symptoms. From the etiological point of view, coronary CTO is characterized by the presence within the artery of atherosclerotic plaques in which VSMC dysfunction closely associates with the recanalization outcome (Brugaletta et al, 2012). In this cohort, we also observed a nominal association of rs41291957 with diabetes, which did not survive multiple‐testing correction, suggesting its independence to vascular biology. Of note, the CTO association was indeed independent from other potential confounders, including diabetes, as indicated by multivariate analysis. Unfortunately, in the LURIC cohort—utilized to validate the Neapolis findings—data on CTO were unavailable. Nonetheless, using a more stringent statistical method, we were still able to correlate rs41291957 with the general CAD phenotype.
Some limitations of our study should be underlined. First, we were not able to measure circulating miRNAs because plasma samples were not available; thus, future prospective investigations are required to compare miRNAs levels in the blood with rs41291957 genotype. Secondly, the retrospective analysis of the clinical studies did not allow us to discover any causal relationships between the A‐allele and the development of CAD/CTO. However, the in silico and in vitro findings were strongly coherent with the mechanistic explanation of this association and strongly support the hypothesis of a causal relationship. Finally, despite our extended experience with animal models, including miR‐143/145 knockouts, we did not perform any in vivo experiments. Indeed, we believe that knock‐in animals carrying the variation—besides being complex to generate—would very unlikely phenocopy what we observed in human VSMCs due to the sophistication of human genetic/epigenetic regulation.
In conclusion, findings of the present study indicate that rs41291957 modulates miR‐143 and miR‐145 expression, influencing the risk of CAD. Although future studies are warranted, this study is suggestive of miR‐SNP rs41291957 being a useful marker for the prognosis of CAD.
Materials and Methods
Selection of miR‐SNPs
The Ensembl database was systematically searched. SNPs affecting the miR‐143/145 cluster that could also improve detection of frequency differences in CAD patients and that had increased probability of affecting mature miRNA levels were identified according to the following inclusion criteria: variation lying within the primary‐miR‐143/145 transcript, with a minor allele frequency (MAF) > 10%.
Clinical study population
We studied two independent cohorts of CAD patients in order to determine the relevance of identified SNPs for CAD pathogenesis.
Derivation cohort
Initial analysis was performed utilizing the Neapolis study. It describes a cohort of 1,726 consecutive patients, mostly of southern European (Mediterranean) origin, with stable CAD treated with percutaneous coronary intervention (PCI) between 2010 and 2012 and evaluated retrospectively. A detailed description of enrolment and exclusion/inclusion criteria has been previously published (Viviani Anselmi et al, 2013). Briefly, all consecutive patients scheduled for elective PCI with drug‐eluting stents at Clinica Mediterranea (Naples, Italy) were considered for inclusion.
Validation cohort
The Ludwigshafen Risk and Cardiovascular Health (LURIC) study served as a validation cohort. It is a prospective cohort of 2,601 individuals of German ancestry, recruited between 1997 and 2000, with characteristics similar to that of the Neapolis study (i.e., stable CAD treated with PCI). A detailed description is published elsewhere (Winkelmann et al, 2001).
The studies comply with the Declaration of Helsinki, were approved by the local ethics committees and the experiments also conformed the Department of Health and Human Services Belmont Report. All patients provided informed consent.
Assessment of CAD phenotype
For the Neapolis cohort, coronary angiograms were reviewed to assess the number of diseased coronary vessels as well as the presence of CTO, bifurcation lesions, calcified lesions, B2/C coronary lesions (as per the AHA/ACC classification) and thrombotic lesions. CTO was defined as the presence of thrombolysis in MI flow within the occluded segment, and angiographic or clinical evidence or high likelihood of occlusion duration ≥ 3 months. A bifurcation lesion was defined as coronary artery narrowing > 1.5 mm in diameter adjacent to a side branch. Intraluminal thrombus was defined as intraluminal globular filling defects in multiple angiographic views.
In the LURIC cohort, CAD was diagnosed with angiograms, calculating vessel stenosis according to several thresholds: 10%, 20%, and 50% in one, two, or three vessels. For this study, a 50% threshold was used (Winkelmann et al, 2001).
Human samples: DNA extraction and genotyping procedure
For the Neapolis study, 4 ml whole peripheral blood was obtained from all patients at the time of PCI. Genomic DNA was extracted from mononuclear cells with the DNA QIAamp Midi kit (Qiagen Inc., CA, USA) according to the manufacturer’s recommendations, and the DNA stored at −20°C until used. The quantity and quality of the genomic DNA was verified with a NanoDrop spectrophotometer (Thermo Fisher Scientific, MA, USA) before being assayed with the ABI PRISM® 7900HT Sequence Detection System (Life Technologies, CA, USA), according to the manufacturer's protocol. Sample processing was fully automated, using the Freedom EVO®150 robotic workstation (Tecan Group Ltd., Männedorf, Switzerland). A custom SNP assay was synthesized by Life Technologies (FW: ACAGGAAACACAGTTGTGAGGAATT; RW: CCAACCTGGCCAGG AGAAG; Reporter_1‐VIC: CCTCCCGACCAGAGC; Reportert_2‐NFQ: CTCCCGGC CAGAGC).
In the LURIC study, blood samples were taken on the day of coronary angiography for posterior analysis of metabolites and genotyping (further details are described elsewhere) (Zewinger et al, 2017). For the genotypization of the cohort, the CardioMetabochip (Voight et al, 2012) and the OmniExpress chip (Illumina, San Diego, CA, USA) were used.
Cell culture
HEK‐293T cells were cultured in DMEM (Lonza) supplemented with 10% FBS (Lonza), 2 mM glutamine, 1 mM sodium pyruvate and 100 U/ml penicillin–streptomycin. Primary human VSMCs from coronary artery (HCASMC) were purchased from Cell Applications (Cat. #350‐05a: HCASMC WT lot#1386 and HCASMC SNP lot#1483) and cultured in 231 Medium (Life Technologies) supplemented with SMGS (Life Technologies) and 100 U/ml penicillin–streptomycin. All cultures were maintained in a humidified 5% CO2 atmosphere at 37°C.
Quantitative Real‐Time PCR (RT–qPCR)
For primary miRNA expression, RNA was reverse transcribed with a high‐capacity cDNA archive kit (Life Technologies), and RT–qPCR performed using SYBR Green (Promega). The utilized primers are listed in Table EV1. For mature miRNA expression, RNA was reverse transcribed using miRCURY LNA Universal RT (Qiagen). SYBR Green was used to perform the RT–qPCR for mature miR‐143, miR‐145, using U6 as internal control (Exiqon).
Isolation of genomic DNA from selected cells
DNA was isolated using the NucleoSpin Tissue kit from Macherey‐Nagel, following the manufacturer's instructions. DNA concentration was measured with a NanoDrop instrument (Thermo Scientific).
Amplification of the target genomic region by PCR
PCRs were performed using Taq DNA polymerase from Biotools, using the following primers: SNP957‐f TTACCACTTCCAGGCTGATG, SNP957‐r GAGATAGAAACTGGTCTGCC. PCR conditions were: 94°C for 3 min; 35X (94°C for 30 s, 57°C for 20 s, 72°C for 30 s); 72°C for 7 min; followed by 4°C. PCR products were analysed by 1% agarose gel electrophoresis and purified from the gel using the QIAquick PCR Purification Kit (Qiagen) for direct sequencing using SNP957‐f primer.
RNA secondary structure prediction
Secondary structures of the human miR‐143/145 primary sequence were predicted using the centroid estimator method (Ding et al, 2005). Minimum free energy was calculated (http://rna.tbi.univie.ac.at/cgi‐bin/RNAWebSuite/RNAfold.cgi) (Mathews et al, 2004; Gruber et al, 2008). To run the RNA folding prediction, we used the algorithm default parameters [Checked functions. Fold algorithms and basic options: “minimum free energy (MFE) and partition function,” “avoid isolated base pairs”; Dangling end options: “dangling energies on both sides of a helix in any case”; Energy Parameters: “RNA parameters (Turner model, 2004)”; Other Parameters: “rescale energy parameters to given temperature (C)” set at 37C]. The analysed region started −300 bp from the miR‐143 precursor and ended at the end of the miR‐145 precursor.
Transcription, folding and digestion of RNA in vitro
DNA products of the sequences carrying the G‐ or A‐allele controlled by the T7 promoter were obtained by PCR. In vitro transcription was performed following the manufacturer’s protocol of the T7 RNA polymerase (T7 polymerase Roche Cat# 10881767001). Briefly, the same amount of DNA was incubated with 1 mM rNTPs (Promega Cat#P113B), 20 U RNase inhibitor (Promega Cat# N261B) 2 h at 37°C and RNA purified with DirectzolT RNA Miniprep (ZymoResearch # ZYR2052). After, in vitro annealing of the secondary structure was done by incubating the same amount of RNA for each sample in duplicate at 70°C for 2 min in 10 mM Tris–HCl pH 7.5, 100 nM NaCl, 1 mM EDTA following a 15 min cool down of the samples at room temperature. For RNA cleavage of the secondary structure obtained, one of the duplicates produced was used as control of the digestion (no enzyme). Then, 5 U of RNaseI (Thermo Scientific Cat# EN0601) were added for the digestion in the Enzyme samples for 30 min at 37°C and inactivated at 100°C for 20 min. RNA was extracted using DirectzolT RNA Miniprep (ZymoResearch # ZYR2052). Finally, to evaluate the pri‐miRNA, cDNA was produced using the same amount of RNaseI‐digested RNAs for all samples using High‐Capacity cDNA RT kit (Applied Biosystems Cat# 4368813) and RT–qPCR performed using SYBR Green (Promega).
Library preparation and bioinformatics analysis of pri‐miR‐143/145 after cleavage
The libraries were prepared with the SMARTer smRNA‐Seq Kit for Illumina (Takara, Cat# 635031) and sequenced on the Illumina Next Seq550 platform. The raw reads were quality checked with FastQC tool version 0.11.9 (https://www.bioinformatics.babraham.ac.uk/projects/fastqc/) and trimmed with cutadapt tools (http://code.google.com/p/cutadapt/) version 1.18 with command:
cutadapt ‐m 15 ‐u 3 ‐a AAAAAAAAAA input.fastq > output.fastq.
The reads of the SNP sample were mapped against the pri‐miR‐143/145 sequence with A‐allele in 209 pb position; the reads of the WT sample were mapped against the WT sequence. Reads mapping was performed with Bowtie tool version 1.2.3 (Langmead et al, 2009) with default options. The two pri‐miR‐143/145 sequences were divided into bins of 50 bases each and the reads that mapped in each of the bins were counted, assigning the reads to the bin where they overlapped for more than 50% of their length, using bedtools coverage tool of BEDTools package version 2.29.0 (Quinlan & Hall, 2010). The number of mapped reads in each bin was normalized, dividing their number by the total number of mapped reads. We performed the analysis of reads length distribution importing the bam files of reads alignment in R software version 4.0.5 (https://www.R‐project.org/) with Rsamtools package version 2.6.0 (https://bioconductor.org/packages/Rsamtools) and counting the number of reads that had a length shorter than 35 bp, a length between 35 and 60 bp, and longer than 60 bp, after removing the duplicated reads from bam files with samtools rmdup function of SAMtools package version 1.6 (Li et al, 2009). Figures were generated with PRISMA software version 8.0.
Gene expression calculations
Data in Fig 2D: To evaluate pri‐miR‐143/145 expression following RNAseI digestion, data of the G‐ and A‐allele sequences treated with the enzyme were compared to the respective (untreated) control. The expression values were calculated with the following formula: ΔCt = Ct (pri‐miR143/145 G‐ or A‐allele – With enzyme) − Ct (pri‐miR143/145 G‐ or A‐allele – No enzyme). Data in Fig 3A: To evaluate miR‐143 and miR‐145 expression in the experiment shown in Fig 3A, we utilized miR‐128 derived from a co‐transfected plasmid. The expression values were calculated with the following formula: ΔCt = Ct (mature miR‐143 or miR‐145) − Ct (miR‐128); ΔΔCt = ΔCt (A‐allele) − ΔCt (G‐allele). Data Fig 3B: To evaluate the effect of the variation on miRNA processing, mature miRNA levels were normalized using the primary miRNA transcript as internal control, and the relative quantities calculated with the following formula: ΔCt = Ct (mature miRNA) − Ct (primary miRNA); ΔΔCt = ΔCt (A‐allele) − ΔCt (G‐allele). Here, primary miR‐143/145 was used as an internal control because vectors carrying the G‐ or A‐allele were driven by the same promoter, so no differences in transcription were expected.
Data in Figs 5, 6, 7: For all RT–qPCR data shown in these figures, mature miR‐143 and miR‐145 levels were normalized on the internal housekeeping gene U6, since we measured endogenous miRNAs.
CRISPR‐Cas9 construct design and clone generation
The human primary miR‐143/145 sequence was amplified from VSMCs. SNP rs41291957 was introduced using the QuikChange Site‐Directed Mutagenesis Kit, as described by the manufacturer (Stratagene). Sanger sequencing confirmed the introduction of the correct SNP variation.
The pSpCas9(BB)‐2A‐Puro (PX459) plasmid containing the human codon optimized SpCas9 gene with puromycin resistance was obtained from Addgene (#48139) (Ran et al, 2013). Using the CRISPR design algorithm (http://crispr.mit.edu), we identified four single‐guide (sg)RNAs located upstream of the genetic variation on the reverse DNA strand. Cloning of sgRNAs (sequences in Table EV1) was done according to Feng Zhang Lab CRISPR plasmid instructions (https://www.addgene.org/crispr/zhang/). The guides were then cloned into the plasmid PX459, and cells transfected with the plasmid together with the modified oligonucleotides containing the A‐allele variation (Table EV1). Guide efficiency was evaluated with the GeneArt Genomic Cleavage Detection Kit (Life Technologies).
Cell transfection and clone selection
To edit the genomic sequence of HEK‐293T cells, the PX459 vector containing the selected sgRNA (Guide 10) was transfected together with the oligonucleotides for the homologous recombination carrying the A‐allele, using Fugene transfection reagent (Promega). Following 72 h of puromycin treatment, clones were then isolated with a limited dilution approach.
To evaluate modulation of the mature miRNAs by DNA vectors, HEK‐293T cells were cultured in DMEM (Lonza) supplemented with 10% FBS (Lonza), 2 mM glutamine, 1 mM sodium pyruvate and 100 U/ml penicillin–streptomycin and maintained in a humidified 5% CO2 atmosphere at 37°C. Cells were seeded in 12‐well plates and transfected with 1–2 μg of plasmid DNA, depending on the assay, using the CaCl2 method. 48‐h post‐transfection, cells were collected, and total RNA isolated using PureZOL (Bio‐Rad), according to the manufacturer’s protocol.
To study the functionality of the miRNAs, HEK‐293T cells were cultured and transfected with decoys as explained above and, after 48 h, cells collected to evaluate GFP signal in either PBS/0.1% FBS for FACS analysis or PureZOL (Bio‐Rad) for RNA extraction.
Primary‐miR‐143/145 construct design
The wild‐type (WT) primary transcript sequence for miR‐143/145 was amplified from human VSMCs and cloned into an expression construct controlled by the cytomegalovirus (CMV) promoter (ViraQuest). Afterwards, the SNP variation was introduced using the Site‐Directed Mutagenesis kit (Agilent) and the correct modification confirmed by Sanger sequencing.
Cell transfection
Sorted HEK‐293T GFP‐positive cells harbouring decoy sequences were transfected with 500 ng of WT or SNP plasmid, using CaCl2 in standard conditions. After 48 h, cells were collected and processed for imaging.
Generation of lentiviral vectors
Production of Lenti‐Empty (CTR), Lenti‐Decoy‐miR‐143 and Lenti‐Decoy‐miR‐145 was performed as previously described (Climent et al, 2015). HEK‐293T cells were transduced with the generated lentiviral particles, and GFP‐positive cells were then sorted on a FACS ARIA (BD Biosciences).
Generation of decoys for miR‐143 and miR‐145
To study the functionality of miR‐143 and miR‐145, production of Lenti‐Decoy‐miR‐143 and Lenti‐Decoy‐miR‐145 was performed as previously described (Climent et al, 2015). Afterwards, HEK‐293T cells were transduced with the lentiviral vectors, GFP‐positive cells sorted using a FACS ARIA (BD Biosciences) and kept in culture for experiments.
Immunocytochemistry
HCASMCs were seeded on a glass‐coverslips, harvested and then fixed in 4% paraformaldehyde. Cell permeabilization was performed with 0.3% Triton X‐100 on ice for 10 min. Then, samples were blocked in PBS, 0.02% NP‐40, 1% bovine serum albumin (BSA) for 30 min. Smooth muscle actin (ACTA2) was visualized using a monoclonal primary antibody (Abcam, Ca# ab32575). Thereafter, MACH 1 Universal HRP‐Polymer Detection kit (BIOCARE Medical, Ca# M1U539) was utilized, following the manufacturer’s indications. After DAB development, haematoxylin counterstaining was performed, and images acquired with the VS120 DotSlide slide scanner (Olympus).
Immunostaining
ACTA2 and Phalloidin staining were performed to assess stress fibres and actin organization. HCASMCs were fixed in 4% paraformaldehyde and permeabilized with 0.3% Triton X‐100 at room temperature for 10 min. For ACTA2 staining, cells were marked using a monoclonal primary antibody (Abcam, Ca# ab32575) and a secondary antibody labelled with Alexa‐488; phalloidin staining was performed using a Phalloidin‐Alexa 488 (Life Technologies) primary conjugated antibody. Then, 4',6‐diamidino‐2‐phenylindole (DAPI) counterstaining was utilized to visualize nuclear localization. Finally, Diamond Prolong (Life Technologies) was used as the mounting medium. Confocal acquisitions were obtained using a SP8I Leica spectral confocal laser scanning microscope with a 20× objective lens and analysed with Fiji software. To evaluate actin filaments, smooth muscle actin (ACTA2) was measured as percentage of cells displaying stress fibres over the total number of cells per field. Alternatively, for phalloidin staining we measured the total GFP intensity over the total number of cells in each field.
BrdU incorporation assay
To evaluate HCASMC proliferation, cells were seeded on a glass coverslip at a 20% confluence and subsequently incubated with 5’‐Bromo‐2’‐Deoxy‐uridine (BrdU) reagent (Life Technologies, Ca# 000103) for 24 h, following the manufacturer’s indications. Cells were then fixed with 4% PFA for 15 min, rinsed, treated with 2 M HCl for 10 min at room temperature, rinsed, treated with Borate Buffer for 10 min at room temperature and then addressed to an immunofluorescence procedure. BrdU staining was performed using a primary anti‐BrdU antibody (Santa Cruz, Ca# sc‐32323) and visualized with a donkey anti‐rabbit Alexa‐488 secondary antibody (Life Technologies, Ca# A‐21202). DAPI counterstain was performed to visualize nuclear localization. Confocal acquisitions were performed as mentioned above. BrdU‐positive cells were detected and counted over total number of cells in each field using Fiji software.
Wound healing assay
HCASMCs were cultivated in 12‐well plates until they reached 100% confluence. A scratch in the cell layer was produced with a 20 µl pipette. Afterwards, cells were washed with 1× PBS and cell migration evaluated over time using the DMI8 Live Cell system (Leica).
Functional contractility assay
HCASMC were detached using Trypsin‐EDTA and resuspended at the concentration of 1.2x10⁵ cells/ml. Then, 0.2 ml of cell suspension was added to 0.1 ml of 3 mg/ml collagen solution (08‐115 Sigma) diluted in 0.1% Acetic Acid, and mixed thoroughly in a 1.5 ml Eppendorf tube. After adding an appropriate volume of 1 M NaOH to the mixture of cells and collagen, 200 μl of the mixture was immediately transferred to 48‐well plate. Gels were allowed to solidify for 20 min at room temperature and then 250 μl of fresh complete DMEM added. Thereafter, cells were immediately stimulated with 500 nM of angiotensin II to induce HCASMC contraction. Plates were then transferred to a 37°C incubator with a humidified 5% CO2 atmosphere. The extent of gel contraction was measured by calculating the area of gel with ImageJ software.
Luciferase reporter assay
HCASMCs were transfected in 12‐well dishes with 0.2 µg of WT or SNP primary miR143/145 psiCheck2 reporter. Transfection was performed with Lipofectamine LTX+Plus reagent (Life Technologies), following the manufacturer's protocol. Finally, cells were harvested 48‐h post‐transfection and analysed using the dual‐luciferase reporter assay system (Promega) as described by the manufacturer.
Western blotting
The utilized antibodies were the following: anti‐ACTA2 (Abcam, Ca# ab32575) at the dilution of 1:2,000, Anti‐CNN1 (Santa Cruz, Ca# sc‐136987) at the dilution of 1:500, Anti‐SM22 (Santa Cruz, Ca# sc‐53932) at the dilution of 1:500, and anti‐GAPDH (Santa Cruz, Ca# sc‐32233) 1:2,000. The secondary antibodies were the following: Goat anti‐Rabbit IgG (H + L) Cross‐Adsorbed Secondary Antibody, HRP (Life Technologies, Ca# G‐21234), Goat anti‐Mouse IgG (H + L) Cross‐Adsorbed Secondary Antibody, HRP (Life Technologies, Ca# G‐21040), at the dilution of 1:5,000.
Statistical analyses
For data from the Neapolis cohort, normality assumption was verified using the Shapiro–Wilk test. Categorical variables were expressed in percentages. Comparison between groups was performed by Student's t‐test or chi‐square test, as appropriate. For genetic analysis, Hardy–Weinberg equilibrium was determined using the chi‐square goodness‐of‐fit test and the average genotyping rate of rs41291957 was successfully verified for all patients. To evaluate the association between rs41291957 and CTO, logistic regression analysis under log‐additive genetic model was performed. To adjust the multivariate model, clinical predictors for CTO were previously selected according to the literature and significance (P < 0.1) at univariate analysis (Table EV4).
For LURIC, we performed logistic regressions with CAD status as a dependent variable, with adjustment for sex, age, type 2 diabetes, family history of MI, dyslipidemia status, and hypertension, using PLINK (Purcell et al, 2007).
To compare means in in vitro studies, data were first subject to ROUT test to identify possible outliers; for experiments with more than five biological replicates, data normality was calculated with the Kolmogorov–Smirnov (K‐S) test; statistical analyses were then performed with single or multiple two‐tailed t‐test (parametric unpaired or paired, two group of analysis), Mann–Whitney U‐test (nonparametric unpaired, two group of analysis) or repeated‐measures analysis of variance (ANOVA) followed by post hoc Tukey or Dunnett's multiple comparisons test for pairwise comparisons. Each experiment was replicated at least three times and the exact number or replicates reported in each figure panel. Data are shown as mean ± standard deviation (SD), unless differently noted. A 2‐tailed P‐value < 0.05 was deemed as statistically significant.
Statistical analyses were performed with the Stata v.11/SE program (College Station) and PRISM software (GraphPad).
Author contributions
IFH and MC conducted experiments, analysed the data and interpreted the results. LP performed experiments. CB designed the Neapolis protocol and collected the samples. CVA, VT, LL, FMF, MEK and WM analysed the data. GC analysed the data and wrote the manuscript. LE designed the project, analysed the data, interpreted the results and wrote the manuscript.
Conflict of interest
The authors declare that they have no conflict of interest.
For more information
https://www.humanitas‐research.org/groups/leonardo‐elia/
Supporting information
Appendix
Expanded View Figures PDF
Table EV1
Table EV2
Table EV3
Table EV4
Dataset EV1
Source Data for Expanded View and Appendix
Source Data for Figure 6
Source Data for Figure 7
Acknowledgements
We would like to thank Drs. Paolo Somma and Achille Anselmo for FACS analysis; Dr. Stefania Zani and Javier Cibella for the experimental help; Dr. Francesco Nicassio for the experimental suggestions; Professor Sir Nilesh J. Samani and Professor Seppo Kalevi Meri, for critical discussion. This work was supported by grants from: The “Placca” project, Italian Ministry of Health, to GC; the Horizon 2020 Research and Innovation Programme (under Grant Agreement No. 828984), the Italian Ministry of Health (No. GR‐2016‐02364133), and Italian Ministry of Research (No. 2017HTKLRF) to LE.
EMBO Mol Med (2021) 13: e14060.
Data availability
The data sets produced in this study are available in the following databases: https://www.ncbi.nlm.nih.gov/geo/query/acc.cgi?acc=GSE180017. The authors declare that all data supporting the findings of this study are available within the article and its supplementary information files.
References
- Bartel DP (2004) MicroRNAs: genomics, biogenesis, mechanism, and function. Cell 116: 281–297 [DOI] [PubMed] [Google Scholar]
- Boettger T, Beetz N, Kostin S, Schneider J, Kruger M, Hein L, Braun T (2009) Acquisition of the contractile phenotype by murine arterial smooth muscle cells depends on the Mir143/145 gene cluster. J Clin Invest 119: 2634–2647 [DOI] [PMC free article] [PubMed] [Google Scholar]
- Boucher JM, Peterson SM, Urs S, Zhang C, Liaw L (2011) The miR‐143/145 cluster is a novel transcriptional target of Jagged‐1/Notch signaling in vascular smooth muscle cells. J Biol Chem 286: 28312–28321 [DOI] [PMC free article] [PubMed] [Google Scholar]
- Brugaletta S, Martin‐Yuste V, Padró T, Alvarez‐Contreras L, Gomez‐Lara J, Garcia‐Garcia HM, Cola C, Liuzzo G, Masotti M, Crea F et al (2012) Endothelial and smooth muscle cells dysfunction distal to recanalized chronic total coronary occlusions and the relationship with the collateral connection grade. JACC Cardiovasc Interv 5: 170–178 [DOI] [PubMed] [Google Scholar]
- Calin GA, Ferracin M, Cimmino A, Di Leva G, Shimizu M, Wojcik SE, Iorio MV, Visone R, Sever NI, Fabbri M et al (2005) A MicroRNA signature associated with prognosis and progression in chronic lymphocytic leukemia. N Engl J Med 353: 1793–1801 [DOI] [PubMed] [Google Scholar]
- Cheng Y, Liu X, Yang J, Lin Y, Xu DZ, Lu Q, Deitch EA, Huo Y, Delphin ES, Zhang C (2009) MicroRNA‐145, a novel smooth muscle cell phenotypic marker and modulator, controls vascular neointimal lesion formation. Circ Res 105: 158–166 [DOI] [PMC free article] [PubMed] [Google Scholar]
- Climent M, Quintavalle M, Miragoli M, Chen J, Condorelli G, Elia L (2015) TGFbeta triggers miR‐143/145 transfer from smooth muscle cells to endothelial cells, thereby modulating vessel stabilization. Circ Res 116: 1753–1764 [DOI] [PubMed] [Google Scholar]
- Cordes KR, Sheehy NT, White MP, Berry EC, Morton SU, Muth AN, Lee TH, Miano JM, Ivey KN, Srivastava D (2009) miR‐145 and miR‐143 regulate smooth muscle cell fate and plasticity. Nature 460: 705–710 [DOI] [PMC free article] [PubMed] [Google Scholar]
- Ding Y, Chan CY, Lawrence CE (2005) RNA secondary structure prediction by centroids in a Boltzmann weighted ensemble. RNA 11: 1157–1166 [DOI] [PMC free article] [PubMed] [Google Scholar]
- Elfaki I, Mir R, Mir MM, AbuDuhier FM, Babakr AT, Barnawi J (2019) Potential impact of microRNA gene polymorphisms in the pathogenesis of diabetes and atherosclerotic cardiovascular disease. J Pers Med 9: 51 [DOI] [PMC free article] [PubMed] [Google Scholar]
- Elia L, Quintavalle M, Zhang J, Contu R, Cossu L, Latronico MVG, Peterson KL, Indolfi C, Catalucci D, Chen J et al (2009) The knockout of miR‐143 and ‐145 alters smooth muscle cell maintenance and vascular homeostasis in mice: correlates with human disease. Cell Death Differ 16: 1590–1598 [DOI] [PMC free article] [PubMed] [Google Scholar]
- Elia L, Condorelli G (2015) RNA (Epi)genetics in cardiovascular diseases. J Mol Cell Cardiol 89: 11–16 [DOI] [PubMed] [Google Scholar]
- Elia L, Quintavalle M (2017) Epigenetics and vascular diseases: influence of non‐coding RNAs and their clinical implications. Front Cardiovasc Med 4: 26 [DOI] [PMC free article] [PubMed] [Google Scholar]
- Elia L, Kunderfranco P, Carullo P, Vacchiano M, Farina FM, Hall IF, Mantero S, Panico C, Papait R, Condorelli G et al (2018) UHRF1 epigenetically orchestrates smooth muscle cell plasticity in arterial disease. J Clin Invest 128: 2473–2486 [DOI] [PMC free article] [PubMed] [Google Scholar]
- Faccini J, Ruidavets JB, Cordelier P, Martins F, Maoret JJ, Bongard V, Ferrieres J, Roncalli J, Elbaz M, Vindis C (2017) Circulating miR‐155, miR‐145 and let‐7c as diagnostic biomarkers of the coronary artery disease. Sci Rep 7: 42916 [DOI] [PMC free article] [PubMed] [Google Scholar]
- Farina FM, Hall IF, Serio S, Zani S, Climent M, Salvarani N, Carullo P, Civilini E, Condorelli G, Elia L et al (2020) miR‐128‐3p is a novel regulator of vascular smooth muscle cell phenotypic switch and vascular diseases. Circ Res 126: e120–e135 [DOI] [PubMed] [Google Scholar]
- Fichtlscherer S, De Rosa S, Fox H, Schwietz T, Fischer A, Liebetrau C, Weber M, Hamm CW, Röxe T, Müller‐Ardogan M et al (2010) Circulating microRNAs in patients with coronary artery disease. Circ Res 107: 677–684 [DOI] [PubMed] [Google Scholar]
- Fraga MF, Ballestar E, Paz MF, Ropero S, Setien F, Ballestar ML, Heine‐Suner D, Cigudosa JC, Urioste M, Benitez J et al (2005) Epigenetic differences arise during the lifetime of monozygotic twins. Proc Natl Acad Sci USA 102: 10604–10609 [DOI] [PMC free article] [PubMed] [Google Scholar]
- Glass CK, Witztum JL (2001) Atherosclerosis. the road ahead. Cell 104: 503–516 [DOI] [PubMed] [Google Scholar]
- Goren Y, Kushnir M, Zafrir B, Tabak S, Lewis BS, Amir O (2012) Serum levels of microRNAs in patients with heart failure. Eur J Heart Fail 14: 147–154 [DOI] [PubMed] [Google Scholar]
- Gruber AR, Lorenz R, Bernhart SH, Neuböck R, Hofacker IL (2008) The Vienna RNA websuite. Nucleic Acids Res 36: W70–W74 [DOI] [PMC free article] [PubMed] [Google Scholar]
- Hall IF, Climent M, Quintavalle M, Farina FM, Schorn T, Zani S, Carullo P, Kunderfranco P, Civilini E, Condorelli G et al (2019) Circ_Lrp6, a circular RNA enriched in vascular smooth muscle cells, acts as a sponge regulating miRNA‐145 function. Circ Res 124: 498–510 [DOI] [PubMed] [Google Scholar]
- Hergenreider E, Heydt S, Tréguer K, Boettger T, Horrevoets AJG, Zeiher AM, Scheffer MP, Frangakis AS, Yin X, Mayr M et al (2012) Atheroprotective communication between endothelial cells and smooth muscle cells through miRNAs. Nat Cell Biol 14: 249–256 [DOI] [PubMed] [Google Scholar]
- Langmead B, Trapnell C, Pop M, Salzberg SL (2009) Ultrafast and memory‐efficient alignment of short DNA sequences to the human genome. Genome Biol 10: R25 [DOI] [PMC free article] [PubMed] [Google Scholar]
- Li H, Handsaker B, Wysoker A, Fennell T, Ruan J, Homer N, Marth G, Abecasis G, Durbin R, Subgroup GPDP (2009) The Sequence Alignment/Map format and SAMtools. Bioinformatics 25: 2078–2079 [DOI] [PMC free article] [PubMed] [Google Scholar]
- Li L, Pan X, Li Z, Bai P, Jin H, Wang T, Song C, Zhang L, Gao L (2013) Association between polymorphisms in the promoter region of miR‐143/145 and risk of colorectal cancer. Hum Immunol 74: 993–997 [DOI] [PubMed] [Google Scholar]
- Libby P (2002) Inflammation in atherosclerosis. Nature 420: 868–874 [DOI] [PubMed] [Google Scholar]
- Liu B, Pjanic M, Wang T, Nguyen T, Gloudemans M, Rao A, Castano VG, Nurnberg S, Rader DJ, Elwyn S et al (2018) Genetic regulatory mechanisms of smooth muscle cells map to coronary artery disease risk loci. Am J Hum Genet 103: 377–388 [DOI] [PMC free article] [PubMed] [Google Scholar]
- Lovren F, Pan YI, Quan A, Singh KK, Shukla PC, Gupta N, Steer BM, Ingram AJ, Gupta M, Al‐Omran M et al (2012) MicroRNA‐145 targeted therapy reduces atherosclerosis. Circulation 126: S81–S90 [DOI] [PubMed] [Google Scholar]
- Mathews DH, Disney MD, Childs JL, Schroeder SJ, Zuker M, Turner DH (2004) Incorporating chemical modification constraints into a dynamic programming algorithm for prediction of RNA secondary structure. Proc Natl Acad Sci USA 101: 7287–7292 [DOI] [PMC free article] [PubMed] [Google Scholar]
- Mishra PJ, Bertino JR (2009) MicroRNA polymorphisms: the future of pharmacogenomics, molecular epidemiology and individualized medicine. Pharmacogenomics 10: 399–416 [DOI] [PMC free article] [PubMed] [Google Scholar]
- Purcell S, Neale B, Todd‐Brown K, Thomas L, Ferreira MAR, Bender D, Maller J, Sklar P, de Bakker PIW, Daly MJ et al (2007) PLINK: a tool set for whole‐genome association and population‐based linkage analyses. Am J Hum Genet 81: 559–575 [DOI] [PMC free article] [PubMed] [Google Scholar]
- Quinlan AR, Hall IM (2010) BEDTools: a flexible suite of utilities for comparing genomic features. Bioinformatics 26: 841–842 [DOI] [PMC free article] [PubMed] [Google Scholar]
- Quintavalle M, Elia L, Condorelli G, Courtneidge SA (2010) MicroRNA control of podosome formation in vascular smooth muscle cells in vivo and in vitro. J Cell Biol 189: 13–22 [DOI] [PMC free article] [PubMed] [Google Scholar]
- Quintavalle M, Condorelli G, Elia L (2011) Arterial remodeling and atherosclerosis: miRNAs involvement. Vascul Pharmacol 55: 106–110 [DOI] [PubMed] [Google Scholar]
- Ran FA, Hsu PD, Wright J, Agarwala V, Scott DA, Zhang F (2013) Genome engineering using the CRISPR‐Cas9 system. Nat Protoc 8: 2281–2308 [DOI] [PMC free article] [PubMed] [Google Scholar]
- Roger VL (2007) Epidemiology of myocardial infarction. Med Clin North Am 91: 537–552 [DOI] [PMC free article] [PubMed] [Google Scholar]
- Roncarati R, Viviani Anselmi C, Losi MA, Papa L, Cavarretta E, Da Costa Martins P, Contaldi C, Saccani Jotti G, Franzone A, Galastri L et al (2014) Circulating miR‐29a, among other up‐regulated microRNAs, is the only biomarker for both hypertrophy and fibrosis in patients with hypertrophic cardiomyopathy. J Am Coll Cardiol 63: 920–927 [DOI] [PubMed] [Google Scholar]
- Sala F, Aranda JF, Rotllan N, Ramirez CM, Aryal B, Elia L, Condorelli G, Catapano AL, Fernandez‐Hernando C, Norata GD (2014) MiR‐143/145 deficiency attenuates the progression of atherosclerosis in Ldlr‐/‐mice. Thromb Haemost 112: 796–802 [DOI] [PMC free article] [PubMed] [Google Scholar]
- Saunders MA, Liang H, Li WH (2007) Human polymorphism at microRNAs and microRNA target sites. Proc Natl Acad Sci USA 104: 3300–3305 [DOI] [PMC free article] [PubMed] [Google Scholar]
- Stone GW, Reifart NJ, Moussa I, Hoye A, Cox DA, Colombo A, Baim DS, Teirstein PS, Strauss BH, Selmon M et al (2005) Percutaneous recanalization of chronically occluded coronary arteries: a consensus document: part II. Circulation 112: 2530–2537 [DOI] [PubMed] [Google Scholar]
- Stratton MS, Farina FM, Elia L (2019) Epigenetics and vascular diseases. J Mol Cell Cardiol 133: 148–163 [DOI] [PMC free article] [PubMed] [Google Scholar]
- Viviani Anselmi C, Briguori C, Roncarati R, Papa L, Visconti G, Focaccio A, De Micco F, Latronico MV, Pagnotta P, Condorelli G (2013) Routine assessment of on‐clopidogrel platelet reactivity and gene polymorphisms in predicting clinical outcome following drug‐eluting stent implantation in patients with stable coronary artery disease. JACC Cardiovasc Interv 6: 1166–1175 [DOI] [PubMed] [Google Scholar]
- Voight BF, Kang HM, Ding J, Palmer CD, Sidore C, Chines PS, Burtt NP, Fuchsberger C, Li Y, Erdmann J et al (2012) The metabochip, a custom genotyping array for genetic studies of metabolic, cardiovascular, and anthropometric traits. PLoS Genet 8: e1002793 [DOI] [PMC free article] [PubMed] [Google Scholar]
- Wang GK, Zhu JQ, Zhang JT, Li Q, Li Y, He J, Qin YW, Jing Q (2010) Circulating microRNA: a novel potential biomarker for early diagnosis of acute myocardial infarction in humans. Eur Heart J 31: 659–666 [DOI] [PubMed] [Google Scholar]
- Weber C, Noels H (2011) Atherosclerosis: current pathogenesis and therapeutic options. Nat Med 17: 1410–1422 [DOI] [PubMed] [Google Scholar]
- Winkelmann BR, März W, Boehm BO, Zotz R, Hager J, Hellstern P, Senges J (2001) Rationale and design of the LURIC study–a resource for functional genomics, pharmacogenomics and long‐term prognosis of cardiovascular disease. Pharmacogenomics 2: S1–S73 [DOI] [PubMed] [Google Scholar]
- Wu J, Huang Q, Meng D, Huang M, Li C, Qin T (2016) A functional rs353293 polymorphism in the promoter of miR‐143/145 is associated with a reduced risk of bladder cancer. PLoS One 11: e0159115 [DOI] [PMC free article] [PubMed] [Google Scholar]
- Xin M, Small EM, Sutherland LB, Qi X, McAnally J, Plato CF, Richardson JA, Bassel‐Duby R, Olson EN (2009) MicroRNAs miR‐143 and miR‐145 modulate cytoskeletal dynamics and responsiveness of smooth muscle cells to injury. Genes Dev 23: 2166–2178 [DOI] [PMC free article] [PubMed] [Google Scholar]
- Yang L, Gao X, Luo H, Huang Q, Wei Y, Zhang G, Huang G, Su D, Chen L, Lu C et al (2014) No association of pri‐miR‐143 rs41291957 polymorphism with the risk of congenital heart disease in a Chinese population. Pediatr Cardiol 35: 1057–1061 [DOI] [PubMed] [Google Scholar]
- Zewinger S, Kleber ME, Tragante V, McCubrey RO, Schmidt AF, Direk K, Laufs U, Werner C, Koenig W, Rothenbacher D et al (2017) Relations between lipoprotein(a) concentrations, LPA genetic variants, and the risk of mortality in patients with established coronary heart disease: a molecular and genetic association study. Lancet Diabetes Endocrinol 5: 534–543 [DOI] [PMC free article] [PubMed] [Google Scholar]


