

Abstract
This study examines COVID-19 cases and deaths among US federal and state prisoners from April 5, 2020, to April 3, 2021, compared with cases and deaths in the overall US population.
Early in the COVID-19 pandemic, case and death rates in US prisons substantially exceeded national rates.1 Prison systems subsequently reported adopting several policies to contain COVID-19 spread, including limiting social interactions, distributing personal protective equipment, and expediting prisoner releases,2,3 although failures of infection prevention and control have been documented.2,4 We examined COVID-19 cases and deaths among US federal and state prisoners during the first 52 weeks of the pandemic and compared these rates with the overall US population, updating a previously published report analyzing COVID-19 incidence and mortality in prisons through June 6, 2020.1
Methods
Counts of COVID-19 cases and deaths among prisoners in all 50 state prison systems and the Federal Bureau of Prisons were collected by the UCLA Law COVID Behind Bars Data Project for 52 weeks from April 5, 2020, to April 3, 2021. Counts were extracted from departments of corrections websites and, as needed, supplemented with data collected by the Marshall Project and the Associated Press.5 To calculate rates of COVID-19 in prisons, we used total jurisdictional prison population data reported by the Vera Institute3 for January 1, 2020, July 1, 2020, December 30, 2020, and March 31, 2021. We estimated weekly prison populations by linearly interpolating between the observed dates. For comparison, we also calculated US population COVID-19 rates using cases and deaths reported by the Centers for Disease Control and Prevention,6 allowing for a 2-month reporting delay. US population data were taken from the US Census Bureau’s American Community Survey 2019.
We calculated both weekly and cumulative rates of incidence and standardized mortality for the prison population and US population. Weekly prison rates were calculated using the jurisdictional incarcerated population for the corresponding week, while cumulative rates were calculated using the 52-week mean population size. Standardized mortality rates were calculated, adjusting for age and sex with indirect standardization, as described in a previous report.1 All analysis was performed using R version 4.1.0. The UCLA institutional review board deemed this study to be exempt.
Results
By April 3, 2021, 394 066 COVID-19 cases and 2555 deaths due to COVID-19 had been reported among the US prison population (Table). The cumulative incidence rate per 100 000 persons was 30 780 cases for the prison population and 9350 cases for the US population, with a prison-to-US cumulative incidence ratio of 3.3 (95% CI, 3.3-3.3). The standardized mortality rate per 100 000 persons was 199.6 deaths for the prison population and 80.9 deaths for the US population (Table), with a prison-to-US standardized cumulative mortality rate ratio of 2.5 (95% CI, 2.3-2.7).
Table. Demographic Characteristics and COVID-19 Statistics for the Overall US Population and Prison Population.
| Characteristics | US population | Prison population |
|---|---|---|
| Population, No. | 328 200 000a | 1 280 263b |
| Aged ≥65 y, % | 16a | 3c |
| Male sex, % | 49a | 93c |
| COVID-19 incidence | ||
| Cases, No.d | 30 688 676e | 394 066f |
| Incidence rate per 100 000 | 9350.6 | 30 780.1 |
| COVID-19 mortality | ||
| Deaths, No.d | 554 323e | 2555f |
| Crude mortality rate per 100 000 | 168.9 | 199.6g |
| Standardized mortality rate per 100 000 | 80.9 | 199.6g |
Derived from 2019 US Census Bureau data (https://www.census.gov/data/tables/2019/demo/age-and-sex/2019-age-sex-composition.html). The US population includes the prison population.
Estimated from Kang-Brown et al.3
Derived from 2019 published estimates from US Bureau of Justice statistics (https://www.bjs.gov/content/pub/pdf/p19.pdf).
COVID-19 cases and deaths are cumulative counts up to April 3, 2021.
From the Centers for Disease Control and Prevention (https://data.cdc.gov/NCHS/Provisional-COVID-19-Death-Counts-bySex-Age-and-S/9bhg-hcku).
From the UCLA Law COVID Behind Bars Data Project (https://uclacovidbehindbars.org).
Indirect standardization was used; thus, prison population crude and standardized mortality rates are equal.
The prison population weekly incidence rate peaked during the week of December 13, 2020, when there were 2327 new cases per 100 000 persons. The standardized mortality rate peaked during the week of January 3, 2021, with 9.6 new deaths per 100 000 persons (Figure). During these weeks, the prison-to-US incidence rate ratio was 5.0 (95% CI, 5.0-5.1), while the standardized mortality ratio was 2.7 (95% CI, 1.9-3.8).
Figure. Weekly COVID-19 Incidence Rates and Standardized Mortality Rates in US Prisons and in the Overall US Population From April 5, 2020, to April 3, 2021.
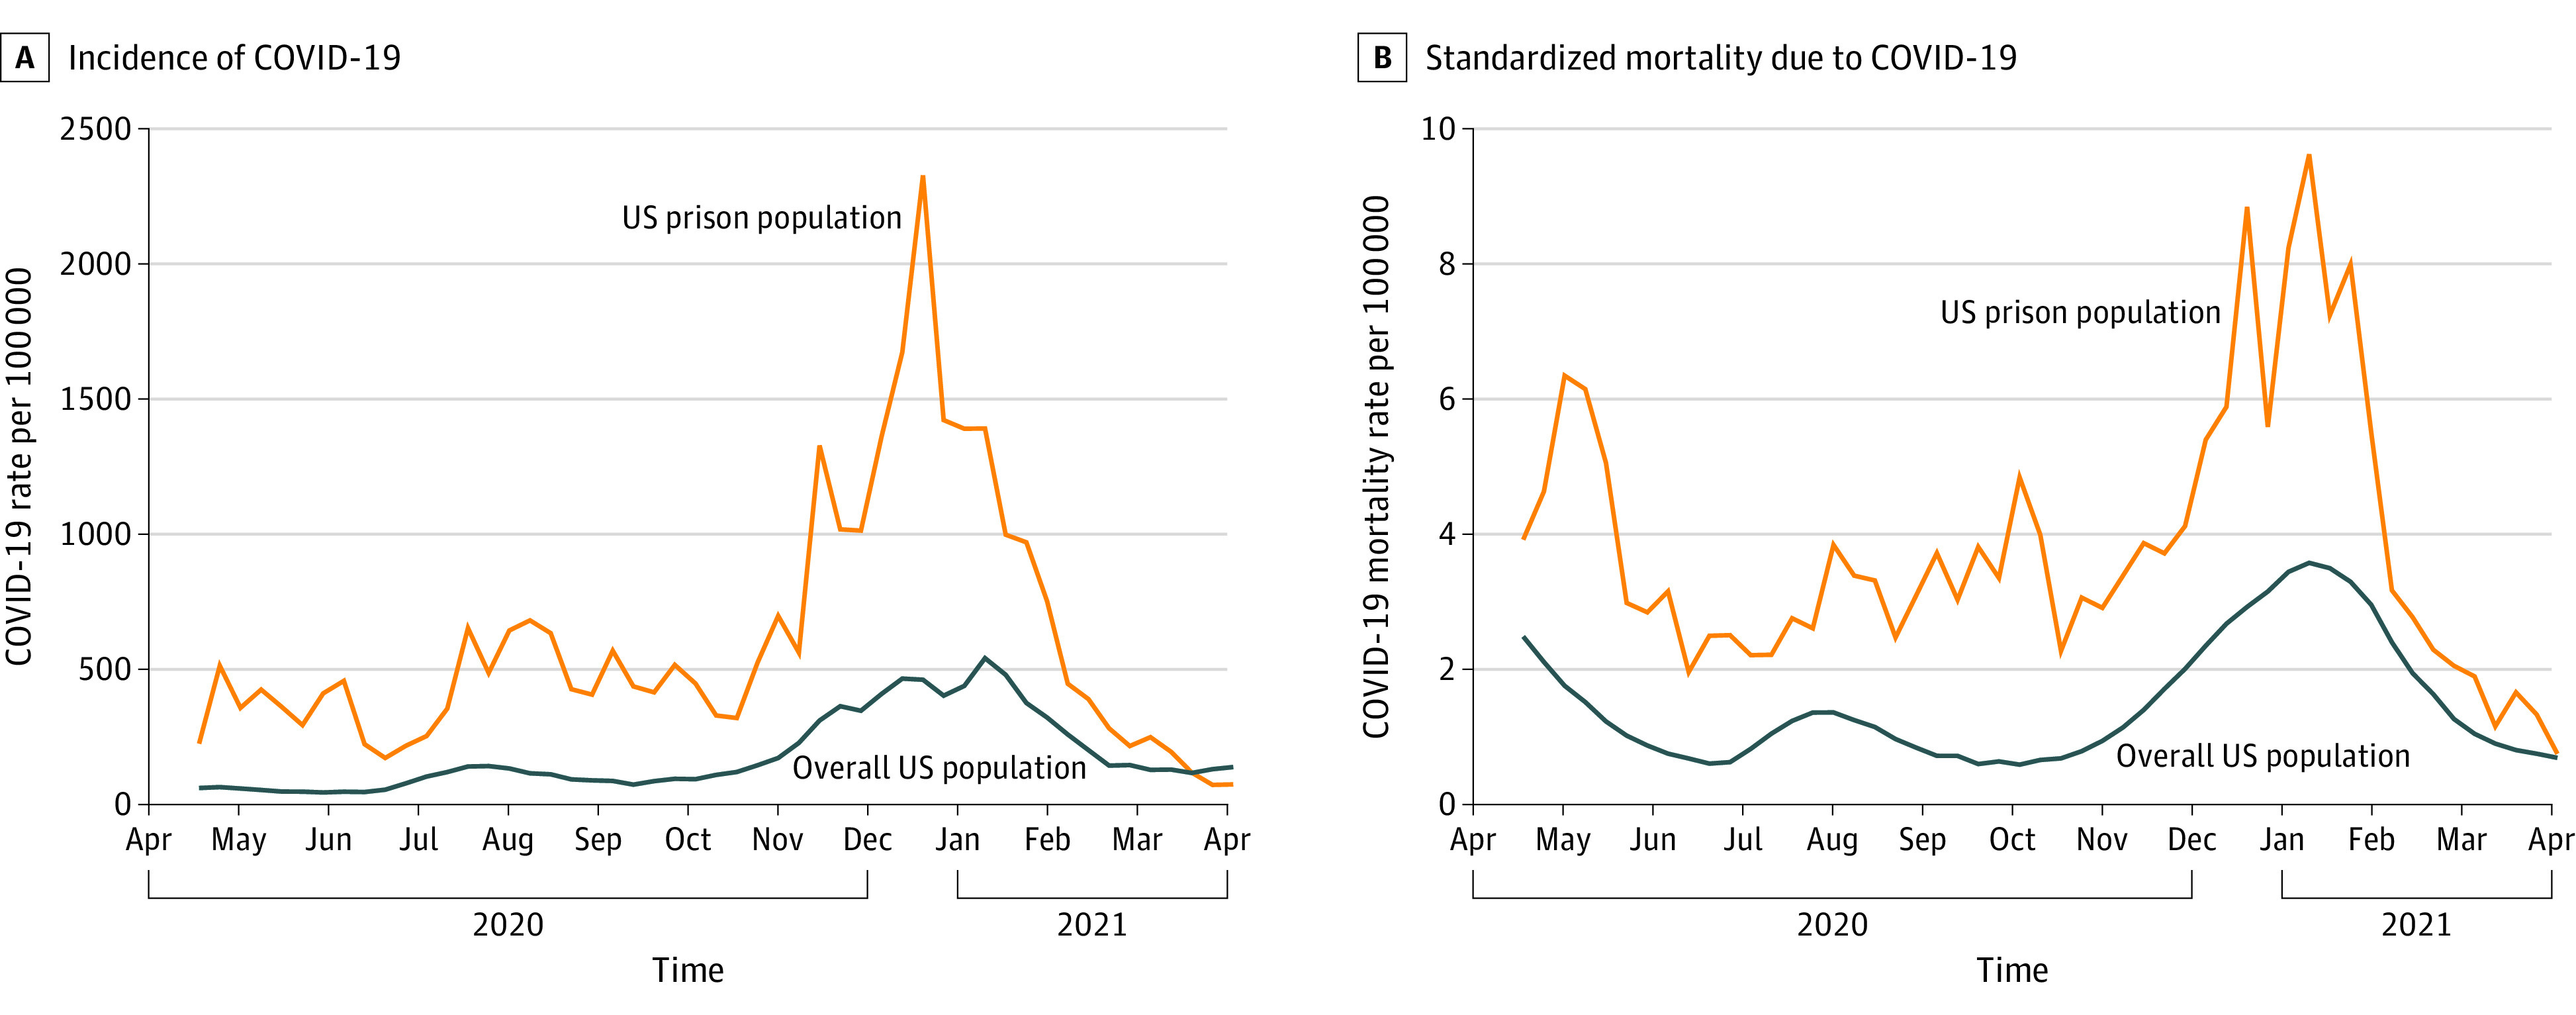
Mortality rates are adjusted for age and sex. The incidence rate peaked for the prison population the week of December 13, 2020, while the mortality rate peaked the week of January 3, 2021, with values of 2327 new cases and 9.6 deaths per 100 000 individuals, respectively.
Discussion
COVID-19 incidence and standardized mortality rates remained consistently higher among the prison population than the overall US population in the first year of the pandemic. While COVID-19 incidence and mortality rates peaked in late 2020 and early 2021 and have since declined, the cumulative toll of COVID-19 has been several times greater among the prison population than the overall US population.
A study limitation is reliance on publicly available data, which are subject to potential misreporting, delays,4 and inconsistencies in population estimates.3 In addition, differences in testing rates between the overall US population and the prison population may have biased incidence ratios. Also, the study period did not capture the more recent outbreak of COVID-19 cases due to the Delta variant. Nevertheless, this study underscores the importance of initiatives such as vaccination, decarceration, and continued disease surveillance in prison settings as long as the pandemic continues.
Section Editors: Jody W. Zylke, MD, Deputy Editor; Kristin Walter, MD, Associate Editor.
References
- 1.Saloner B, Parish K, Ward JA, DiLaura G, Dolovich S. COVID-19 cases and deaths in federal and state prisons. JAMA. 2020;324(6):602-603. doi: 10.1001/jama.2020.12528 [DOI] [PMC free article] [PubMed] [Google Scholar]
- 2.Dolovich S. Mass incarceration, meet COVID-19. University of Chicago Law Review Online. Published November 16, 2020. Accessed April 10, 2021. https://ssrn.com/abstract=3766415
- 3.Kang-Brown J, Montagnet C, Heiss J. People in Jail and Prison in Spring 2021. Vera Institute of Justice. Published June 2021. Accessed June 15, 2021. https://www.vera.org/publications/people-in-jail-and-prison-in-2020
- 4.National Academies of Sciences, Engineering, and Medicine . Decarcerating Correctional Facilities During COVID-19: Advancing Health, Equity, and Safety. National Academies Press; 2020. doi: 10.17226/25945 [DOI] [PubMed] [Google Scholar]
- 5.Marshall Project . A state-by-state look at coronavirus in prisons. Accessed April 10, 2021. https://www.themarshallproject.org/2020/05/01/a-state-by-state-look-at-coronavirus-in-prisons
- 6.Centers for Disease Control and Prevention . Coronavirus disease 2019 (COVID-19): cases in the US. Accessed June 15, 2021. https://www.cdc.gov/nchs/nvss/vsrr/covid_weekly/index.htm#SexAndAge