

Abstract

Using apricot shell lignin as a raw material, the effects of torrefaction temperatures (160, 200, 240, and 280 °C) on the properties of torrefied products were studied, and the catalytic pyrolysis experiments of the torrefied lignin under the HZSM-5 catalyst were carried out. The results showed that the oxygen content in lignin was greatly reduced and the higher heating values (HHV) gradually increased, the absorption peak of oxygen-containing functional groups gradually became weaker, and the content of the β-O-4 bond gradually decreased. At 280 °C, the C/O ratio reaches the maximum value of 2.17, and the calorific value increases to 24.22 MJ/kg. The removed oxygen element is converted into oxygen-containing components in the gas (mainly CO2 and H2O) and liquid products (mainly guaiacol phenol). After catalytic pyrolysis of torrefied lignin, it was found that with the increase of torrefaction temperature, the relative content of aromatics increased first and then decreased slightly; the aromatics reached the maximum value of 60.63% at 240 °C; acids decreased significantly; ketones, aldehydes, and furans changed little; and torrefaction played a positive role in the conversion of lignin to aromatics.
1. Introduction
Lignin is one of the three major components of biomass. It is the only renewable resource that can provide aromatic polymers in nature. Lignin is a polymer formed by randomly connecting three phenylpropane units (guaiacol, eugenol, and p-hydroxybenzyl) through C–O–C ether bonds (β-O-4, α-O-4, and γ-O-4) and C–C bonds (5-5, β-1, and β-5).1,2 Because of the characteristics of the phenylpropane unit, it is considered as a potential raw material to replace fossil resources for the preparation of petroleum-based fuels and high-value aromatic chemicals. However, it is also very difficult to improve and depolymerize lignin with a complex structure.3 Therefore, the conversion of lignin into aromatic high-quality chemicals and biomass fuels has become one of the research hotspots.
Lignin catalytic fast pyrolysis can combine biomass fast pyrolysis with on-line catalytic reforming to obtain high-quality bio-oil or chemicals. Problems such as an excessively high initial oxygen content of lignin raw materials, a low yield of target products, and easy coke deposition and deactivation of catalysts still restrict the development of this technology for a long time. Among them, the selection and reuse of a catalyst is an important factor affecting the conversion of aromatics by lignin. Many studies have shown that due to the unique pore structure and acidic characteristics of HZSM-5 molecular sieves, good catalytic deoxygenation and aromatization effects can be realized in the process of lignin catalytic cracking, which significantly improves the yield of aromatic hydrocarbons in the product.4,5 Li et al. used the HZSM-5 catalyst for rapid pyrolysis of lignin and found that the amount of oxygen-containing derivatives of lignin was significantly reduced by 4.5 times and the content of aromatic substances was increased by more than 5 times.6 Gayubo et al. conducted catalytic pyrolysis tests on aldehydes, ketones, alcohols, acids, and other substances in the pyrolysis liquid products and found that under suitable reaction conditions, these substances can be converted into aromatic hydrocarbons under the action of the HZSM-5 catalyst.7 However, in the process of catalytic rapid pyrolysis, the deactivation of the catalyst is caused by the generation of carbon deposits, which hinders the development of this technology.8 Some scholars pointed out that the catalyst deactivation is directly related to the excessive oxygen content in the pyrolysis volatiles caused by the high oxygen content of the biomass.9 Therefore, deoxygenation is an effective way to solve the deactivation of the catalyst.
The conversion of lignin into chemicals is actually the process of deoxidation and depolymerization of the lignin structure. Deoxidation methods include pretreatment, dehydroxylation, decarbonylation, and hydrodeoxygenation,10 among which pretreatment and decarbonylation are the most economical and efficient deoxidation methods. Torrefaction is the simplest and most direct way to deoxidize lignin pretreatment (dehydration and deacidification). A reasonable torrefaction temperature is directly related to the deoxidation effect of pretreatment and the yield of aromatic compounds. In recent years, the deoxidation effect of torrefaction at 200–300 °C has been verified by many scholars.11 Chen et al. investigated the evolution of biomass pyrolysis products after torrefied deoxidation.12 After treatment, the oxygen content of straw decreased by 55%, the pyrolysis solid products increased by 20%, and the pyrolysis liquid products decreased by 21%. Wang et al.13 studied the characteristics and pyrolysis behavior of torrefied hemicellulose. After torrefaction, the activation energy of degradation reaction was increased; the activation energy of condensation reaction was decreased; and the yields of acids, furan, alicyclic ketones, and other pyrolysis products were reduced. However, there are few research studies on the deoxidization of lignin. Mahadevan et al. found that after pyrolysis of torrefied lignin, oxygen-containing compounds such as phenols, acids, and aldehydes in liquid products decreased sharply, and aromatic hydrocarbons increased significantly.14−16 The results showed that with the increase of torrefaction temperature, the content of acetic acid, furan, and other oxygen compounds in the pyrolysis oil decreased, and the calorific value increased, which effectively reduced the oxygen content of the pyrolysis oil, thus improving the quality of bio-oil. Torrefied pretreatment is an effective method to deoxidize and improve the quality of lignin.
The synergistic effect of torrefaction pretreatment and catalytic pyrolysis can effectively improve the composition and distribution of lignin pyrolysis oil products. At present, there are few studies on the catalytic pyrolysis of baked lignin to aromatics. In this study, the deoxidation characteristics of apricot shell lignin at different temperatures (160, 200, 240, and 280 °C) were analyzed to reveal the deoxidation mechanism in the process of lignin torrefaction. On this basis, using a fast pyrolysis apparatus, the HZSM-5 molecular sieve-catalyzed torrefied lignin to produce aromatics was studied, and its influence on the pyrolysis products, especially the conversion of aromatics, was explored, providing a basis for the efficient utilization of apricot shell lignin.
2. Materials and Methods
2.1. Materials
Lignin (XKL) was obtained from apricot shells (Chengde Huajing Activated Carbon Co., Ltd.) by alkali treatment and extraction. Grinding was performed to 40–60 mesh powder with a grinder, followed by drying (drying at 100 °C for 24 h). HZSM-5 was selected as an apricot shell lignin catalytic pyrolysis catalyst with a silicon aluminum ratio of 25, a specific surface area of 325 m2/g, and a particle size of 0.6 nm. It was purchased from Nankai University catalyst Co., Ltd. (Tianjin, China).
2.2. Torrefaction Pretreatment of Lignin
The torrefaction pretreatment experiment of lignin was carried out in a tube furnace with high-purity N2 (99.999%) as the carrier gas, and the flow rate was 100 mL/min. The torrefaction temperature was set to 160, 200, 240, and 280 °C. The fixed heating rate is 10 °C/min, kept for 30 min. After the experiment, the electric furnace was turned off and the products were cooled to room temperature and labeled as XKL-160, XKL-200, XKL-240, and XKL-280.
2.3. Chemical Properties of Lignin
The ultimate composition (C, H, N, and S) of lignin was analyzed with a Vario EL III element analyzer from Elementary, Germany, and the O element was calculated by subtraction. The calorific value of lignin was tested with a ZDHW-300A oxygen bomb calorimeter of Hebi Keda Company, Henan, China. The attenuated total reflection infrared spectrum of lignin was analyzed using a Frontier infrared spectrum analyzer of American PE Company.
According to the research of MA et al., lignin can be used to characterize coupling bonds (such as β–β, β-O-4, and β-5) and S\G\H units by 2D-HSQC-NMR analysis.17 In this paper, a German Bruker AVIII 400 spectrometer is used to dissolve the purified lignin (70 mg) in DMSO-d6 (0.5 mL), configure the sample solution, and perform the nuclear magnetic test.
2.4. Analysis of Lignin-Torrefied Gaseous Products from Thermogravimetric Analysis–Fourier Transform Infrared Spectroscopy
A thermogravimetry (TG) (TGA 8000) system and an infrared meter (Frontier) of PE Company (USA) are used in combination to analyze the volatile components and weight loss characteristics of lignin. The TG system and the infrared meter are connected together by a 285 °C transmission line. The thermogravimetric heating rate is 10 °C/min, N2 (99.999%) is used as the carrier gas, and the temperature is increased to the final temperature (160, 200, 240, and 280 °C) for 30 min. The resolution of the infrared instrument is 4 cm–1, and the wave number of the spectrum is 450–4000 cm–1.
2.5. Analysis of Lignin-Torrefied Liquid Products from PY-Gas Chromatography/Mass Spectrometry
The on-line determination of organic matter produced by lignin constant-temperature pyrolysis was carried out with fast pyrolysis gas chromatography (GC)/mass spectrometry (MS). The fast pyrolysis instrument was CDS5200 from CDS, and the GCMS instrument was Clarus SQ 8 from PE. Lignin was put into the quartz boat of the pyrolysis apparatus, and the temperature was increased to the target temperatures of 160, 200, 240, and 280 °C using a fixed heating rate of 10 °C/ms and a residence time of 20 s. The temperature of the pyrolysis gas transmission pipeline is 300 °C. The GC system was first heated to 40 °C for 3 min and then heated to 290 °C at 10 °C/min and held for 3 min. The pyrolytic organics were analyzed by the NIST library and the related literature.
2.6. Catalytic Pyrolysis Experiment
In the experiment of catalytic pyrolysis of lignin, CDS5200 (CDS, USA) was directly connected with the GC system and MS system (Clarus SQ 8, PerkinElmer, USA).
In the experiment, 0.6 mg of lignin powder was placed in a quartz tube, the initial pyrolysis temperature was 50 °C, the final pyrolysis temperature was set at 600 °C, the heating rate was 10,000 K/s, and the final pyrolysis temperature was maintained for 15 s. In the experiment of adding the catalyst, the catalyst was divided into two equal parts and placed on both ends of lignin. First, the GC furnace was heated to 40 °C for 3 min, and then, the temperature was increased to 290 °C (10 °C/min) for 3 min. Finally, the organic components were identified according to the NIST library and the literature. Previous studies showed that HZSM-5 was the most ideal catalyst, the Si/Al ratio was 25:1, the catalyst/lignin ratio was 5:1, and the pyrolysis temperature was 600 °C.18−20 In this study, the catalysts, Si/Al, and catalyst/lignin were derived from previous studies, and the effect of torrefaction on the catalytic conversion of lignin to aromatics was explored.
3. Results and Discussion
3.1. Effect of Torrefaction Temperature on the Ultimate Analysis, HHV, and Mass Yield of Lignin
The effects of torrefaction temperature on the ultimate analysis, the higher heating values (HHV), and mass yields of lignin are shown in Table 1. As the torrefaction temperature increases from 160 to 280 °C, the carbon element in lignin increases from 53.14 to 64.16%, the oxygen element decreases from 40.52 to 29.4%, and the mass yield decreases from 97.01 to 62.80%. Finally, the O/C ratio of lignin decreases from 0.76 to 0.46, and HHV increases from 18.25 to 24.22 MJ/kg. The main reason is that the oxygen element is removed in the form of H2O and organic matter during torrefaction. Torrefaction pretreatment is a very effective deoxidation method.
Table 1. Effect of Torrefaction Temperature on the Ultimate Analysis, HHV, and Mass Yields of Lignin.
| sample | C | H | O | N | S | HHV (MJ/kg) | mass yield (%) | O/C (%) |
|---|---|---|---|---|---|---|---|---|
| XKL-100 | 53.14 | 5.58 | 40.52 | 0.05 | 0.72 | 18.25 | 100.00 | 0.76 |
| XKL-160 | 53.65 | 6.06 | 39.91 | 0.02 | 0.36 | 18.32 | 97.01 | 0.74 |
| XKL-200 | 54.21 | 599 | 39.54 | 0.02 | 0.25 | 19.54 | 94.90 | 0.73 |
| XKL-240 | 57.79 | 5.82 | 36.15 | 0.02 | 0.23 | 21.20 | 82.74 | 0.63 |
| XKL-280 | 64.16 | 5.82 | 29.40 | 0.02 | 0.59 | 24.22 | 62.80 | 0.46 |
3.2. Effect of Torrefaction Temperature on the Characteristics of Solid, Liquid, and Gaseous Products
3.2.1. Characteristics of Torrefied Lignin
Figure 1 shows the Fourier transform infrared (FTIR) analysis of lignin at different torrefaction temperatures. Liu et al. concluded that there are about eight characteristic absorption bands in the infrared spectrum of lignin.21 The oxygen-containing functional group located at 3400 cm–1 is the −OH stretching vibration, mainly derived from H2O, the oxygen-containing functional group located at 1370 cm–1 is the C–O stretching vibration, mainly derived from the aromatic nucleus −OH, and the C–O stretching vibration of the oxygen-containing functional group located at 1270 cm–1 is mainly derived from the C–O in the aromatic nucleus and −OCH3 in the guaiacyl nucleus. It can be seen from Figure 1 that with the increase of the torrefaction temperature, the absorbance of these oxygen-containing functional groups has decreased to a certain extent, indicating that the oxygen-containing functional groups decreased, and torrefaction promoted the dehydration, demethoxy, and decarboxylation reactions and reduced the content of oxygen in lignin.14
Figure 1.

FTIR analysis of lignin-torrefied solid products at different temperatures (100, 160, 200, 240, and 280 °C).
2D-HSQC-NMR can analyze the basic structural units of lignin and the linkages between the structural units in detail. Table 2 summarizes the effects of torrefaction temperature on the content of lignin linkages and phenylpropane structural units. With the increase of torrefaction temperature, the content of β-O-4 bonds decreases from 25.32/100 Ar to 5.15/100 Ar, which is a reduction of 80%, because its dissociation energy is relatively low and it is easy to break at low temperature.22 However, the content of β-5 bonds and β–β bonds increased at 200–240 °C. Wen et al. found that some condensation reactions occurred at this torrefaction temperature, resulting in an increase in their content.23 As the torrefaction temperature continues to increase, the content of β-5 bonds and β–β bonds decreases sharply, β-5 bonds are reduced by 67%, and β–β bonds are reduced by 59%. This is due to the higher torrefaction temperature that promotes the connection and breaking of the bond. It can be seen from Table 2 that in the aromatic zone, the content of guaiacyl (G) in apricot shell lignin reaches 99%, and there is 1% p-hydroxyphenyl (H) without syringyl (S); therefore, the lignin structure of apricot shells is mainly composed of guaiacyl (G)-based units. With the increase of torrefaction temperature, the content of p-hydroxyphenylpropane (H) in lignin increased from 1 to 2%. The main reason is that high temperature promotes the demethoxy reaction of guaiacyl (G), resulting in more p-hydroxyphenylpropane (H).16
Table 2. 2D-HSQC-NMR Analysis.
| sample | S/G/H (%) | β-O-4 (100 Ar) | β–β (100 Ar) | β-5 (100 Ar) |
|---|---|---|---|---|
| XKL-100 | 0/100/0 | 25.32 | 0.89 | 5.07 |
| XKL-160 | 0/99/1 | 20.31 | 0.92 | 5.14 |
| XKL-200 | 0/99/1 | 7.25 | 0.87 | 5.28 |
| XKL-240 | 0/99/1 | 6.32 | 0.95 | 5.62 |
| XKL-280 | 0/98/2 | 5.15 | 0.32 | 2.35 |
3.2.2. Characteristics of Liquid Products
According to the different sources of pyrolysis products and their chemical categories, the products detected by GC/MS of roasted pyrolysis lignin are divided into seven categories, namely, the guaiacol (G) type, the phenol (P) type, the catechol (C) type, acids, furans, ketones, and alcohols. The guaiacol (G) type is characterized by a methoxy group and a hydroxyl group directly connected to the benzene ring, the phenol (P) type is characterized by a hydroxyl group directly connected to the benzene ring, and the catechol (C) type is characterized by two hydroxyl groups directly connected to the benzene ring. Figure 2 shows the evolution of the relative content of the main liquid products during the torrefaction process.
Figure 2.
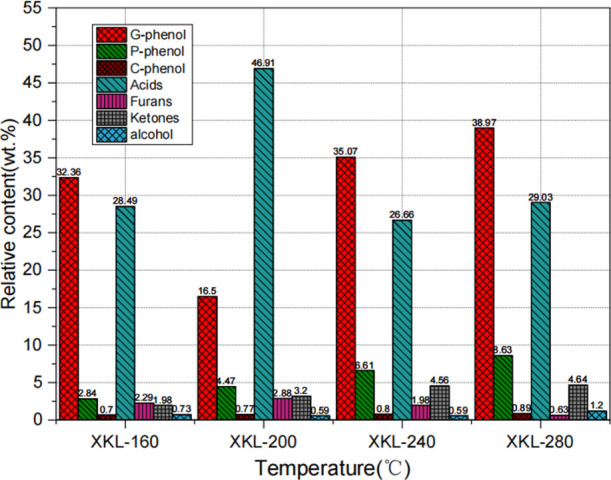
Effect of torrefaction temperature on the relative contents of torrefied liquid components.
G-type phenol occupies the main position torrefied liquid products. As the torrefaction temperature increased from 160 to 280 °C, the relative content of G-type phenol decreased at 200 °C. However, it increased significantly from 35.07 to 38.97% at 240 and 280 °C. This is because a large amount of acids is produced at 200 °C, and the growth rate of G-type phenols is slower than that of acids. The formation of G-type phenol is mainly due to the cleavage of the β-O-4 bond between the phenylpropyl units and the hydrogenation reaction of the phenoxy group to form a phenolic hydroxyl group.24
As the torrefaction temperature increased, the content of P-phenol increased from 2.84 to 8.63%. This is due to a series of cracking reactions of G-type phenol. First, the methoxy group on the G-type phenol falls off, and then, the methyl radical (CH3•) formed by the off-reaction is further decomposed into hydrogen (H•) radicals and methylene (CH2). Finally, hydrogen (H•) free radicals obtain P-type phenol through addition reaction.25,26 The higher the torrefaction temperature, the easier it is for the methoxy group on the benzene ring to fall off, causing the P-type phenol to gradually rise.
The content of furans is relatively low. With the increase of temperature, the content decreases from 2.29 to 0.63%. Many scholars found that the existence of furans may be due to the reaction between carbohydrates and lignin.24 At 200 °C, the relative content of acids reaches a maximum of 46.91%. As the temperature increases, the relative content of ketones increases from 1.98 to 4.64%. The content of alcohols is very small and changes little.
3.2.3. Compositions of Gaseous Products
Figure 3 shows the evolution of the evolved gas composition at different torrefied temperatures (160, 200, 240, and 280 °C). In Figure 3a,b, it can be clearly seen that the gas product is only H2O precipitated, which is consistent with the TG curve and derivative thermogravimetry (DTG) curve in Figure 1 before. The first weight loss peak is the free water part of the apricot shell lignin. In Figure 3c, we clearly found that with the increase of the torrefied temperature, the output of CO2 increased significantly, and some other gases were also found. Figure 3d shows that the torrefied temperature reached 280 °C, and other gaseous organic products were seen to increase greatly.
Figure 3.

Pyrolysis 3D-FTIR analysis of solid products at different torrefaction temperatures of lignin: (a) temperature 160 °C, (b) temperature 200 °C, (c) temperature 240 °C, and (d) temperature 280 °C.
Figure 4 shows the evolution of gas components (H2O, CO2, CO, and CH4) during the torrefaction process. According to the previous literature, the infrared characteristic absorption peaks corresponding to H2O, CH4, CO2, and CO are 3650, 2920, 2357, and 2079 cm–1, respectively.18,26,27 On the whole, the content of CO2 is the highest among the four gas components, and the absorbance at the highest peak is 0.16, followed by H2O, CH4, and CO. CO2 may come from the demethoxylation of guaiacyl units in lignin and the decarbonylation of lignin side chain ends.24
Figure 4.

Evolution of evolved gas components during the lignin torrefaction process: (a) CO2 at 2360 cm–1, (b) H2O at 3650 cm–1, (c) CO at 2079 cm–1, and (d) CH4 at 2920 cm–1.
Figure 4a shows that the amount of CO2 released continues to increase with the increase of torrefaction temperature, indicating that a higher temperature promotes the decarbonylation and demethoxy reaction.
Figure 4b shows that the release of H2O involves two stages. The first stage is that the free water in lignin evaporates in the temperature range of 0–130 °C; it is mainly the removal of free water, and the DTG curve also shows a small weight loss peak, which is mainly physical deoxidation at this stage. The second stage is from 130 °C to each target torrefied temperature (160, 200, 240, and 280 °C), mainly due to the dehydrogenation reaction at the functional group −OH attached to the lignin side chain.18
Figure 4c shows that there is almost no release of CO before 240 °C and a large increase at 280 °C. There are three main ways for the formation of CO. First, the β-O-4 ether bond is broken to form oxygen radicals, and then, the oxygen radicals replace the hydrogen atoms in methyl alkyne (−CH) to form CO. According to the 2D-HSQC analysis, the content of β-O-4 ether bonds dropped sharply, which was confirmed. Another approach is similar to that when G-type phenol is converted to P-type phenol through demethoxylation to generate CO2. The third way is the decarbonylation of the Cγ position of the conifer aldehyde side chain.
Figure 4d shows that there is almost no release of CH4 before 240 °C, and it is greatly increased at 280 °C. There are two main ways to generate CH4. The first way is the demethoxy reaction of the guaiacol-type structural unit, and the other way is the demethylation reaction on the side chain of lignin.27,28 The dissociation energy of the demethoxy reaction is much smaller than that of the demethylation reaction, which makes the demethoxy reaction more likely to occur. However, the higher torrefaction temperature promotes the demethylation reaction, which greatly increases CH4.26
3.3. Pyrolysis of Torrefied Lignin
3.3.1. TG Analysis of Torrefied Lignin
Figure 5 shows TG and DTG curves of the lignin torrefied process. It can be seen from the TG curve that as the final temperature increased from 160 to 280 °C, the quality of lignin decreased from 97.10 to 62.80%, indicating that a higher heating temperature intensified the pyrolysis deoxidation reaction. From the DTG curve, two weight loss peaks can be clearly observed, indicating that the pyrolysis process of lignin includes two stages: dehydration stage (35–130 °C) and rapid weight loss stage (130–160, 200, 240, and 280 °C). The first stage is the stage dominated by physical deaeration, and the maximum weight loss rate is 0.28%/°C. The second stage is mainly chemical deoxidation. With the increase of calcination temperature, the second peak weight loss rate gradually increases from 0.11 to 5.25%/°C, indicating that the pyrolysis reaction is enhanced at a higher temperature.
Figure 5.

TG and DTG curves of lignin torrefaction at different temperatures.
3.3.2. Catalytic Pyrolysis of Torrefied Lignin by PY-GC/MS
Figure 6 shows the distribution of liquid products of lignin catalytic pyrolysis under different torrefied pretreatments. The components can be roughly divided into the following categories: phenols, aromatic hydrocarbons, ketones, aldehydes, furans, and acids. It can be seen from the figure that as the torrefied temperature increases, the relative content of phenols has a trend of first increasing and then slightly decreasing, from 16.11 to 21.12% and then to 20.08%. The production of phenols is mainly caused by the rupture of the ether bond and the demethoxylation reaction of lignin, which changes its structure.29 Lignin mainly undergoes dehydration and deoxidation during the torrefied pretreatment at 160 and 200 °C. Phenols show an increasing trend, while at torrefied temperatures of 240 and 280 °C, the combined effect of removing part of the volatiles and catalytic pyrolysis during the torrefied process makes the catalytic pyrolysis phenols not greatly increased or even reduced. With the increase of torrefied temperature, the relative content of aromatics has increased greatly (from 24.57% of raw materials to 60.63% of torrefied materials at 240 °C), but lignin at 280 °C has decreased (down to 52.12%). The deoxidation effect of lignin directly affects the yield of aromatics.30 Torrefaction greatly improves the C/O ratio of lignin and further enhances the ability of lignin to catalyze the deoxidation of bio-oil to form aromatics. However, when the torrefied temperature reaches 280 °C, the content of aromatics decreases, which may be due to the increasing degree of cross-linking and carbonization of lignin when there is torrefaction at a higher temperature; thus, the content of aromatic compounds is reduced.
Figure 6.

Pyrolysis product distribution of PY-GC/MS of lignin under different torrefaction temperatures.
The content of aldehydes and ketones is very low. Lu et al.9 pointed out that the carbonyl removal of aldehydes and ketones generally follows the following mechanism: first, small molecular hydrocarbons and unsaturated olefins are generated through decarbonylation reaction and dehydration reaction, and then, aromatic hydrocarbons are generated through oligomerization reaction, aromatization reaction, and polymerization reaction.31 It may be that HZSM-5 has high acid strength and many acidic sites, which can complete the reactions of cracking, deoxidation, decarboxylation, and decarbonylation of oxygen-containing compounds; then, oligomerization occurs through the mechanism of positive carbon ions, and finally, aromatic compounds are generated through aromatization, isomerization, and other reactions.
With the increase of torrefied temperature, the acid content decreased significantly. Acetic acid is the main product of acids. Acidity enhances the corrosiveness of bio-oil, which is detrimental to its application, so reducing acid content may have potential benefits for bio-oil storage and refineries. The relative content of furans is relatively low. With a small decrease in temperature, furan products are generally considered to be products formed by dehydration reaction of cellulose or the semi-fiber monomer. The conversion of lignin to furans is relatively low, and cracking reaction occurs under torrefaction and catalysis, resulting in a small decrease in content.
4. Conclusions
This paper studied the effects of different torrefaction temperatures on the torrefied products of apricot shell lignin and the catalytic conversion of aromatic hydrocarbons. The results showed that as the torrefaction temperature increased, the oxygen content in lignin greatly reduced, the oxygen element decreased from 40.52 to 29.4%, and the absorption peak of oxygen-containing functional groups gradually weakened. At 280 °C, C/O reaches a maximum of 2.17, HHV increases gradually, from 18.25 to 24.22 MJ/kg, the removed oxygen element is transferred to gas products (mainly CO2, H2O, and CO) and liquid products (mainly G-type phenol), and the deoxidation effect is significant. After its catalytic pyrolysis, it was found that with the increase of torrefaction temperature, the relative content of aromatics first increased and then decreased slightly. At 240 °C, the content of aromatics reaches the maximum value of 60.63%; acids are significantly reduced; and ketones, aldehydes, and furans change little, and torrefaction has a positive effect on the conversion of lignin to aromatics.
Acknowledgments
The authors acknowledge the National Natural Science Foundation of China (51776100) and the national promotion project (20201333136).
The authors declare no competing financial interest.
References
- Zong E.; Huang G.; Liu X.; Lei W.; Jiang S.; Ma Z.; Wang J.; Song P. A lignin-based nano-adsorbent for superfast and highly selective removal of phosphate. J. Mater. Chem. A 2018, 6, 9971–9983. 10.1039/c8ta01449c. [DOI] [Google Scholar]
- Chen D.; Gao A.; Cen K.; Zhang J.; Cao X.; Ma Z. Investigation of biomass torrefaction based on three major components: Hemicellulose, cellulose, and lignin. Energy Convers. Manage. 2018, 169, 228–237. 10.1016/j.enconman.2018.05.063. [DOI] [Google Scholar]
- Zhang M.; Resende F. L. P.; Moutsoglou A.; Raynie D. E. Pyrolysis of lignin extracted from prairie cordgrass, aspen, and Kraft lignin by Py-GC/MS and TGA/FTIR. J. Anal. Appl. Pyrolysis 2012, 98, 65–71. 10.1016/j.jaap.2012.05.009. [DOI] [Google Scholar]
- Adjaye J. D.; Bakhshi N. N. Production of hydrocarbons by catalytic upgrading of a fast pyrolysis bio-oil. Part I: Conversion over various catalysts. Fuel Process. Technol. 1995, 45, 161–183. 10.1016/0378-3820(95)00034-5. [DOI] [Google Scholar]
- Idem R. O.; Katikaneni S. P. R.; Bakhshi N. N. Catalytic conversion of canola oil to fuels and chemicals: roles of catalyst acidity, basicity and shape selectivity on product distribution. Fuel Process. Technol. 1997, 51, 101–125. 10.1016/s0378-3820(96)01085-5. [DOI] [Google Scholar]
- Li X.; Su L.; Wang Y.; Yu Y.; Wang C.; Li X.; Wang Z. Catalytic fast pyrolysis of Kraft lignin with HZSM-5 zeolite for producing aromatic hydrocarbons. Front. Environ. Sci. Eng. 2012, 6, 295–303. 10.1007/s11783-012-0410-2. [DOI] [Google Scholar]
- Gayubo A. G.; Aguayo A. T.; Atutxa A.; Aguado R.; Bilbao J. Transformation of oxygenate components of biomass pyrolysis oil on a HZSM-5 zeolite. I. Alcohols and phenols. Ind. Eng. Chem. Res. 2004, 43, 2610–2618. 10.1021/ie030791o. [DOI] [Google Scholar]
- Gayubo A. G.; Aguayo A. T.; Atutxa A.; Prieto R.; Bilbao J. Deactivation of a HZSM-5 zeolite catalyst in the transformation of the aqueous fraction of biomass pyrolysis oil into hydrocarbons. Energy Fuels 2004, 18, 1640–1647. 10.1021/ef040027u. [DOI] [Google Scholar]
- Lu Q.; Zhang Z.-F.; Dong C.-Q.; Zhu X.-F. Catalytic upgrading of biomass fast pyrolysis vapors with nano metal oxides: An analytical Py-GC/MS study. Energies 2010, 3, 1805–1820. 10.3390/en3111805. [DOI] [Google Scholar]
- Parsell T. H.; Owen B. C.; Klein I.; Jarrell T. M.; Marcum C. L.; Haupert L. J.; Amundson L. M.; Kenttämaa H. I.; Ribeiro F.; Miller J. T.; Abu-Omar M. M. Cleavage and hydrodeoxygenation (HDO) of C–O bonds relevant to lignin conversion using Pd/Zn synergistic catalysis. Chem. Sci. 2013, 4, 806–813. 10.1039/c2sc21657d. [DOI] [Google Scholar]
- Zheng A.; Zhao Z.; Huang Z.; Zhao K.; Wei G.; Wang X.; He F.; Li H. Catalytic Fast Pyrolysis of Biomass Pretreated by Torrefaction with Varying Severity. Energy Fuels 2014, 28, 5804–5811. 10.1021/ef500892k. [DOI] [Google Scholar]
- Chen D.; Zheng Z.; Fu K.; Zeng Z.; Wang J.; Lu M. Torrefaction of biomass stalk and its effect on the yield and quality of pyrolysis products. Fuel 2015, 159, 27–32. 10.1016/j.fuel.2015.06.078. [DOI] [Google Scholar]
- Wang S.; Dai G.; Ru B.; Zhao Y.; Wang X.; Zhou J.; Luo Z.; Cen K. Effects of torrefaction on hemicellulose structural characteristics and pyrolysis behaviors. Bioresour. Technol. 2016, 218, 1106–1114. 10.1016/j.biortech.2016.07.075. [DOI] [PubMed] [Google Scholar]
- Dai G.; Zou Q.; Wang S.; Zhao Y.; Zhu L.; Huang Q. Effect of Torrefaction on the Structure and Pyrolysis Behavior of Lignin. Energy Fuels 2018, 32, 4160–4166. 10.1021/acs.energyfuels.7b03038. [DOI] [Google Scholar]
- Zhang S.; Min G. G.; Su Y. H.; Zhu S. G. Thermal decomposition behavior and sulfur release characteristics for torrefied wheat straw during pyrolysis process. Bioresour. Technol. 2021, 333, 125172. 10.1016/j.biortech.2021.125172. [DOI] [PubMed] [Google Scholar]
- Mahadevan R.; Adhikari S.; Shakya R.; Wang K.; Dayton D. C.; Li M.; Pu Y.; Ragauskas A. J. Effect of torrefaction temperature on lignin macromolecule and product distribution from HZSM-5 catalytic pyrolysis. J. Anal. Appl. Pyrolysis 2016, 122, 95–105. 10.1016/j.jaap.2016.10.011. [DOI] [Google Scholar]
- Ma Z.; Wang J.; Yang Y.; Zhang Y.; Zhao C.; Yu Y.; Wang S. Comparison of the thermal degradation behaviors and kinetics of palm oil waste under nitrogen and air atmosphere in TGA-FTIR with a complementary use of model-free and model-fitting approaches. J. Anal. Appl. Pyrol. 2018, 134, 12–24. 10.1016/j.jaap.2018.04.002. [DOI] [Google Scholar]
- Wang S.; Lin H.; Ru B.; Sun W.; Wang Y.; Luo Z. Comparison of the pyrolysis behavior of pyrolytic lignin and milled wood lignin by using TG-FTIR analysis. J. Anal. Appl. Pyrolysis 2014, 108, 78–85. 10.1016/j.jaap.2014.05.014. [DOI] [Google Scholar]
- Ma Z.; Chen D.; Gu J.; Bao B.; Zhang Q. Determination of pyrolysis characteristics and kinetics of palm kernel shell using TGA-FTIR and model-free integral methods. Energy Convers. Manage. 2015, 89, 251–259. 10.1016/j.enconman.2014.09.074. [DOI] [Google Scholar]
- Zhang Y.; Ma H.; Chen D.; Zhou J. Technical and Benefit Evaluation of Fruit-Wood Waste Gasification Heating Coproduction of an Activated Carbon System. ACS Omega 2021, 6, 633–641. 10.1021/acsomega.0c05150. [DOI] [PMC free article] [PubMed] [Google Scholar]
- Liu C.; Wang X.; Lin F.; Zhang H.; Xiao R. Structural elucidation of industrial bioethanol residual lignin from corn stalk: A potential source of vinyl phenolics. Fuel Process. Technol. 2018, 169, 50–57. 10.1016/j.fuproc.2017.09.008. [DOI] [Google Scholar]
- Shen D.; Liu G.; Zhao J.; Xue J.; Guan S.; Xiao R. Thermo-chemical conversion of lignin to aromatic compounds: Effect of lignin source and reaction temperature. J. Anal. Appl. Pyrolysis 2015, 112, 56–65. 10.1016/j.jaap.2015.02.022. [DOI] [Google Scholar]
- Wen J.-L.; Sun S.-L.; Yuan T.-Q.; Xu F.; Sun R.-C. Understanding the chemical and structural transformations of lignin macromolecule during torrefaction. Appl. Energy 2014, 121, 1–9. 10.1016/j.apenergy.2014.02.001. [DOI] [Google Scholar]
- Shen D. K.; Gu S.; Luo K. H.; Wang S. R.; Fang M. X. The pyrolytic degradation of wood-derived lignin from pulping process. Bioresour. Technol. 2010, 101, 6136–6146. 10.1016/j.biortech.2010.02.078. [DOI] [PubMed] [Google Scholar]
- Ma Z.; Sun Q.; Ye J.; Yao Q.; Zhao C. Study on the thermal degradation behaviors and kinetics of alkali lignin for production of phenolic-rich bio-oil using TGA-FTIR and Py-GC/MS. J. Anal. Appl. Pyrol. 2016, 117, 116–124. 10.1016/j.jaap.2015.12.007. [DOI] [Google Scholar]
- Wang S.; Ru B.; Lin H.; Sun W.; Luo Z. Pyrolysis behaviors of four lignin polymers isolated from the same pine wood. Bioresour. Technol. 2015, 182, 120–127. 10.1016/j.biortech.2015.01.127. [DOI] [PubMed] [Google Scholar]
- Ma Z.; Wang J.; Zhou H.; Zhang Y.; Yang Y.; Liu X.; Ye J.; Chen D.; Wang S. Relationship of thermal degradation behavior and chemical structure of lignin isolated from palm kernel shell under different process severities. Fuel Process. Technol. 2018, 181, 142–156. 10.1016/j.fuproc.2018.09.020. [DOI] [Google Scholar]
- Ferdous D.; Dalai A. K.; Bej S. K.; Thring R. W.; Bakhshi N. N. Production of H2 and medium Btu gas via pyrolysis of lignins in a fixed-bed reactor. Fuel Process. Technol. 2001, 70, 9–26. 10.1016/s0378-3820(00)00147-8. [DOI] [Google Scholar]
- Branca C.; Di Blasi C.; Galgano A.; Broström M. Effects of the torrefaction conditions on the fixed-bed pyrolysis of Norway spruce. Energy Fuels 2014, 28, 5882–5891. 10.1021/ef501395b. [DOI] [Google Scholar]
- Changbo L.; Yang C. Y.; Lin W. G.; Yao J. Z.; Yang X. M.; Song W. L. TG-FTIR Research of Biomass Catalytic Pyrolysis. Acta Energiae Solaris Sin. 2007, 28, 638–643. [Google Scholar]
- He G. Y.; Xiao R.; Zhang H. Y.; Wang D. H.; Pan Q. W. Direct catalytic cracking of vapors from biomass fast pyrolysis. J. Chin. Soc. Power Eng. 2010, 30, 147–155. [Google Scholar]