

Abstract

Tetraphenylethylene (TPE) can be used to construct fluorescent probes with typical aggregation-induced emission (AIE) behavior for next-generation sensing applications. McMurry coupling and Suzuki cross coupling strategies provided the desired sensor thiophene-substituted tetraphenylethylene (THTPE). The synthesized TPE analogues were characterized by NMR spectroscopy and mass spectrometry. Maximum AIE of THTPE was observed in 90% water (H2O/THF) content due to extensive formation of aggregates. The AIE properties of THTPE have been utilized for facile detection of nitroaromatic compounds (NACs) (1.0 nM) through a fluorescence quenching mechanism. A paper strip adsorbed with the AIE-based THTPE fluorophore is developed for rapid and convenient detection of NAC-based analytes. Further, interaction of THTPE with analytes is also studied via Gaussian software at the DFT/B3LYP/6-31G(d) level of theory. Interaction energy, frontier molecular orbitals (FMOs), and non-covalent interaction (NCI) analyses are studied by using the same method. Computational results revealed that nitrobenzene (NB) has the strongest interaction while 1,3-dinitrobenzene (DNB) exhibits the least interaction with the sensor molecule. These computational results clearly demonstrate good agreement with experimental data.
1. Introduction
In the present day, the most challenging questions to the scientific world are global security and environmental protection. Escalating terrorism threats have prompted the necessity for sensitive, stand-off, and low-cost detection methods for explosives. Explosive sensing is a regular, pacifist inspection technique, being extensively used at airport terminals and borders. Among the different classes, nitroaromatic compounds (NACs) are most widely used volatile compounds in various explosive formulations.1 Nitroaromatics vapors, even at a low level, are hazardous for the human health as well as for the environment.2 Therefore, their real-time trace detection to avert pre-planned terrorist activities is in high demand.3 To date, various commercially sophisticated techniques have been developed for detection of explosives. Ion-mobility spectrometry (IMS) is the universal explosive detection technique being employed at airports.4 The conventional laboratory methods for analysis of explosives include gas chromatography coupled mass spectrometry (GC–MS), surface-enhanced Raman spectroscopy (SERS), plasma desorption mass spectrometry (PDMS), energy-dispersive X-ray diffraction (EDXRD), and various spectral imaging techniques.5,6 However, the aforementioned techniques demand sophisticated protocols with high cost, time-consuming calibration, and poor portability, making them unsuitable for on-site field detection.7 Recently, the fluorescent chemosensors with superiority of operational simplicity, cost efficiency, and quick response have attracted greater interest.6−8 Most conventional fluorophores developed so far have a planar structure and are thus emissive in dilute solutions. However, in the solid state, their emission is quenched owing to the excimer formation due to π–π stacking interactions (aggregation-caused quenching, ACQ).9 Because of this undesirable ACQ effect, researchers were forced to use these chemosensors in dilute solutions where they had to face problems like low sensitivity and signal-to-noise ratios.10 Recently, Tang’s group discovered a new group of fluorogenic probes with a unique luminescence property coined as aggregation-induced emission (AIE).11 It was found that a class of propeller-shaped organic molecules does not emit light in dilute solutions albeit they display fluorescence in the aggregation state.12 Restriction of intramolecular motions (RIM) in the solid state is the proposed phenomena at the backdrop of a highly desirable AIE effect.13 NACs are electron-deficient in nature, so their interaction with electron-rich fluorescent probes occurs through a photo-induced electron transfer (PET) mechanism, thereby changing the emission intensity of the fluorescent probes.14 Tetraphenylethylene (TPE) is one of the notable AIEgens, being well-investigated due to many preferable features like good photostability, simple modification, and high luminescence efficiency.15
In the present study, tetraphenylethylene (TPE) molecules were synthesized from benzophenone via the McMurry reaction.16,17 Tetrathiophene-substituted tetraphenylethylene 3 was synthesized using a Suzuki cross coupling strategy and further investigated for aggregation-induced emission (AIE) properties. The AIE properties of tetrathiophene-substituted tetraphenylethylene 3 were utilized to investigate the sensing of various NAC analytes like picric acid (PA), 4-nitroaniline (NA), 4-nitrophenol (NP), nitrobenzene (NB), 2,4-dinitrotoluene (DNT), and 1,3-dinitroenzene (DNB). Introduction of a thiophene moiety onto the TPE molecule demonstrated a pivotal role in increasing the detection ability of the synthesized probe toward NACs. Interaction energy, frontier molecular orbitals (FMOs), and non-covalent interaction (NCI) analyses are studied via Gaussian software at the DFT/B3LYP/6-31G(d) level of theory.
2. Results and Discussion
Unique features of aggregation-induced emission (AIE) luminogens provide a state-of-the-art platform for construction of next-generation fluorescent probes. AIE luminogens with novel functionalities can potentially widen their practical applications. Therefore, tetraphenylethylene (TPE) as a typical luminogen has been selected for development of sensors for explosives or their degradation products.
2.1. Synthesis
McMurry coupling is a low-valence titanium-mediated reaction using two carbonyl functional groups for creating a double bond between carbonyl group carbons of the two molecules. Low-valence titanium species can be generated by combining titanium chlorides with suitable reducing agents. The McMurry coupling is a highly useful and versatile method for construction of sterically hindered alkenes. Initially, tetraphenylethylene 1 has been synthesized by allowing a reaction of two molecules of benzophenone in McMurry coupling reaction conditions (TiCl4 and zinc powder) using freshly distilled dry THF over sodium metal/benzophenone under an inert atmosphere (Scheme 1). The McMurry reaction failed when undistilled THF was used as a solvent. Addition of stoichiometric amounts of titanium tetrachloride to a mixture of zinc dust in the presence of dry THF was performed dropwise at 0 °C under inert atmospheric conditions. Zinc reduces titanium(IV) to low-valence titanium via in situ formation of a zinc–titanium complex. After formation of low-valence titanium species, the THF solution of benzophenone was added slowly to the in situ-formed mixture of low-valence titanium species. In situ formation of low-valence titanium species promote coupling of the two carbonyl groups through single electron transfer to the corresponding carbonyl groups. This kind of reaction demonstrated good tolerance to a variety of substitution on carbonyl substrates, but it appears to be very critical to in situ formation of low-valence titanium species. Several attempts have been made to optimize the reaction conditions required for in situ formation of low-valence titanium species. Completion of the McMurry reaction and purity of product 1 was monitored by thin-layer chromatography. Thin-layer chromatography revealed formation of fluorescent product 1 when it was irradiated with a 365 nm wavelength under a UV lamp. The obtained crude product 1 was then purified by column chromatography. The desired tetraphenylethylene 1 was obtained in 93% yield. The structure of the accomplished product was characterized by NMR spectroscopy (Figures S1 and S2).18
Scheme 1. Synthesis of Highly Fluorescent 1,1,2,2-tetrakis(4-(Thiophen-2-yl)phenyl)ethene (3) via the McMurry and Palladium-Catalyzed Suzuki Cross-Coupling Reaction.

The bromination of TPE 1 with bromine was carried out in the presence of glacial acetic acid using dichloromethane as a solvent. As expected, the optimized reaction conditions resulted in tetra(4-bromophenyl)ethylene 2 in 90% yield (Scheme 1). The reaction time for the bromination of tetraphenylethylene 1 was optimized using thin-layer chromatography. The optimized reaction time for bromination was found approximately 2 h. After completion of the reaction, the unreacted bromine and acetic acid were removed by washing the reaction mixture with cold water. The obtained precipitates were washed repeatedly with ethanol and water. Recrystallization of the crude product 2 provided the desired para-bromo substituted TPE 2 in 96% yield. The 1H NMR spectrum of compound 2 (Figure S3) shows two doublets, one at 7.27 (d, J = 8.5 Hz, 8H) which is attributed to eight ortho-hydrogens of four phenyl rings and a second doublet at 6.85 (d, J = 8.5 Hz, 8H) attributed to eight meta-hydrogens of four phenyl rings. This doublet (d) pattern in the 1H NMR spectrum showed that bromination occurs selectively at the para-position of phenyl rings because they are electron-rich positions. The second contributing factor toward bromination at the para-position is less steric hindrance as compared to the meta and ortho-positions. 13C NMR spectroscopy and mass spectrometry confirmed formation of tetrakis(4-bromophenyl)ethylene 2 (Figures S4 and S5). It is envisioned that introduction of a thiophene moiety onto TPE 1 would make more electron-rich 1,1,2,2-tetrakis(4-(thiophen-2-yl)phenyl)ethylene fluorescent probe 3 and would lead to the desired application in explosive detection. Therefore, treatment of thiophene-2-boronic acid with tetrakis (4-bromophenyl)ethylene 2 in the presence of THF and a saturated aqueous solution of potassium carbonate was carried out under degassed reaction conditions. The degassed reaction mixture was obtained by bubbling nitrogen gas for 15 min. Then, 10 mol % Pd(PPh3)2Cl2 was added into the reaction mixture under nitrogen protection and was further refluxed for 48 h. The progress of the reaction was monitored by thin-layer chromatography. Upon completion of the coupling reaction, the resulting mixture was extracted with ethyl acetate. The crude product was purified by column chromatography using n-hexane–dichloromethane (5:1) as the eluent to afford the desired product in 30% as a light yellow solid. The pure product 3 was successfully characterized using NMR spectroscopy and mass spectrometry (see Figures S6 and S7).
2.2. Concentration-Dependent Fluorescence Studies of THTPE (3)
Excellent solubility and emission intensities of the synthesized THTPE allowed us to record their photophysical properties and their fluorescence spectra. Concentration-dependent fluorescence emission behavior of THTPE 3 is shown in Figure 1. At a higher concentration of 1 × 10⁻³ M (1000 μM), THTPE 3 is weakly emissive owing to the inner filter effect.19 Concentration-dependent fluorescence emission spectra were collected to investigate the optimized concentration of THTPE 3 and its prevention from intermolecular π–π stacking for maximum emission intensity. The fluorescence emission intensity of THTPE 3 was investigated by varying the concentration, ranging from 10 to 1000 μM in pure THF. The fluorescence emission intensity of THTPE 3 was recorded with various concentrations from 10 to 1000 μM (Figure 1). At 10 μM concentration, THTPE 3 showed maximum emission intensity at 519 nm, as shown in Figure 1.
Figure 1.

Concentration-dependent fluorescence of probe 3 in pure THF solvent.
2.3. Aggregation-Induced Emission (AIE) Studies
The propeller structural feature in AIE compounds prevents π–π stacking in both aggregates and solids. It is well understood that TPE-derived probes are AIE-active due to the hydrophobic properties of TPE.20,21 Tetraphenylethylene possesses a characteristic propeller-shaped geometry with rotatable peripheral aromatic rings. Recent studies show that non radiative decay is triggered from the excited state when free rotation of peripheral aromatic rings becomes allowed in dilute solutions. This non radiative decay quenches the fluorescence emission in dilute solutions.22 Other studies have shown that TPE in dilute solution also undergoes photocyclization upon UV excitation in which bond formation takes place between C atoms of the phenyl groups, giving rise to diphenyl phenanthrene. Thus, photocyclization in TPE solutions is an important event in the relaxation process after photoexcitation. Structural flexibility facilitates non-radiative decay, and structural rigidity enhances radiative decay from the excited state. However, free rotations are blocked owing to short distances among the fluorophore molecules when the molecule becomes aggregated in concentrated solution and strong fluorescence emission is observed by blocking nonradiative decay of energy. Based on both structural rigidity and restrictions of intramolecular motions (RIMs), formation of the maximum number of aggregates restricts non-radiative relaxation pathways and enhances the radiative channels to promote aggregation-induced emission (AIE).23 Further, addition of different fractions of water to THF enables us to investigate the aggregation-induced emission (AIE) properties of THTPE 3 as shown in Figure 2. After optimizing the highly emissive concentration of THTPE 3 for maximum emission, a 10 μM concentration of probe was chosen for aggregate formation to further investigate for maximum emission in different fractions of water/THF solvent. Fluorescence emission intensity of THTPE 3 was gradually enhanced upon increasing the fraction of water to THF solution, with the spectral profile remaining unchanged (Figure 2). It is observed that THTPE 3 began to aggregate at a water fraction of >60% and started to emit fluorescence at 519 nm as compared to pure THF solution. After that, the fluorescence emission intensity was observed to be maximum when the H2O fraction reached up to 90% (90:10 water/THF). This fact suggests that increasing formation of aggregates occurs on addition of poor solvent like water. However, aggregation-induced emission (AIE) was decreased upon increasing the water fraction from 90 to 99% as also supported by literature data.24
Figure 2.
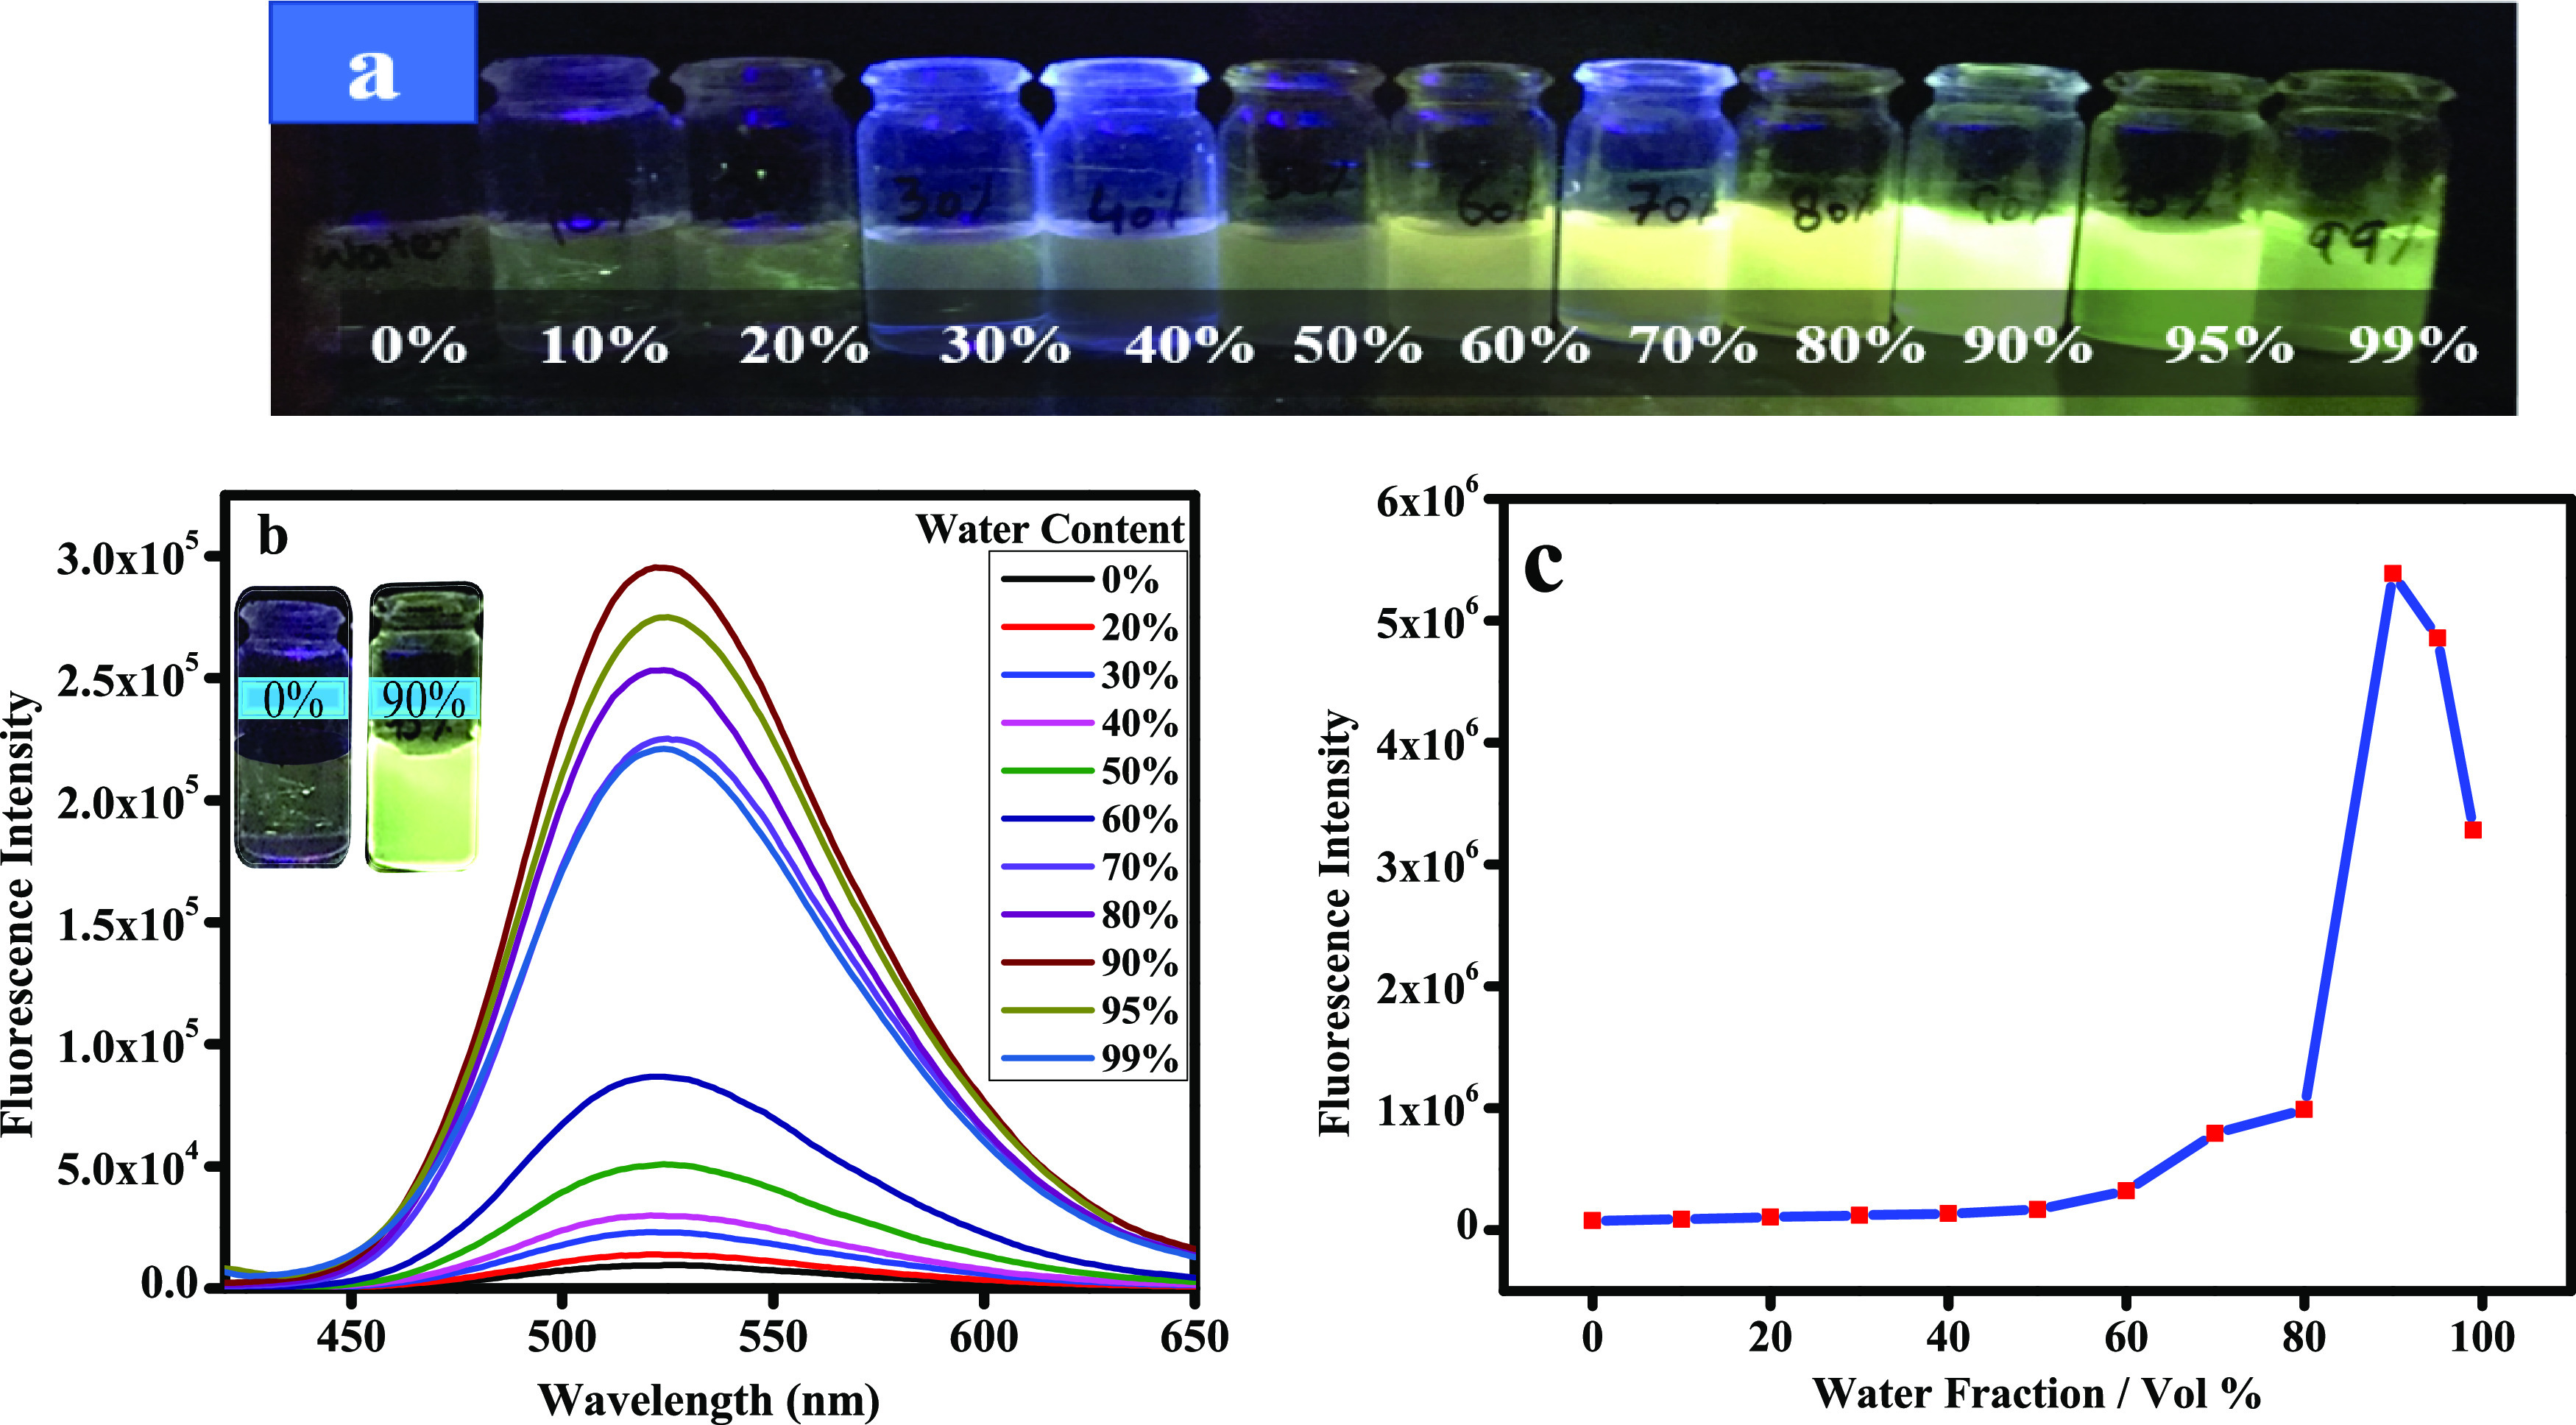
(a) Photos of solutions of 3 in the water/THF mixtures varying from 0–99% water fractions taken under 365 nm UV irradiation (λem = 519 nm); (b) fluorescence spectrum of changes in emission intensity of probe 3 in a mixed solvent (THF and water) with increasing water fractions at 25 °C (λex = 360 nm); (c) change of fluorescence intensity with varying water fractions.
The emission intensity dropped when the water fraction (fw) exceeds above 90% because the THTPE 3 molecules are easy to aggregate into large-sized particles. Appearance of large-sized particles decreases the effective compound concentration in the solution and lowers the fluorescence intensity.25 Literature reports suggest that a decrease in fluorescence emission intensity is observed when the molecular packing mode of aggregates is transformed from crystalline to the amorphous state.26,27
2.4. Detection of Nitroaromatics
Noncovalent interaction of electron-rich aromatic rings with electron-deficient nitroaromatic compounds (NACs) can easily affect the fluorescence emission properties of the fluorophore. For example, TPE-based π-conjugated skeletons are famous for their thermal properties and photostability.28−30 Tetraphenylethylene shows remarkable potential as a probe for the detection of electron-deficient nitroaromatic explosives. The strong rigidity of the directly attached thiophene moiety to the phenyl ring system can easily prevent strong π–π stacking interaction and avoid aggregation-caused quenching (ACQ). Further, the good aggregation-induced emission properties of the synthesized tetraphenylethylene-based probe 3 prompted us to investigate the sensing potential of nitroaromatic compounds (NACs). Probe THTPE 3 solutions (10 μM) displayed an emission maximum at 519 nm (λex = 360 nm) in the 90% water fraction (90:10 H2O/THF). Therefore, a 10 μM solution of THTPE 3 in a mixture of water and THF at the 90% H2O fraction was chosen for the sensing of NACs (Figure 3).
Figure 3.

Schematic illustration for AIE-based fluorescence ON/OFF emission studies for the detection of NACs.
Fluorometric titration was carried out at an excitation wavelength of 360 nm. Fluorescence emission of THTPE probe 3 at 519 nm was gradually reduced upon successive addition of nitrobenzene (NB), 4-nitrophenol (NP), and 4-nitroaniline (NA) over a wide concentration range (0.001 −1000 μM) to probe 3 (10 μM) as shown in Figure 4. To investigate the sensing ability of THTPE 3 (10 μM) against NACs, its 90% (90:10 water/THF) aggregates was titrated with nitrobenzene (NB), 4-nitrophenol (NP), and 4-nitroaniline (NA). Substantial reduction in emission intensity of THTPE probe 3 was noticed at 519 nm without any change in the spectral wavelength. The fluorescence emission intensity was gradually reduced with increasing concentration of nitrobenzene (NB), 4-nitrophenol (NP), and 4-nitroaniline (NA) from 0.001 −1000 μM (0.001, 0.01, 0.1, 0.5, 1, 10, 20, 40, 60, 80, 100, 200, 400, 600, 800, and 1000 μM). Fluorescence quenching can occur through several possible ways such as photoinduced electron transfer (PET), inner filter effect (IFE), proton transfer (PT), energy transfer (ET), dynamic quenching, static quenching, and fluorescence resonance energy transfer (FRET).31 To build a highly selective and sensitive probe, it is greatly required to understand the relationship between the molecular structures of the probe and quencher and the fluorescence quenching method. A wide range of theories and explanations has been presented so far regarding the explosives sensing via fluorescence quenching mechanism.32,33 However, there was no emphasis observed on what combination of mechanisms and properties of probes should be made to design a novel highly efficient sensing system. Photoinduced electron transfer (PET) can take place from an electron-rich donor to an electron-deficient acceptor if the energy gap between the HOMO and LUMO levels of the probe is more as compared to the difference between the LUMO levels of the probe (donor) and quencher (acceptor).34 Further, nitrobenzene (NB) has strong absorption ranging from 200 to 440 nm while other NAC analytes have no significant absorption in this range. Notably, the excitation wavelength of probe 3 is 360 nm, which is completely overlapped by the absorption band of NB. Thus, the efficient quenching of NB in this system might be attributed to a competition for the excitation energy between the emission band of the fluorophore and the absorption band of the analyte (Figure 4a). Moreover, the luminescence quenching behavior for NB may be due to the electron transfer from the electron-donating probe to the electron-deficient NB molecules.35 Nitrobenzene (NB) with a smaller size demonstrated the highest quenching efficiency owing to its ease of penetration into the propeller cavity of the probe. In fact, this ease of penetration of NB into the probe cavity dramatically enhances the quenching efficiency through strong π–π stacking and other favorable interactions. Despite the structural similarity between 4-nitrophenol and 4-nitroaniline, the 4-nitrophenol-quenched emission intensity of probe 3 was more significant as compared to that of 4-nitroaniline (Figure 4c). Superior quenching by 4-nitrophenol is observed because noncovalent interactions between 4-nitrophenol and probe 3 are possibly more effective compared to 4-nitroaniline and probe 3 (O – H···π vs N – H···π).36,37
Figure 4.

Fluorescence emission spectrum (right) and corresponding Stern–Volmer plot (left) for fluorescence quenching of THTPE 3 (10 μM, 90% (90:10 water/THF)) at 519 nm upon addition of (a, b) nitrobenzene, (c, d) 4-nitrophenol, and (e, f) 4-nitroaniline with concentrations from 0 nM to 1000 μM; the dotted upward line was fitted by OriginPro 8.5 λex = 360 nm, Ex/Em slit widths = 2/2.
Further, the Stern–Volmer constant was calculated using the Stern–Volmer eq 5 mentioned below, where Io is the emission intensity of probe 3 before addition of nitrobenzene, I is the emission intensity after addition of nitrobenzene, and KSV is the Stern–Volmer constant. The Stern–Volmer constant (KSV) for nitrobenzene was calculated to be 2.046 × 10⁵ M–1. The magnitude of the Stern–Volmer constant demonstrated good sensitivity toward nitrobenzene (NB). Figure 4b shows an upward bent line with a correlation constant of 0.9935. An upward bent line in a Stern–Volmer graph indicates the rapid quenching with increasing concentrations of nitrobenzene. The fluorescence quenching percentage at nanomolar concentration was also measured using eq 2.38 The quenching efficiency for nitrobenzene was found to be 95.84% at 1.0 nM concentration.
| 3 |
| 4 |
Generally, a linear curve indicates that either a dynamic quenching or static quenching mechanism is involved.39 Meanwhile, a nonlinear and upward Stern–Volmer (SV) curve for nitrobenzene reveals contribution of both dynamic and static quenching mechanisms.40−42 The unique interaction of the probe with analytes including donor–acceptor electron transfer may illustrate the crucial quenching mechanism of fluorescence emission. Figure 4c shows fluorescence emission of probe 3 with various concentrations of 4-nitrophenol and the corresponding SV plot exhibits significant quenching effects on the fluorescence intensity of the probe (Figure 4c,d). At low concentration, the SV curve has good linearity and then deviates from linearity at higher concentration of analytes (Figure 4b,d,f). This phenomenon may be attributed to the presence of simultaneous dynamic and static quenching.4 The fluorescence intensity of THTPE 3 is not completely quenched at 1000 μM 4-nitrophenol (NP) as depicted in Figure 4c–e, revealing that the emission intensity of probe 3 was not completely quenched by 4-nitroaniline under the same experimental conditions. As shown in Figure 4f, the linear correlation coefficient (R) in the KSV curve suggests that the quenching effect of 4-nitroaniline on the fluorescence emission of probe 3 fits the Stern–Volmer mode well. 4-Nitroaniline exhibits smooth delocalization of the π-electron cloud from the electron-donating amine to the electron-deficient nitro group along with a high value of hyperpolarizability.43 However, a combination of dynamic and static quenching by ground-state complex formation can lead to non-linear Stern-Volmer plots.44−46
Figure 5a shows the quenching pattern and efficiency of the 2,4-DNT analyte. DNT shows positive deviation from linearity at high concentrations, exhibiting amplified quenching as shown in Figure 5b. The least quenching efficiency was observed for picric acid and DNB as shown in Figure 5c–e, respectively.
Figure 5.

Fluorescence emission spectrum (right) and corresponding Stern–Volmer plot (left) for fluorescence quenching of THTPE 3 (10 μM, 90% (90:10 water/THF)) at 519 nm upon addition of (a, b) 2,4-DNT, (c, d) picric acid, and (e, f) 1,3-DNB with concentrations from 0 nM to 1000 μM; the dotted upward line was fitted by OriginPro 8.5 λex = 360 nm, Ex/Em slit widths = 2/2.
The fluorescence emission intensity of THTPE probe 3 at 519 nm was gradually reduced with the increasing concentration of 2,4-dinitrotoluene (DNT), picric acid (PA), and 1,3-dinitrobenzene (DNB) from 0–1000 μM (0.001, 0.01, 0.1, 0.5, 1, 10, 20, 40, 60, 80, 100, 200, 400, 600, 800, and 1000 μM). With increasing concentrations of analytes and the self-absorption phenomenon, the SV curve deviates from the linearity at higher concentration (Figure 5). Upward bent lines in the Stern–Volmer graph of DNT indicated rapid quenching with increasing concentrations of analyte. These nonlinear Stern–Volmer curves revealed contribution of both dynamic and static quenching mechanisms.42,47,48 Picric acid (PA) and 1,3-dinitrobenzene (DNB) showed the least quenching effect as shown in Figure 5. The lowest-energy LUMO of highly electron-deficient picric acid is believed to be the major driving force for photo-induced electron transfer (PET) to take place.49 With this reason in mind, PA can potentially show large quenching efficiency than nitrobenzene, nitrophenol, and nitroaniline if PET is considered as a major quenching mechanism. However, the least quenching efficiency of picric acid and DNB rules out involvement of the PET process as the quenching mechanism. Apparently, unfavorable combination of the electron donor (probe)–acceptor (picric acid) and subsequent failure in a ground-state complex formation prevents close interactions in the ground state due to possible steric hindrance or twisted molecular conformations. Fluorescence emission was gradually decreased with increasing concentration of DNB until maximum quenching was caused at 1000 μM. The SV plot showed a nearly linear trace showing probable dynamic quenching (Figure 5f). NB and NP showed upward bent Stern–Volmer plots due to super-amplified quenching.50 NB and NP demonstrated more quenching than PA and DNB at 10–7 M, and the quenching order for various analytes at 1.0 nM concentration is NB > NP > NA > DNT > PA > DNB as shown in Figure 5. Large fluorescence quenching efficiency is linked with nitrobenzene (NB) and 4-nitrophenol (NP) over other NACs. The binding constants (KSV) of THTPE 3 with various analytes (NB = 2.046 × 10⁵ M–1, NP = 1.26 × 10⁵ M–1, NA = 4.45 × 10⁴ M–1, DNT = 4.38 × 10⁴ M–1, PA = 2.07 × 10⁴ M–1, DNB = 1.48 × 10⁴ M–1) were measured by fitting the data of the Stern–Volmer curves as shown in Figure S8.49,51,52 Stern–Volmer constants of all the tested analytes with probe THTPE 3 are found in decreasing order of NB > NP > NA > DNT > PA > DNB.
To investigate the quenching behavior and interaction between THTPE 3 and NACs, fluorescence titration was carried out at 1.0 nM concentration of various NACs in the 90% water fraction (H2O/THF). Figure 6a shows the comparative quenching behavior of probe emission upon addition of nitroaromatic compounds at 1.0 nM concentration of each analyte (NB, NP, NA, DNT, PA, and DNB) to 3 (10 μM, 90% (90:10 water/THF)). Stern–Volmer plots for NB, NP, NA, DNT, PA, and DNB are shown in Figure 6b.
Figure 6.

(a) Fluorescence quenching of THTPE 3 (10 μM, 90% (90:10 water/THF)) with addition of various NACs at 1.0 nM concentration and Em/Ex slit width of 2/2. (b) SV plot of 10 μM probe 3 at different concentrations (1.0 nM–1000 μM) of analytes.
Generally, AIE-based fluorescence probes are more sensitive toward NACs with a higher number of nitro groups. This sensitivity originated from the stronger D–A interactions.53 In contrast, nitrobenzene (NB) showed a maximum quenching effect up to 95.84% when sensing studies were carried out at 1.0 nM concentrations of NB, NP, NA, DNT, PA, and DNB (Figure 6a). The limit of detection (LOD) is also an important feature to analyze the sensitivity of a probe. The LOD of probe 3 as a fluorescent sensor for the detection of NB was calculated to be 1.0 nM, which was sufficiently low for the detection of nanomolar-level concentrations of NB in aqueous media.
It is believed that the smaller size of nitrobenzene (NB) and 4-nitrophenol (NP) allows maximum interaction with the probe molecule through their penetration into the electron-rich propeller cavity of probe 3 as compared with other NACs. The relatively less electron-deficient nitrobenzene (NB) with one nitro group demonstrated the highest quenching efficiency owing to its ease of penetration into the propeller cavity of the probe. In fact, this ease of penetration of NB into the probe cavity dramatically enhances quenching efficiency through strong π–π stacking and other favorable interactions.
To compare the detection efficiency of probe 3 with tetraphenylethylene (TPE) 1, a separate experiment was performed to investigate the fluorescence response of TPE 1 toward NACs as shown in Figure 7. In this regard, a selectivity graph was plotted after titrating 10 μM TPE 1 solution against 1000 μM of different NACs including DNB, DNT, NP, NA, PA, and NB. It was noticed that the addition of various NACs to a solution of TPE 1 (10 μM) at 380 nm did not display any substantial characteristics of the fluorescence spectrum except NB (Figure 7). Fluorescence emission of TPE 1 was slightly influenced even after addition of 1000 μM NB. Hence, it can be concluded that distinctive structural characteristics of probe 3 played a key role in its selectivity and sensitivity toward NACs particularly NB.
Figure 7.

Fluorescence sensing of TPE 1 (10 μM) with addition of various NACs at 1000 μM concentration and Em/Ex slit width of 2/2.
2.5. Paper Strip for NAC Detection
The major goal is to develop a suitable portable detection system as a convenient solid state fluorescence sensor for NAC detection. This idea was brought into action by preparing test paper strips for nitroaromatic analyte detection. Whatman qualitative filter paper coated with THTPE 3 was used for qualitative detection of nitroaromatic analytes (NB, NP, NA, PA, DNT, and PA) under 365 nm UV irradiation. As expected, NAC analytes greatly reduced the fluorescence emission intensity of a paper strip coated with THTPE 3. In contrast, the reference strip did not show any significant change in fluorescence emission intensity (Figure 8b). Further, the fluorescence paper strip dipped into NAC solutions displayed pronounced quenching of fluorescence emission in an order similar to other experimental findings (Figure 8b). This shows that the majority of the probe molecules stayed absorbed on the paper strip. This remarkable experimental outcome strongly suggested that our synthesized probe has the potential to be made into an efficient solid-state sensor for sensitive explosive detection.
Figure 8.

(a) Quenching efficiency of DNB, PA, DNT, NA, NP, and NB in the 90% water fraction (90:10 H2O/THF); the quenching efficiency = (1 – I/Io) × 100%, and I and Io indicate the fluorescence intensity of THTPE 3 (10 μM, 90% (90:10 water/THF)) with and without NACs [1 nM]. (b) Visible color change of 3 (500 μM) when 100 μM NACs were applied over it.
2.6. Thermodynamic Stabilities
In order to obtain the most preferable interaction site of THTPE 3, all possible structures with selected analytes are considered.54−56 In the THTPE 3 fluorophore, two preferred sites available for the interaction of analytes are represented as site I and site II (Figure 9). After interaction of analytes, two types of complexes are possible and are characterized as complex I and complex II as shown in (Figure 9).
Figure 9.
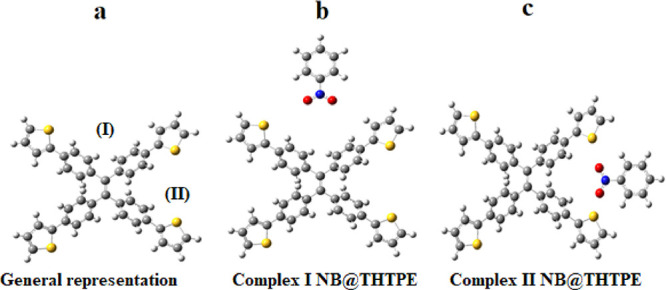
(a) Representation of two sites of the optimized THTPE 3 molecule, (b) general representation of complex I (NB@THTPE), and (c) general representation of complex II (NB@THTPE).
The thermodynamic stability of all considered complexes is calculated from the interactive energies of THTPE 3 with analytes. The higher the interaction energy, the greater will the thermodynamic stability be and vice versa. Our probe molecule is examined with six different analytes, which resulted in twelve kinds of complexes. The complex of NB@THTPE is displayed in Figure 9, while the complex of the remaining analytes is depicted in the Supporting Information as Figures S9 and S10. The interaction energies of complexes are also compared with experimental data. The highest interaction energy is calculated for the nitrobenzene analyte, and the least interaction energy is found out for dinitrobenzene (Table 1). The interaction energies of complexes I and II of nitrobenzene with THTPE 3 are −115.71 and – 117.03 kcal/mol, respectively. Complex II of NB@THTPE shows higher interaction energy as compared to complex I. The interaction energy of NP@THTPE complex I is −5.26 kcal/mol and that of complex II is −4.69 kcal/mol. Complex I of NP@THTPE shows higher interaction energy as compared to complex II of NP@THTPE. In the case of nitroaniline, complex I has an interaction energy of −4.75 kcal/mol and complex II has an interaction energy of −3.91 kcal/mol. Complex I shows higher interaction energy as compared to complex II of NA@THTPE. For picric acid, the interaction energy of complex I is −4.96 kcal/mol and complex II is −5.39 kcal/mol. Complex II shows higher interaction energy with respect to complex I. The complexes of dinitrotoulene have interaction energies of −4.05 kcal/mol for complex I and −4.31 kcal/mol for complex II. Complex II of DNT@THTPE gives more interaction energy as compared to complex I. Complexes of dinitrobenzene results in an interaction energy of −3.44 kcal/mol for complex I and −2.62 kcal/mol for complex II. Complex I of DNB@THTPE shows more interaction energy as compared to complex II. The energies for the probe and analytes are given in (Table 1).
Table 1. Interaction Energies between Probe and Analytes in kcal/mol.
| analytes | NB@THTPE | NP@THTPE | PA@THTPE | NA@THTPE | DNT@THTPE | DNB@THTPE |
|---|---|---|---|---|---|---|
| complex I (kcal/mol) | –115.71 | –5.26 | –4.96 | –4.75 | –4.05 | –3.44 |
| complex II (kcal/mol) | –117.03 | –4.69 | –5.39 | –3.91 | –4.31 | –2.62 |
Interaction energies of complex I are compared with those of complex II. It is found that complex I of NP@THTPE, NA@THTPE, and DNB@THTPE and complex II of NB@THTPE, DNB@THTPE, and PA@THTPE exhibit greater interaction energies in comparison to the other complexes of the respective analytes. In the case of NB@THTPE, DNB@THTPE, and PA@THTPE, the most preferable site for analyte interaction is site II, where the analytes show maximum interaction energy. On the other hand, site I is most preferable for NP@THTPE, NA@THTPE, and DNB@THTPE complexes.
Comparison between complex I of all analytes reveals that nitrobenzene possesses the highest interaction energy and dinitrobenzene has the lowest interaction energy than all other analytes, which is comparable to experimental results. The interaction energy trend of complex I is NB > NP > PA > NA > DNT > DNB. The same results are obtained from complex II where NB@THTPE shows the maximum interaction energy, i.e., −115.71 kcal/mol, and DNB@THTPE asserts minimum interaction energy, i.e., −2.62 kcal/mol. The interaction energies of complexes II are in the order of NB > PA > NP > DNT > NA > DNB.
It is extracted from these values that the interaction of nitrobenzene with THTPE 3 is the highest in contrast with all other analytes. Hence, it will trigger the maximum quenching, which is also proven by fluorescence studies. Whereas dinitrobenzene interaction with THTPE 3 is the least and exhibit minimum quenching among all other analytes. The interaction energies of complexes I is fairly matched with experimental data. Therefore, the further studies like frontier molecular orbitals and NCI analysis are executed only for complex I of all analytes.
2.7. Frontier Molecular Orbital (FMO) Analysis
Further, the interaction of analytes over the surfaces of THTPE 3 is also analyzed by FMO analysis. The HOMO was distributed on the entire molecule in THTPE 3, while the LUMO was localized on central TPE. The H-L energy gap of THTPE 3 is 3.2 eV, and a change in energy of the HOMO and LUMO complexes is a valuable indicator for sensing mechanisms. The HOMO and LUMO surfaces of NB@THTPE and DNT@THTPE are presented in Figure 10, while the remaining are shown in the Supporting Information (Figures S11 and S12).
Figure 10.

HOMO and LUMO surfaces of complexes I of NB@THTPE and DNB@THTPE. (a) NB@THTPE HOMO, (b) NB@THTPE LUMO, (c) DNB@THTPE HOMO, and (d) DNB@THTPE LUMO.
Conductivity and resistivity of materials are dependent on the HOMO–LUMO energy gaps (H-L gap), higher the H-L gap, lesser will be the conductivity and vice versa.57 The HOMO and LUMO energies of individual THTPE 3 are −5.04 and −1.72 eV, respectively. The H-L gap of THTPE 3 is 3.32 eV. THTPE 3 is a good conductor and has maximum reactivity owing to the existence of a sulfur group. H-L gaps of resultant complexes are decreased upon interaction with analytes58 as given in Table 2. Strong overlapping of orbitals between THTPE 3 and analytes decreases the H-L gap that results in an increase in conductivity. The H-L gap of NB@THTPE is 2.31 eV for complex I. The change in the H-L gap after interaction with treated analytes proves that THTPE 3 is the best sensor for NB, NP, NA, DNT, PA, and DNB. The H-L gap of NP@THTPE is 2.75 eV for complex I. There is a noticeable decrease in the energy gap that predicts interaction of THTPE 3 with the said analyte. The H-L energy gaps for NA@THTPE, PA@THTPE, DNT@THTPE, and DNB@THTPE are 2.96, 1.32, 2.11, and 1.74, respectively, for complex I. The values of the HOMO, LUMO, and H-L gap for complex II are given in Table S1.
Table 2. HOMO, LUMO, and H-L Gap in eV for X@THTPE Complex I.
| complexes | HOMO (eV) | LUMO (eV) | H-L gap (eV) |
|---|---|---|---|
| THTPE-3 | –4.89 | –1.63 | 3.2 |
| NB@THTPE I | –4.88 | –2.57 | 2.31 |
| NP@THTPE I | –5.11 | –2.08 | 2.75 |
| NA@THTPE I | –4.96 | –1.99 | 2.96 |
| PA@THTPE I | –5.07 | –3.75 | 1.32 |
| DNT@THTPE I | –5.17 | –3.07 | 2.11 |
| DNB@THTPE I | –4.95 | –3.21 | 1.74 |
In complexes, the greater the H–L gap, the higher the quenching caused by analytes will be and vice versa. In NB@THTPE, the H-L gap is larger than all other analytes that leads to extravagant quenching. This is also investigated by fluorescence studies, which confirms the maximum quenching of NB.
2.8. NCI Analysis
The noncovalent interaction index (NCI) is a suitable technique to find the nature of interacting efficiency such as hydrogen bonding, van der Waals interactions, and steric repulsion.59 NCI based on a reduced density gradient (RDG) and density gradient (DG)60 is a prime derivative of electronic density ρ(r).In the literature, the RDG is defined by eq 5.61
| 5 |
where ∇ρ is the electronic density gradient and ρ represents the electronic density. Colored isosurfaces are obtained as sign (λ2)ρ(r) upon mapping the NCI index.62 RDG isosurfaces are based on the color scheme red, blue, green, and yellow. It is revealed from the literature that a red color elucidates steric repulsion, a blue color indicates strong attractive forces, while a green color demonstrates weak repulsive and lenient attractive forces.63 Stabilizing attractive interactions (λ2 < 0) and destabilizing attractive interactions (λ2 > 0) are distinguished by λ2, which is an eigenvalue in the Hessian matrix.64
The NCI graph of complex I NB@THTPEE is shown in Figure 11, while the NCI graphs of all other analytes are presented in Figures S13 andS14.
Figure 11.

(a) NCI-RDG 2D scatter map of complex I of NB@THTPE and (b) 3D color filled RDG isosurface complex I of NB@THTPE.
NCI results disclose that NB interacts through van der Waals interactions. In NB@THTPE, the peak is observed at λ2ρ = −0.01 to 0.02, which corresponds to van der Waals interactions and steric repulsion between the oxygen atom of analyte and the sulfur atom of THTPE, respectively. Similar results are observed for NP@THTPE, NA@THTPE, PA@THTPE, DNT@THTPE, and DNB@THTPE in which peaks are witnessed at λ2ρ = −0.01 and λ2ρ = −0.01 to 0.02 for van der Waals interaction and steric repulsion, respectively.
NCI results demonstrate that analytes interact with THTPE 3 via weak van der Waals forces, which spurred up the emissive properties of THTPE 3 as it can be observed through fluorescence studies.
3. Conclusions
In summary, fluorescent tetrathiophene-substituted tetraphenylethylene was synthesized and characterized by NMR spectroscopy and mass spectrometry. Thiophene-substituted THTPE 3 exhibited the highest emission at 10 μM with an emission peak at 519 nm, and maximum aggregation-induced emission was noticed in the 90% water/THF fraction due to extensive aggregate formation. The synthesized THTPE fluorophore with aggregation-induced emission (AIE) properties serves as an effective fluorescent sensor for the detection of NAC analytes (nitrobenzene, 4-nitrophenol, 4-nitroaniline, 2,4-dinitrotoluene, picric acid, and 1,3-dinitrobenzene). The response of the sensor was remarkable for nitrobenzene and 4-nitrophenol (KSV = 2.046 × 10⁵ M–1 for NB and 1.2 × 10⁵ M–1 for NP). The order of fluorescence quenching with NAC analytes was found in the order of NB > NP > NA > DNT > PA > DNB. A very fast fluorescence quenching response was observed owing to photoinduced electron transfer and/or energy transfer quenching processes. Quenching results showed that the emission intensity of THTPE was quenched up to 95.84% by nitrobenzene with a high correlation coefficient value (R2 = 0.9935). A paper strip has been developed for rapid and convenient detection of NAC analytes. Theoretical studies demonstrated that results of complexes I are parallel with experimental data. The complexes of NB@THTPE show maximum interaction with the sensor molecule, and this result is perfectly matched with experimental work in which NB@THTPE shows maximum quenching. On the other hand, DNB@THTPE exhibits minimum interaction with the sensor molecule and the result is also proven by fluorescence studies in which DNB@THTPE slows the least quenching. The order of interaction with the sensor molecule is given as NB > NP > PA > NA > DNT > DNB, which is almost similar to the quenching order at 1.0 nM, i.e., NB > NP > NA > DNT > PA > DNB. PA@THTPE, NA@THTPE, and DNT@THTPE show slight differences from experimental results that are under acceptable range.
4. Experimental Section
4.1. Materials and Methods
All chemicals and reagents such as benzophenone, titanium tetrachloride (TiCl4), zinc dust, phenylboronic acid, thiophene-2-boronic acid, bis(triphenylphosphine)palladium(II) dichloride, liquid bromine, tetrahydrofuran, ethyl acetate, dichloromethane, methanol, hydrochloric acid, acetone, ethanol, and nitroaromatic compounds such as picric acid (PA), 1,3-dinitrobenzene (DNB), 2,4-dinitrotoluene (DNT), 4-nitrophenol (NP), nitroaniline (NA), and nitrobenzene (NB) used in this research work were of analytical grade. These chemicals were obtained from Oakwood, USA; Alfa Aesar, Daejung, Korea; and Sigma Aldrich and used directly without any further purification. THF solvent was distilled under still head apparatus by using sodium metal and benzophenone. Mixtures of the synthesized components were eluted through the column containing silica gel of 230–400 mesh size. Optimized polarity of the solvent systems was used to purify the desired products based on Rf. Melting points of all the synthesized analogues were measured by using Stuart digital melting point apparatus. 1H NMR spectra of the synthesized analogues of TPE were recorded at a Bruker Avance III HD 400 MHz NMR using CDCl3 as a solvent. The structures of the synthesized TPE analogues were further confirmed by MALDI-TOF mass spectrometry. Fluorescence emission studies were carried out with a spectrofluorometer model FluoroMax-Plus-P-C, Horiba Jobin Yvon Technology, USA.
4.2. Synthesis and Characterization
4.2.1. Procedure for the Synthesis of Tetraphenylethylene (1)
A two-neck round-bottom flask and reflux condenser were flushed with a stream of nitrogen. Zinc powder (60.0 mmol, 4.45 g) was suspended in 50 mL of dry THF. The temperature of the resulting reaction mixture was maintained at −5 °C, and TiCl4 (30.0 mmol, 3.25) was added dropwise using a syringe at the same temperature. The resulting black suspension of the reaction mixture was slowly heated up to room temperature under stirring. The resulting reaction contents were further stirred for 30 min. Afterward, the reaction mixture was heated under reflux conditions for 2 h. A round-bottom flask carrying the reaction mixture was again kept at 0 °C before addition of the respective benzophenone. A THF (30 mL) solution of benzophenone (30.0 mmol, 5.45 g) was poured slowly into the reaction mixture at 0 °C. Then, the resulting reaction mixture was continued under reflux conditions till consumption of the corresponding benzophenone. Then, 60 mL of 10% aqueous solution of K2CO3 was used to quench the reaction mixture and finally extracted with dichloromethane. The extracted organic layer was evaporated to afford the crude product. The crude solid material was further chromatographed by column chromatography using n-hexane and ethyl acetate (99:1) as the eluent. The desired product 1 was obtained in 93% yield as a white powder. Yield: 93%; M.P = 222–224 °C; Rf = 0.47 (n-hexane:EtOAc = 99:1); 1H NMR (400 MHz, CDCl3): δ (ppm): 7.11–7.07 (m, 12H, ArH-2,4,6), 7.04–7.01 (m, 8H, ArH-3,5). 13C NMR (100 MHz, CDCl3): 143.9 (C), 141.1 (C), 131.5 (CH), 127.8 (CH), 126.6 (CH).
4.2.2. Bromination of Tetraphenylethylene (1)
Molecular bromine (21.0 mmol, 1.08 mL) was added dropwise to a mixture of tetraphenylethylene (2.7 mmol, 0.8 g) 1 and glacial acetic acid at 0 °C under an ice bath condition. Dichloromethane (10 mL) was added as soon as the addition of bromine had been completed. After the ice bath, the reaction mixture was heated at 50 °C for 60 min. Consumption of tetraphenylethylene was monitored by thin-layer chromatography. The reaction mixture was then allowed to cool below room temperature by adding 200 mL of ice-cold water. The appeared solid precipitates were filtered and washed with ethanol. The filtered precipitate was further washed with excess water until unreacted bromine was completely removed and the desired compound 2 was obtained as a yellow powder. Yield: 96%; M.P = 248–250 °C; Rf = 0.43 (n-hexane:DCM = 98:2); 1H NMR: (400 MHz, CDCl3): δH (ppm): 7.25 (d, J = 8.0 Hz, 8H, ArH-3,5) and 6.83 (d, J = 8.0 Hz, 8H, ArH-2,6). 13C NMR (100 MHz, CDCl3): 141.6 (C), 139.8 (C), 132.9 (CH), 131.5 (CH), 121.5 (C). MALDI-TOF MS: m/z 647.8 (M+).
4.2.3. Synthesis of 1,1,2,2-Tetrakis(4′-(thiophen-2″-yl)phenyl)ethylene (3)
A 50 mL round-bottom flask equipped with a magnetic stirrer was flushed several times with a faster flow rate of nitrogen until air was removed completely from the round-bottom flask. A yellow powder of 1,1,2,2-tetrakis(4′-bromophenyl)ethylene (800 mg, 1.234 mmol) and thiophene-2-boronic acid (790 mg, 4.172 mmol) was dissolved in dry THF (60 mL). The 20 mL aqueous solution of potassium carbonate (2.0 M) was introduced into the reaction mixture. Afterward, the entire content of the reaction mixture in the flask was degassed through slow bubbling of a stream of nitrogen gas for 15 min. After degassing the reaction mixture, 10 mol % bis(triphenylphosphine)palladium(II) dichloride (120 mg, 0.17 mmol) was introduced into the reaction mixture under an inert atmosphere. The resulting reaction mixture was heated at reflux for 50 h. Finally, the reaction mixture was allowed to cool down to room temperature. Two layers appeared, and the THF layer was isolated and washed three times with water (25 mL). Evaporation of the isolated organic layer under reduced pressure provided precipitates of a crude product, which was again washed with water to remove traces of inorganic salts. The column chromatography using n-hexane–chloroform (95:5) as a mobile phase provided desired product 3 as a light-yellow solid. Yield: 30%; M.P. = 200–208 °C; Rf = 0.41 (n-hexane:DCM = 3.1); 1H NMR (400 MHz, CDCl3): δH (ppm) 7.40 (d, J = 8.4 Hz, 8H, ArH-3,5), 7.27 (d, J = 3.6 Hz, 4H, ThH-10), 7.23(m 4H, ThH-8), 7.09 (d, J = 8.4 Hz, 8H, ArH-2,6), 7.04 (m, 4H, ThH-9). MALDI-TOF MS: m/z 660.1 (M+).
4.3. Fluorescence and Aggregation Induced Emission Studies
1.0 mM stock solution of the THTPE 3 was prepared in THF, and solutions of 900, 800, 700, 600, 500, 400, 300, 200, 100, 10, and 1 μM concentrations of probe were prepared from 1.0 mM stock solution for detailed fluorescence emission studies. Final probe concentrations: .0.001–1000 μM. Final probe volume: 3.5 mL. Aggregation-induced emission properties of THTPE 3 were studied at different fractions of water ranging from 0–99% water in THF. Final concentration: 10 μM probe solution. Final probe volume: 3.5 mL.
4.4. Fluorescence Assay for NAC Detection
Detection of all the NACs was carried out by preparing different concentrations of analytes in 90% water and THF solvent. All solutions were prepared from 1.0 mM stock solutions of probe and analytes in 25 mL volumetric flasks and then diluted to the desired concentration by the using dilution formula (M1V1 = M2V2). Final concentrations: 10 μM probe, 900–0.001 μM analytes. Final detection volume: 3.5 mL. A quartz cuvette (path length 10 × 10 mm) used in fluorometric analysis had a capacity of 3.5 mL. In order to keep the same interaction time between the analyte and probe for all solutions, the analyte was added into probe solution right before the spectral analysis. All experiments were performed at room temperature under a 65% humidity level for accurate measurements.
4.5. Preparation of a Fluorescence Paper Strip for NAC Detection
Whatman qualitative filter paper (7.0 cm diameter) was dipped into 500 μM solution of THTPE 3 in THF solvent. The resulting paper strip was dried at room temperature to obtain the fluorescence paper strip. Afterward, another paper strip was immersed into pure THF solvent as a reference strip and dried at room temperature. Freshly prepared 100 μM solutions of nitroaromatic analytes NB, NP, NA, PA, DNT, and PA in THF solvent were placed onto a paper strip coated with and without fluorescent THTPE 3. Fluorescence emission of both coated paper strips and reference paper strips was recorded under UV irradiation at 365 nm.
4.6. Computational Methodology
Computational studies via density functional theory (DFT) are performed by using the Gaussian 09 program,65 while the results are visualized by the Gauss View 5.0 program.66 Local minima are obtained through optimization and frequency analysis at the B3LYP/6-31G(d) level of DFT. Interaction energies are calculated with the help of eq 3 taken from the literature.67
| 1 |
It is revealed from the literature that B3LYP 6-31G(d) is a good choice for electronic properties calculation. FMOs analysis is performed by using the same level of theory. The H-L gap is obtained by using eq 4.68
| 2 |
For further analyzing the nature of interactions between THTPE 3 and analytes, noncovalent interaction NCI is performed via Multiwfn software.69 Isosurfaces obtained by NCI are visualized by the visual molecular dynamics (VMD) package.63 Gnuplot 4.6.5 is used to draw the isosurfaces.70
Acknowledgments
This work was supported by the Pakistan Science Foundation (Grant No. PSF/NSFC-II/Eng/KP-COMSATS-Abt(12)).
Supporting Information Available
The Supporting Information is available free of charge at https://pubs.acs.org/doi/10.1021/acsomega.1c03439.
1H NMR, 13C NMR, and MALDI-TOF spectra of compounds (1–3); Stern–Volmer plots of probe 3 with NACs; optimized structures of NACs; complexes I and II of analytes with THTPE; complexes I and II HOMO and LUMO of X@THTPE; and NCI graph and isosurfaces of X@THTPE (PDF)
Author Contributions
Mehwish Qayyum and Tayyaba Bushra: These authors contributed equally to this work.
The authors declare no competing financial interest.
Supplementary Material
References
- Hussain E.; Li Y.; Cheng C.; Zhuo H.; Shahzad S. A.; Ali S.; Ismail M.; Qi H.; Yu C. Benzo [ghi] perylene and coronene as ratiometric fluorescence probes for the selective sensing of nitroaromatic explosives. Talanta 2019, 207, 120316. 10.1016/j.talanta.2019.120316. [DOI] [PubMed] [Google Scholar]
- Kasthuri S.; Shiv K.; Raviteja S.; Buthanapalli R.; Samarendra M.; Veeraiah N.; Venkatramaiah N. Influence of alkyl chains on fluoranthene ensembles towards fluorescence-based detection of 2,4,6-trinitrophenol. Appl. Surf. Sci. 2019, 481, 1018–1027. 10.1016/j.apsusc.2019.03.207. [DOI] [Google Scholar]
- Paul S.; Karar M.; Paul P.; Mallick A.; Majumdar T. Dual mode nitro explosive detection under crowded condition: Conceptual development of a sensing device. J. Photochem. Photobiol., A 2019, 379, 123–129. 10.1016/j.jphotochem.2019.04.038. [DOI] [Google Scholar]
- He N.; Gao M.; Shen D.; Li H.; Han Z.; Zhao P. Rapid visual detection of nitroaromatic explosives using a luminescent europium-organic framework material. Forensic Sci. Int.: Genet. 2019, 297, 1–7. 10.1016/j.forsciint.2019.01.004. [DOI] [PubMed] [Google Scholar]
- Giri D.; Islam S. N.; Patra S. K. Synthesis and characterization of 1,2,3-triazole appended polythiophene based reusable fluorescent probe for the efficient detection of trace nitroaromatics. Polymer 2018, 134, 242–253. 10.1016/j.polymer.2017.11.070. [DOI] [Google Scholar]
- Jiang K.; Luo S.-H.; Pang C.-M.; Wang B.-W.; Wu H.-Q.; Wang Z.-Y. A functionalized fluorochrome based on quinoline-benzimidazole conjugate: From facile design to highly sensitive and selective sensing for picric acid. Dyes Pigm. 2019, 162, 367–376. 10.1016/j.dyepig.2018.10.041. [DOI] [Google Scholar]
- Sun X.; Wang Y.; Lei Y. Fluorescence based explosive detection: From mechanisms to sensory materials. Chem. Soc. Rev. 2015, 44, 8019–8061. 10.1039/C5CS00496A. [DOI] [PubMed] [Google Scholar]
- Zhou C.; Han X.; Liao G.; Zhou C.; Jin P.; Guo Y.; Gao H.; Zhang Y.; Yang S.; Sun J. A fluorescent chemosensor with a hybridized local and charge transfer nature and aggregation-induced emission effect for the detection of picric acid. ChemistrySelect 2019, 4, 2868–2873. 10.1002/slct.201900294. [DOI] [Google Scholar]
- Mahendran V.; Pasumpon K.; Thimmarayaperumal S.; Thilagar P.; Shanmugam S. Tetraphenylethene–2-pyrone conjugate: Aggregation-induced emission study and explosives sensor. J. Org. Chem. 2016, 81, 3597–3602. 10.1021/acs.joc.6b00267. [DOI] [PubMed] [Google Scholar]
- Mao L.; Liu Y.; Yang S.; Li Y.; Zhang X.; Wei Y. Recent advances and progress of fluorescent bio–/chemosensors based on aggregation-induced emission molecules. Dyes Pigm. 2019, 162, 611–623. 10.1016/j.dyepig.2018.10.045. [DOI] [Google Scholar]
- (a) Luo J.; Xie Z.; Lam J. W. Y.; Cheng L.; Chen H.; Qiu C.; Kwok H. S.; Zhan X.; Liu Y.; Zhu D.; Tang B. Z.. Aggregation-induced emission of 1-methyl-1,2,3,4,5–pentaphenylsilole. Chem. Commun. , 2001, 1740–1741, 10.1039/B105159H. [DOI] [PubMed] [Google Scholar]; b Zhang G.; Hu F.; Zhang D. Manipulation of the aggregation and deaggregation of tetraphenylethylene and silole fluorophores by amphiphiles: Emission modulation and sensing applications. Langmuir 2015, 31, 4593–4604. 10.1021/la5029367. [DOI] [PubMed] [Google Scholar]; c Hong Y.; Lam J.; Tang B. Aggregation-induced emission. Chem. Soc. Rev. 2011, 40, 5361–5388. 10.1039/c1cs15113d. [DOI] [PubMed] [Google Scholar]
- Wang H.; Zhao E.; Lam J. W. Y.; Tang B. Z. AIE luminogens: Emission brightened by aggregation. Mater. Today 2015, 18, 365–377. 10.1016/j.mattod.2015.03.004. [DOI] [Google Scholar]
- a Huang W.; Bender M.; Seehafer K.; Wacker I.; Schröder R. R.; Bunz U. H. F. Novel functional TPE polymers: Aggregation-induced emission, pH response, and solvatochromic behavior. Macromol. Rapid Commun. 2019, 40, 1800774. 10.1002/marc.201800774. [DOI] [PubMed] [Google Scholar]; b Wu X.-X.; Fu H.-R.; Han M.-L.; Zhou Z.; Ma L.-F. Tetraphenylethylene immobilized metal–organic frameworks: Highly sensitive fluorescent sensor for the detection of Cr2O72– and nitroaromatic explosives. Cryst. Growth Des. 2017, 17, 6041–6048. 10.1021/acs.cgd.7b01155. [DOI] [Google Scholar]
- La D. D.; Bhosale S. V.; Jones L. A.; Bhosale S. V. Tetraphenylethylene-based AIE-active probes for sensing applications. ACS Appl. Mater. Interfaces 2017, 10, 12189–12216. 10.1021/acsami.7b12320. [DOI] [PubMed] [Google Scholar]
- Liu F.; Cui M.; Ma J.; Zou G.; Zhang Q. An optical fiber taper fluorescent probe for detection of nitro-explosives based on tetraphenylethylene with aggregation-induced emission. Opt. Fiber Technol. 2017, 36, 98–104. 10.1016/j.yofte.2017.03.004. [DOI] [Google Scholar]
- Sun N.; Su K.; Zhou Z.; Tian X.; Jianhua Z.; Chao D.; Wang D.; Lissel F.; Zhao X.; Chen C. High-performance emission/color dual-switchable polymer-bearing pendant tetraphenylethylene (TPE) and triphenylamine (TPA) moieties. Macromolecules 2019, 52, 5131–5139. 10.1021/acs.macromol.9b00079. [DOI] [Google Scholar]
- Yu Q.; Wang Y.-L.; Chen Z.-Q.; Zhao P.-J.; Fan C.; Li C.; Zhu M.-Q. Geminal cross coupling (GCC) reaction for AIE materials. Chin. J. Polym. Sci. 2019, 37, 27–339. 10.1007/s10118-019-2207-2. [DOI] [Google Scholar]
- Wu B.; Shen J.; Wang W.; Xue T.; He Y. Synthesis, characterization and visible light activated fluorescence of azo caged aggregation-induced emission polymers. Dyes Pigm. 2019, 170, 107569. 10.1016/j.dyepig.2019.107569. [DOI] [Google Scholar]
- Chen S.; Yu Y. L.; Wang J. H. Inner filter effect-based fluorescent sensing systems: A review. Anal. Chim. Acta 2018, 999, 13–26. 10.1016/j.aca.2017.10.026. [DOI] [PubMed] [Google Scholar]
- Cai Y.; Li L.; Wang Z.; Sun J. Z.; Qin A.; Tang B. Z. A sensitivity tuneable tetraphenylethene-based fluorescent probe for directly indicating the concentration of hydrogen sulfide. Chem. Commun. 2014, 50, 8892–8895. 10.1039/C4CC02844A. [DOI] [PubMed] [Google Scholar]
- Shi H.; Kwok R. T. K.; Liu J.; Xing B.; Tang B. Z.; Liu B. Real-time monitoring of cell apoptosis and drug screening using fluorescent light-up probe with aggregation-induced emission characteristics. J. Am. Chem. Soc. 2012, 134, 17972–17981. 10.1021/ja3064588. [DOI] [PubMed] [Google Scholar]
- Yui G.; Yin S.; Liu Y.; Chen J.; Xu X.; Sun X.; Ma D.; Zhan X.; Peng Q.; Shuai Z.; Tang B. Z.; Zhu D.; Fang W.; Luo Y. Structures, electronic states, photoluminescence, and carrier transport properties of 1,1-disubstituted 2,3,4,5-tetraphenylsiloles. J. Am. Chem. Soc. 2005, 127, 6335. 10.1021/ja044628b. [DOI] [PubMed] [Google Scholar]
- Hu R.; Leung N. L. C.; Tang B. Z. AIE macromolecules: syntheses, structures and functionalities. Chem. Soc. Rev. 2014, 43, 4494–4562. 10.1039/C4CS00044G. [DOI] [PubMed] [Google Scholar]
- Wang J. H.; Feng H. T.; Zheng Y. S. Synthesis of tetraphenylethylene pillar[6]arenes and the selective fast quenching of their AIE fluorescence by TNT. Chem. Commun. 2014, 50, 11407–11410. 10.1039/C4CC05189K. [DOI] [PubMed] [Google Scholar]
- Chen P.; Zhu H.; Kong L.; Tian Y.; Yang J. Effect of solid-state packing on the photophysical properties of two novel carbazole derivatives containing tetraphenylethylene and cyano groups. J. Lumin. 2019, 212, 212–218. 10.1016/j.jlumin.2019.03.041. [DOI] [Google Scholar]
- Tian G.; Huang W.; Cai S.; Zhou H.; Li B.; Wang Q.; Su J. Small molecules based on diphenylamine and carbazole with large two-photon absorption cross sections and extraordinary AIEE properties. RSC Adv. 2014, 4, 38939–38942. 10.1039/C4RA06314G. [DOI] [Google Scholar]
- Zhou H.; Huang W.; Ding L.; Cai S.; Li X.; Li B.; Su J. New cyano-substituted organic dyes containing different electrophilic groups: Aggregation-induced emission and large two-photon absorption cross section. Tetrahedron 2014, 70, 7050–7056. 10.1016/j.tet.2014.05.016. [DOI] [Google Scholar]
- Huang Y.; Hu F.; Zhao R.; Zhang G.; Yang H.; Zhang D. Tetraphenylethylene conjugated with a specific peptide as a fluorescence turn-on bioprobe for the highly specific detection and tracing of tumor markers in live cancer cells. Chem. – Eur. J. 2014, 20, 158–164. 10.1002/chem.201303679. [DOI] [PubMed] [Google Scholar]
- Lou X.; Zhang M.; Zhao Z.; Min X.; Hakeem A.; Huang F.; Gao P.; Xia F.; Tang B. Z. A photostable AIE fluorogen for lysosome-targetable imaging of living cells. J. Mater. Chem. B 2016, 4, 5412–5417. 10.1039/C6TB01293K. [DOI] [PubMed] [Google Scholar]
- Wu W.; Feng G.; Xu S.; Liu B. A photostable far-red/near-infrared conjugated polymer photosensitizer with aggregation-induced emission for image-guided cancer cell ablation. Macromolecules 2016, 49, 5017–5025. 10.1021/acs.macromol.6b00958. [DOI] [Google Scholar]
- Tran T.; Prlj A.; Lin K. H.; Hollas D.; Corminboeuf C. Mechanisms of fluorescence quenching in prototypical aggregation-induced emission systems: excited state dynamics with TD-DFTB. Phys. Chem. Chem. Phys. 2019, 21, 9026–9035. 10.1039/C9CP00691E. [DOI] [PubMed] [Google Scholar]
- Goodpaster J. V.; McGuffin V. L. Fluorescence quenching as an indirect detection method for nitrated explosives. Anal. Chem. 2001, 73, 2004–2011. 10.1021/ac001347n. [DOI] [PubMed] [Google Scholar]
- Meaney M. S.; McGuffin V. L. Investigation of common fluorophores for the detection of nitrated explosives by fluorescence quenching. Anal. Chim. Acta 2008, 610, 57–67. 10.1016/j.aca.2008.01.016. [DOI] [PubMed] [Google Scholar]
- Namgung H.; Lee J. J.; Gwon Y. J.; Lee T. S. Synthesis of tetraphenylethylene-based conjugated microporous polymers for detection of nitroaromatic explosive compounds. RSC Adv. 2018, 8, 34291–34296. 10.1039/C8RA06463F. [DOI] [PMC free article] [PubMed] [Google Scholar]
- Peng Q.; Yi Y.; Shuai Z.; Shao J. Toward Quantitative Prediction of Molecular Fluorescence Quantum Efficiency: Role of Duschinsky Rotation. J. Am. Chem. Soc. 2007, 129, 9333. 10.1021/ja067946e. [DOI] [PubMed] [Google Scholar]
- Yuan H.; Li D.; Liu Y.; Xu X.; Xiong C. Nitrogen-doped carbon dots from plant cytoplasm as selective and sensitive fluorescent probes for detecting p-nitroaniline in both aqueous and soil systems. Analyst 2015, 140, 1428–1431. 10.1039/C4AN01869A. [DOI] [PubMed] [Google Scholar]
- Yu Z.; Wang F.; Lin X.; Wang C.; Fu Y.; Wang X.; Li G. Selective fluorescence sensors for detection of nitroaniline and metal Ions based on ligand-based luminescent metal-organic frameworks. J. Solid State Chem. 2015, 232, 96–101. 10.1016/j.jssc.2015.09.010. [DOI] [Google Scholar]
- Ju Z.; Yan W.; Gao X.; Shi Z.; Wang T.; Zheng H. Synthesis, characterization, and luminescence properties of four metal–organic frameworks based on a linear-shaped rigid pyridine ligand. Cryst. Growth Des. 2016, 16, 2496–2503. 10.1021/acs.cgd.5b00681. [DOI] [Google Scholar]
- Rahman M.; Harmon H. J. Absorbance change and static quenching of fluorescence of meso-tetra(4-sulfonatophenyl)porphyrin (TPPS) by trinitrotoluene (TNT). Spectrochim. Acta, Part A 2006, 65, 901–906. 10.1016/j.saa.2006.01.029. [DOI] [PubMed] [Google Scholar]
- Parrott E. P. J.; Tan N. Y.; Hu R.; Zeitler J. A.; Tang B. Z.; Pickwell-MacPherson E. Direct evidence to support the restriction of intramolecular rotation hypothesis for the mechanism of aggregation-induced emission: Temperature resolved terahertz spectra of tetraphenylethene. Mater. Horiz. 2014, 1, 251. 10.1039/C3MH00078H. [DOI] [Google Scholar]
- Koppal V. V.; Melavanki R. M.; Kusanur R. A.; Patil N. R. Bimolecular fluorescence quenching reactions of the biologically active coumarin composite 2-acetyl-3H-benzo[f]chromen-3-one in different solvents. Luminescence 2018, 33, 1019–1025. 10.1002/bio.3502. [DOI] [PubMed] [Google Scholar]
- Zhang C.; Yan Y.; Pan Q.; Sun L.; He H.; Liu Y.; Liang Z.; Li J. Microporous lanthanum metal–organic framework as a bi-functional chemoprobe for the detection of picric acid and Fe3+ ions. Dalton Trans. 2015, 44, 13340–13346. 10.1039/C5DT01065A. [DOI] [PubMed] [Google Scholar]
- Deshmukh A.; Bandyopadhyay S.; James A.; Patra A. Trace level detection of nitroanilines using a solution processable fluorescent porous organic polymer. J. Mater. Chem. C 2016, 4, 4427–4433. 10.1039/C6TC00599C. [DOI] [Google Scholar]
- Lakowicz J. R.Principles of Fluorescence Spectroscopy; Springer: New York, 2006. [Google Scholar]
- Valeur B.; Berberan-Santos M. N.. Molecular Fluorescence: Principles and Applications. Wiley-VCH, Weinheim, 2012, 10.1002/9783527650002. [DOI] [Google Scholar]
- Liu J.; Zhong Y.; Lu P.; Hong Y.; Lam J. W. Y.; Faisal M.; Yu Y.; Wong K. S.; Tang B. Z. A superamplification effect in the detection of explosives by a fluorescent hyperbranched poly(silylenephenylene) with aggregation-enhanced emission characteristics. Polym. Chem. 2010, 1, 426–429. 10.1039/C0PY00046A. [DOI] [Google Scholar]
- Song X. Z.; Song S. Y.; Zhao S. N.; Hao Z. M.; Zhu M.; Meng X.; Wu L. L.; Zhang H. J. Single-Crystal-to-Single-Crystal Transformation of a Europium(III) Metal–Organic Framework Producing a Multi-responsive Luminescent Sensor. Adv. Funct. Mater. 2014, 24, 4034–4041. 10.1002/adfm.201303986. [DOI] [Google Scholar]
- Kavarnos G. J.; Turro N. J. Photosensitization by reversible electron transfer: Theories, experimental evidence, and examples. Chem. Rev. 1986, 86, 401–449. 10.1021/cr00072a005. [DOI] [Google Scholar]
- Dong W.; Ma Z.; Chen P.; Duan Q. Carbazole and tetraphenylethylene based AIE-active conjugated polymer for highly sensitive TNT detection. Mater. Lett. 2019, 236, 480–482. 10.1016/j.matlet.2018.10.162. [DOI] [Google Scholar]
- Zhou R. S.; Lin Z. Z.; Xin L. D.; Song J. F.; Liu H.; Guo Z. Naked eye colorimetric multifunctional sensing of nitrobenzene, Cr(VI) and Fe(III) with a new green emission Ag6S6 multi-metal-cluster. Adv. Compos. Hybrid Mater. 2018, 1, 785–796. 10.1007/s42114-018-0061-2. [DOI] [Google Scholar]
- Zhang H. J.; Tian Y.; Tao F. R.; Yu W.; You K. Y.; Zhou L. R.; Su X.; Li T. D.; Cui Y. Z. Detection of nitroaromatics based on aggregation induced emission of barbituric acid derivatives. Spectrochim. Acta, Part A 2019, 222, 117168. 10.1016/j.saa.2019.117168. [DOI] [PubMed] [Google Scholar]
- Wu Y.-W.; Qin A.-J.; Tang B. Z. AIE-active polymers for explosive detection. Chin. J. Polym. Sci. 2017, 2, 141–154. 10.1007/s10118-017-1882-0. [DOI] [Google Scholar]
- Petersson G. A.; Malick D. K.; Wilson W. G.; Ochterski J. W.; Montgomery J. A. Jr.; Frisch M. J. Calibration and comparison of the Gaussian-2, complete basis set, and density functional methods for computational thermochemistry. J. Chem. Phys. 1998, 109, 10570–10579. 10.1063/1.477794. [DOI] [Google Scholar]
- Montgomery J. A. Jr.; Frisch M. J.; Ochterski J. W.; Petersson G. A. A complete basis set model chemistry. VI. Use of density functional geometries and frequencies. J. Chem. Phys. 1999, 110, 2822–2827. 10.1063/1.477924. [DOI] [Google Scholar]
- Kurtay G.; Soganci T.; Sarikavak K.; Ak M.; Güllü M. Synthesis and electrochemical characterization of a new benzodioxocine-fused poly(N-methylpyrrole) derivative: a joint experimental and DFT study. New J. Chem. 2020, 44, 18929–18941. 10.1039/D0NJ03992F. [DOI] [Google Scholar]
- Ashraf A.; Carter-Fenk K.; Herbert J. M.; Farooqi B. A.; Farooq U.; Ayub K. Interaction of graphene quantum dots with oligothiophene: A comprehensive theoretical study. J. Phys. Chem. C 2019, 123, 29556–29570. 10.1021/acs.jpcc.9b08090. [DOI] [Google Scholar]
- Sajid H.; Ullah F.; Ayub K.; Mahmood T. Cyclic versus straight chain oligofuran as sensor: A detailed DFT study. J. Mol. Graphics Modell. 2020, 97, 107569. 10.1016/j.jmgm.2020.107569. [DOI] [PubMed] [Google Scholar]
- Kashyap C.; Ullah S. S.; Mazumder L. J.; Guha A. K. Non-covalent interaction in benzene and substituted benzene: A theoretical study. Comput. Theor. Chem. 2018, 1130, 134–139. 10.1016/j.comptc.2018.03.023. [DOI] [Google Scholar]
- Li Q.; Zhu H.; Zhuo H.; Yang X.; Li W.; Cheng J. Complexes between hypohalous acids and phosphine derivatives. Pnicogen bond versus halogen bond versus hydrogen bond. Spectrochim. Acta, Part A 2014, 132, 271–277. 10.1016/j.saa.2014.05.001. [DOI] [PubMed] [Google Scholar]
- Sahu D.; Jana K.; Ganguly B. The role of non-covalent interaction for the adsorption of CO2 and hydrocarbons with per-hydroxylated pillar [6] arene: A computational study. New J. Chem. 2017, 41, 12044–12051. 10.1039/C7NJ01744H. [DOI] [Google Scholar]
- Ghogomu J.; Nkungli N. DFT studies and topological analyses of electron density on acetophenone and propiophenone thiosemicarbazone derivatives as covalent inhibitors of falcipain-2, a major plasmodium falciparum cysteine protease. Phys. Chem. Res. 2017, 5, 795–817. 10.22036/pcr.2017.83153.1370. [DOI] [Google Scholar]
- Otero-De-La-Roza A.; Johnson E. R.; Contreras-García J. Revealing non-covalent interactions in solids: NCI plots revisited. Phys. Chem. Chem. Phys. 2012, 14, 12165–12172. 10.1039/c2cp41395g. [DOI] [PubMed] [Google Scholar]
- Contreras-García J.; Johnson E. R.; Keinan S.; Chaudret R.; Piquemal J. P.; Beratan D. N.; Yang W. NCIPLOT: A program for plotting noncovalent interaction regions. J. Chem. Theory Comput. 2011, 7, 625–632. 10.1021/ct100641a. [DOI] [PMC free article] [PubMed] [Google Scholar]
- Frisch M. J.; Trucks G. W.; Schlegel H. B.; Scuseria G. H.; Robb M. A.; Cheeseman J. R.; Fox D. J.; Gaussian 09, Revision D. 01(2009) Gaussian. Inc; Wallingford CT. [Google Scholar]
- Dennington R.; Keith T.; Millam J., Version 5 (2009) Semichem Inc.: Shawnee Mission, KS, USA. [Google Scholar]
- a Hu W.; Xia N.; Wu X.; Li Z.; Yang J. Silicene as a highly sensitive molecule sensor for NH3, NO and NO2. Phys. Chem. Chem. Phys. 2014, 16, 6957–6962. 10.1039/c3cp55250k. [DOI] [PubMed] [Google Scholar]; b Rad A. S.; Ayub K. Adsorption of pyrrole on Al12N12, Al12P12, B12N12, and B12P12 fullerene-like nano-cages; a first principles study. Vacuum 2016, 131, 135–141. 10.1016/j.vacuum.2016.06.012. [DOI] [Google Scholar]
- a Peyghan A. A.; Rastegar S. F.; Hadipour N. L. DFT study of NH3 adsorption on pristine, Ni-and Si-doped graphynes. Phys. Lett. A 2014, 378, 2184–2190. 10.1016/j.physleta.2014.05.016. [DOI] [Google Scholar]; b Rad A. S.; Ayub K. Adsorption of thiophene on the surfaces of X12Y12 (X= Al, B, and Y= N, P) nanoclusters; A DFT study. J. Mol. Liq. 2017, 238, 303–309. 10.1016/j.molliq.2017.05.020. [DOI] [Google Scholar]
- Lu T.; Chen F. Multiwfn: A multifunctional wavefunction analyzer. J. Comput. Chem. 2012, 33, 580–592. 10.1002/jcc.22885. [DOI] [PubMed] [Google Scholar]
- Humphrey W.; Dalke A.; Schulten K. VMD: Visual molecular dynamics. J. Mol. Graphics 1996, 14, 33–38. 10.1016/0263-7855(96)00018-5. [DOI] [PubMed] [Google Scholar]
- Nagarajan V.; Chandiramouli R. A novel approach for detection of NO2 and SO2 gas molecules using graphane nanosheet and nanotubes-A density functional application. Diamond Relat. Mater. 2018, 85, 53–62. 10.1016/j.diamond.2018.03.028. [DOI] [Google Scholar]
Associated Data
This section collects any data citations, data availability statements, or supplementary materials included in this article.