Abstract
Ethanol is usually combined with gasoline to manufacture ethanol–gasoline with excellent combustion characteristics. However, extracting water from hydrous ethanol to manufacture anhydrous ethanol consumed much energy, which increases the production cost of ethanol–gasoline. Many researchers have studied the combustion and emissions of hydrous ethanol–gasoline to explore the application of hydrous ethanol–gasoline as the fuel for spark-ignition engines. Most previous studies changed the hydrous ethanol ratio with fixed purity in hydrous ethanol–gasoline to study the effects of hydrous ethanol. Different from previous studies, this paper studied the effects of water ratio (Wr) in hydrous ethanol on the combustion and emissions of a hydrous ethanol/gasoline combined injection engine under different excess air ratio (λ) values. The ratios of ethanol and gasoline keep constant, while the purity of hydrous ethanol changes during the research. The experiment adopted the combined injection mode with hydrous ethanol direct injection plus gasoline port injection; the direct injection ratio was 20%. The experiment set three λ (0.9, 1, and 1.2) and five Wrs (0, 5, 10, 15, and 20%). The test engine’s speed was 1500 rpm, and the intake manifold absolute pressure was 48 kPa. Results showed that water inhibited combustion, prolonged CA 0-10 and CA 10-90, reduced Pmax and Tmax, and delayed APmax; larger λ made the deterioration on combustion more obvious, and the smaller λ had a larger tolerance to water. Water could increase torque and improve emissions, but different parameters corresponded to different optimal Wrs. For torque, the optimal Wr was 5%. For HC emissions, the optimal Wr was 0%; for CO emissions, the optimal value was 5%; and for NOx emissions, the best value was 20%. The best Wr was 10% for particle number (PN) emissions. Under the optimal Wr condition, when λ values were 0.9, 1, and 1.2, compared with pure gasoline, the torque increased by 7.5, 5.54, and 5.31%; HC emissions decreased by 21.37, 23.43, and 26.58%; NOx emissions decreased by 4.26, 11.47, and 12.55%; CO emissions decreased by 17.51, 34.56, −50%; and the total PN emissions decreased by 87.64, 89.64, and 76.07%.
1. Introduction
Although the number of new energy vehicles increases quickly, it is still far smaller than traditional power vehicles. As the power source of traditional power vehicles, internal combustion engines consume a lot of fossil energy.1 The massive consumption of fossil energy brings an energy crisis, and its combustion causes severe pollution and destruction to the environment.2 Therefore, looking for clean and renewable alternative fuels is one of the effective ways to alleviate the energy crisis and the pollution problem.3,4
Compared with hydrogen and natural gas, alcohol fuels with a higher volumetric density are easier and safer to store.5,6 Meanwhile, alcohol fuels have mature production technology and a wide range of raw materials.7 Thus, alcohol fuels are suitable as an alternative energy for engines.8 Ethanol is more suitable as an alternative fuel for spark-ignition (SI) engines because it has lower toxicity than methanol, lower production cost, and better evaporation characteristics and combustion characteristics than butanol.9 SI engines use ethanol as an alternative fuel in three main ways: the first is that SI engines directly use ethanol as the fuel; the second is that ethanol mixes with gasoline to form ethanol–gasoline blends, and SI engines use the blends as fuels; and the last one is that ethanol and gasoline are injected independently into the engine’s cylinder under the combined injection mode.10
Experimental results have confirmed that SI engines using pure ethanol as the fuel can achieve better performance. Lee et al. found that the test SI engine fueled with pure ethanol could reduce the knock tendency, improve the operating stability, and get a better combustion phase than that fueled with gasoline.11 Lee et al. and Balki and Sayin found that using ethanol on the test engine increased the volume efficiency and improved the combustion efficiency and brake mean effective pressure. Meanwhile, the coefficient of variation (COV) of the test engine fueled with pure ethanol decreased in the experiment of Lee et al.12,13 In another experiment of Balki and Sayin, the experimental results showed that using pure ethanol instead of gasoline could decrease HC, CO, and NOx emissions. Balki and Sayin found that the improvements brought by pure ethanol would be more obvious under high-speed operating conditions than low-speed operating conditions.14 In addition to harmful emissions, ethanol also reduced the CO2 greenhouse gas compared to gasoline, mitigating the greenhouse effect.15 Although SI engines using pure ethanol as the fuel could have a better performance, the large vaporization heat and low vapor pressure of ethanol made SI engines fueled with pure ethanol have poor cold-start performance and even fail to start when the environment temperature is extremely low.16−18
To solve the cold-start problem of pure ethanol SI engines, researchers used ethanol–gasoline blends as the fuel of SI engines. According to the experimental results of Al-Hasan and Yücesu et al., ethanol–gasoline blends could improve the torque and power of SI engines and get better thermal efficiency.19,20 Balla et al. found that the increase of ethanol in ethanol–gasoline blends would increase the antiknock property of blends, and E40 had a higher thermal efficiency than gasoline and pure ethanol.21 In another research by Yücesu et al., they found that ethanol–gasoline blends could reduce CO, HC, and NOx emissions from SI engines.22 Stein et al. investigated the unregulated emissions of ethanol–gasoline blends. They indicated that the use of ethanol–gasoline blends would decrease the emissions of 1,3-butadiene and benzene but lead to a rise in formaldehyde and acetaldehyde emissions; meanwhile, the particle emissions decreased when the ethanol ratio increased in ethanol–gasoline blends.23 In the research of Astorga et al., they concluded that the ethanol–gasoline blends with a high ethanol ratio helped to reduce methylbenzene and ammonia.24 SI engines can obtain better performance by using ethanol–gasoline blends. The ethanol ratio is fixed in blends, but the optimal ethanol ratio is different under different operating conditions.25 To solve the problem, ethanol/gasoline dual fuels should be injected into the cylinder under the combined injection mode with two independent injection systems instead of premixed ethanol–gasoline blends.
Previous studies have shown that ethanol direct injection (EDI) + gasoline port injection (GPI) can achieve higher efficiency than other injection modes because EDI can better use the enthalpy of ethanol vaporization.26,27 The research of Huang et al. indicated that the high flame speed of ethanol made SI engines get a higher thermal efficiency under the EDI + GPI injection mode.28 In another research, Huang et al. investigated the effects of EDI + GPI on emissions and power performance. The results showed that a larger ethanol ratio would increase CO and HC emissions and decrease NOx emissions. The indicated mean effective pressure (IMEP) increased when the ethanol ratio was not beyond 58%.29 Zhuang et al. found that EDI suppressed the knock tendency of SI engines, and the suppression effect was more significant when the injection timing of EDI became late.30,31 Other research showed that a later injection timing would lead to the combustion deterioration and the rise of CO and HC emissions, but a small EDI ratio and EDI heating technology would solve these problems.32,33
The above studies indicated that the application of ethanol in SI engines could improve the power and emission characteristics. However, fuel ethanol is usually made by fermentation, and the process of obtaining anhydrous ethanol from the fermentation broth consumes a lot of energy, which increases the production cost.34−36 The rise in the cost of storage and transportation of anhydrous ethanol helps avoid the pollution of water in air.37 Many researchers investigated the combustion and emission characteristics of hydrous ethanol. Augoye and Aleiferis investigated the effects of water in ethanol on the engine’s combustion. They found that the larger water content in ethanol decreased both the maximum cylinder pressure and the combustion rate, and E90W10 had a similar maximum cylinder pressure to gasoline.38 Gonzalez et al. found that the engine fueled with hydrous ethanol–gasoline blends had higher IMEP and power output than fueled with anhydrous ethanol–gasoline blends.39 For emissions, the experimental results of Kyriakides et al. revealed that E40h had lower HC, CO, and NOx emissions compared with E40 and E0.37 Ramesh et al. studied the performance of the test SI engine fueled with hydrous ethanol–gasoline blends and gasoline; their results showed that under lean-burn conditions, hydrous ethanol–gasoline blends had a higher IMEP and a smaller COV than gasoline.41
However, most previous studies studied the effects of hydrous ethanol with fixed purity on the combustion of hydrous ethanol–gasoline blends and ignored the effects of water ratio (Wr) in hydrous ethanol on the hydrous ethanol–gasoline when the proportions of ethanol and gasoline were fixed. Therefore, in this experiment, three excess air ratio (λ) values (0.9, 1, and 1.2) and five Wrs (0, 5, 10, 15, and 20%) were set to investigate the effects of Wr in hydrous ethanol on combustion and emissions of a hydrous ethanol/gasoline combined injection engine under different λ.
2. Results and Discussion
2.1. Flame Development Duration and Flame Propagation Duration
CA 0-10 is the duration of CA from ignition to 10% of the fuel’s energy released in the cylinder, which means the flame development duration in this research. Figure 1a shows the effects of Wr on CA 0-10 under different λ values. The results showed that the flame development duration increased with the increase of λ. An increase in λ means that the mixture became leaner; the leaner mixture was bad for forming the flame core and proceeding the chain reaction; the unstable flame core and chain reaction increased the flame development duration. Water addition is also detrimental to flame development. The increase of Wr at all λ values would significantly prolong the flame development duration, and the effects of Wr on the flame development duration would be more obvious when λ became larger. When λ values were 0.9, 1, and 1.2, compared with anhydrous gasoline–ethanol, 20% Wr could delay the flame development duration by 2.78, 3.42, and 3.71°CA, respectively. On the one hand, water has a large vaporization heat. Water addition reduced the cylinder temperature; the lower temperature prolonged the flame development duration. On the other hand, water diluted the reactants’ concentration around the spark plug, which is detrimental to the flame core and chain reaction formation. A leaner mixture made the flame core more unstable and the chain reaction more difficult to proceed with. Therefore, the inhibitory effects of water on the flame development duration were more obvious when λ became larger.
Figure 1.
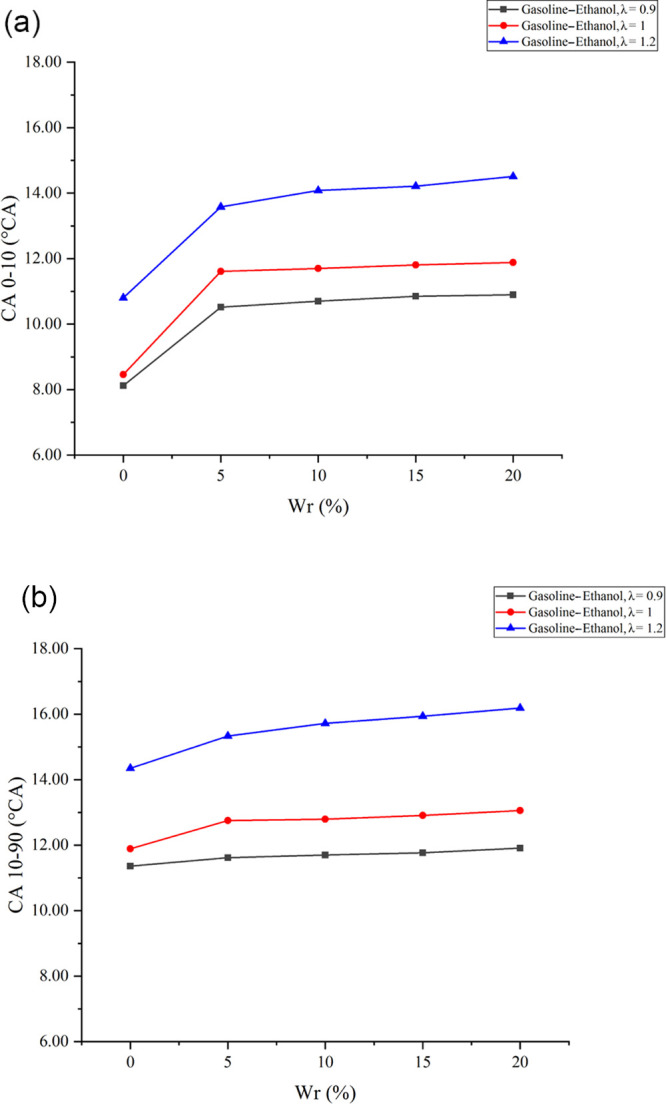
(a) Effects of Wr on CA 0-10 under different λ values. (b) Effects of Wr on CA 10-90 under different λ values.
CA 10-90 is the duration of CA from 10 to 90% of the fuel’s energy released in the cylinder, which means the flame propagation duration in this research. Figure 1b shows the effects of Wr on CA 10-90 under different λ values. The results showed that the flame propagation duration extended as λ increased. When λ was 0.9, the further increase of λ would decrease both the flame temperature and the fuel mass in the cylinder. The lower flame temperature and reactants’ concentration reduced the combustion rate, which was not conducive to flame propagation. The experimental results showed that water had significant inhibitory effects on the flame propagation, especially at larger λ values. When λ values were 0.9, 1, and 1.2, 20% Wr increased the flame propagation duration by 0.55, 1.17, and 1.84°CA, respectively. The water existence diluted the reactants’ concentration, which reduced the chemical reaction rate, and water had a large vaporization heat and specific heat capacity, leading to the reduction in the flame temperature, reducing the flame propagation speed and extending the flame propagation duration. Meanwhile, water inhibited the thermal expansion rate of the laminar flame and increased the flame thickness and the laminar flame stability, which is not conducive to the conversion of the laminar flame into the turbulent flame, further decreasing the flame propagation speed. When λ became larger, the mixture became leaner and the flame temperature decreased, leading to poor combustion stability. Therefore, the inhibition effects of water were more obvious when λ became larger.
2.2. Tmax
Tmax is the maximum average temperature in the cylinder, and the average temperature in the cylinder is computed by the combustion analyzer according to the cylinder pressure signal. Figure 2 shows the effects of Wr on Tmax under different λ values. As shown in Figure 2, Tmax decreased when λ increased. With the increase of λ, the mixture became leaner, and the leaner mixture resulted in a lower flame temperature and a slower combustion rate, which resulted in a lower Tmax. The results also showed that hydrous ethanol affected Tmax distinctly. Tmax decreased when Wr became larger, and the effects of water were greater at a larger λ. At the λ values of 0.9, 1, and 1.2, compared with anhydrous gasoline–ethanol, 20% Wr reduced Tmax by 24, 46, and 54 K, respectively. The water presence diluted the reactants’ concentration in the flame, reduced the chemical reaction rate, and lowered the flame temperature, which reduced the heating effect of the flame in the cylinder and reduced Tmax. Meanwhile, water had a large vaporization heat; the water vaporization reduced the cylinder temperature. More water brought more dilution and thermal effects, leading to more significant influences on Tmax. The flame temperature and the chemical reaction rate in the cylinder would decrease when the mixture became leaner, making the dilution and thermal effects of water more obvious. Therefore, the effects of water on Tmax were more significant at a larger λ.
Figure 2.
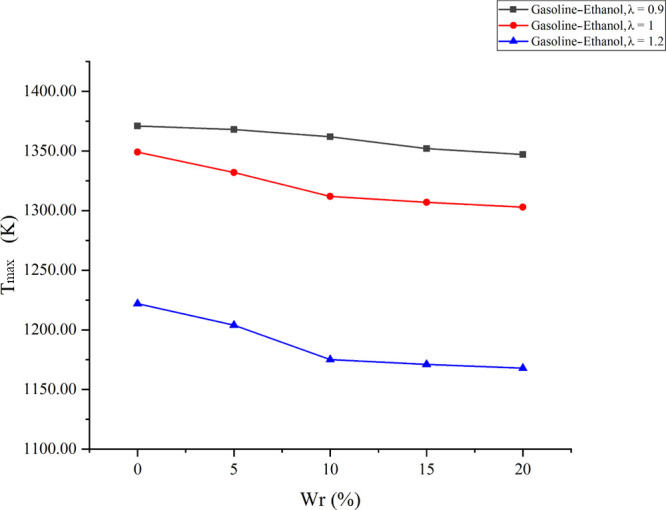
Effects of Wr on Tmax under different λ values.
2.3. Cylinder Pressure
Figure 3 shows the cylinder pressure versus CA at different λ values under various Wrs; Figure 4 shows the effects of Wr on Pmax under different λ values; and Figure 5 shows the effects of Wr on APmax under different λ values. The results showed that larger λ values flattened the cylinder pressure curve, reduced Pmax, and delayed APmax. The reason was that the leaner mixture prolonged the combustion duration and reduced the flame propagation speed and the cylinder temperature. Meanwhile, fewer fuels also reduced the total energy in the cylinder. Similarly, when Wr increased, the cylinder pressure curve became flat, Pmax decreased, and APmax delayed. The reason was that the effect of water on combustion in the cylinder is similar to that of λ. Moreover, the effects of water on the cylinder pressure became obvious as λ increased. When λ values were 0.9, 1, and 1.2, compared with anhydrous gasoline–ethanol, 20% Wr decreased Pmax by 1.6, 2.54, and 3.42 bar and delayed APmax by 3, 4, and 5°CA before top dead center (BTDC), respectively. The above analysis showed that water has inhibitory effects on combustion in the cylinder, and larger λ would lead to the deterioration of temperature conditions and combustion conditions in the cylinder. Therefore, the inhibitory effects were more significant when λ increased. However, APmax did not increase with Wr changing from 5 to 20% at all test λ values because the minimum step size of the combustion analyzer was 1 °CA when calculating the cylinder pressure curve. The influence of Wr on APmax was less than 1 °CA; thus, the small influence could not be found in the experimental results.
Figure 3.
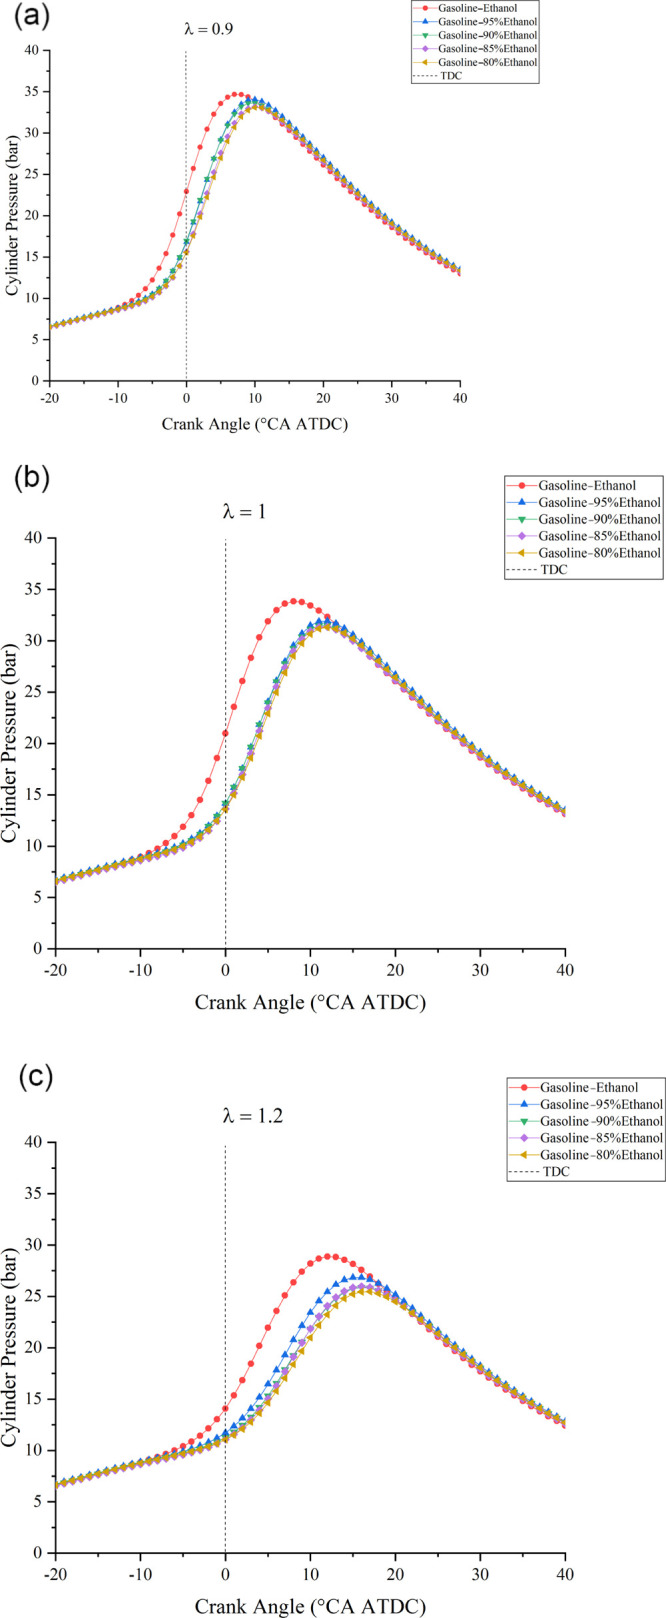
(a) Cylinder pressure vs CA at the λ of 0.9 under various Wrs. (b) Cylinder pressure vs CA at the λ of 1 under various Wrs. (c) Cylinder pressure vs CA at the λ of 1.2 under various Wrs.
Figure 4.
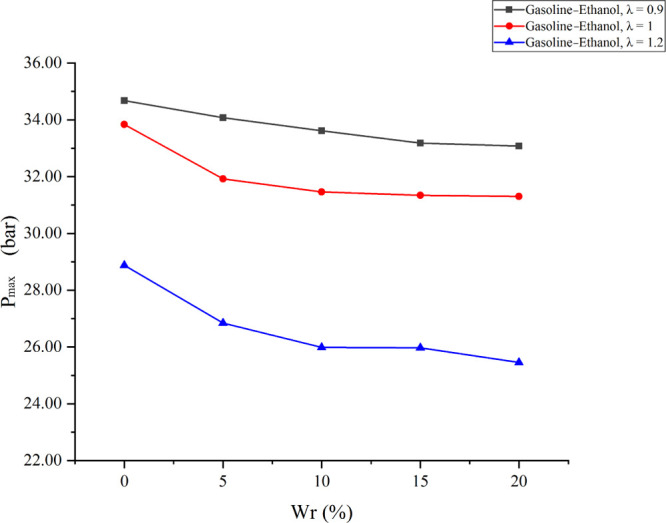
Effects of Wr on Pmax under different λ values.
Figure 5.
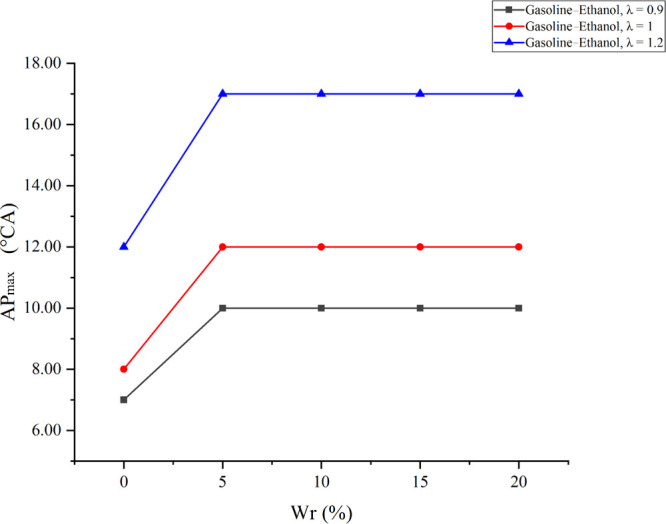
Effects of Wr on APmax under different λ values.
2.4. Torque
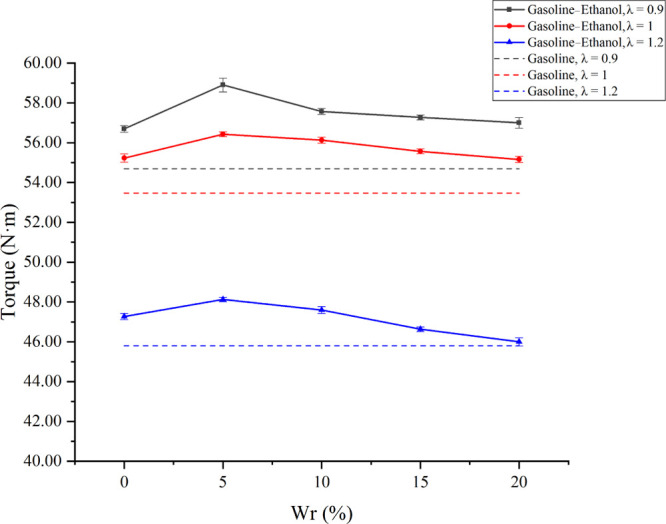
Figure 6 shows the effects of Wr on torque under different λ values. The results showed that torque decreased as λ increased. The reason was that a leaner mixture made the total amount of fuels in the cylinder decrease, resulting in a lower torque. When adding ethanol into the cylinder, the torque increased compared with pure gasoline, which was similar to the experimental results of Yusuf and Inambao.42 However, torque increased first and then decreased with the increase of Wr; the test engine obtained the maximum torque when Wr was 5% at all test λ values. The improvements of water on torque became smaller when λ increased. When Wr was 5% and λ varied from 0.9 to 1.2, the torque increased by 3.90, 2.21, and 1.82% compared with anhydrous gasoline–ethanol, and the values were 7.50, 5.54, and 5.31% compared with pure gasoline. Water has two main effects on torque. On the one hand, water has a large vaporization heat; thus, the water addition could reduce the cylinder temperature during the compression process, reducing the negative compression work. Meanwhile, water reduced the flame temperature. Lower flame temperature reduced the heat taken away by the cooling water, which reduced the heat loss. These factors could increase the torque. On the other hand, water had inhibitory effects on the combustion in the cylinder, slowed the flame propagation, prolonged the combustion duration, and reduced the constant-volume combustion and heat–work conversion efficiency, reducing the test engine’s torque. When Wr was less than 5%, the improvements on the negative compression work and heat loss were more significant than the inhibitory effects. Therefore, when Wr changed from 0 to 5%, the torque increased. However, when Wr was larger than 5%, a further increase in Wr brought obvious inhibitory effects on combustion, resulting in combustion deterioration and torque reduction.
Figure 6.
Effects of Wr on torque under different λ values.
2.5. HC Emissions
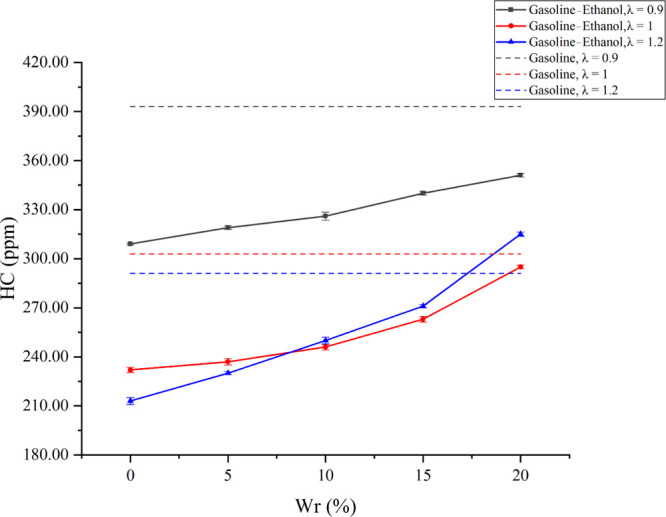
Figure 7 shows the effects of Wr on HC emissions under different λ values. HC emissions mainly come from the incomplete combustion of fuels. The experimental results showed that the HC emissions of pure gasoline and gasoline–ethanol under different λ values were different. With the increase of λ, the HC emissions of pure gasoline and the gasoline–ethanol fuels with Wr less than 10% decreased. However, the HC emissions of the gasoline–ethanol fuels with Wr larger than 10% first rose and then dropped. Larger λ reduced the fuels in the cylinder, increased the cylinder’s oxygen concentration, and lowered the temperature in the cylinder. Gasoline entered the cylinder by port injection. Fewer fuels and complete combustion due to excessive oxygen resulted in lower HC emissions. Water has deterioration effects on HC emissions; with the increase of Wr, HC emissions rose. Besides, the deterioration effects became more obvious as λ increased. When λ values were 0.9, 1, and 1.2, compared with anhydrous ethanol, 20% Wr increased HC emissions by 13.59, 27.16, and 46%, respectively; compared with pure gasoline, HC emissions decreased by 10.69, 2.64, and −8.25%, respectively. Gasoline–ethanol fuels are oxygenated fuels, so HC emissions decreased when the test engine was fueled with gasoline–ethanol fuels instead of pure gasoline until the strong deterioration effects on combustion from the water addition appeared. The air–fuel ratio (AFR) of ethanol decreased with the increase of Wr, which further led to the increase of the injection pulse width. Longer injection pulse width enlarged the local over-rich mixture zone in the cylinder. The water presence diluted the concentration of fuels and oxygen in the reaction zone and reduced the flame temperature. Lower concentration and flame temperature were not conducive to the oxidation reaction between fuels and oxygen. Meanwhile, water increased the thickness of the wall quenching layer and intensified the slit effects, which would increase HC emissions.43 Therefore, HC emissions increased as Wr increased. With the increase of λ, the flame temperature decreased, and the combustion stability deteriorated; thus, the inhibitory effects of water on combustion became more significant. Therefore, the deterioration of HC emissions was more obvious under a larger λ. It was worth noting that the deterioration on HC emissions was greater than the improvements of excessive oxygen on HC emissions at a Wr beyond 10% when λ was 1.2. Thus, the HC emissions of gasoline–ethanol fuels with a Wr beyond 10% were higher than those of 1 when λ was 1.2.
Figure 7.
Effects of Wr on HC emissions under different λ values.
2.6. CO Emissions
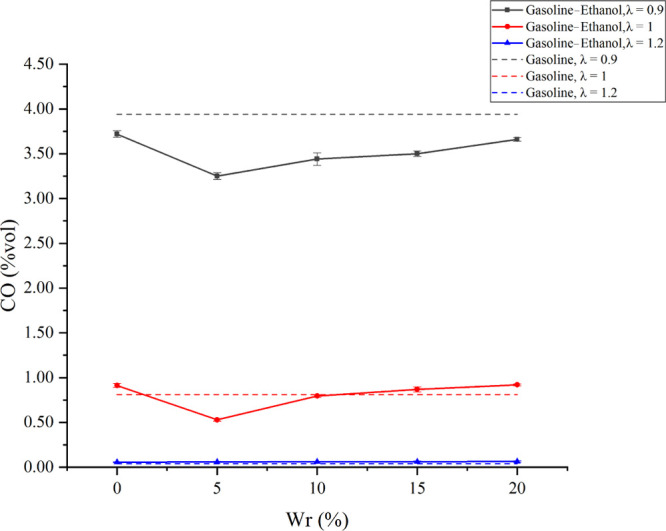
Figure 8 shows the effects of Wr on CO emissions under different λ values. CO emissions decreased as λ increased. CO is generated when fuels lack oxygen during combustion. A larger λ means a rise in the relative oxygen content in the cylinder; the excessive oxygen significantly promoted the oxidation of CO and reduced CO emissions. The experimental results showed that the variation of CO emissions with Wr was different under different λ values. When λ values were 0.9 and 1, CO emissions decreased first and then increased as Wr rose. When Wr was 5%, CO emissions were the lowest; compared with anhydrous gasoline–ethanol, CO emissions decreased by 12.63 and 41.62%, respectively. Compared with pure gasoline, CO emissions reduced by 17.51 and 34.57%. When λ was 1.2, CO emissions increased little when Wr rose; the CO emissions were already low due to the excessive oxygen. The influence of water on CO emissions can be divided into chemical effects and physical effects. For chemical effects, water promoted the chemical reaction: CO + H2O → CO2 + H2.44,45 Meanwhile, water would decompose to generate OH radicals under the high-temperature conditions, and more OH radicals promoted the conversion of CO into CO2.46,47 The macrobehavior of chemical effects reduced CO emissions. For physical effects, the longer injection pulse width brought by a larger Wr was bad for the vaporization and mixing of ethanol in the cylinder, which expands the local over-rich mixture area. At the same time, water diluted the concentration of oxygen and fuels in the reaction zone and reduced the flame temperature. The macrobehavior of physical effects increased CO emissions. When Wr did not exceed 5%, the chemical effects were found to be more obvious than the physical effects, thus reducing CO emissions. However, when Wr further increased beyond 5%, the physical effects played a dominant role, so CO emissions increased as Wr increased when Wr exceeded 5%. Gasoline–ethanol fuels are oxygenated fuels with the best improvements on CO emissions in the rich mixture. The leaner mixture and more oxygen would weaken the improvements. All gasoline–ethanol fuels had lower CO emissions at the λ of 0.9 than pure gasoline because gasoline–ethanol fuels are oxygenated fuels, and the carbon content in fuels decreased while the oxygen content increased, which reduced incomplete combustion products.48 Meanwhile, all gasoline–ethanol fuels had higher CO emissions than pure gasoline at the λ of 1.2 because of the local over-rich mixture.
Figure 8.
Effects of Wr on CO emissions under different λ values.
2.7. NOx Emissions
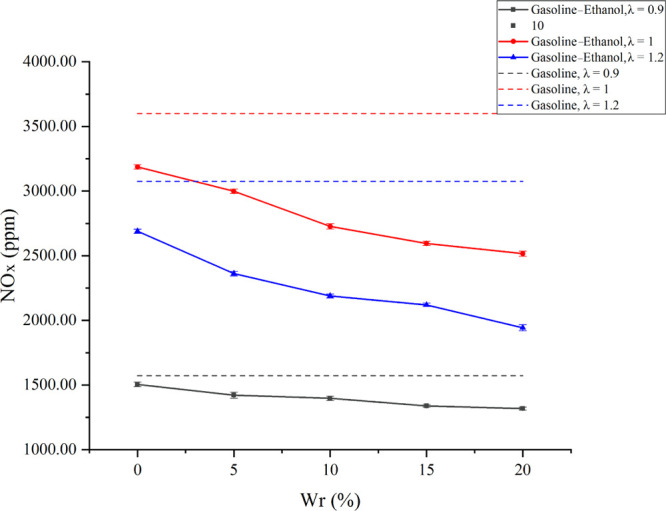
Figure 9 shows the effects of Wr on NOx emissions under different λ values. The three main factors contributing to NOx formation are high temperature, high oxygen concentration, and long resident time at high temperature. The results showed that with the increase of λ, all the fuels’ NOx emissions showed an increasing trend first and then decreased. When λ changed from 0.9 to 1, the temperature in the cylinder decreased slightly, but the oxygen content in the cylinder increased, which broke the oxygen-lack state faced by the rich mixture. The small temperature drop and the oxygen-lack improvements led to the increase of NOx emissions. As λ changed from 1 to 1.2, the oxygen content in the cylinder further increased, but the cylinder temperature decreased obviously. The significant decrease in the cylinder temperature had a larger impact on the NOx formation than the increase in oxygen content, so NOx emissions decreased. In addition, the NOx emissions of gasoline–ethanol fuels were lower than that of pure gasoline because the ethanol with large vaporization heat injected directly into the cylinder vaporized and absorbed heat, lowering the cylinder temperature and thus reducing NOx emissions. With the increase of Wr in gasoline–ethanol fuels, NOx emissions decreased. When λ values were 0.9, 1, and 1.2, compared with pure gasoline, 20% Wr could reduce NOx emissions by 16.16, 30.11, and 36.81%, respectively; compared with anhydrous gasoline–ethanol, NOx emissions reduced by 12.42, 21.05, and 27.74%, respectively. On the one hand, water has a large vaporization heat; the cylinder temperature decreased as Wr increased. At the same time, water could reduce the chemical reaction rate, lowering the flame temperature. Lower cylinder temperature and flame temperature decreased NOx emissions. On the other hand, the water presence diluted the concentrations of N2 and O2 in the reaction zone, also reducing the generation of NOx to a certain extent.
Figure 9.
Effects of Wr on NOx emissions under different λ values.
2.8. Particle Number Emissions
Figure 10 shows the effects of Wr on particle number (PN) distribution characteristics at varied λ values. High temperature and oxygen lack are the main factors for the particles’ formation. The particle in the cylinder underwent two stages: one was the particle formation in the flame front and the other was the particle oxidation after the flame spread. The peak value of smaller Dp in the particle distribution curve is mainly composed of the following substances: (1) primary soot with a small size formed in the flame front by high temperature and oxygen lack. (2) Small particles formed by the condensation and nucleation of the unburned hydrocarbon during the exhaust process. The peak value of the larger particle size is mainly from the growth of the primary soot through polymerization and adsorption. The results showed that the change of λ had significant effects on the PN distribution characteristics. As λ increased, the peak value in the particle distribution curve decreased in all test fuels. The reason was that a larger λ meant that the fuels in the cylinder reduced, thus reducing the amount of carbon; the larger λ decreased the flame temperature and improved the oxygen-lack state, not only reducing the particle generation in the flame front but also strengthening the particle oxidation. For anhydrous gasoline–ethanol, when λ changed from 0.9 to 1, the distribution state changed from bimodal distribution to unimodal distribution. When λ changed from 0.9 to 1, less carbon, lower flame temperature, and the improvement of oxygen lack were all bad for the soot precursor formation and the cyclization and polymerization of the soot precursors, reducing the particles with small sizes. Meanwhile, more oxygen enhanced the particle oxidation and made the particle size smaller; higher oxygen content decreased the amount of unburned hydrocarbon, further reducing the small-sized particles formed by the condensation of unburned hydrocarbon during the exhaust process. When λ increased from 1 to 1.2, the formation, cyclization, and polymerization of the soot precursors reduced further; the oxidation of particles and hydrocarbon increased, resulting in an extremely low level of the particles of all sizes. Thus, the distribution state changed from unimodal distribution to peakless distribution when λ increased from 1 to 1.2.
Figure 10.
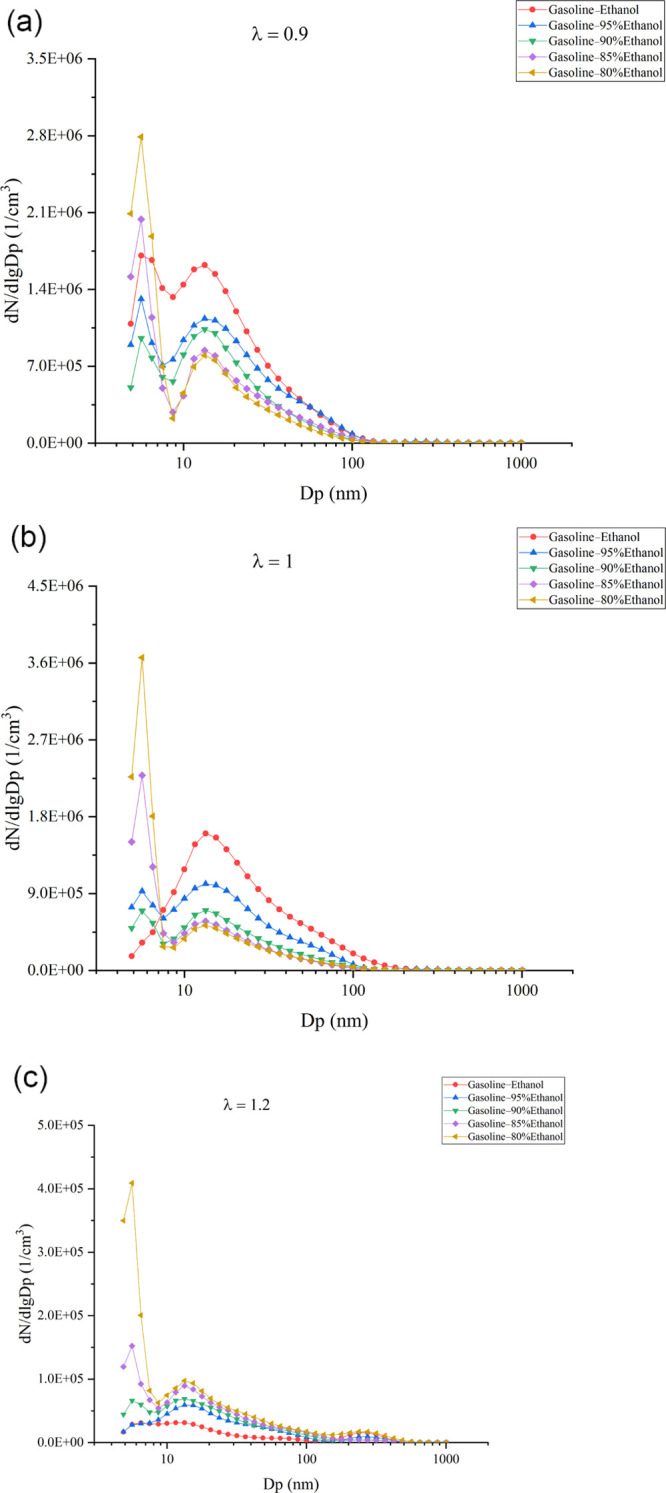
(a) Effects of Wr on PN distribution characteristics at the λ of 0.9. (b) Effects of Wr on PN distribution characteristics at the λ of 1. (c) Effects of Wr on PN distribution characteristics at the λ of 1.2.
For hydrous gasoline–ethanol, the change of λ did not affect the distribution characteristics. Under all λ values, the distribution state was bimodal distribution. However, the effects of water on the distribution characteristics of particles were different as λ increased. When λ was 0.9, with the increase in Wr, the peak concentration of the particles with larger Dp increased, while the peak concentration of the particles with smaller Dp decreased first and then increased, and 10% Wr has the minimum value. The water addition could decrease the flame temperature, reduce the formation of primary soot, and decrease its polymerization and cyclization. At high temperatures, water could react with soot particles in the water–gas reaction: C + H2O → CO + H2.49,50 Meanwhile, water could decompose to generate OH radicals under high-temperature conditions, accelerating the oxidation of particles after the flame front propagation.51,52 Thus, the peak concentration of the particles with larger Dp decreased as Wr increased. However, the water addition reduced the temperature in the zone after the flame front propagation, and lower temperature reduced the particles’ oxidation rate. Excessive water also deteriorated combustion and increased the unburned hydrocarbon content in the exhaust gas, resulting in the increase of concentration of particles with smaller Dp formed by the condensation and nucleation of unburned hydrocarbon. Therefore, when Wr exceeded 10%, the deterioration of water on particles was greater than its improvements. The peak concentration of the particles with smaller Dp increased with the increase of Wr.
When λ was 1, as Wr in gasoline–ethanol increased, the peak concentration of the particles with larger Dp decreased, while the peak concentration of the particles with smaller Dp increased. The reason that the peak concentration of the particles with larger Dp decreased as Wr increased was the same as that at the λ of 0.9. Due to the increase of λ, the flame temperature decreased, and the combustion stability became worse so that the inhibitory effects of water on the combustion in the cylinder were more obvious. Larger λ reduced the tolerance of combustion to water, which made a smaller Wr significantly worsen the oxidation of particles with a small Dp and promote the nucleation of unburned HC. Thus, a Wr beyond 10% increased the concentration of particles with smaller Dp at the λ of 0.9, while the Wr was 5% when λ was 1. When λ was 1.2, both larger Dp and smaller Dp particles’ concentration increased as Wr increased. The reason was that with the increase of Wr, the temperature in the area after the flame front propagation decreased. Although the oxygen content was high, the temperature became lower when Wr rose, making it bad for the particles’ oxidation. In addition, more water reduced the flame propagation speed; thus, the high-temperature duration in the cylinder became shorter and the reaction time for the oxidation of particles became insufficient. These factors made the particles to be discharged from the engine without complete oxidation. Moreover, carbon has a stronger binding ability to oxygen than water. In the case of high oxygen content, water hardly consumed soot through a water–gas reaction. The previous analysis in this paper showed that water had more significant inhibitory effects on the combustion of the lean mixture, making the concentration of unburned hydrocarbon in the exhaust increase, which was conducive to the condensation and nucleation of unburned hydrocarbon; higher hydrocarbon content also promoted the mutual adsorption growth. Therefore, the peak concentration of both larger Dp and smaller Dp particles increased with the increase in Wr when λ was 1.2.
Figure 11 shows the effects of Wr on PN emissions under different λ values. The left axis is the PN emissions for gasoline–ethanol fuels, and the right axis is the PN emissions for gasoline. The PN emissions decreased with the increase in λ. As λ increased, the fuels entering the cylinder reduced, decreasing the total carbon content in the cylinder, which reduced PN emissions at the source. On the one hand, larger λ could reduce the flame temperature, increase the oxygen content in the reaction zone, and reduce the primary soot produced by high temperature and oxygen lack. On the other hand, more oxygen helped to oxidize the particles generated in the flame; meanwhile, larger λ could reduce the hydrocarbon concentration in the exhaust gas and reduce the particles formed by the condensation of unburned hydrocarbon. Thus, as λ increased, the PN emissions from all the fuels decreased.
Figure 11.
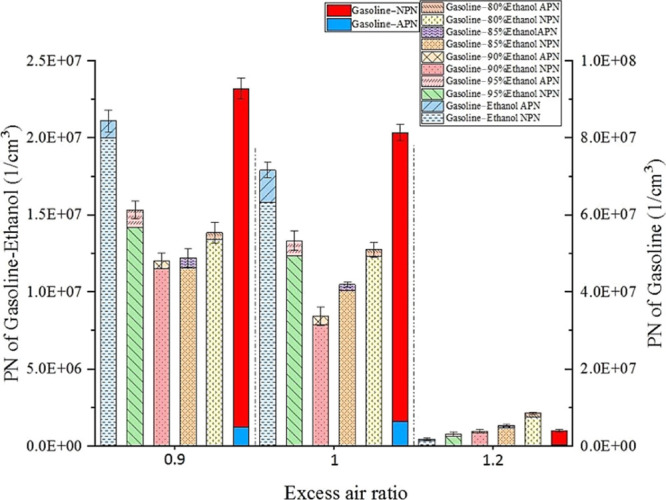
Effects of Wr on PN emissions at different λ values.
The experimental results showed that gasoline–ethanol fuels could significantly reduce the PN emissions at all test λ values. Compared with pure gasoline, gasoline–ethanol fuels contain higher oxygen content, which improves particulate emissions. Meanwhile, gasoline–ethanol fuels have higher H/C values than pure gasoline, which weakens the planar structure of particles and makes particles be more easily oxidized by the active groups.53,54 Water had significant effects on PN emissions, and the variation of PN emissions with Wr was different under different λ values. When λ values were 0.9 and 1, the PN emissions decreased first and then increased as Wr increased. When Wr was 10%, the PN emissions were the lowest. At λ of 0.9 and 1, the PN emissions of a 10% Wr reduced by 87.64 and 89.64%, respectively, compared with that of pure gasoline; the PN emissions reduced by 42.98 and 52.96%, respectively, compared with anhydrous gasoline–ethanol. When λ was 1.2, the PN emissions increased with the increase of Wr. However, the effects of water on the PN emissions were complex. The water addition could lower the flame temperature and reduce the particle formation in the flame area. Water could generate OH radicals, and water could also react with carbon by the water–gas reaction, promoting the particle oxidation in the area after the flame front propagation. The macroscopic manifestation of these effects given above decreased the PN emissions. Meanwhile, water had inhibitory effects on combustion, which reduced the temperature in the area after the flame front propagation, increased the combustion duration, and reduced the particle oxidation temperature and reaction time. More water decreased the AFR of hydrous ethanol and increased the ethanol injection pulse width, enlarging the local over-rich mixture zone. The unburned hydrocarbon would increase, and its nucleation would be obvious due to the water addition. The macroscopic manifestation of these effects increased the PN emissions. The effects of water on the PN emissions were the result of the game of amelioration and deterioration. When λ values were 0.9 and 1, the Wr of 10% was the game’s turning point. The Wr larger than 10% made the deterioration more obvious, deteriorating the PN emissions, while the Wr less than 10% made the optimization brought by water more obvious, decreasing the PN emissions. However, when λ was 1.2, both high temperature and oxygen-lack state were avoided, and the particle generation was small. However, the thermal condition in the cylinder was poor. Thus, the deterioration of water on PN emissions was more prominent; the PN emissions increased with the increase of Wr at the λ of 1.2. Although the 20% Wr increased the PN emissions significantly at the λ of 1.2, the PN emissions still reduced by 47.74% compared to pure gasoline.
3. Conclusions
This paper studied the effects of Wr in hydrous ethanol on the combustion and emissions of a hydrous ethanol/gasoline combined injection engine under different λ. The experiment set two groups of variables, including three λ values (0.9, 1, and 1.2) and five Wrs (0, 5, 10, 15, and 20%). The main experimental conclusions were as follows:
-
1
As λ increased, CA 0-10 and CA 10-90 prolonged, Tmax and Pmax decreased, and APmax delayed. Water had significant effects on the combustion of the test engine. More water in hydrous ethanol would increase CA0-10 and CA10-90, reduce Tmax and Pmax, and delay APmax. The combustion stability and thermo-atmosphere in the cylinder became worse when λ became larger. Therefore, the deterioration of water on combustion was more obvious at a larger λ.
-
2
The increase in λ resulted in a reduction in torque, but a small amount of water could increase torque. Under all λ values, torque first rose and then decreased as Wr increased in hydrous ethanol. When Wr was 5%, the torque is maximum. Moreover, the improvements brought by water became smaller as λ rose.
-
3
Water has significant effects on emissions. An appropriate Wr can improve pollutant emissions. Because the generation mechanism of each pollutant is different, the optimal Wr value corresponding to each pollutant is different. For HC emissions, 0% Wr had the lowest HC emissions. For CO emissions, 5% Wr had the lowest CO emissions. For NOx emissions, 20% Wr had the lowest NOx emissions.
-
4
Because λ had significant effects on the combustion and thermo-atmosphere in the cylinder, the effects of water on the PN distribution characteristics were different under different λ values. When λ was 0.9 and Wr was less than 10%, the peak concentration of all the particles decreased with the increase of Wr. When Wr exceeded 10%, as Wr increased, the peak concentration of particles with smaller Dp increased, and the peak concentration of particles with larger Dp decreased. When λ was 1, the peak concentration of particles with larger Dp decreased with the increase of Wr, while the peak concentration of particles with smaller Dp increased as Wr increased. However, the peak concentration of all the particles increased with the increase of Wr when λ was 1.2.
-
5
Water addition affected the PN emissions obviously, and the effects of water were different at different λ values. When λ values were 0.9 and 1, with the increase of Wr, the PN emissions decreased first and then increased; 10% Wr brought the lowest PN emissions. However, when λ was 1.2, water brought obvious deterioration to the combustion in the cylinder. Therefore, the PN emissions rose as Wr increased.
4. Experimental Setup and Procedure
4.1. Experimental Setup
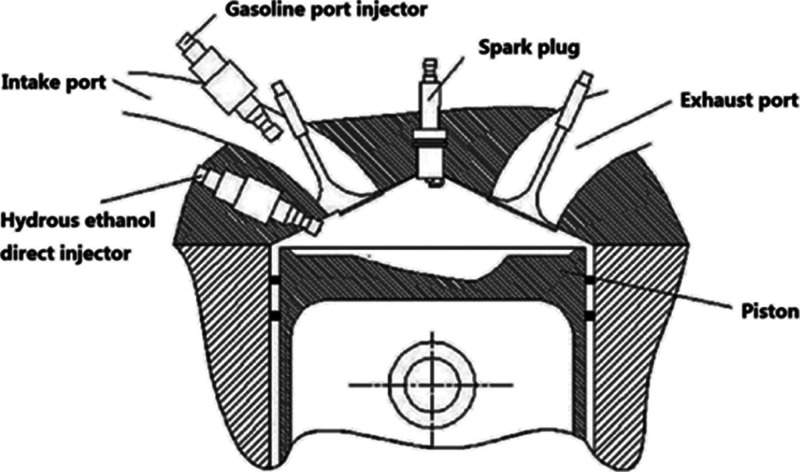
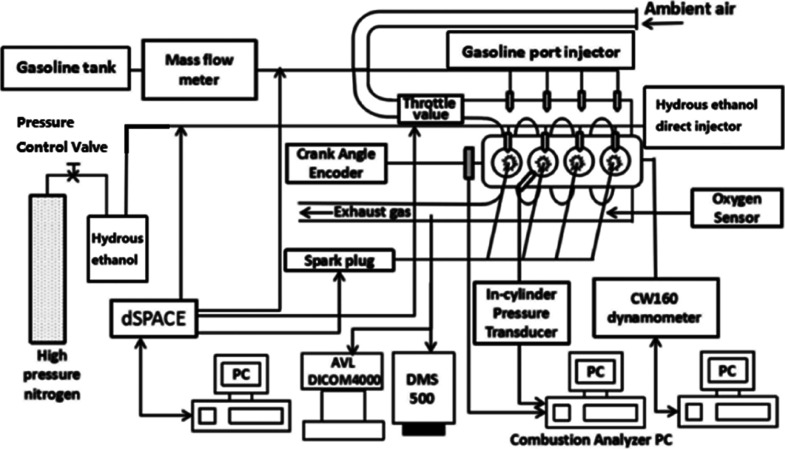
The test engine was a four-cylinder, four-stroke SI engine with a combined injection system. The working volume is 1.984 L. Table 1 shows the main specifications and parameters of the test engine. Figure 12 shows the section of the test engine’s combustion chamber, which clearly shows the installation position of each part in the combustion chamber. Figure 13 shows the schematic diagram of the experimental bench. The high-pressure hydrous ethanol direct injection (HEDI) system consists of a high-pressure nitrogen cylinder, hydrous ethanol tank, pressure control valve, high-pressure pipeline, and hydrous ethanol direct injector. The gasoline tank, mass flow meter, low-pressure pipeline, and gasoline port injector compose the low-pressure GPI system. The dSPACE rapid prototyping controller controls the actuators in the test engine.
Table 1. Main Specifications and Parameters of the Test Engine.
| specifications | parameters |
|---|---|
| cooling mode | water-cooled |
| working volume | 1.984 L |
| bore | 82.5 mm |
| stroke | 92.8 mm |
| compression ratio | 9.6:1 |
| maximal power | 147 kW |
| maximal torque | 280 N·m |
Figure 12.
Section of the test engine’s combustion chamber.
Figure 13.
Schematic diagram of the experimental bench.
4.2. Experimental Instruments and Measurements
Table 2 shows the main information of the experimental instruments. The CW160 eddy current dynamometer controlled the test engine’s speed and measured the power and torque. A Kistler-2614B crank angle encoder recorded the crank angle signal, and an AVL-GU13Z-24 cylinder pressure sensor recorded the cylinder pressure signal. The Dewesoft combustion analyzer calculated the combustion data according to the crank angle signal and the cylinder pressure signal. A Lambda LA4 oxygen sensor measured the λ value. A part of the exhaust gas was introduced into the AVL DiCom 4000 exhaust gas analyzer and the DMS 500 fast particulate spectrometer. The AVL DiCom 4000 exhaust gas analyzer measured regulated emissions, including HC, CO, and NOx emissions. The DMS 500 fast particulate spectrometer recorded the PN distribution characteristics and the total PN emissions.
Table 2. Main Information of the Experimental Instruments.
| parameters | model | precision | uncertainty (%) |
|---|---|---|---|
| speed | CW160 | ≤±1 rpm | ±0.07 |
| power | CW160 | ≤±0.4 kW | ±2 |
| torque | CW160 | ≤±0.28 N·m | ±2 |
| crank angle | Kistler-2614B | ≤±0.5°CA | ±0.07 |
| cylinder pressure | AVL-GU13Z-24 | ≤±0.5% | ±0.5 |
| λ | Lambda LA4 | ≤±0.1 | ±1 |
| CO emission | AVL DiCom 4000 | ≤±0.01% vol | ±3.5 |
| HC emission | AVL DiCom 4000 | ≤±1 ppm | ±3.5 |
| NOx emission | AVL DiCom 4000 | ≤±1 ppm | ±2 |
| particle number | DMS 500 | ≤±1.4 × 10⁴ dN/dlog Dp/cm3 | ±1 |
| gasoline consumption rate | DF-2420 | ≤±0.01 g/s | ±0.03 |
4.3. Test Fuels
The gasoline used in the experiment is 95# gasoline provided by China National Petroleum Corporation, and the octane number is 95. The hydrous ethanol in the experiment is composed of distilled water and analytically pure ethanol with a purity of 99.7%, and the pure ethanol is provided by Beijing Chemical Works. Because ethanol and water can dissolve each other in any ratio, the stability of hydrous ethanol can be kept just by simple mixing and stirring of pure ethanol and distilled water, and hydrous ethanol did not require any special method of blending. The experimenters used a glass rod to stir for 10 min to mix anhydrous ethanol and water to produce hydrous ethanol with different Wr values. Table 3 shows the specific properties of the test fuels. Five Wrs (0, 5, 10, 15, and 20%) were set during the experiment, and the Wr in hydrous ethanol is defined in eq 1.
| 1 |
where Wr is the water ratio in hydrous ethanol, Vwater is the volume of distilled water, and Vethanol is the volume of pure ethanol.
Table 3. Specific Properties of the Test Fuels55−57.
| property | gasoline | ethanol | 95% ethanol | 90% ethanol | 85% ethanol | 80% ethanol |
|---|---|---|---|---|---|---|
| water content (vol %) | 5 | 10 | 15 | 20 | ||
| ethanol content (vol %) | 100 | 95 | 90 | 85 | 80 | |
| carbon content (wt %) | 86 | 52.17 | 48.91 | 45.73 | 42.64 | 39.62 |
| hydrogen content (wt %) | 14 | 13.04 | 12.92 | 12.81 | 12.69 | 12.58 |
| oxygen content (wt %) | 34.79 | 38.17 | 41.46 | 44.67 | 47.8 | |
| octane number | 95 | 108 | ||||
| density (g/cm3) | 0.737 | 0.789 | 0.812 | 0.829 | 0.845 | 0.859 |
| lower heating value (MJ/kg) | 43.5 | 27.0 | 24.86 | 22.95 | 21.05 | 19.35 |
| vaporization heat (kJ/kg) | 223.2 | 838 | 936 | 1011 | 1108 | 1191 |
| stoichiometric air/fuel ratio | 14.7 | 9.0 | 8.51 | 7.98 | 7.45 | 6.92 |
| adiabatic flame temperature (K) | 2148 | 2140 | 2111 | 2064 | 2026 | 1988 |
4.4. Experimental Procedure
The speed of the test engine was 1500 rpm, and the intake manifold absolute pressure was 48 kPa. The experimental speed and load represented an operating condition commonly used when vehicles run in towns and suburbs. Three λ values (0.9, 1, and 1.2) were set to observe the differences in the effects of water ratio on combustion and emissions under the condition of the rich, stoichiometric, and lean mixture. To eliminate the effects of spark timing, the spark timing was set as 15°CA BTDC when studying the combustion parameters (CA 0-10, CA 10-90, Tmax, cylinder pressure, Pmax, and APmax). When studying the test engine’s power performance and emission characteristics, the spark timing was MBT. Experimenters waited 2 min after changing the operating condition and then began to record the experimental data when the test engine was under a steady state. For combustion parameters, the combustion analyzer recorded 200 cycles continuously; for torque and gaseous pollutant emissions, experimenters recorded five measurements; and for particle emissions, the DMS 500 fast particulate spectrometer recorded for 40 s continuously.
To eliminate the influence of the direct injection timing and direct injection ratio (DIr) on the test engine, both of them should be kept constant during the experiment. To determine the optimal direct injection timing and DIr in this experiment, a test experiment was conducted, and the experimental result is shown in Figure 14. The results showed that the test engine had the best power performance when the direct injection timing was 120°CA BTDC and DIr was between 20 and 30%. To decrease the risk of the engine’s lubrication failure, a smaller DIr should be selected to make less water enter the cylinder. Therefore, in this experiment, the direct injection timing was selected as 120°CA BTDC and the DIr was 20%. The direct injection pressure of hydrous ethanol was 9 MPa. Equation 2 shows the definition of DIr. During the experiment, λ was first adjusted to the experimental value under the pure GPI mode. Then, the port injection pulse width decreased to make the gasoline consumption reach 80% of that under the pure GPI mode. Last experimenters increased the direct injection pulse width to make λ decrease back to the experimental value, making DIr be 20%. The lower heating value and AFR of ethanol and gasoline are both different, so it is impossible to keep both λ and the total energy in the cylinder constant. In the experiment, the maximum energy difference in the cylinder was 0.0514%, so the difference is negligible. Table 4 shows the definition of test dual fuels.
| 2 |
where DIr is the direct injection ratio, MHEDI is the consumption of gasoline under the HEDI + GPI mode, and MGPI is the consumption of gasoline under the pure GPI mode.
Figure 14.
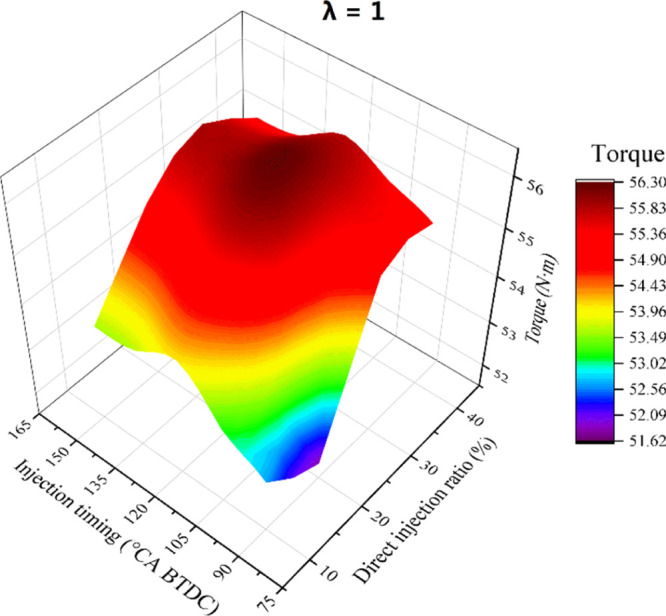
3D diagram of torque vs DIr and injection timing.
Table 4. Definition of the Test Fuels in the Cylinder.
| items | gasoline–ethanol (%) | gasoline–95% ethanol (%) | gasoline–90% ethanol (%) | gasoline–85% ethanol (%) | gasoline–80% ethanol (%) | gasoline (%) |
|---|---|---|---|---|---|---|
| Wr | 0 | 5 | 10 | 15 | 20 | |
| DIr | 20 | 20 | 20 | 20 | 20 | 0 |
| PIr | 80 | 80 | 80 | 80 | 80 | 100 |
Acknowledgments
The authors acknowledge the support of the National Natural Science Foundation of China (grant nos: 51276079 and 51976076).
Glossary
Abbreviations2-col
- AFR
air–fuel ratio
- APmax
crank angle corresponding to Pmax
- APN
accumulation mode particle number
- ATDC
after top dead center
- BTDC
before top dead center
- BMEP
brake mean effective pressure
- C
carbon
- CA
crank angle
- CA 0-10
the duration of CA from ignition to 10% of the fuel’s energy released in the cylinder
- CA 10-90
the duration of CA from 10 to 90% of the fuel’s energy released in the cylinder
- CNPC
China National Petroleum Corporation
- CO
carbon monoxide
- CO2
carbon dioxide
- COV
coefficient of variation
- DIr
direct injection ratio
- Dp
diameter of particles
- EDI
ethanol direct injection
- E90W10
hydrous ethanol with 10% water per volume
- E0
gasoline
- E40
60:40 gasoline–anhydrous ethanol
- E40h
60:40 gasoline–ethanol-10%hydrous
- GPI
gasoline port injection
- H2
hydrogen
- HC
hydrocarbons
- HEDI
hydrous ethanol direct injection
- H2O
water
- IMEP
indicated mean effective pressure
- MBT
minimum advance for best torque
- MHEDI
consumption of gasoline under the HEDI + GPI mode
- MGPI
consumption of gasoline under pure GPI mode
- NOx
nitrogen oxides
- NPN
nucleation mode particle number
- N2
nitrogen
- O2
oxygen
- OH
hydroxyl radical
- PN
particle number
- PIr
port injection ratio
- Pmax
maximum value of the cylinder pressure curve
- SI
spark ignition
- Tmax
maximum average temperature in the cylinder
- Vwater
volume of distilled water
- Vethanol
volume of pure ethanol
- Wr
water ratio in hydrous ethanol
- λ
excess air ratio
The authors declare no competing financial interest.
References
- Shafiee S.; Topal E. When will fossil fuel reserves be diminished?. Energy Pol. 2009, 37, 181–189. 10.1016/j.enpol.2008.08.016. [DOI] [Google Scholar]
- Gong C.; Si X.; Liu F. Combined effects of excess air ratio and EGR rate on combustion and emissions behaviors of a GDI engine with CO2 as simulated EGR (CO2) at low load. Fuel 2021, 293, 120442. 10.1016/j.fuel.2021.120442. [DOI] [Google Scholar]
- Yu X.; Li D.; Sun P.; Li G.; Yang S.; Yao C. Energy and exergy analysis of a combined injection engine using gasoline port injection coupled with gasoline or hydrogen direct injection under lean-burn conditions. Int. J. Hydrogen Energy 2021, 46, 8253–8268. 10.1016/j.ijhydene.2020.12.022. [DOI] [Google Scholar]
- Gong C.; Li Z.; Yi L.; Liu F. Experimental investigation of equivalence ratio effects on combustion and emissions characteristics of an H2/methanol dual-injection engine under different spark timings. Fuel 2020, 262, 116463. 10.1016/j.fuel.2019.116463. [DOI] [Google Scholar]
- Gong C.; Li Z.; Yi l.; Huang K.; Liu F. Research on the performance of a hydrogen/methanol dual-injection assisted spark-ignition engine using late-injection strategy for methanol. Fuel 2020, 260, 116403. 10.1016/j.fuel.2019.116403. [DOI] [Google Scholar]
- Gong C.; Li Z.; Sun J.; Liu F. Evaluation on combustion and lean-burn limit of a medium compression ratio hydrogen/methanol dual-injection spark-ignition engine under methanol late-injection. Appl. Energy 2020, 277, 115622. 10.1016/j.apenergy.2020.115622. [DOI] [Google Scholar]
- Gong C.; Sun J.; Liu F. Numerical study of twin-spark plug arrangement effects on flame, combustion and emissions of a medium compression ratio direct-injection methanol engine. Fuel 2020, 279, 118427. 10.1016/j.fuel.2020.118427. [DOI] [Google Scholar]
- Gong C.; Yi L.; Zhang Z.; Sun J.; Liu F. Assessment of ultra-lean burn characteristics for a stratified-charge direct-injection spark-ignition methanol engine under different high compression ratios. Appl. Energy 2020, 261, 114478. 10.1016/j.apenergy.2019.114478. [DOI] [Google Scholar]
- Thangavelu S. K.; Ahmed A. S.; Ani F. N. Review on bioethanol as alternative fuel for spark ignition engines. Renew. Sustain. Energy Rev. 2016, 56, 820–835. 10.1016/j.rser.2015.11.089. [DOI] [Google Scholar]
- Göktaş M.; Balki M. K.; Sayin C.; Canakci M. An Evaluation of the use of alcohol fuels in SI engines in terms of performance, emission and combustion characteristics: A review. Fuel 2021, 286, 119425. 10.1016/j.fuel.2020.119425. [DOI] [Google Scholar]
- Yoon S. H.; Ha S. Y.; Roh H. G.; Lee C. S. Effect of bioethanol as an alternative fuel on the emissions reduction characteristics and combustion stability in a spark ignition engine. Proc. Inst. Mech. Eng., Part D 2009, 223, 941–951. 10.1243/09544070jauto1016. [DOI] [Google Scholar]
- Balki M. K.; Sayin C. The effect of compression ratio on the performance, emissions and combustion of an SI (spark ignition) engine fueled with pure ethanol, methanol and unleaded gasoline. Energy 2014, 71, 194–201. 10.1016/j.energy.2014.04.074. [DOI] [Google Scholar]
- Yoon S. H.; Lee C. S. Effect of undiluted bioethanol on combustion and emissions reduction in a SI engine at various charge air conditions. Fuel 2012, 97, 887–890. 10.1016/j.fuel.2012.02.001. [DOI] [Google Scholar]
- Balki M. K.; Sayin C.; Canakci M. The effect of different alcohol fuels on the performance, emission and combustion characteristics of a gasoline engine. Fuel 2014, 115, 901–906. 10.1016/j.fuel.2012.09.020. [DOI] [Google Scholar]
- Jeuland N.; Montagne X.; Gautrot X. Potentiality of ethanol as a fuel for dedicated engine. Oil Gas Sci. Technol. 2004, 59, 559–570. 10.2516/ogst:2004040. [DOI] [Google Scholar]
- Waluyo B.; Setiyo M.; Saifudin I. N. G.; Wardana I. N. G. Fuel performance for stable homogeneous gasoline-methanol-ethanol blends. Fuel 2021, 294, 120565. 10.1016/j.fuel.2021.120565. [DOI] [Google Scholar]
- Chen R.; Nishida K.; Shi B. Quantitative measurement of mixture formation in an impinging spray of ethanol-gasoline blend under cold-start condition via UV–Vis dual-wavelength laser absorption scattering (LAS) technique. Fuel 2020, 262, 116685. 10.1016/j.fuel.2019.116685. [DOI] [Google Scholar]
- Gong C.; Zhang Z.; Sun J.; Chen Y.; Liu F. Computational study of nozzle spray-line distribution effects on stratified mixture formation, combustion and emissions of a high compression ratio DISI methanol engine under lean-burn condition. Energy 2020, 205, 118080. 10.1016/j.energy.2020.118080. [DOI] [Google Scholar]
- Al-Hasan M. Effect of ethanol–unleaded gasoline blends on engine performance and exhaust emission. Energy Convers. Manage. 2003, 44, 1547–1561. 10.1016/s0196-8904(02)00166-8. [DOI] [Google Scholar]
- Yücesu H. S.; Topgül T.; Çinar C.; Okur M. Effect of ethanol–gasoline blends on engine performance and exhaust emissions in different compression ratios. Appl. Therm. Eng. 2006, 26, 2272–2278. 10.1016/j.applthermaleng.2006.03.006. [DOI] [Google Scholar]
- Mohammed M. K.; Balla H. H.; Al-Dulaimi Z. M. H.; Kareem Z. S.; Al-Zuhairy M. S. Effect of ethanol-gasoline blends on SI engine performance and emissions. Case Stud. Therm. Eng. 2021, 25, 100891. 10.1016/j.csite.2021.100891. [DOI] [Google Scholar]
- Koç M.; Sekmen Y.; Topgül T.; Yücesu H. S. The effects of ethanol–unleaded gasoline blends on engine performance and exhaust emissions in a spark-ignition engine. Renewable Energy 2009, 34, 2101–2106. 10.1016/j.renene.2009.01.018. [DOI] [Google Scholar]
- Stein R. A.; Anderson J. E.; Wallington T. J. An overview of the effects of ethanol-gasoline blends on SI engine performance, fuel efficiency, and emissions. SAE Int. J. Engines 2013, 6, 470–487. 10.4271/2013-01-1635. [DOI] [Google Scholar]
- Clairotte M.; Adam T. W.; Zardini A. A.; Manfredi U.; Martini G.; Krasenbrink A.; Vicet A.; Tournié E.; Astorga C. Effects of low temperature on the cold start gaseous emissions from light duty vehicles fuelled by ethanol-blended gasoline. Appl. Energy 2013, 102, 44–54. 10.1016/j.apenergy.2012.08.010. [DOI] [Google Scholar]
- Phuangwongtrakul S.; Wechsatol W.; Sethaput T.; Suktang K.; Wongwises S. Experimental study on sparking ignition engine performance for optimal mixing ratio of ethanol–gasoline blended fuels. Appl. Therm. Eng. 2016, 100, 869–879. 10.1016/j.applthermaleng.2016.02.084. [DOI] [Google Scholar]
- Zhu G.; Hung D.; Schock H. Combustion characteristics of a single-cylinder spark ignition gasoline and ethanol dual-fuelled engine. Proc. Inst. Mech. Eng., Part D 2010, 224, 387–403. 10.1243/09544070jauto1236. [DOI] [Google Scholar]
- Wang Z.; Liu H.; Long Y.; Wang J.; He X. Comparative study on alcohols–gasoline and gasoline–alcohols dual-fuel spark ignition (DFSI) combustion for high load extension and high fuel efficiency. Energy 2015, 82, 395–405. 10.1016/j.energy.2015.01.049. [DOI] [Google Scholar]
- Huang Y.; Hong G.; Huang R. Numerical investigation to the dual-fuel spray combustion process in an ethanol direct injection plus gasoline port injection (EDI+ GPI) engine. Energy Convers. Manage. 2015, 92, 275–286. 10.1016/j.enconman.2014.12.064. [DOI] [Google Scholar]
- Huang Y.; Hong G.; Huang R. Investigation to charge cooling effect and combustion characteristics of ethanol direct injection in a gasoline port injection engine. Appl. Energy 2015, 160, 244–254. 10.1016/j.apenergy.2015.09.059. [DOI] [Google Scholar]
- Zhuang Y.; Hong G. Effects of direct injection timing of ethanol fuel on engine knock and lean burn in a port injection gasoline engine. Fuel 2014, 135, 27–37. 10.1016/j.fuel.2014.06.028. [DOI] [Google Scholar]
- Zhuang Y.; Qian Y.; Hong G. The effect of ethanol direct injection on knock mitigation in a gasoline port injection engine. Fuel 2017, 210, 187–197. 10.1016/j.fuel.2017.08.060. [DOI] [Google Scholar]
- Huang Y.; Hong G.; Huang R. Effect of injection timing on mixture formation and combustion in an ethanol direct injection plus gasoline port injection (EDI+ GPI) engine. Energy 2016, 111, 92–103. 10.1016/j.energy.2016.05.109. [DOI] [Google Scholar]
- Huang Y.; Hong G. Investigation of the effect of heated ethanol fuel on combustion and emissions of an ethanol direct injection plus gasoline port injection (EDI+ GPI) engine. Energy Convers. Manage. 2016, 123, 338–347. 10.1016/j.enconman.2016.06.047. [DOI] [Google Scholar]
- López-Plaza E. L.; Hernández S.; Barroso-Muñoz F. O.; Segovia-Hernández J. G.; Aceves S. M.; Martínez-Frías J.; Saxena S.; Dibble R. Experimental and theoretical study of the energy savings from wet ethanol production and utilization. Energy Technol. 2014, 2, 440–445. 10.1002/ente.201300180. [DOI] [Google Scholar]
- Ladisch M. R.; Dyck K. Dehydration of ethanol: new approach gives positive energy balance. Science 1979, 205, 898–900. 10.1126/science.205.4409.898. [DOI] [PubMed] [Google Scholar]
- Martinez-Frias J.; Aceves S. M.; Flowers D. L. Improving ethanol life cycle energy efficiency by direct utilization of wet ethanol in HCCI engines. J. Energy Resour. Technol. 2007, 129, 332–337. 10.1115/1.2794768. [DOI] [Google Scholar]
- Kyriakides A.; Dimas V.; Lymperopoulou E.; Karonis D.; Lois E. Evaluation of gasoline–ethanol–water ternary mixtures used as a fuel for an Otto engine. Fuel 2013, 108, 208–215. 10.1016/j.fuel.2013.02.035. [DOI] [Google Scholar]
- Augoye A.; Aleiferis P.. Characterization of flame development with hydrous and anhydrous ethanol fuels in a spark-ignition engine with direct injection and port injection systems. SAE Technical Paper Series, 2014. No: 2014-01-2623.
- Schifter I.; Diaz L.; Gómez J. P.; Gonzalez U. Combustion characterization in a single cylinder engine with mid-level hydrated ethanol–gasoline blended fuels. Fuel 2013, 103, 292–298. 10.1016/j.fuel.2012.06.002. [DOI] [Google Scholar]
- Venugopal T.; Sharma A.; Satapathy S.; Ramesh A.; Gajendra Babu M. K. Experimental study of hydrous ethanol gasoline blend (E10) in a four stroke port fuel-injected spark ignition engine. Int. J. Energy Res. 2013, 37, 638–644. 10.1002/er.1957. [DOI] [Google Scholar]
- Yusuf A. A.; Inambao F. L. Effect of low bioethanol fraction on emissions, performance, and combustion behavior in a modernized electronic fuel injection engine. Biomass Convers. Biorefin. 2021, 11, 885–893. 10.1007/s13399-019-00519-w. [DOI] [Google Scholar]
- Yusuf A. A.; Inambao F. L.; Farooq A. A. Impact of n-butanol-gasoline-hydrogen blends on combustion reactivity, performance and tailpipe emissions using TGDI engine parameters variation. Sustain. Energy Technol. Assess. 2020, 40, 100773. 10.1016/j.seta.2020.100773. [DOI] [Google Scholar]
- Munsin R.; Laoonual Y.; Jugjai S.; Imai Y. An experimental study on performance and emissions of a small SI engine generator set fuelled by hydrous ethanol with high water contents up to 40%. Fuel 2013, 106, 586–592. 10.1016/j.fuel.2012.12.079. [DOI] [Google Scholar]
- Olberding J.; Beyerlein D. C. S.; Steciak J.; Cherry M.. Dynamometer testing of an ethanol-water fueled transit van. SAE Technical Paper Series, 2005. No: 2005-01-3706.
- Müller-Dethlefs K.; Schlader A. F. The effect of steam on flame temperature, burning velocity and carbon formation in hydrocarbon flames. Combust. Flame 1976, 27, 205–215. 10.1016/0010-2180(76)90023-7. [DOI] [Google Scholar]
- Dhahad H. A.; Chaichan M. T.; Megaritis T. Performance, regulated and unregulated exhaust emission of a stationary compression ignition engine fueled by water-ULSD emulsion. Energy 2019, 181, 1036–1050. 10.1016/j.energy.2019.05.200. [DOI] [Google Scholar]
- Yusuf A. A.; Inambao F. L. Progress in alcohol-gasoline blends and their effects on the performance and emissions in SI engines under different operating conditions. Int. J. Ambient Energy 2021, 42, 465–481. 10.1080/01430750.2018.1531261. [DOI] [Google Scholar]
- Zhu J.; Liu L.; Li R.; Liu S.; Wang Z. Effect of Ethanol Containing Water/Biodiesel on Combustion and Emission of 186F Diesel Engine. Veh. Eng. 2020, 02, 77–83. [Google Scholar]
- Pereda-Ayo B.; Chen X.; Yang J.; Xu Y.; Xia Q. Investigations of Exhaust Emissions of Diesel/Ethanol Compound Combustion in a Turbocharged Inter-Cooled Diesel Engine. Trans. CSICE 2009, 27, 314–320. [Google Scholar]
- Jhalani A.; Sharma D.; Soni S.; Sharma P. K.; Singh D. Feasibility assessment of a newly prepared cow-urine emulsified diesel fuel for CI engine application. Fuel 2021, 288, 119713. 10.1016/j.fuel.2020.119713. [DOI] [Google Scholar]
- Ithnin A. M.; Ahmad M. A.; Bakar M. A. A.; Rajoo S.; Yahya W. J. Combustion performance and emission analysis of diesel engine fuelled with water-in-diesel emulsion fuel made from low-grade diesel fuel. Energy Convers. Manage. 2015, 90, 375–382. 10.1016/j.enconman.2014.11.025. [DOI] [Google Scholar]
- Yusuf A. A.; Yahyah H.; Farooq A. A.; Buyondo K. A.; Olupot P. W.; Nura S. S.; Sanni T.; Hannington T.; Ukundimana Z.; Hassan A. S.; et al. Characteristics of ultrafine particle emission from light-vehicle engine at city transport-speed using after-treatment device fueled with n-butanol-hydrogen blend. Case Stud. Chem. Environ. Eng. 2021, 3, 100085. 10.1016/j.cscee.2021.100085. [DOI] [Google Scholar]
- Yusuf A. A.; Inambao F. L. Effect of cold start emissions from gasoline-fueled engines of light-duty vehicles at low and high ambient temperatures: Recent trends. Case Stud. Therm. Eng. 2019, 14, 100417. 10.1016/j.csite.2019.100417. [DOI] [Google Scholar]
- Breaux B. B.The effect of elevated water content on ethanol combustion. M.S. Thesis; LSU, 2012; p 1548. [Google Scholar]
- Sun Y.; Yu X.; Dong W.; Tang Y. Effects of hydrogen direct injection on engine stability and optimization of control parameters for a combined injection engine. Int. J. Hydrogen Energy 2018, 43, 6723–6733. 10.1016/j.ijhydene.2018.02.033. [DOI] [Google Scholar]
- Li D.; Wang H.; Yu X.; Yang H. Combustion and emission characteristics of an Acetone-Butanol-Ethanol (ABE) spark ignition engine with hydrogen direct injection. Int. J. Hydrogen Energy 2021, 46, 30145–30157. 10.1016/j.ijhydene.2021.06.144. [DOI] [Google Scholar]


