

Abstract
Although it is known that lung cancer is prevalent in Kentucky, the exact scope and nature of the problem was unknown. We report extraordinarily high lung cancer incidences, shifted subtype distributions, late disease presentation, and poor survival in Kentucky and Appalachian Kentucky. Our findings indicate that Kentucky lung cancer patients may benefit from expanded efforts in prevention, drug discovery, and health care delivery, especially in the rural and Appalachian regions.
Introduction:
Kentucky is recognized as the state with the highest lung cancer burden for more than 2 decades, but how lung cancer differs in Kentucky relative to other US populations is not fully understood.
Patients and Methods:
We examined lung cancer reported to the Surveillance, Epidemiology, and End Results (SEER) Program by Kentucky and the other SEER regions for patients diagnosed between 2012 and 2016. Our analyses included histologic types, incidence rates, stage at diagnosis, and survival in Kentucky and Appalachian Kentucky relative to other SEER regions.
Results:
We found that both squamous cell carcinomas and small-cell lung cancers represent larger proportions of lung cancer diagnoses in Kentucky and Appalachian Kentucky than they do in the SEER registries. Furthermore, age-adjusted cancer incidence rates were higher in Kentucky for every subtype of lung cancer examined. Most notably, for Appalachian women the rate of small-cell carcinomas was 3.5-fold higher, and for Appalachian men the rate of squamous cell carcinoma was 3.1-fold higher, than the SEER rates. In Kentucky, lung cancers were diagnosed at later stages and lung cancer survival was lower for adenocarcinoma and neuroendocrine carcinomas than in SEER registries. Squamous cell carcinomas and small-cell carcinomas were most lethal in Appalachian Kentucky.
Conclusion:
Together, these data highlight the considerable disparities among lung cancer cases in the United States and demonstrate the continuing high burden and poor survival of lung cancer in Kentucky and Appalachian Kentucky. Strategies to identify and rectify causes of these disparities are discussed.
Keywords: Squamous, Small cell, Appalachia, Disparities, Interventions
Introduction
Lung cancer is the leading cause of cancer mortality in the United States and worldwide. 1, 2 Lung cancer prognosis and treatment varies depending on disease stage, histology and subtype, presence of driver mutations and other biomarkers, and physical and psychosocial comorbidities that may affect treatment tolerability and adherence. Nationwide, approximately 10% to 15% of lung cancer cases are small-cell carcinoma, which is an aggressive subtype of neuroendocrine tumor. The remainder of epithelial lung cancers are collectively termed “non–small-cell lung cancer” and can be subcategorized as adenocarcinoma (~ 40%), squamous cell carcinoma (~ 20%), non–small-cell neuroendocrine carcinomas (~ 5%), and other complex or ambiguous carcinoma histologies (~ 15% of lung cancers). 3, 4
Kentucky’s lung cancer incidence and mortality rates are the highest in the nation. National surveillance data from 2012 to 2016 indicate an age-adjusted incidence rate of 92.2 per 100,000 and mortality rate of 66.1 per 100,000, in contrast to the overall US rates of 59.2 and 41.9, respectively. 5 Known contributors to lung cancer are common in Kentucky. Over 25% of the population smokes, and many residents are at risk for exposure to radon, air pollution, and heavy metals. 6–8 Finally, emerging evidence also suggests distinct genetic susceptibility in rural communities may also plausibly contribute to the observed cancer disparities. 9 These disparities are particularly salient in Appalachian Kentucky (AP KY), a rural region in eastern Kentucky comprising 33% of the state’s land mass and 26% of the state’s population (see Supplemental Figure 1 in the online version at doi: 10.1016/j.cllc.2021.03.007). 10
Despite the high incidence and mortality of lung cancer in Kentucky, differences in Kentucky’s lung cancer histologies and subtypes, and disparities affecting Kentucky lung cancer survival compared with the United States have not been described. These data are needed to inform priorities for epidemiologic, therapeutic, and cancer care delivery research to reduce the high incidence and mortality of lung cancer in the state. The aims of this research were to compare the entirety of Kentucky and AP KY to the overall Surveillance, Epidemiology, and End Results (SEER) database for: (1) incidence of lung cancer histologies and subtypes among men and women; (2) stage of lung cancer diagnosis; and (3) survival within strata of lung cancer histology and subtype. We also examined these questions within AP KY versus non-Appalachian Kentucky (NAP KY) to help inform priorities for Appalachia in the United States, which is home to roughly 25 million people and characterized by a high cancer burden. 10, 11
Methods
The 2018 SEER 21 registries research data included in the SEER ∗Stat software package (version 8.3.5) were utilized for this study (see Supplemental Table 1 in the online version at doi: 10.1016/j.cllc.2021.03.007). 12 SEER collects data on cancer cases from various locations and sources throughout the United States, currently representing over 35% of the US population and 17 states. For the survival analysis, because survival data are incomplete for the 21 registries, we utilized the SEER 18 registries (see Supplemental Table 2 in the online version at doi: 10.1016/j.cllc.2021.03.007). The University of Kentucky Institutional Review Board determined that this study is nonhuman subject research. Primary invasive malignant lung and bronchus cancer cases (International Classification of Disease for Oncology 3rd Edition [ICD-O-3] Site C34, Behavior 3) diagnosed between 2012 and 2016 were analyzed in SEER ∗Stat. The analytical cases were limited to first primary invasive diagnoses among patients who were aged 20 years or older at the time of diagnosis. Five major lung cancer subtypes, namely adenocarcinoma, squamous cell carcinoma, small-cell carcinoma, neuroendocrine, and other, were defined and grouped based on ICD-O-3 histology codes (see Supplemental Table 3 in the online version at doi: 10.1016/j.cllc.2021.03.007). Noninvasive cases were excluded. Appalachian status was determined by each patient’s county of residence at diagnosis according to the Appalachia Regional Commission (ref: https://www.arc.gov/appalachian-counties-served-by-arc/). Clinical and outcome variables, including 2000 SEER Summary Stage, were examined. Smoking prevalence data from years 2000 to 2015 were extracted from the Behavioral Risk Factor Surveillance System (BRFSS), and Appalachian status was determined by residence.
Age-adjusted incidence rates, standardized to the 2000 US Standard Population, were directly calculated using SEER ∗Stat. Frequency and distribution of cases by stage and histologic type were calculated. χ2 tests were used to examine histologic distributions between Kentucky and the other SEER registries, between AP KY and NAP KY, and rate ratios were used to compare differences between age-adjusted lung cancer incidence rates between Kentucky and SEER, and between AP KY and NAP KY. Additional χ2 comparisons include adenocarcinoma proportions in men versus women, incidence rates of small-cell carcinoma and squamous cell carcinomas in SEER versus AP KY, small-cell carcinoma proportions and incidence rates in women in SEER versus AP KY, squamous cell carcinoma proportions and incidence rates in men in SEER versus AP KY, and comparisons of specific histologic types and stage distributions for neuroendocrine tumors. Mantel-Cox log-rank tests were utilized to identify statistical significance of Kaplan-Meier survival curves. All tests were 2-sided, and a P value of < .05 was defined as statistically significant. Statistical analysis was performed in SEER ∗Stat and SAS/STAT version 9.4 (SAS Institute, Cary, NC) and GraphPad Prism.
Results
Histologic Distribution of Lung Cancers in Kentucky
Our first analysis was to define the distribution and incidence of lung cancer histologic types using 5 major groupings: adenocarcinomas, squamous cell carcinomas, small-cell carcinomas, non–small-cell neuroendocrine tumors (including carcinoid, atypical carcinoid, and large-cell neuroendocrine carcinomas), and “other” carcinoma subtypes. In the tables and figures, we refer to non–small-cell neuroendocrine tumors as neuroendocrine for brevity. Compared with SEER, Kentucky had a lower proportion of adenocarcinomas (45% SEER vs. 32% KY) and a higher proportion of squamous cell carcinomas (19% SEER vs. 25% KY) and small-cell carcinomas (12% SEER vs. 17% KY). These significant subtype distribution differences between Kentucky and other states were observed consistently among men and women (Table 1, P < .0001 for all). Additional comparisons revealed significant differences in histology groups by sex in both SEER and in Kentucky. Nationally, adenocarcinomas represented 49% of lung cancers for women, but only 41% for men (Figure 1A, P < .0001). Despite a lower overall proportion of adenocarcinomas in Kentucky, the difference by sex remained with 35% adenocarcinomas in Kentucky women compared with 30% adenocarcinomas in Kentucky men (Figure 1A, P < .0001).
Table 1.
Distribution of Lung Cancer Histologies, 2012 to 2016, Appalachian Kentucky; Non-Appalachian Kentucky; All Kentucky; US (SEER)
| SEER | All KY | χ2 P Valuea | Non-Appalachian KY | Appalachian KY | χ2 P Valueb | |
|---|---|---|---|---|---|---|
| Cases (%) | Cases (%) | Cases (%) | Cases (%) | |||
| Male and female | < .0001 | < .0001 | ||||
| Adenocarcinoma | 111,886 (44.7) | 6098 (32.4) | 4234 (34.1) | 1864 (29.0) | ||
| Squamous | 48,239 (19.3) | 4794 (25.4) | 3054 (24.6) | 1740 (27.0) | ||
| Other | 51,502 (20.6) | 4051 (21.5) | 2592 (20.9) | 1459 (22.7) | ||
| Small cell | 29,176 (11.7) | 3262 (17.3) | 2084 (16.8) | 1178 (18.3) | ||
| Neuroendocrine | 9452 (3.8) | 634 (3.4) | 440 (3.5) | 194 (3.0) | ||
| Male | < .0001 | .0003 | ||||
| Adenocarcinoma | 51,664 (40.8) | 3056 (29.9) | 2072 (31.6) | 984 (26.7) | ||
| Squamous | 29,702 (23.5) | 3048 (29.8) | 1883 (28.7) | 1165 (31.6) | ||
| Other | 26,969 (21.3) | 2291 (22.4) | 1435 (21.9) | 856 (23.3) | ||
| Small cell | 14,332 (11.3) | 1553 (15.2) | 982 (15.0) | 571 (15.5) | ||
| Neuroendocrine | 3939 (3.1) | 289 (2.8) | 184 (2.8) | 105 (2.9) | ||
| Female | < .0001 | < .0001 | ||||
| Adenocarcinoma | 60,222 (48.7) | 3042 (35.4) | 2162 (37.0) | 880 (32.0) | ||
| Squamous | 18,537 (15.0) | 1746 (20.3) | 1171 (20.0) | 575 (20.9) | ||
| Other | 24,533 (19.8) | 1760 (20.5) | 1157 (19.8) | 603 (21.9) | ||
| Small cell | 14,844 (12.0) | 1709 (19.9) | 1102 (18.8) | 607 (22.0) | ||
| Neuroendocrine | 5513 (4.5) | 345 (4.0) | 256 (4.4) | 89 (3.2) |
Abbreviations: KY = Kentucky; SEER = Surveillance, Epidemiology, and End Results.
Comparing SEER with Kentucky excluded to all Kentucky data.
Comparing non-Appalachian Kentucky to Appalachian Kentucky data.
Figure 1.
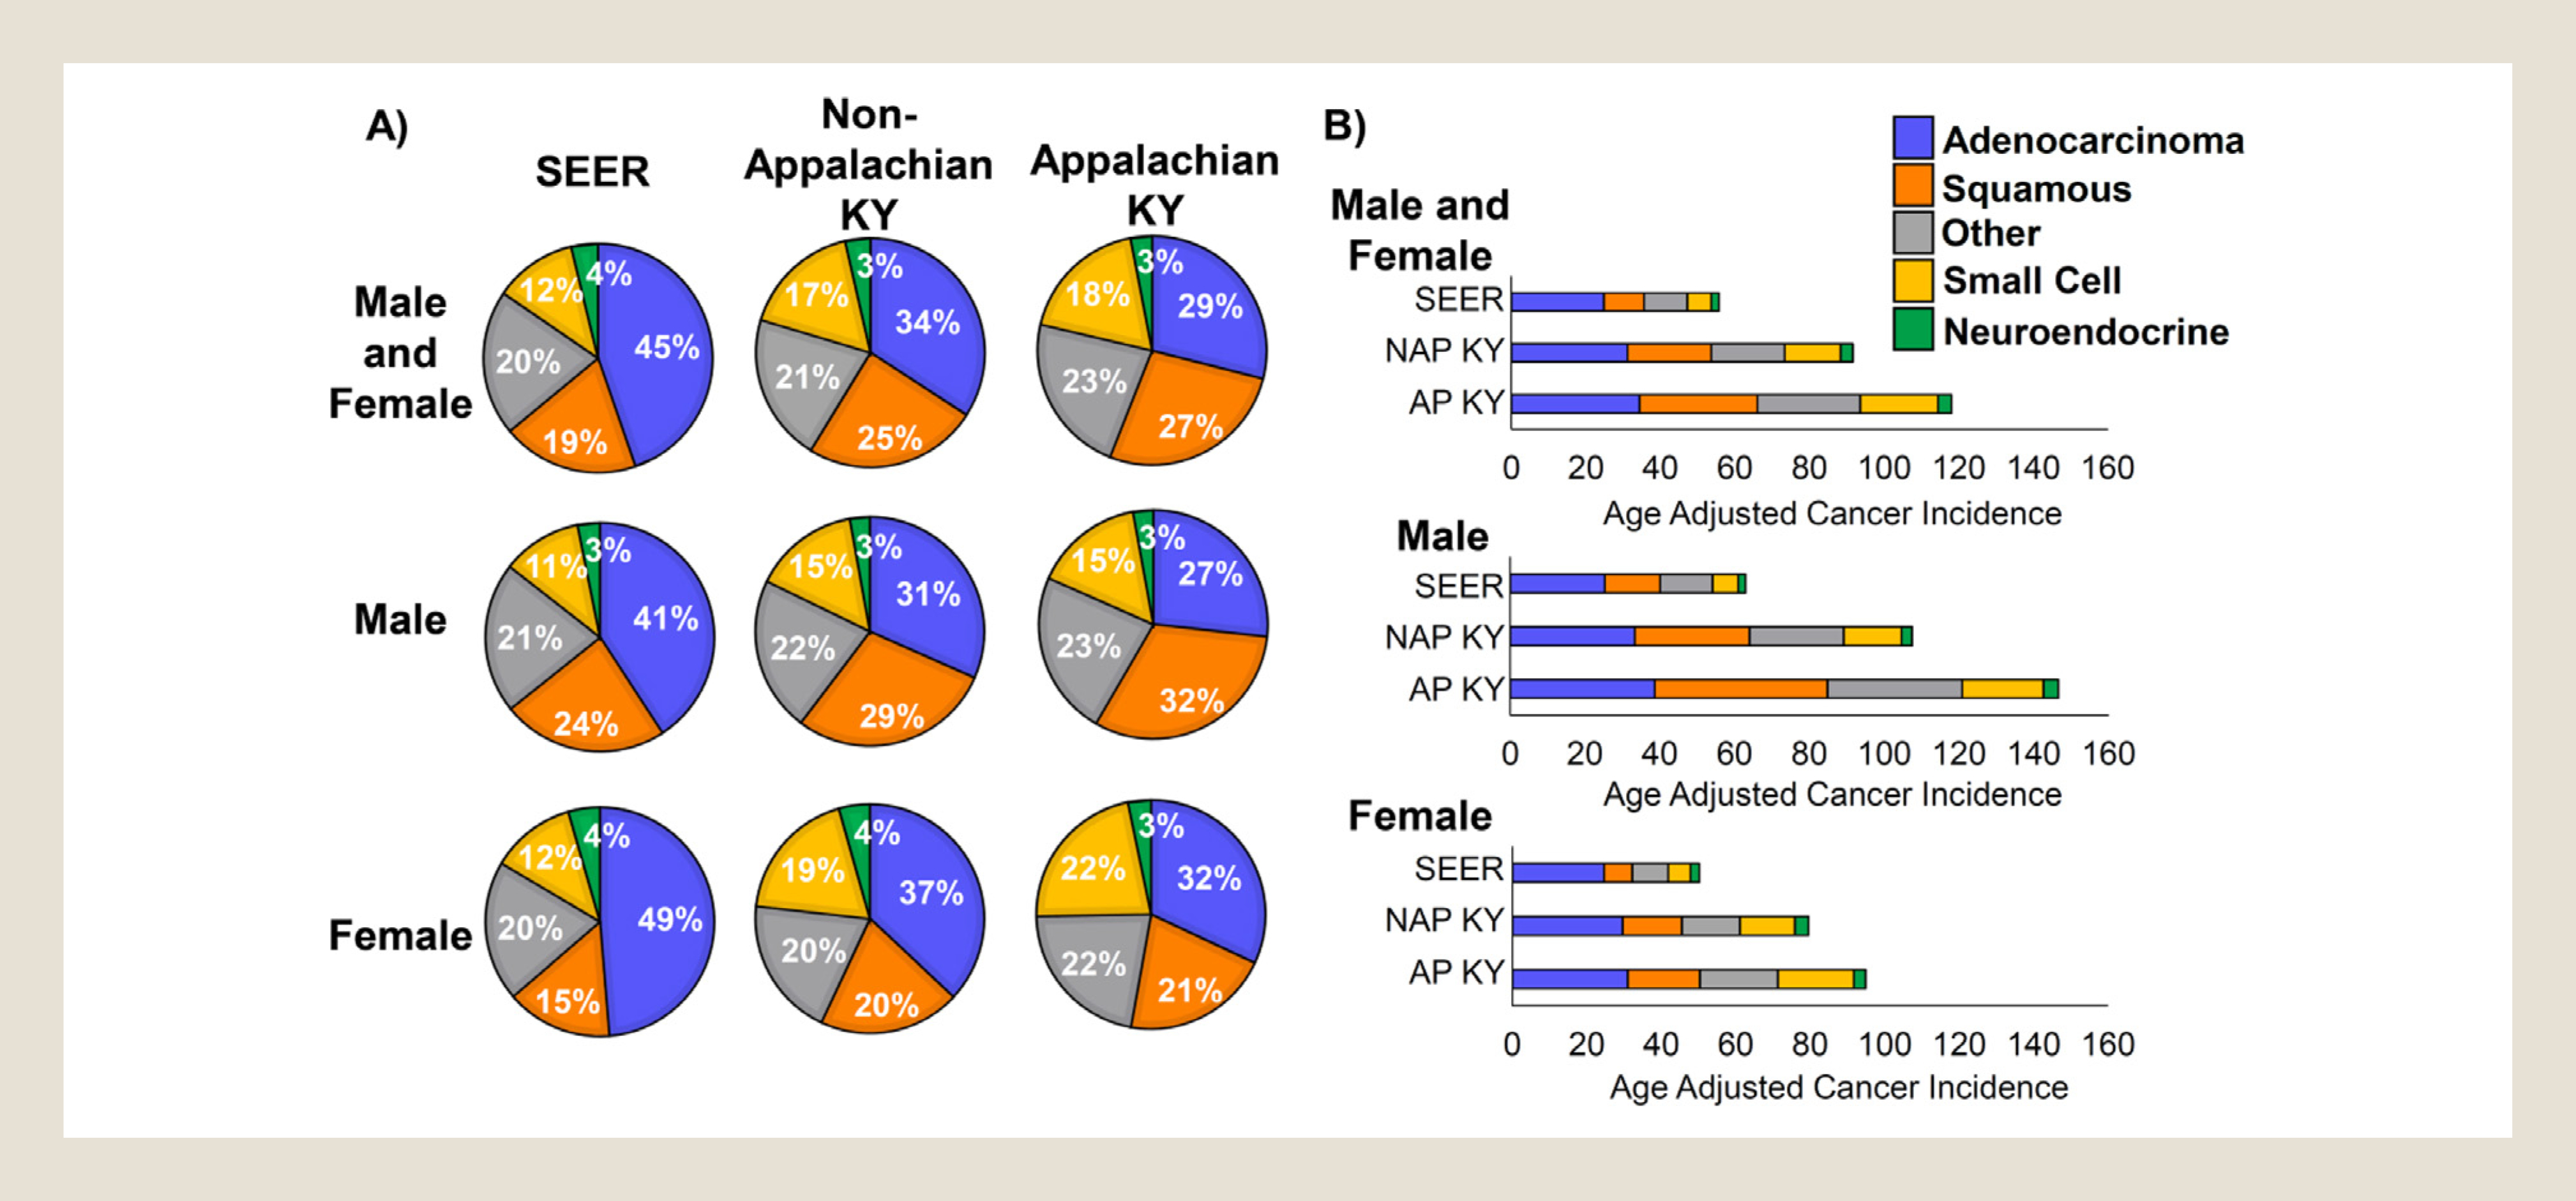
Histological distributions and incidences of lung cancer in Kentucky differ significantly from SEER data. (A) First primary tumors from the indicated databases were classified into 5 major non–small-cell lung cancer histological subtypes. Percentages of each subtype are shown for all patients (men and women), only male patients, and only female patients. SEER = SEER database without Kentucky data. (B) Incidence of lung cancer as a first primary tumor was adjusted for age and subclassified into the 5 major histological groups of non–small-cell lung cancer. SEER = Surveillance, Epidemiology, and End Results database without Kentucky data; NAP KY = non-Appalachian Kentucky; AP KY = Appalachian Kentucky.
Although both NAP KY and AP KY expressed similar differences in comparison to national data, changes in histological distributions were more pronounced when comparing AP KY to NAP KY (Table 1, P < .0001). Compared with NAP KY, AP KY had a lower proportion of adenocarcinomas (34% NAP KY vs. 29% AP KY) and a higher proportion of squamous cell carcinomas (25% NAP KY vs. 27% AP KY), “other” carcinomas (21% NAP KY vs. 23% AP KY), and small-cell carcinomas (17% NAP KY vs. 18% AP KY). Additional analyses revealed that women in Kentucky, and particularly in AP KY, were more likely to be diagnosed with small-cell carcinoma than other US women (Figure 1A, P < .0001 SEER vs. AP KY). In contrast, men in Kentucky, and particularly AP KY, were diagnosed with a much higher proportion of squamous cell carcinomas than other US men (Figure 1A, P < .0001, SEER vs. AP KY). These data suggest a clear propensity toward small-cell lung cancer in Appalachian women and squamous lung cancer among Appalachian men. Together, these data indicate that the incidence of lung cancer histologic subtypes in Kentucky is significantly different from that observed nationally. Kentucky patients presented with a significantly lower percentage of adenocarcinomas and significantly higher percentages of squamous cell carcinomas and small-cell carcinomas, and these differences were even more magnified in AP KY.
As smoking is a well-established risk factor for lung cancer and the observed differences exist in histological subtypes that are closely related to smoking, 13 the BRFSS database was used to determine percentages of adults who smoked from years 2000 to 2015. We observed on average 7% more smokers in NAP KY and 12% more smokers in AP KY than in the other 49 states over the 16-year period, and this difference was relatively stable over this period (see Supplemental Figure 2 in the online version at doi: 10.1016/j.cllc.2021.03.007). This suggests that smoking continues to be a significant problem in Kentucky, and efforts in smoking cessation are expected to have large impacts in this population.
Lung Cancer Incidence by Histology
In addition to differences in proportions of histologic categories, age-adjusted lung cancer incidence rates in Kentucky were higher than national rates for every subtype analyzed (Table 2, P < .0001 for all 5 subtypes). One striking finding was that the overall lung cancer incidence rate in AP KY was more than twice the national rate (Figure 1B). The age-adjusted overall lung cancer incidence rate in SEER was 55.7 per 100,000 compared with 99.2 in Kentucky, and in NAP KY, the rate was 91.6 compared with 118.1 in AP KY (Table 2). Compared with SEER, Kentucky had a higher incidence rate for each lung cancer histology group, including adenocarcinoma (24.8 vs. 32.0 per 100,000, P < .0001), squamous (10.8 vs. 25.1, P < .0001), other (11.6 vs. 22.0, P < .0001), small cell (6.4 vs. 16.7, P < .0001), and non–small-cell neuroendocrine tumors (2.1 vs. 3.4, P < .0001; Table 2). This pattern was observed consistently among men and women. Similarly, compared with NAP KY, AP KY had higher incidence rates for adenocarcinoma (P = .0088), squamous cell carcinoma (P < .0001), “other” carcinomas (P < .0001), and small-cell carcinomas (P < .0001; Table 2). Additional analysis revealed that incidence rates of both squamous cell carcinomas and small-cell carcinomas were much higher in AP KY than observed nationally. For squamous cell carcinomas, the national incidence rate was 10.8 per 100,000, the NAP KY rate was 22.5, and the AP KY rate was 31.6 (Figure 1B, P < .0001 for all comparisons). Small-cell carcinoma incidence rates followed a similar pattern, with a rate of 6.4 nationally, a rate of 15.0 in NAP KY, and a rate of 20.9 in AP KY (Figure 1B, P < .0001 for all comparisons). Therefore both incidence rates of squamous lung cancers and small-cell carcinomas are at least 2-fold higher in Kentucky, and 3-fold higher in AP KY when compared with national rates.
Table 2.
Age-Adjusted Lung Cancer Incidence, 2012 to 2016, Appalachian Kentucky; Non-Appalachian Kentucky; All Kentucky; US (SEER)
| SEER | All KY | Rate-Ratio P Valuea | Non-Appalachian KY | Appalachian KY | Rate-Ratio P Valueb | |
|---|---|---|---|---|---|---|
| Rate | Rate | Rate | Rate | |||
| Male and female | ||||||
| Adenocarcinoma | 24.8 | 32.0 | < .0001 | 31.1 | 34.4 | .0088 |
| Squamous | 10.8 | 25.1 | < .0001 | 22.5 | 31.6 | < .0001 |
| Other | 11.6 | 22.0 | < .0001 | 19.7 | 27.6 | < .0001 |
| Small cell | 6.4 | 16.7 | < .0001 | 15.0 | 20.9 | < .0001 |
| Neuroendocrine | 2.1 | 3.4 | < .0001 | 3.3 | 3.6 | .5084 |
| Total | 55.7 | 99.2 | 91.6 | 118.1 | ||
| Male | ||||||
| Adenocarcinoma | 25.3 | 34.8 | < .0001 | 33.3 | 38.7 | .0058 |
| Squamous | 14.8 | 35.2 | < .0001 | 30.7 | 46.2 | < .0001 |
| Other | 14.0 | 28.3 | < .0001 | 25.2 | 36.0 | < .0001 |
| Small cell | 6.9 | 17.2 | < .0001 | 15.4 | 21.7 | < .0001 |
| Neuroendocrine | 1.9 | 3.2 | < .0001 | 2.9 | 4.0 | .0726 |
| Total | 62.9 | 118.7 | 107.5 | 146.6 | ||
| Female | ||||||
| Adenocarcinoma | 24.6 | 29.9 | < .0001 | 29.6 | 31.0 | .3759 |
| Squamous | 7.6 | 16.9 | < .0001 | 15.9 | 19.4 | .0067 |
| Other | 9.7 | 17.1 | < .0001 | 15.6 | 20.9 | < .0001 |
| Small cell | 6.0 | 16.4 | < .0001 | 14.8 | 20.4 | < .0001 |
| Neuroendocrine | 2.3 | 3.5 | < .0001 | 3.6 | 3.2 | .4936 |
| Total | 50.2 | 83.8 | 79.5 | 94.9 |
Abbreviations: KY = Kentucky; SEER = Surveillance, Epidemiology, and End Results.
Comparing SEER with Kentucky excluded to all Kentucky data.
Comparing non-Appalachian Kentucky to Appalachian Kentucky data.
With regard to sex, AP KY men experienced the highest lung cancer incidence, with an age-adjusted rate of 146.6 per 100,000. The difference in male lung cancer incidence was most pronounced for the incidence of squamous cell carcinoma, which was 3.1-fold higher for AP KY men compared with other US men (Figure 1B, P < .0001). We also found a large difference in small-cell carcinoma incidence among Appalachian men with a 3.1-fold higher rate than in other US men (Figure 1B, P < .0001). Appalachian women showed the largest rate differences in small-cell carcinomas (3.4-fold more) compared with other US women (Figure 1B, P < .0001). These data indicate that there are higher lung cancer incidence rates in Kentucky, the rates are particularly magnified for squamous and small-cell carcinomas among men, and small-cell carcinomas among Kentucky women. In AP KY, these differences are even greater.
Lung Cancer Stage at Diagnosis by Histology
SEER Summary Stage is a population measure that classifies cancer diagnoses as local, regional, or distant at the time of diagnosis. Table 3 presents comparisons of stage at diagnosis for each histological subtype for SEER compared with Kentucky and NAP KY compared with AP KY. For adenocarcinomas there was a significant shift from local tumors to regional and advanced stage of disease in Kentucky compared with the SEER population (P < .0001; Table 3). For “other” carcinoma subtypes, a similar significant trend was observed when comparing NAP KY to AP KY (P < .0001). The largest changes in stage distributions were observed in non–small-cell neuroendocrine tumors, which were much more frequently diagnosed at a later stage in Kentucky than in the SEER database (P < .0001). In SEER, 36.9% of non–small-cell neuroendocrine cancers were diagnosed when they were still localized tumors. In contrast, localized tumors represented only 30.0% of NAP KY cases, and 26.3% of Appalachia Kentucky (Figure 2A, P = .038 and P = .006 compared with SEER, respectively). A nearly reciprocal increase in advanced stage non–small-cell neuroendocrine cancer cases was observed in Kentucky, with more than 50.5% of AP KY cancers diagnosed at a distant stage, compared with 43.9% distant stage diagnoses in SEER. Non–small-cell neuroendocrine tumors are subclassified into low-grade carcinoids, mid-grade atypical carcinoids, and high-grade large-cell carcinomas. When stratified by histologic type, there was a clear shift from carcinoids nationally to the much more malignant large-cell carcinomas in Kentucky (Figure 2B, P < .0001 for both NAP vs. SEER and AP vs. SEER).
Table 3.
Distribution of Stage at Lung Cancer Diagnosis, 2012 to 2016, Appalachian Kentucky; Non-Appalachian Kentucky; All Kentucky; US (SEER)
| SEER | All KY | χ2 Test P Valuea | Non-Appalachian KY | Appalachian KY | χ2 Test P Valueb | |
|---|---|---|---|---|---|---|
| Cases (%) | Cases (%) | Cases (%) | Cases (%) | |||
| Adenocarcinoma | < .0001 | .6063 | ||||
| Localized | 24,162 (22.0) | 1205 (19.9) | 851 (20.2) | 354 (19.2) | ||
| Regional | 22,254 (20.3) | 1333 (22.0) | 927 (22.1) | 406 (22.0) | ||
| Distant | 63,423 (57.7) | 3513 (58.1) | 2427 (57.7) | 1086 (58.8) | ||
| Unknown | 2047 | 47 | 29 | 18 | ||
| Squamous | .1839 | .4351 | ||||
| Localized | 10,593 (22.5) | 1031 (21.8) | 676 (22.4) | 355 (20.8) | ||
| Regional | 15,909 (33.8) | 1660 (35.1) | 1057 (34.9) | 603 (35.3) | ||
| Distant | 20,590 (43.7) | 2043 (43.1) | 1292 (42.7) | 751 (43.9) | ||
| Unknown | 1147 | 60 | 29 | 31 | ||
| Other | .2915 | < .0001 | ||||
| Localized | 6180 (15.8) | 504 (16.7) | 372 (19.0) | 132 (12.5) | ||
| Regional | 7564 (19.3) | 595 (19.7) | 384 (19.6) | 211 (20.0) | ||
| Distant | 25,361 (64.9) | 1915 (63.5) | 1202 (61.4) | 713 (67.5) | ||
| Unknown | 12,397 | 1037 | 634 | 403 | ||
| Small cell | .0486 | .5517 | ||||
| Localized | 1173 (4.1) | 104 (3.2) | 70 (3.4) | 34 (2.9) | ||
| Regional | 5,877 (20.5) | 650 (20.2) | 423 (20.6) | 227 (19.55) | ||
| Distant | 21,570 (75.4) | 2461 (76.6) | 1560 (76.0) | 901 (77.55) | ||
| Unknown | 556 | 47 | 31 | 16 | ||
| Neuroendocrine | < .0001 | .4635 | ||||
| Localized | 3417 (36.9) | 182 (28.8) | 131 (30.0) | 51 (26.3) | ||
| Regional | 1782 (19.2) | 153 (24.3) | 108 (24.7) | 45 (23.2) | ||
| Distant | 4069 (43.9) | 296 (46.9) | 198 (45.3) | 98 (50.5) | ||
| Unknown | 184 | 3 | 3 | 0 |
For χ2 test analysis and percentage, t he group ‘unknown’ was censored.
Abbreviations: KY = Kentucky; SEER = Surveillance, Epidemiology, and End Results.
Comparing SEER with Kentucky excluded to all Kentucky data.
Comparing non-Appalachian Kentucky to Appalachian Kentucky data.
Figure 2.
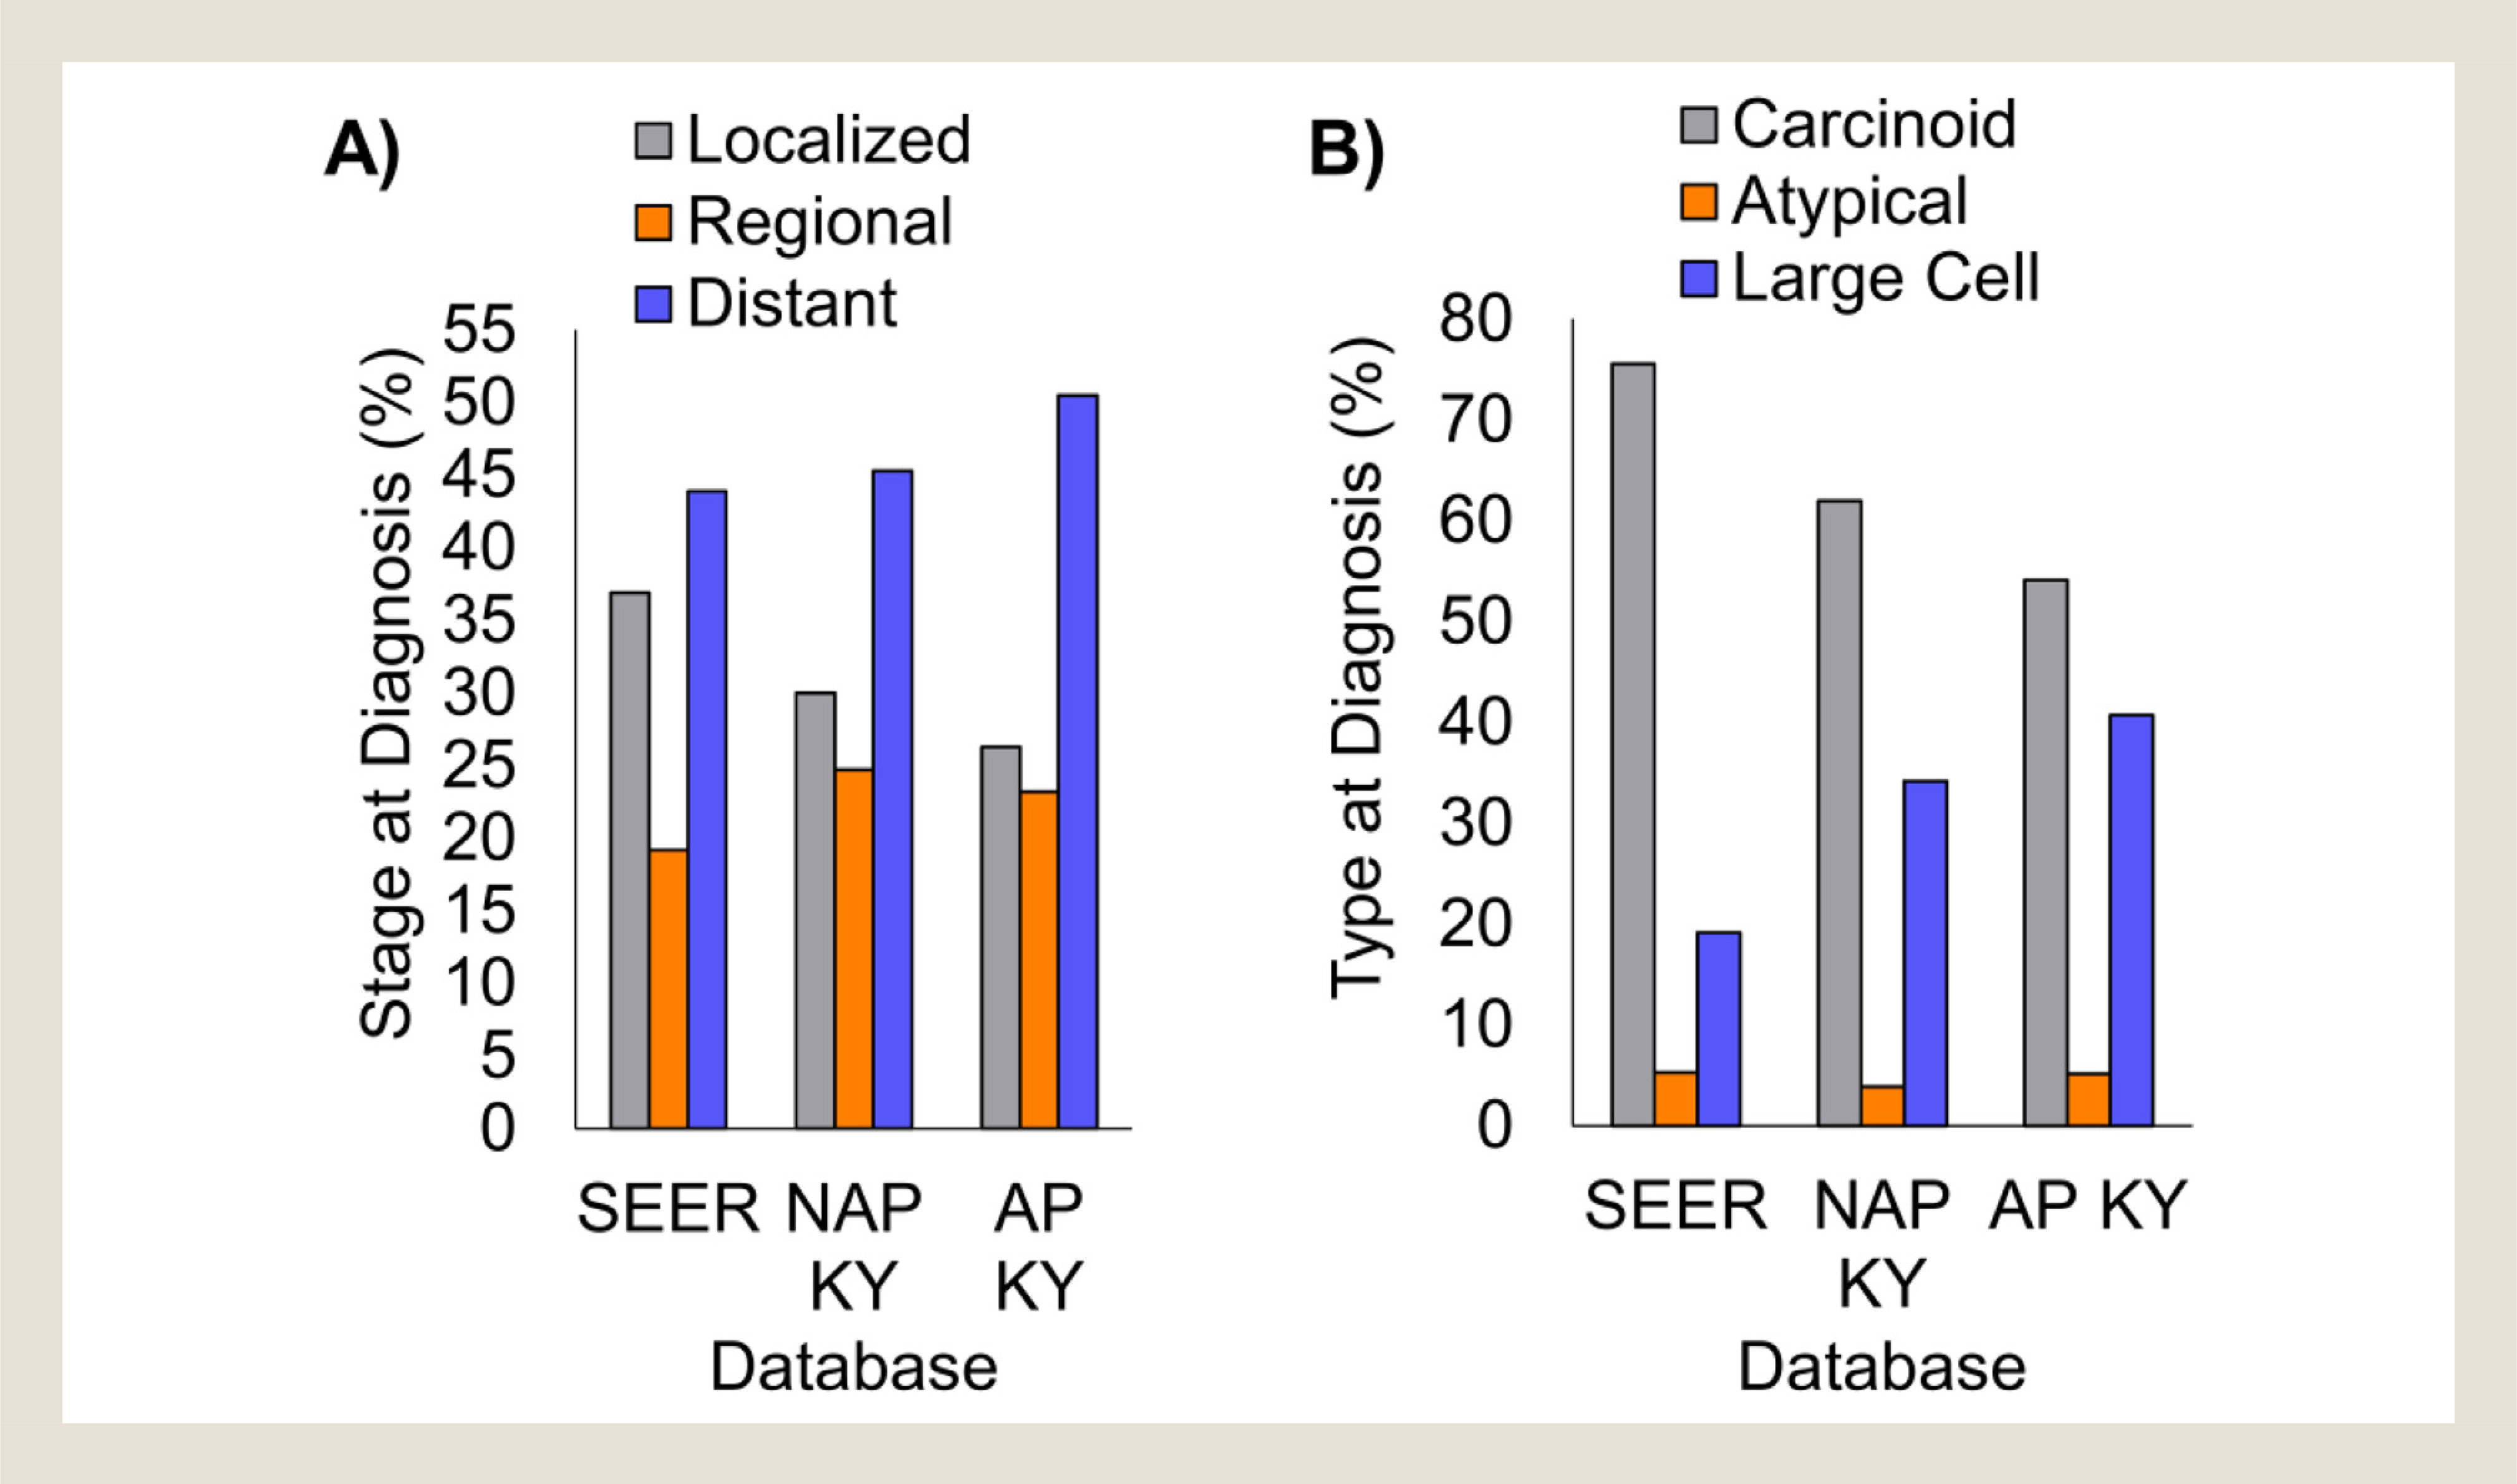
Non–small-cell neuroendocrine carcinomas are diagnosed at later stage and are higher grade in Kentucky than in SEER. (A) First primary neuroendocrine carcinomas were categorized as either localized, regional, or distant in the database. The percentage of each group is shown. (B) Non–small-cell neuroendocrine histology codes were segregated into 3 categories of increasing grade. The percentage of each group is shown. SEER = Surveillance, Epidemiology, and End Results database without Kentucky data; NAP KY = non-Appalachian Kentucky; AP KY = Appalachian Kentucky.
Lung Cancer Survival by Histology
Finally, we evaluated differences in survival based on lung cancer subtype across SEER registries, and subsequently compared lung cancer survival in Kentucky to other US patients. First, we compared the survival of each subtype of lung cancer using all 18 SEER registries with Kentucky included. Patients with non–small-cell neuroendocrine tumors experienced the best overall survival, likely because of the large percentage of this category being low-grade carcinoids. Next best survival rates were seen in patients with adenocarcinoma and squamous cell carcinoma, respectively (Figure 3A). Both small-cell carcinomas and “other” carcinoma subtypes resulted in particularly poor prognoses, both demonstrating approximately 25% survival at 1-year post diagnosis (Figure 3A). Next, we compared survival rates in Kentucky to those in SEER for each lung cancer subtype. Kentucky patients showed significantly lower overall survival rates compared with SEER for adenocarcinomas (P < .0001), “other” lung carcinoma subtypes (P < .0001), and non–small-cell neuroendocrine tumors (P = .0023; Figure 3B). As noted earlier, the obvious difference in survival for the neuroendocrine tumors could be because of the shift from low-grade carcinoids to higher grade large-cell carcinomas observed in Kentucky. Finally, we compared survival of AP KY and NAP KY patients by lung cancer subtype. Compared with NAP KY, AP KY patients showed significantly lower overall survival for all lung cancer histologies, with the exception of non–small-cell neuroendocrine tumors, which had a trend, but a small sample size (Figure 3B). Overall, these data suggest that in AP KY, lung cancers were not only more common, but also more deadly.
Figure 3.
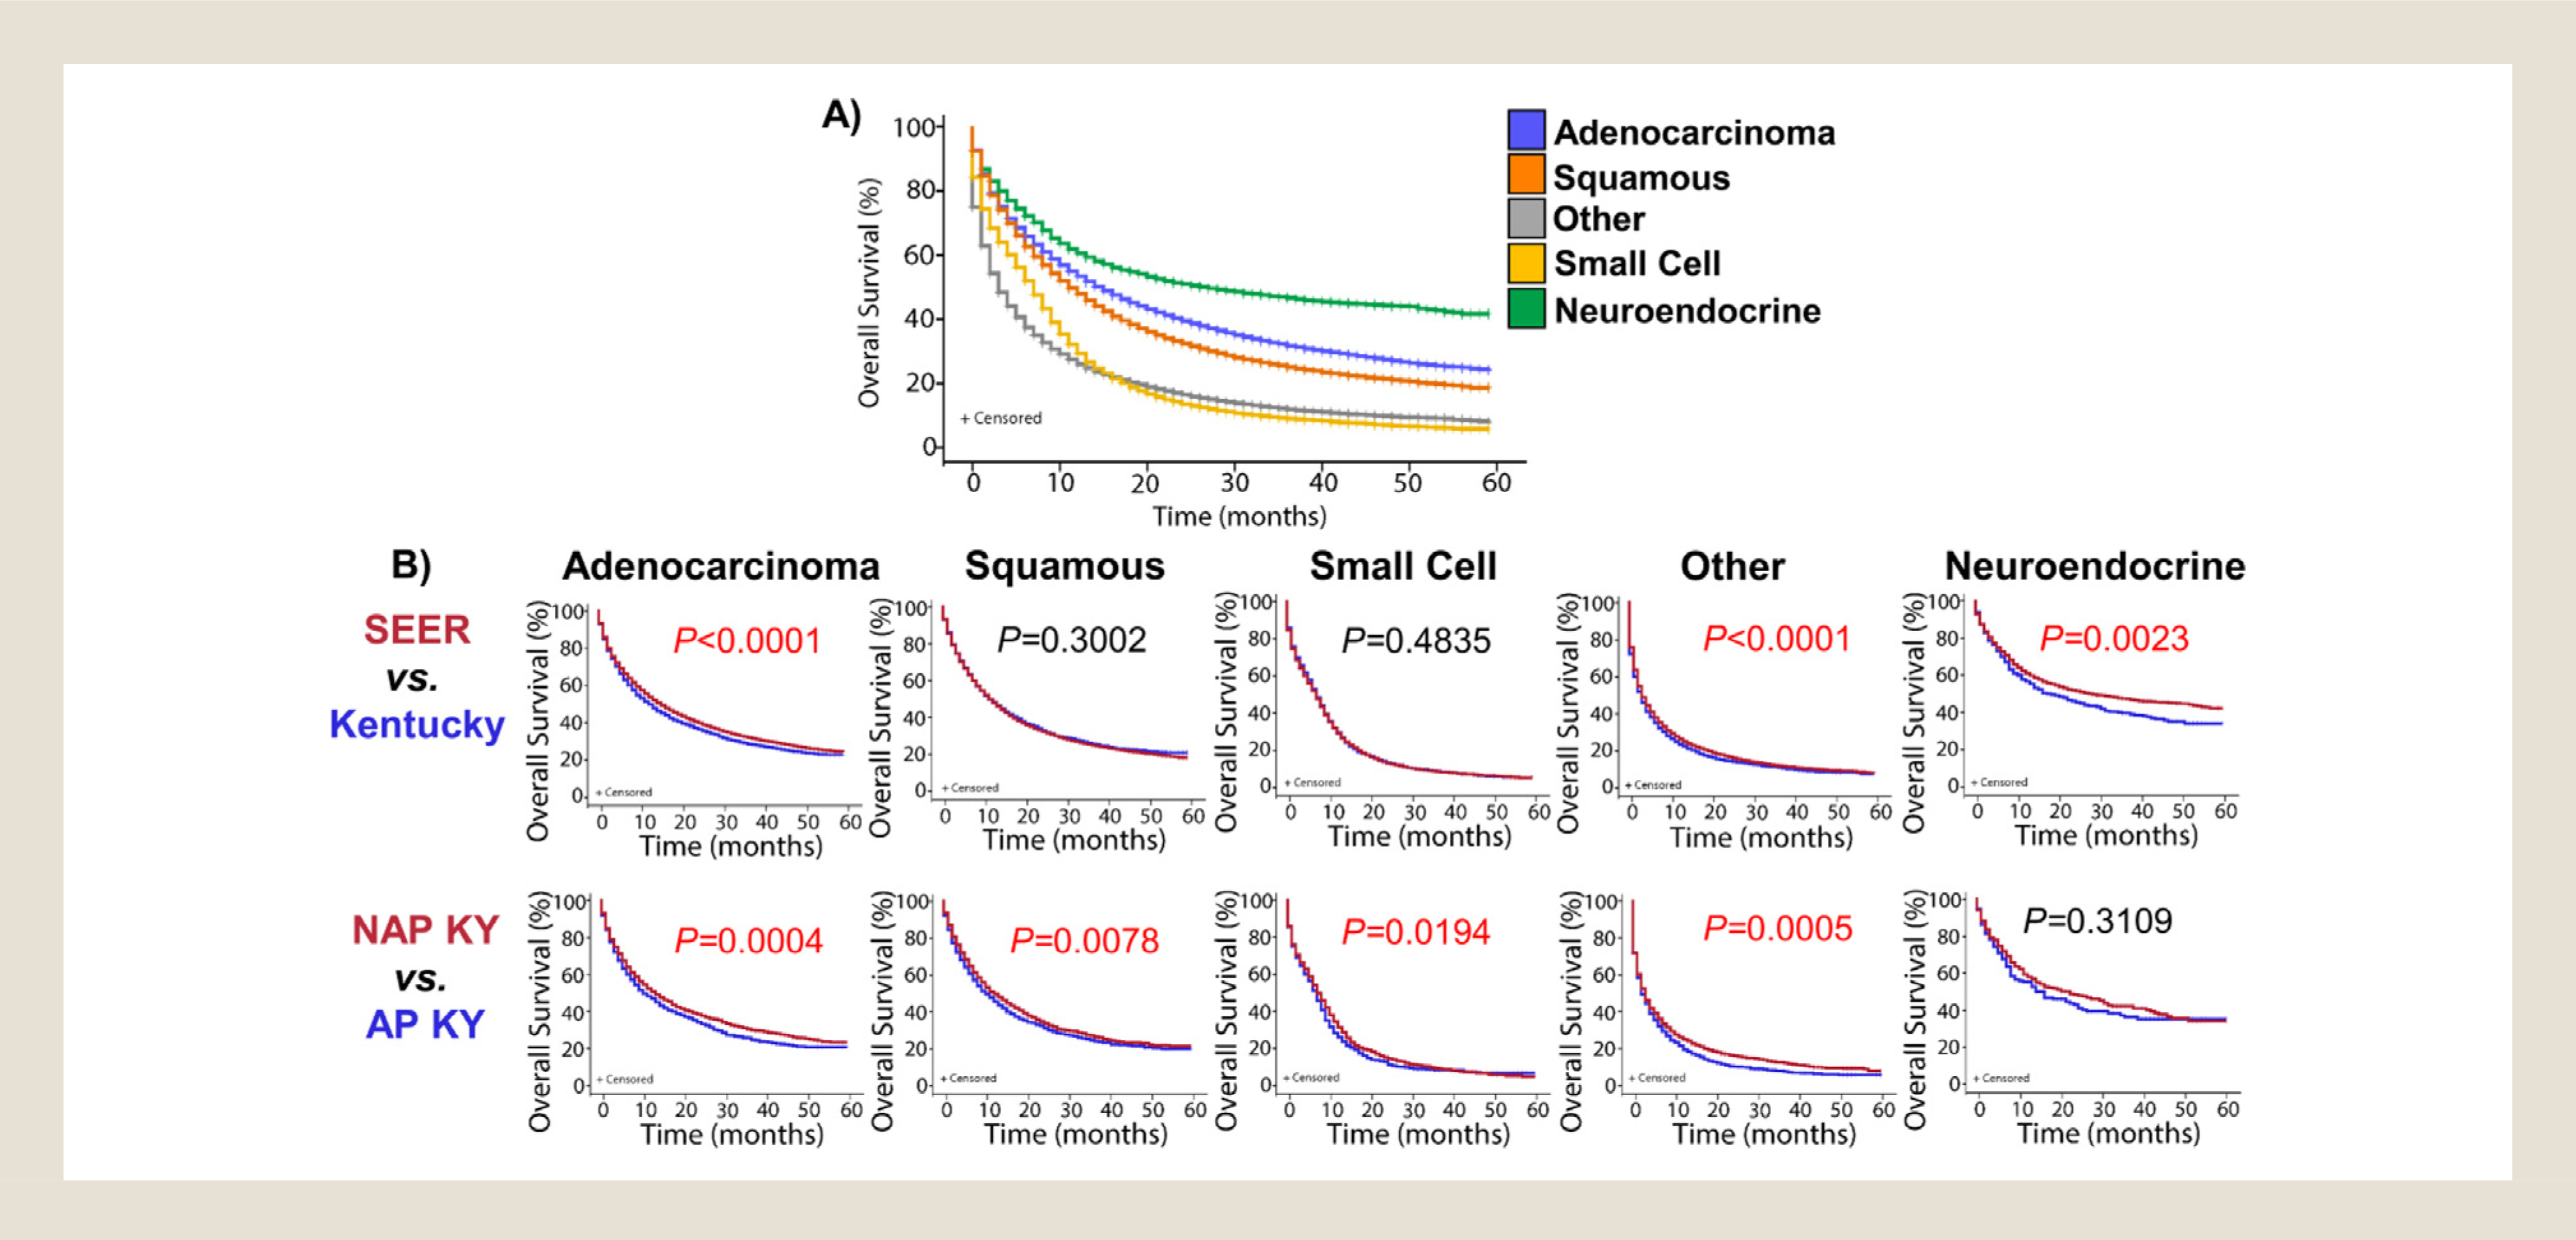
Subtype-specific lung cancer survival rates are often significantly lower in Kentucky. (A) Overall survival of first primary lung malignancies was calculated for each of the 5 major histological subgroups of non–small-cell lung cancer. These data represent the SEER database including Kentucky. (B) Overall survival of first primary lung malignancies was calculated for each of the 5 major histological subgroups of non–small-cell lung cancer. The data were further grouped as either SEER without Kentucky and compared with Kentucky overall, or grouped as only Kentucky and compared Appalachian to non-Appalachian Kentucky. Mantel-Cox log-rank P values are shown, significant P values are in red. SEER = Surveillance, Epidemiology, and End Results database without Kentucky data; NAP KY = non-Appalachian Kentucky; AP KY = Appalachian Kentucky.
Discussion
Although the incidences of all histological subtypes were significantly higher (in both men and women) in Kentucky than in the United States overall (Table 2), the percentages of both squamous cell carcinoma and small-cell lung cancer relative to the total lung cancer burden were strikingly greater among Kentucky residents. These subtypes are almost exclusively associated with smoking. 13 By comparison, although the majority of adenocarcinomas are smoking-related, a sizable and growing proportion of this subtype occurs in never smokers. 14 Importantly, earlier studies have demonstrated the prevalence of small-cell carcinoma in female smokers, 15, 16 and shifts toward higher proportions of squamous cell carcinomas and small-cell lung cancer in “heavy” smokers. 13 Thus the higher incidences of these subtypes and the sex differences observed in Kentucky are likely a direct reflection of tobacco use, 17 which remains higher in Kentucky than nationally despite a downward trend (see Supplemental Figure 2 in the online version at doi: 10.1016/j.cllc.2021.03.007). High tobacco use, including smoking intensity, may also explain the shift from carcinoid to large-cell neuroendocrine carcinomas in Kentucky. 18, 19 Clearly, additional interventions geared toward smoking prevention and cessation will continue to be needed to reduce the lung cancer burden in Kentucky. To this end, Kentucky has implemented the first comprehensive online program to train clinical staff in smoking cessation techniques (https://www.uky.edu/breathe/tobacco-treatment/tobacco-treatment-specialist-training). Interventions including smoke-free ordinances, Kentucky’s Smoking Cessation Quitline, smoking cessation tools available through Medicaid, and initiatives to reduce radon and smoke in homes have all had some success, although challenges for adherence and mitigation remain. 20–23 On a positive note, there is evidence that a majority of Kentuckians support a statewide smoke-free law, and that with continued perseverance, smoking rates can be substantially lowered in our state. 24 For patients with cancer, Markey Cancer Center (MCC) has joined numerous other cancer centers in the National Cancer Institute’s Moonshot Program Quit-Smoking Iniative. 25 Our “Cancer-specific, Assessment, Referral, Engagement and Support” (CARES) Tobacco Treatment Program, has shown strong interest from patients and we hope this interest translates into increased smoking cessation in the near future.
Although the higher smoking rate may be largely responsible for the observed disparities in lung cancer in Kentucky, especially in Appalachian regions, other factors such as genetic, physical, and environmental exposures, as well as interactions between smoking and these factors, may also contribute to the observed disparities. Studies to identify genetic risk factors in Kentucky lung cancer patients are ongoing and have suggested distinct genomic signatures. Because of homogeneous ancestry and geographic isolation, Kentucky, and especially AP KY, are ideal populations for high prevalence of “founder effects” that may influence disease development and outcomes. 26, 27 For example, Appalachia is known for an increased risk for Lynch syndrome with the American Founder Mutation of MSH2 .28 Our previous analyses of lung tumor samples suggested that mutation rates of specific genes in Appalachian patients were different from those in The Cancer Genome Atlas lung cancer patients, 29 also concluding that squamous lung cancer disease progression is genetically different in Kentucky. In addition, evidence from genome-wide association studies of lung cancer suggested that genetic risk factors were differentially associated with specific subtypes of lung cancer. For example, the 5p15 susceptibility locus for lung cancer was more specific to adenocarcinoma, whereas the 6p21 locus was more strongly associated with squamous cell carcinoma. 30 Other genetic susceptibility loci that were found associated with squamous cell carcinoma included common genetic variants at 6p21.33, 12q13.33, 9p21.3, 22q12.1, and 2q32.1, 30, 31 as well as rare genetic variants in the BRCA2 gene on 13q13.1 and in CHEK2 on 22q12.1. 32, 33 With regard to environmental factors, radon, the second leading risk factor for lung cancer, is a likely contributor either independently or synergistically in combination with smoking. Large geographic areas of Kentucky have moderate to high radon potential, and testing of Kentucky households statewide and in Appalachia revealed that 26% to 29% showed radon levels above the Environmental Protection Agency action limit. 34, 35 Other contributing exposures may have been airborne particulates from coal-fired power plants and from surface and underground coal mining. It has also been suggested that elevated exposures to arsenic, nickel and/or chromium could be a contributing factor to the extreme cancer burden in AP KY, although this needs further study. 36, 37 Ongoing research is underway to identify genetic variants associated with increased risks of lung cancer and subtypes in the Kentucky population.
Kentucky is a predominantly rural state, and rural areas face major health care provider shortages, especially in oncologic care. 38 AP KY is particularly geographically isolated, posing challenges to accessing high-quality medical care and likely leading to disparities in stage and diagnosis and ultimately mortality. 39 Other access barriers and contributors to poor survival may include poor socioeconomic status and health literacy. Kentucky’s poverty rate exceeds the national average with 25% of AP KY residents living in poverty compared with 14% in the United States. 10 Of the 55 AP KY counties, 33 have at least 10% of the population living in extreme poverty, which is defined as below 50% of the US poverty level. 10 Another possible contributor to the lower lung cancer survival is the fact that more than 50% of older AP KY residents have at least one disability. 10 Although many patients with lung cancer present with physical and psychological comorbidities, patients with lung cancer in Kentucky are likely to present with very high rates of comorbidities, which can affect treatment tolerability and ultimately survival. 40–44 Finally, the potential influence of lung cancer nihilism and stigma cannot be ignored. Despite the clear evidence for improved survival with early detection and therapeutic advances for advanced stage disease, many health care providers and patients may continue to view lung cancer as a death sentence, which can interfere with diagnosis and treatment. 45 Additional studies are needed to further examine multilevel determinants of poor lung cancer outcomes in Kentucky.
Conclusion
Our findings suggest significant opportunities for multilevel interventions to reduce cancer incidence by targeted prevention, to improve screening for early detection, address barriers for accessing care, improve management of comorbidities, and ensure delivery of guideline-concordant lung cancer care in rural areas. Toward that end, Kentucky is implementing one of the most successful lung cancer screening programs in the United States. 46 Efforts to increase education and increase computed tomography screening for high-risk individuals should detect lung cancers at an earlier stage, facilitate better treatments, and extend patient survival. 47 Although the data presented here were collected before wide-spread immunotherapy use, we suspect that the differences will persist despite this novel therapeutic approach. The University of Kentucky’s MCC has established a network of community-based cancer care facilities across the state and region, many of which are able to conduct behavioral and therapeutic trials. Furthermore, MCC has implemented remote tumor boards, including molecular tumor boards, to provide clinicians in the community with access to precision medicine expertise. 48 These efforts will improve access to high-quality, guideline-concordant lung cancer care in the state and stand to improve future outcomes. Given the unique subtype distributions and genetics of tumors from our state, 29 we have a considerable opportunity for further investigate the genetics of lung cancer development. Therefore MCC is participating in the ORIEN Total Cancer Care protocol, and tumor sequencing results are being compiled with extensive clinical and outcome data. These initiatives will allow Kentucky clinicians and scientists to identify new therapeutic targets and strategies relevant for our patient population.
Clinical Practice Points
For decades it has been recognized that lung cancer is a larger problem in Kentucky than it is nationally, but we lacked details on the exact nature of this disparity.
Here, we performed a detailed analysis of the scale and scope of the lung cancer disparities in Kentucky, and particularly in rural AP KY, by comparing to data from the SEER registry during the 2012 to 2016, 5-year period.
We identified that in Kentucky, the distribution of lung cancer cases is skewed from the national experience by presenting with a significantly larger proportion of squamous cell carcinoma and small-cell carcinoma cases, and a significantly smaller proportion of lung adenocarcinoma cases. Incidence rates for all histologic subtypes of lung cancers were significantly higher in Kentucky than in SEER, and higher in AP KY than in non-Appalachian areas of the state.
Most notably, for AP KY women, the rate of small-cell carcinoma was 3.5-fold higher, and for AP KY men the rate of squamous cell carcinoma was 3.1-fold higher, than the SEER rates.
Finally, lung cancer survival was lower in AP KY for all the major subtypes of lung cancer examined. Although findings from our investigation are distressing, they provide guidance for increased awareness and pursuit of important therapeutic and cancer care deliver y inter ventions for our state.
Supplementary Material
Funding statement
Supported in part by NIGMS P20 GM121327-03, NCI R01 CA237643, American Cancer Society Research Scholar Grant 133123-RSG-19-081-01-TBG, and American Association for Cancer Research Innovation and Discovery Grant (CFB). Also supported by the Biostatistics & Bioinformatics Shared Resource Facility and the Cancer Research Informatics Shared Resource Facility of the University of Kentucky Markey Cancer Center (P30 CA177558). LEM was supported by R03 CA235171 and ACS IRG # 16-182-28.
Footnotes
Disclosure
The authors have stated that they have no conflicts of interest.
Supplementary materials
Supplementary material associated with this article can be found, in the online version, at doi: 10.1016/j.cllc.2021.03.007.
References
- 1.Siegel RL, Miller KD, Jemal A. Cancer statistics, 2020. CA Cancer J Clin. 2020;70:7–30. [DOI] [PubMed] [Google Scholar]
- 2.Bray F, Ferlay J, Soerjomataram I, Siegel RL, Torre LA, Jemal A. Global cancer statistics 2018: GLOBOCAN estimates of incidence and mortality worldwide for 36 cancers in 185 countries. CA Cancer J Clin. 2018;68:394–424. [DOI] [PubMed] [Google Scholar]
- 3.Travis W. Pathology of lung cancer. Clin Chest Med. 2011;32:669–692. [DOI] [PubMed] [Google Scholar]
- 4.Davidson MR, Gazdar AF, Clarke BE. The pivotal role of pathology in the management of lung cancer. J Thorac Dis. 2013;5(Suppl 5):S463–S478. [DOI] [PMC free article] [PubMed] [Google Scholar]
- 5.WONDER_Online_Database. United States Cancer Statistics–Incidence: 1999–2016, WONDER Online Database. United States Department of Health and Human Services, Centers for Disease Control and Prevention and National Cancer Institute; 2019. http://wonder.cdc.gov/cancer-v2016.html [Accessed 22 April 2020]. [Google Scholar]
- 6.Christian WJ, Huang B, Rinehart J, Hopenhayn C. Exploring geographic variation in lung cancer incidence in Kentucky using a spatial scan statistic: elevated risk in the Appalachian coal-mining region. Public Health Rep. 2011;126:789–796. [DOI] [PMC free article] [PubMed] [Google Scholar]
- 7.Rodriguez SD, Vanderford NL, Huang B, Vanderpool RC. A social-ecological review of cancer disparities in Kentucky. South Med J. 2018;111:213–219. [DOI] [PMC free article] [PubMed] [Google Scholar]
- 8.Christian WJ, Vanderford NL, McDowell J, et al. Spatiotemporal analysis of lung cancer histological types in Kentucky, 1995–2014. Cancer Control. 2019;26. [DOI] [PMC free article] [PubMed] [Google Scholar]
- 9.Jenkins WD, Lipka AE, Fogleman AJ, Delfino KR, Malhi RS, Hendricks B. Variance in disease risk: rural populations and genetic diversity. Genome. 2016;59:519–525. [DOI] [PubMed] [Google Scholar]
- 10.Pollard K, Jacobsen LA. The Appalachian region: a data overview from the 2014–2018 American Community Survey. Population Reference Bureau. 2020. https://www.arc.gov/wp-content/uploads/2020/08/DataOverviewfrom2014to2018ACS.pdf. [Accessed 21 July 2020].
- 11.Yao N, Alcalá HE, Anderson R, Balkrishnan R. Cancer disparities in rural Appalachia: incidence, early detection, and survivorship. J Rural Health. 2017;33:375–381. [DOI] [PubMed] [Google Scholar]
- 12.SEER ∗Stat_Database. Surveillance, Epidemiology, and End Results (SEER) Program (https://seer.cancer.gov/data/citation.html) SEER ∗Stat Database: Incidence - SEER 21 Regs Limited-Field Research Data + Hurricane Katrina Impacted Louisiana Cases, Nov 2018 Sub (2000–2016) < Katrina/Rita Population Adjustment>- Linked To County Attributes - Total U.S., 1969–2017 Counties, National Cancer Institute, DCCPS, Surveillance Research Program. May 5, 2020. [Google Scholar]
- 13.Pesch B, Kendzia B, Gustavsson P, et al. Cigarette smoking and lung cancer–relative risk estimates for the major histological types from a pooled analysis of case–control studies. Int J Cancer. 2012;131:1210–1219. [DOI] [PMC free article] [PubMed] [Google Scholar]
- 14.Sun S, Schiller JH, Gazdar AF. Lung cancer in never smokers–a different disease. Nat Rev Cancer. 2007;7:778–790. [DOI] [PubMed] [Google Scholar]
- 15.Osann KE, Anton-Culver H, Kurosaki T, Taylor T. Sex differences in lung-cancer risk associated with cigarette smoking. Int J Cancer. 1993;54:44–48. [DOI] [PubMed] [Google Scholar]
- 16.Zang EA, Wynder EL. Differences in lung cancer risk between men and women: examination of the evidence. J Natl Cancer Inst. 1996;88:183–192. [DOI] [PubMed] [Google Scholar]
- 17.Doogan NJ, Roberts ME, Wewers ME, et al. A growing geographic disparity: rural and urban cigarette smoking trends in the United States. Prev Med. 2017;104:79–85. [DOI] [PMC free article] [PubMed] [Google Scholar]
- 18.Caplin ME, Baudin E, Ferolla P, et al. Pulmonary neuroendocrine (carcinoid) tumors: European Neuroendocrine Tumor Society expert consensus and recommendations for best practice for typical and atypical pulmonary carcinoids. Ann Oncol. 2015;26:1604–1620. [DOI] [PubMed] [Google Scholar]
- 19.Derks JL, Leblay N, Lantuejoul S, Dingemans AC, Speel EM, Fernandez-Cuesta L. New insights into the molecular characteristics of pulmonary carcinoids and large cell neuroendocrine carcinomas, and the impact on their clinical management. J Thorac Oncol. 2018;13:752–766. [DOI] [PubMed] [Google Scholar]
- 20.Hahn EJ, Rayens MK, Wiggins AT, Gan W, Brown HM, Mullett TW. Lung cancer incidence and the strength of municipal smoke-free ordinances. Cancer. 2018;124:374–380. [DOI] [PubMed] [Google Scholar]
- 21.Pauly N, Talbert J, Parsley S, Gray B, Hahn EJ. Kentucky’s Smoking Cessation Quitline: annual estimated return on investment to employers. Am J Health Promot. 2019;33:285–288. [DOI] [PubMed] [Google Scholar]
- 22.Goodin A, Talbert J, Freeman PR, Hahn EJ, Fallin-Bennett A. Appalachian disparities in tobacco cessation treatment utilization in Medicaid. Subst Abuse Treat Prev Policy. 2020;15:5. [DOI] [PMC free article] [PubMed] [Google Scholar]
- 23.Hahn EJ, Wiggins AT, Rademacher K, Butler KM, Huntington-Moskos L, Rayens MK. FRESH: long-term outcomes of a randomized trial to reduce radon and tobacco smoke in the home. Prev Chronic Dis. 2019;16:E127. [DOI] [PMC free article] [PubMed] [Google Scholar]
- 24.Ickes MJ, Butler K, Wiggins AT, Rayens MK, Hahn EJ. Support for tobacco 21 in a tobacco-growing state. West J Nurs Res. 2019;41:1203–1215. [DOI] [PubMed] [Google Scholar]
- 25.D’Angelo H, Rolland B, Adsit R, et al. Tobacco treatment program implementation at NCI Cancer Centers: progress of the NCI Cancer Moonshot-Funded Cancer Center Cessation Initiative. Cancer Prev Res. 2019;12:735–740. [DOI] [PubMed] [Google Scholar]
- 26.Price AL, Helgason A, Palsson S, et al. The impact of divergence time on the nature of population structure: an example from Iceland. PLoS Genet. 2009;5. [DOI] [PMC free article] [PubMed] [Google Scholar]
- 27.Lewis R. Finding the famous painting of the blue people of Kentucky. PLoS Blogs DNA Science. 2016. https://dnascience.plos.org/2016/09/22/finding-the-famous-painting-of-the-blue-people-of-kentucky/. [Accessed 19 Aug 2020]. [Google Scholar]
- 28.Lynch HT, Coronel SM, Okimoto R, et al. A founder mutation of the MSH2 gene and hereditary nonpolyposis colorectal cancer in the United States. JAMA. 2004;291:718–724. [DOI] [PubMed] [Google Scholar]
- 29.Liu J, Murali T, Yu T, et al. Characterization of squamous cell lung cancers from Appalachian Kentucky. Cancer Epidemiol Biomarkers Prev. 2019;28:348–356. [DOI] [PMC free article] [PubMed] [Google Scholar]
- 30.Timofeeva MN, Hung RJ, Rafnar T, et al. Influence of common genetic variation on lung cancer risk: meta-analysis of 14 900 cases and 29 485 controls. Hum Mol Genet. 2012;21:4980–4995. [DOI] [PMC free article] [PubMed] [Google Scholar]
- 31.McKay JD, Hung RJ, Han Y, et al. Large-scale association analysis identifies new lung cancer susceptibility loci and heterogeneity in genetic susceptibility across histological subtypes. Nature Genet. 2017;49:1126–1132. [DOI] [PMC free article] [PubMed] [Google Scholar]
- 32.Wang Y, McKay JD, Rafnar T, et al. Rare variants of large effect in BRCA2 and CHEK2 affect risk of lung cancer. Nature Genet. 2014;46:736–741. [DOI] [PMC free article] [PubMed] [Google Scholar]
- 33.Brennan P, McKay J, Moore L, et al. Uncommon CHEK2 mis-sense variant and reduced risk of tobacco-related cancers: case–control study. Hum Mol Genet. 2007;16:1794–1801. [DOI] [PubMed] [Google Scholar]
- 34.Hahn EJ, Rayens MK, Kercsmar SE, et al. Dual home screening and tailored environmental feedback to reduce radon and secondhand smoke: an exploratory study. J Environ Health. 2014;76:156–161. [PubMed] [Google Scholar]
- 35.Stanifer SR, Rayens MK, Wiggins A, Gross D, Hahn EJ. Home radon testing in rural Appalachia [e-pub ahead of print]. J Rural Health. 2020. doi: 10.1111/jrh.12552. [DOI] [PMC free article] [PubMed] [Google Scholar]
- 36.Unrine JM, Slone SA, Sanderson W, et al. A case-control study of trace-element status and lung cancer in Appalachian Kentucky. PLoS One. 2019;14. [DOI] [PMC free article] [PubMed] [Google Scholar]
- 37.Johnson N, Shelton BJ, Hopenhayn C, et al. Concentrations of arsenic, chromium, and nickel in toenail samples from Appalachian Kentucky residents. J Environ Pathol Toxicol Oncol. 2011;30:213–223. [DOI] [PMC free article] [PubMed] [Google Scholar]
- 38.Zahnd WE, Ganai S. Access to cancer care in rural populations: barriers and solutions. ASCO Daily News; 2019. [Google Scholar]
- 39.Ramalingam S, Dinan MA,, Crawford J. Survival comparison in patients with stage IV lung cancer in academic versus community centers in the United States. J Thorac Oncol. 2018;13:1842–1850. [DOI] [PubMed] [Google Scholar]
- 40.Lilenbaum RC, Cashy J, Hensing TA, Young S,, Cella D. Prevalence of poor performance status in lung cancer patients: implications for research. J Thorac Oncol. 2008;3:125–129. [DOI] [PubMed] [Google Scholar]
- 41.Yi YS, Ban WH,, Sohng KY. Effect of COPD on symptoms, quality of life and prognosis in patients with advanced non-small cell lung cancer. BMC Cancer. 2018;18:1053. [DOI] [PMC free article] [PubMed] [Google Scholar]
- 42.Young RP, Hopkins RJ, Christmas T, et al. COPD prevalence is increased in lung cancer, independent of age, sex and smoking history. Eur Respir J. 2009;34:380–386. [DOI] [PubMed] [Google Scholar]
- 43.Loganathan RS, Stover DE, Shi W,, Venkatraman E. Prevalence of COPD in women compared to men around the time of diagnosis of primary lung cancer. Chest. 2006;129:1305–1312. [DOI] [PubMed] [Google Scholar]
- 44.Zabora J, BrintzenhofeSzoc K, Curbow B, Hooker C,, Piantadosi S. The prevalence of psychological distress by cancer site. Psychooncology. 2001;10:19–28. [DOI] [PubMed] [Google Scholar]
- 45.Hamann HA, Ver Hoeve ES, Carter-Harris L, Studts JL,, Ostroff JS. Multilevel opportunities to address lung cancer stigma across the cancer control continuum. J Thorac Oncol. 2018;13:1062–1075. [DOI] [PMC free article] [PubMed] [Google Scholar]
- 46.Fedewa SA, Kazerooni EA, Studts JL, et al. State Variation in Low-Dose CT Scanning for Lung Cancer Screening in the United States. J Natl Cancer Inst. 2020. Epub ahead of print. doi: 10.1093/jnci/djaa170. [DOI] [PMC free article] [PubMed] [Google Scholar]
- 47.Cardarelli R, Reese D, Roper KL, et al. Terminate lung cancer (TLC) study–a mixed-methods population approach to increase lung cancer screening awareness and low-dose computed tomography in Eastern Kentucky. Cancer Epidemiol. 2017;46:1–8. [DOI] [PMC free article] [PubMed] [Google Scholar]
- 48.Nichols D, Arnold S, Weiss HL, et al. Pharmacogenomic potential in advanced cancer patients. Am J Health Syst Pharm. 2019;76:415–423. [DOI] [PMC free article] [PubMed] [Google Scholar]
Associated Data
This section collects any data citations, data availability statements, or supplementary materials included in this article.