

Abstract
Disorders of blood vessels cause a range of severe health problems. As a powerful vasodilator and cellular second messenger, nitric oxide (NO) is known to have beneficial vascular functions. But NO typically has a short half-life and is not specifically targeted. On the other hand, high-density lipoproteins (HDLs) are targeted natural nanoparticles that transport cholesterol in the systemic circulation, and whose protective effects in vascular homeostasis overlap with those of NO. Evolving the AuNP-templated HDL-like nanoparticles (HDL NPs), a platform of bio-inspired HDL, we set up a targeted biomimetic nanotherapy for vascular disease that combines the functions of NO and HDL. A synthetic S-nitrosylated (SNO) phospholipid (DPPNOTE) was synthesized and assembled with S-containing phospholipids and the principal protein of HDL, apolipoprotein A-I, to construct NO-delivering HDL-like particles (SNO HDL NPs). SNO HDL NPs self-assemble under mild conditions similar to natural processes, avoiding the complex post assembly modification needed for most synthetic NO-release nanoparticles. In vitro data demonstrate that the SNO HDL NPs merge the functional properties of NO and HDL into a targeted nanocarrier. Also, SNO HDL NPs were demonstrated in vivo to reduce ischemia / reperfusion injury in a mouse kidney transplant model and atherosclerotic plaque burden in a mouse model of atherosclerosis. Thus, the synthesis of SNO HDL NPs provides not only a bio-inspired nanotherapy for vascular disease, but also a foundation to construct diversified multifunctional platforms based on HDL NPs in the future.
Keywords: nitric oxide-delivering, high-density lipoprotein-like nanoparticles, biomimetic, nanotherapy, vascular disease, S-nitrosylation
Graphical Abstract

Introduction
Vascular disorders, including atherosclerotic cardiovascular disease and ischemia / reperfusion injury (IRI), cause a range of health problems, which can be severe or prove fatal.1 Current therapeutic options, including cholesterol-lowering drugs, such as 3-hydroxy methyl coenzyme-A reductase inhibitors (i.e. statins), to combat cardiovascular disease, and anti-oxidants to mitigate IRI, have demonstrated some successes; however, vascular disorders remain a leading cause of mortality, in both the US and worldwide.1 New therapies are urgently needed. As a powerful vasodilator and cellular signaling second messenger, nitric oxide (NO) has demonstrated vasoprotective effects.2–6 However, as a gaseous radical species, it is extremely difficult to directly deliver NO in vivo,7–11 with inhaled NO currently only indicated for hypoxic respiratory failure in infants with severe persistent pulmonary hypertension. Notably, free small molecule nitrosothiols (RSNOs), typified endogenously by S-nitrosylated glutathione (GSNO), can act as transporters of NO, but, like other small molecule NO donors, can still suffer from short half-lives and ineffective delivery.7–11 As such, researchers have employed various proteins, polymers and nanoparticles in an effort to improve the biodistribution patterns and pharmacokinetic properties of NO donors.7–8 Nevertheless, challenges still remain for NO-scaffolds, including: 1) Poor targeting properties that result from interactions with serum proteins and physiological barriers in the body, leading to rapid systemic clearance; and, 2) Complex, post-assembly modifications required to incorporate the NO-delivering moiety.7 Conversely, high-density lipoproteins (HDLs) are dynamic, natural nanoparticles that transport cholesterol in the systemic circulation.12–14 Due to their small size, long circulating half-lives, high payload of various lipids, proteins, and microRNAs, and receptor-mediated targeting, both native human and synthetic HDLs have been investigated as nanocarriers in targeted delivery, displaying superior biocompatibility and pharmacokinetic profiles compared to other synthetic nanoparticles.13–17 Additionally, it should be noted that HDLs and NO both have inherent vasoprotective effects. 2–6, 9, 13–17 This overlap in function motivated us to develop a novel, HDL-like nanoparticle capable of delivering therapeutically relevant doses of NO for vascular disorders.
At the mesoscopic scale, synthetic nanocrystals illustrate diverse physical and chemical properties, while biomolecules have unique and specific bioactivities and targeting.18–19 Combining nanocrystals with biomolecules is an efficient way to merge the special properties of the component parts to construct smart materials and devices.18–19 Following this, we have previously reported on the synthesis of gold nanoparticle (AuNP)-templated HDL-like nanoparticles (HDL NPs), consisting of a 5 nm AuNP core surface-functionalized with the HDL-defining apolipoprotein A-I (Apo AI) and a phospholipid bilayer, whereby the HDL NPs mimic mature, spherical HDL in many regards, including some physiological functions (Figure 1).20–21 In HDL NPs, the phospholipid bilayer is composed of a disulfide-containing inner phospholipid [1,2-dipalmitoyl-sn-glycero-3-phosphoethanolamine-N-[3-(2-pyridyldithio)propionate] (PDP PE)], and an outer phospholipid [1,2-dipalmitoyl-sn-glycero-3-phosphocholine (DPPC)] that is commonly found in natural HDLs. Functional data demonstrate that HDL NPs engage each of the receptors responsible for cellular cholesterol flux by HDLs. Thus, HDL NPs modulate cholesterol homeostasis and may have therapeutic applications in disorders of cholesterol accumulation, including lymphoma, leukemia, and other indications.21–30 More specifically, HDL NPs actively target scavenger receptor type B-1 (SR-B1) expressed by various cells native to arteries, such as macrophages and smooth muscle cells.21, 25 Further, HDL NPs have been used as nanocarriers for different therapeutic molecules, such as nucleic acids, and have also been shown to sequester lipopolysaccharides and reduce inflammation.23–24, 28–29 Therefore, we hypothesized that HDL NPs could act as a targeted NO delivery agent through incorporation of an S-nitrosylated phospholipid, and that NO-loaded HDL NPs would have a beneficial effect on acute and chronic vascular diseases (Figure 1).
Figure 1.
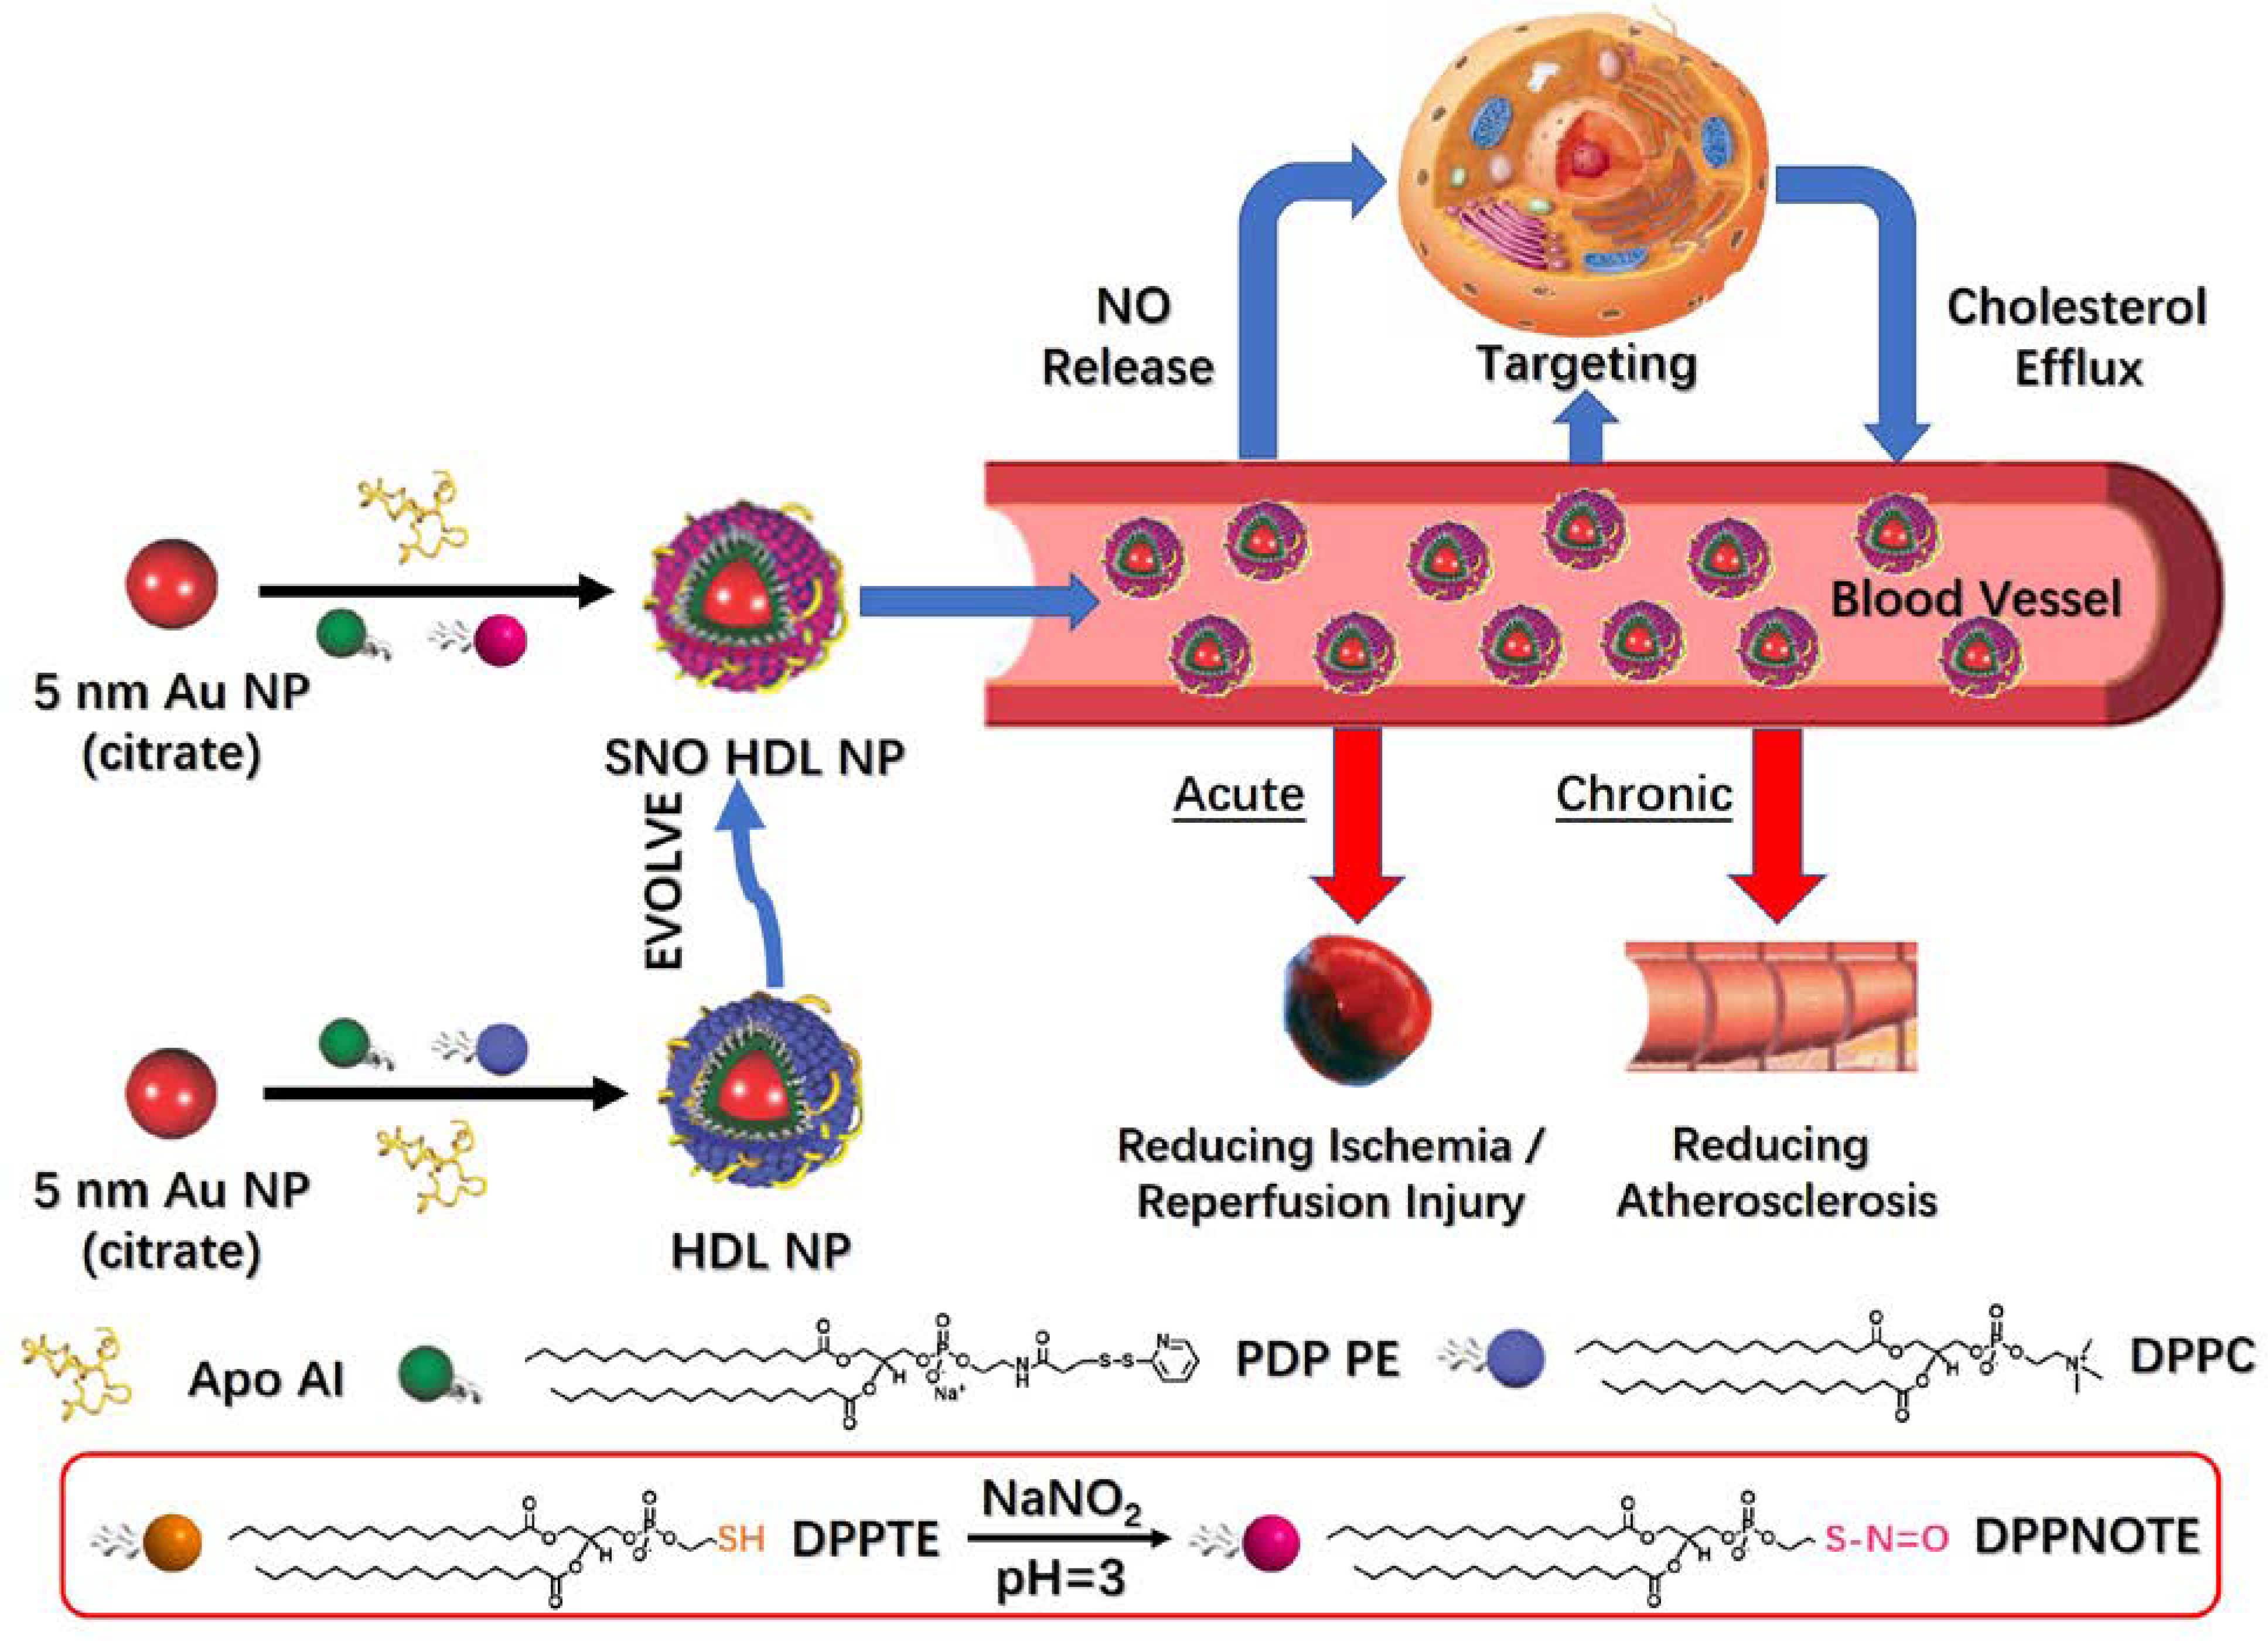
Preparation, properties and functions of SNO HDL NPs.
In this proof-of-concept work (Figure 1), we synthesized and characterized the S-nitrosylation of a commercially available thiol-containing phospholipid DPPTE (1,2-dipalmitoyl-sn-glycero-3-phosphothioethanol) to DPPNOTE (1,2-dipalmitoyl-sn-glycero-3-phosphonitrosothioethanol). DPPNOTE was then successfully incorporated into the HDL NP synthesis yielding SNO HDL NPs via self-assembly under mild conditions. In vitro, SNO HDL NPs stably incorporate NO for targeted delivery to cells of the arterial vasculature while maintaining their inherent cholesterol sequestration properties. In vivo data demonstrate that SNO HDL NPs can be administered systemically to reduce IRI and atherosclerotic plaque burden in appropriate murine models as demonstration of their utility for vascular disease.
Results and Discussions
Preparation and Characterization of SNO HDL NPs
As mentioned above, free small molecule RSNOs suffer from short half-lives and inefficient delivery. To resolve these problems, we incorporated an S-nitrosylated phospholipid into the synthesis of HDL NPs. As such, we first synthesized DPPNOTE with a widely used approach for forming RSNOs6 (Experimental Section, Figure 1): DPPTE was employed as the parent thiol to react with acidified NaNO2 (pH=3) in a 20 % (V/V) ethanol aqueous solution. Fourier-transform infrared (FTIR) and Raman spectra (Figures 2A–B) both show disappearance of the –SH stretching vibration (~ 2564 cm−1)31 and appearance of –N=O (~ 1523 cm−1) corresponding to the R–S–N=O moiety32–33 in the product when compared to DPPTE. As Figure 2C shows, the product turns to pink from white (DPPTE) in color, similarly to S-nitrosoglutathione (GSNO), a small molecule RSNO (reddish-pink powder). Its UV-Vis bands correspond well to ordinary RSNOs (Figure 2C):8 a very strong narrow UV band in the ~ 200 – 250 nm region (attributed to the allowed π → π* transition), but tangling with the UV band of phospholipid; a strong broad UV band in the ~300 – 400 nm region, attributed to the allowed n0 → π* transition, and a weak visible band in the ~500 – 600 nm region, attributed to the forbidden nN → π* transition and color of RSNOs. Electrospray ionization-time of flight-mass spectroscopy (ESI-TOF-MS) is a useful approach to analyze intact RSNOs and phospholipids.33–34 When characterized by ESI-TOF-MS in the positive ion mode, a dominant peak at ~m/z 754 is demonstrated in the product (Figure 2D), which we ascribe to the molecular ion, [DPPNOTE + NH3]+. Compared to DPPTE, with a dominant peak at ~m/z 725 (Figure 2D), the molecular ion [DPPTE + NH3]+, there is a difference of ~29, corresponding to substitution of –H in the thiol group in DPPTE by –N=O in DPPNOTE. Data from Ellman’s assay,35–36 which measures free thiols, suggests that 77.0 ± 0.2% of the –SH groups have been reduced. Taken together, these data clearly demonstrate the formation of the S-nitrosothiol group in DPPNOTE.
Figure 2.
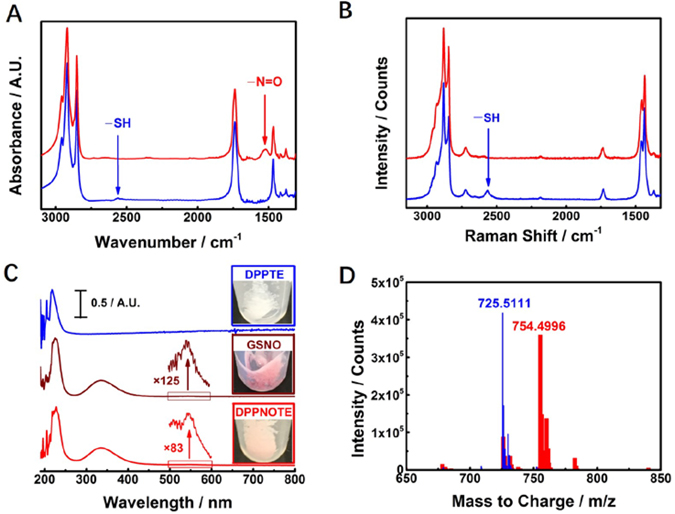
Characterization of DPPNOTE. A) FTIR spectra of DPPTE (blue solid-line) and DPPNOTE (red solid-line). B) Raman spectra of DPPTE (blue solid-line) and DPPNOTE (red solid-line). C) Normalized UV-Vis spectra of DPPTE (blue solid-line with an inlet of a picture of DPPTE powder), GSNO [brown solid-line with inlets of a magnified spectrum (by 125 folds) ranged from 500 ~ 600 nm and a picture of GSNO powder] and DPPNOTE [red solid-line with inlets of a magnified spectrum (by 83 folds) ranged from 500 ~ 600 nm and a picture of DPPNOTE powder]. D) Mass spectra of DPPTE (narrow blue bars, the dominant peak ascribe to the molecular ion, [DPPTE + NH3]+) and DPPNOTE (broad red bars, the dominant peak ascribe to the molecular ion, [DPPNOTE + NH3]+).
SNO HDL NPs were then prepared using the standard method for synthesis of HDL NPs (Experimental Section, Figure 1). As most S-nitrosothiol preparations,37 the preparation of DPPNOTE was used directly to replace DPPC after synthesis from DPPTE without purification. Any unreacted molecules were separated from the assembled SNO HDL NPs by tangential flow filtration (Experimental Section). We employed the Griess assay11 and Ellman’s assay35–36 to measure the loading of DPPNOTE and DPPTE on SNO HDL NPs, respectively. Data reveal that there are 22.74 ± 0.86 DPPNOTE molecules and 57.47 ± 4.11 DPPTE molecules per SNO HDL NP (Experimental Section). The percentage of DPPNOTE molecules located at the outer surface of an SNO HDL NP is about 30%, which is lower than the amount of DPPNOTE in the preparation (77.0 ± 0.2%). As shown in Figure 1, the unreacted parent thiol, DPPTE, in the DPPNOTE preparation has a relatively small headgroup. As such, the reduced loading of the DPPNOTE versus unreacted DPPTE may be because DPPTE is more competitive in forming the phospholipid bilayer structure when compared to DPPNOTE.38 The total number of phospholipids in the outer layer of the bilayer in an SNO HDL NP (80.21 ± 4.97) is close to that of DPPC in the outer layer of the bilayer in an HDL NP (85.56 ± 4.61, measured by Phospholipid Assay Kit, Experimental Section). Meanwhile, the number of Apo AI per nanoparticle, quantified using 3H-labeled Apo AI, for the SNO HDL NP is 3.44 ± 0.07, which was similar to the Apo AI content of our standard HDL NPs (3.39 ± 0.16 Apo AI per nanoparticle; p = 0.641). In terms of surface charge (zeta potential), SNO HDL NPs were significantly more negative when compared to HDL NPs (Figure 3A, −60.3 mV ± 1.3 mV vs. −46.3 mV ± 2.1 mV; p=0.0006). From Figure 1, both DPPNOTE and DPPTE are negatively charged lipids, while DPPC is a neutral lipid due to its zwitterion. The more negative charge of SNO HDL NPs further supports replacement of DPPC by the mixed phospholipids from the preparation of DPPNOTE. Figure 3B shows that both SNO HDL NPs and HDL NPs have a plasmon extinction maximum of the core AuNP at ~525 nm. The same red shift of ~11 nm relative to bare AuNP (with a plasmon extinction maximum of ~ 514 nm) supports the assembly of phospholipid bilayers and Apo AI on AuNPs in SNO HDL NPs similar to HDL NPs.21 SNO HDL NPs (13.12 nm ± 0.65 nm) were similar in size, measured by dynamic light scattering (DLS), to HDL NPs (13.52 nm ± 0.13 nm). Since NO-donors are very sensitive to environmental factors, the morphology of SNO HDL NPs was measured under the mild condition by atomic force microscope (AFM). From Figure 3C, AFM images show that both SNO HDL NPs and HDL NPs are sphere-like particles.
Figure 3.
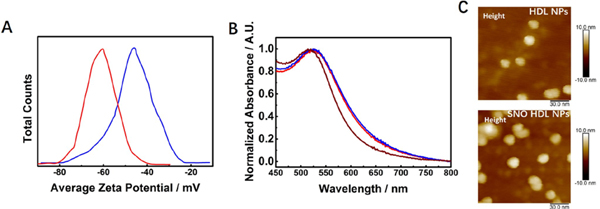
Characterization of SNO HDL NPs. A) Zeta potentials of HDL NPs (blue solid-line) and SNO HDL NPs (red solid-line). B) Normalized UV-Vis spectra of bare 5 nm AuNPs (brown solid-line), HDL NPs (blue solid-line) and SNO HDL NPs DPPTE (red solid-line). C) AFM images of HDL NPs and SNO HDL NPs.
To assay the biocompatibility of SNO HDL NPs to cells targeted in the arterial vasculature after intravenous administration of the particles, we characterized the toxicity of SNO HDL NPs to three cell types: human aortic endothelial cells (HAEC), human aortic smooth muscle cells (AoSMC), and human macrophages (THP-1). Both HDL NPs and SNO HDL NPs displayed no toxicity, measured using the MTS assay (Experimental Section), following 72-hour incubation with the various cell types (Figure S1).
Many synthetic nanoparticles are prepared under harsh conditions whereby mechanical or chemical energy is required.39 However, NO and NO-donors are very sensitive to their environment. Hence, complex post assembly modification has to be employed to load NO or NO-donors to synthetic nanoparticles.7 For instance, many NO-delivering synthetic nanoparticles require exposure to NO gas with a high pressure of 5 atm for days.7 In contrast, the synthesis of SNO HDL NPs is accomplished under mild conditions through natural self-assembly processes. As such, complex post assembly modification can be avoided during the preparation of SNO HDL NPs.
SNO HDL NPs as NO-Scaffolds
The therapeutic consequence of NO-based drugs strongly depends on the concentration and duration of NO delivered. 7,10 Most NO donors are unstable. As such, the stability and NO release kinetics of any NO delivery agent are critically important.8–9 To quantify the release kinetics of NO from SNO HDL NPs, the particles and free DPPNOTE were incubated at 37oC, and NO release quantified using the Griess assay11 over time (Experimental Section). NO release from SNO HDL NPs occurred in three stages: 1) An initial rapid release (the first 2 hours), 2) A reduced release pattern occurring over 2–7 hours, and 3) An even further reduced rate of NO release observed over 7–24 hours. Ultimately, 80.53% ± 9.90% of NO was released at 24 hours Figure 4A). Free DPPNOTE demonstrated burst release of NO, which was much more rapid than NO release from SNO HDL NPs. At 4 hours, most of NO (93.29% ± 5.88%) was released from free DPPNOTE, compared to 33.16% ± 2.74% released from SNO HDL NPs (Figure 4A). Thermal decomposition of RSNO occurs in two steps:8 1) Homolytic cleavage of the S–NO bond to form an NO and thiyl radical; and, 2) dimerization of thiyl radical to form disulfide (RSSR). The second step is a sterically controlled process.8 With smaller steric hindrance, the thiyl radicals more easily dimerize, which leads to faster RSNO decomposition. In SNO HDL NPs, DPPNOTE and DPPTE molecules pack with S-containing phospholipids anchored on the AuNP and forming the lipid bilayer, which restricts their freedom relative to free DPPNOTE. Further, Apo AI also remarkably improves the ordering of the particle bound phospholipid bilayer, additionally restricting the freedom of movement of DPPNOTE in the bilayer.38 Both contribute to the stability of the SNO groups in SNO HDL NPs.
Figure 4.
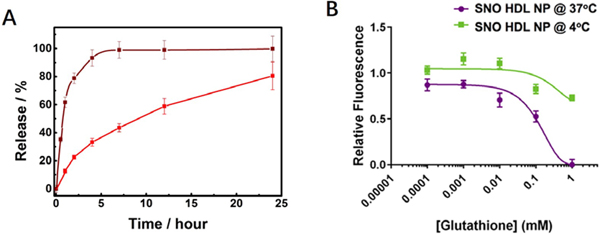
In vitro characterization of NO Release from SNO HDL NPs. A) NO release from SNO HDL NPs (red solid-line) and DPPNOTE (brown solid-line) at 37oC. B) GSH -induced NO release from SNO HDL NPs at 4 °C and 37 °C.
In the presence of an NO acceptor, such as the physiologically relevant glutathione (GSH),40–41 SNO HDL NPs released NO in a temperature- and acceptor concentration-dependent manner, with near complete release observed at 37oC with a 125 fold molar excess of GSH, a physiologically relevant concentration of the NO acceptor, relative to the SNO content of SNO HDL NP (Figure 4B). Minimal release was observed at 4oC, suggesting that the NO bound to SNO HDL NPs remains stably bound at low temperatures.
SNO HDL NPs as Targeted Nanocarriers to Deliver NO
As previously discussed, targeted delivery is a critical property of any NO-loaded nanoparticle construct. The HDL NPs actively target SR-B1,21, 25 which is a receptor expressed by arterial cells such as macrophages. First, THP-1 cells were treated with HDL NPs fluorescently labeled with the intercalating dye DiI42–44 (DiI HDL NPs), in addition to either unlabeled HDL NPs or SNO HDL NPs for 2 hours, followed by flow cytometric analysis. DiI HDL NPs alone increased fluorescence of THP-1 cells compared to saline control [median fluorescent intensity (MFI) = 6554 ± 268 for DiI HDL NP vs. 835 ± 3 for PBS control; Figure 5A]. Addition of either unlabeled HDL NPs or SNO HDL NPs decreased the MFIs, and the SNO HDL NPs (MFI = 2784 ± 119) demonstrating a greater decrease, which indicates stronger binding as compared to HDL NPs (MFI = 3896 ± 374; p=0.002; Figure 5A).
Figure 5.
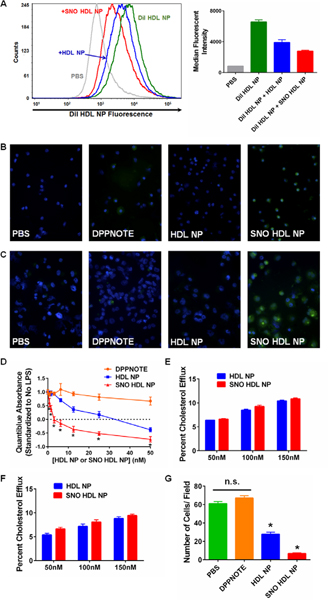
In vitro characterization of SNO HDL NP delivery of NO and function. A) Competitive binding of SNO HDL NPs and HDL NPs to macrophage cells. Left- representative histogram of DiI HDL NP fluorescence of THP-1 cells treated with DiI HDL NPs alone, or in combination with unlabeled HDL NPs or SNO HDL NPs. Right- median fluorescent intensities for each treatment group. B, C) Release of NO to J774 macrophages (B) and differentiated THP-1 macrophages (C) treated with DAF FM diacetate. From left to right: PBS, DPPNOTE (2 μM), HDL NP (25 nM), and SNO HDL NP (25 nM). Green- DAF FM diacetate. Blue- nuclei (DAPI). Images taken at 40X magnification. D) Quantiblue assay of THP-1 Dual cells treated with 5ng/ mL LPS and increasing concentrations of DPPNOTE, HDL NP or SNO HDL NPs. *p<0.05 vs. all other treatment groups. E, F) Cholesterol efflux from 3H-cholesterol loaded macrophages to SNO HDL NPs. J774 macrophages (E) and differentiated THP-1 macrophages (F) were loaded with 3H-cholesterol prior to addition of cholesterol acceptors for 24 hrs. G) SNO HDL NPs reduced transwell migration of AoSMCs compared with controls, PBS, DPPNOTE alone and HDL NPs (*p<0.0001 v. all other treatment groups).
We then assayed whether NO can be delivered to the vascular cells from SNO HDL NPs by imaging NO release to macrophages. DAF FM diacetate, a cell-permeable derivative of the fluorescent dye 4-Amino-5-Methylamino-2’,7’-Difluorofluorescein (DAF FM),45–46 was added to the J774 mouse macrophage cell line and the THP-1 human monocyte cell line, which had previously been differentiated into macrophages by addition of phorbol 12-myristate 13-acetate (Experimental Section), followed by 4-hour treatment with free DPPNOTE (about four times the amount of DPPNOTE in SNO HDL NPs), HDL NP or SNO HDL NPs. DAF FM fluorescence was significantly greater in the SNO HDL NP-treated cells compared to DPPNOTE and HDL NPs (Figures 5B, 5C, S2), demonstrating the ability of SNO HDL NPs to deliver NO to the cultured macrophages.
Inhibiting Nuclear Factor-κB (NF-κB) Activation by Sustained NO Release from SNO HDL NPs
The dual role of SNO HDL NPs as an actively delivered NO-scaffold provides the opportunity to sustainably release NO to inhibit cytoplasmic pathological mechanisms in cells. As a master regulator of inflammation and immune responses, NF-κB is an appealing therapeutic target due to its critical role in the progression of many diseases including chronic inflammation and cancer.47–48 Certainly, NF-κB has been implicated a key factor in the chronic inflammation that characterizes atherosclerotic cardiovascular disease.49–51 It has been reported that NO leads to inactivation of NF-κB.48, 52–53 We utilized the THP-1 Dual reporter cell line, a human monocyte cell line that expresses a secreted embryonic alkaline phosphatase (SEAP) under the control of the transcription factor NF-κB. A potent activator of NF-κB is bacterial lipopolysaccharide (LPS, aka endotoxin).23 To activate NF-κB, THP-1 Dual cells were treated with LPS (5 ng/ mL) for 1 hour, followed by addition of DPPNOTE, HDL NP or SNO HDL NPs for an additional 24 hours. The activation of NF-κB was quantified by adding the Quantiblue reagent to the cell media. Data demonstrate that LPS induced significant Quantiblue signal that was not diminished by DPPNOTE alone (Figure 5D). HDL NPs and SNO HDL NPs both dose-dependently reduced the Quantiblue signal, and by extension, NF-κB activation. The SNO HDL NPs demonstrate superior down-regulation of NF-κB relative to HDL NPs at all concentrations tested (Figure 5D). These data demonstrate that molecular pathological mechanisms can be inhibited by the HDL NPs, whereby enhanced function can be realized by sustained release of NO from SNO HDL NPs.
SNO HDL NPs Efflux Cholesterol from Macrophages Similar to Natural HDL
HDL is a naturally occurring nanostructure, whose primary function is to transport and transfer cholesterol between biological compartments.12–14 Since most cells in the periphery do not express pathways for catabolizing cholesterol, HDL-mediated efflux of cholesterol from peripheral macrophages is critical for maintaining homeostasis.12–14 Our previous work has shown that HDL NPs engage all pathways to modulate cellular cholesterol flux: aqueous diffusion, SR-B1-mediated bidirectional cholesterol flux, and the two active cholesterol efflux processes involving ABCA1 and ABCG1.30 As such, HDL NPs are robust acceptors of cellular cholesterol and mimic the fundamental function of natural HDL, suggesting that SNO HDL NPs should also functionally mimic natural HDLs.
To quantify the cholesterol efflux capacity of SNO HDL NPs, we utilized a radiolabeled cholesterol efflux assay described previously to quantify the functional ability of SNO HDL NPs to remove cholesterol from J774 and THP-1 PMA-differentiated macrophages.21, 30, 54 Briefly, macrophages are incubated with 3H-cholesterol, and following incubation, cholesterol was effluxed to acceptors for 24 hours with the results quantified by liquid scintillation counting. Both SNO HDL NPs and HDL NPs demonstrated dose-dependent cholesterol efflux, with no statistically significant difference between the nanoparticle constructs observed at any concentration (Figures 5E, 5F). As such, SNO HDL NPs also are robust acceptors of cellular cholesterol and can well mimic natural HDL with regard to their native cholesterol efflux function.
SNO HDL NPs Inhibit Aortic Smooth Muscle Cell Migration
Aberrant migration of vascular smooth muscle cells has been strongly implicated in the development of atherosclerosis.55–57 NO has been shown to inhibit the migration of smooth muscle cells, both in vitro and in vivo.58–59 Additionally, AoSMC migration has been shown to be impaired by HDLs, possibly through signaling by their phospholipid component,60 and increased cholesterol efflux, with notably modulation of ABCA1 and ABCG1 expression.61 To quantify the ability of SNO HDL NPs that modulates cellular function in a serum-containing matrix, an in vitro AoSMC transwell migration assay was employed. AoSMC migration was significantly inhibited when treated by HDL NPs (54.46%) and with SNO HDL NPs (88.77%), compared to PBS control (Figures 5D, S3). Free DPPNOTE, added at a concentration about four times as high as the DPPNOTE content of SNO HDL NPs, did not alter AoSMC migration (Figures 5E, S3), suggesting that efficient, targeted NO delivery is required to reduce AoSMC migration. These data show that HDL NPs demonstrate inherent functionality with regard to reducing AoSMC migration, and synergistic function with targeted delivery of NO using the SNO HDL NPs.
SNO HDL NPs Reduce Ischemia / Reperfusion Injury (IRI)
NO loss in vascular disorders can occur acutely, as in IRI. IRI refers to cellular damage after reperfusion of previously viable ischemic tissues, which closely associates with many therapies including thrombolytic therapy, organ transplantation, coronary angioplasty, aortic cross-clamping, or cardiopulmonary bypass.47–48 HDL and NO have both been shown to have protective effects against IRI; however, prolonged ischemia results in decreased expression and activity of endothelial nitric oxide synthase (eNOS), the predominant enzyme responsible for NO production in endothelial cells. In organ transplantation, IRI, occurring from the time of cross-clamping and organ harvest to transplantation into the recipient, is a major contributor to delayed graft function, a common complication that negatively impacts the long-term outcome of the transplanted organ. Delivery of exogenous NO may ameliorate IRI-induced delayed graft function and improve long-term organ survival outcomes. Herein, we measured the therapeutic potential of SNO HDL NP in ameliorating IRI in a mouse kidney transplant model.62
In the mouse kidney transplant model, the donor kidney is removed (warm ischemia), placed on ice for 4 hours (cold ischemia), and finally transplanted into a recipient mouse, which also undergoes a bilateral nephrectomy so that the only functional kidney after surgery is the transplanted kidney.63 Donor mice were treated with nanoparticles or PBS prior to kidney harvest, the kidney was perfused with nanoparticles during cold ischemia incubation, and the recipient mouse was treated with nanoparticles immediately following transplant surgery, and again 24 hours later. This dosing regimen was used to allow for nanoparticle treatment at all three phases (warm ischemia, cold ischemia, reperfusion) of injury transplanted kidneys experience. Plasma creatinine levels were quantified following transplantation as a measure of graft function.64 SNO HDL NP statistically significantly decreased plasma creatinine levels compared to PBS controls (1.22 ± 0.77 mg/ dL for SNO HDL NP vs. 2.33 ± 0.68 mg/ dL for PBS; p=0.0113; Figure 6A). HDL NP treatment (1.70 ± 0.95 mg/ dL) was not statistically significantly different from either PBS controls (p=0.193; Figure 6A) or SNO HDL NPs (p=0.254; Figure 6A). The enhanced improvement of SNO HDL NP further suggests a synergistic effect from NO and HDL in reducing IRI.
Figure 6.
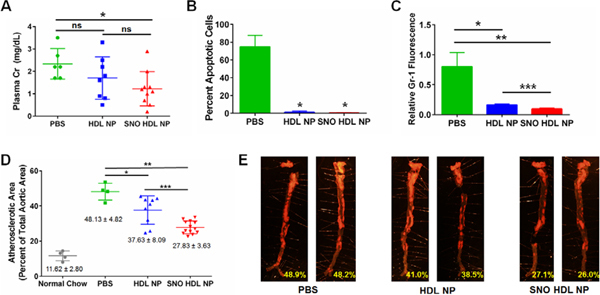
SNO HDL NPs as therapy for IRI and atherosclerosis. A) Plasma creatinine levels of mouse kidney transplant recipients on day 2 post transplantation (*p=0.0113 v. PBS control). B) Quantification of apoptosis (TUNEL) staining in kidney transplant recipients (*p<0.0001 vs. PBS). C) Quantification of immunocytochemistry staining for Gr-1, a neutrophil marker, in kidney transplant recipients (*p=0.0175. **p=0.0041. ***p=0.008). D) ApoE knockout mice were fed a high fat diet for 12 weeks, then administered PBS, HDL NPs or SNO HDL NPs 3×/ week for an additional 6 weeks. Atherosclerotic lesions were visualized using Sudan Red staining. The atherosclerotic area was calculated by measuring the area of Sudan Red staining, divided by the total aortic area (*p=0.0149. **p<0.0001. ***p=0.0118). E) Representative images of aortas from mice treated with PBS, HDL NP or SNO HDL NPs. Red fluorescent staining indicates atherosclerotic plaques. Images taken at 6X magnification.
IRI induces innate and adaptive immune activation, leading to infiltration of transplanted grafts by host immune cells,52, 65–66 and can lead to graft rejection. It has been reported that restoration of NO levels, through delivery of exogenous NO to the transplanted organ, may reduce immune cell infiltration into the transplanted organ. Immunocytochemical staining for cellular apoptosis (TUNEL) and proliferation (Ki67) demonstrated that HDL NP and SNO HDL NP both decreased the number of apoptotic cells and increased the number of proliferating cells (Figures 6B, S4, S5), with SNO HDL NPs demonstrating the greatest decrease in apoptosis (0.262% ± 0.189% TUNEL-positive cells for SNO HDL NPs versus 74.78% ± 6.49% for PBS) compared HDL NPs (1.095% ± 0.612%). Macrophage infiltration in the grafts, quantified by positive staining for the marker F4/80, was similar across all treatment groups (Figure S6). Infiltration by neutrophils, visualized by staining the kidney grafts for Gr-1, was significantly reduced in SNO HDL NPs (relative fluorescence 0.097 ± 0.017) compared to HDL NP (0.166 ± 0.014) and PBS controls (0.803 ± 0.235; Figures 6C and S7). These data suggest that the HDL NP construct itself acts to prevent apoptosis and reduce neutrophil infiltration, while NO delivery by SNO HDL NPs enhances these effects.
SNO HDL NPs Reduce Atherosclerosis
Atherosclerosis is a complex disease in which the arterial wall thickens due to the accumulation of cholesterol in macrophage cells and the formation of atherosclerotic plaques.67–68 HDLs function in an atheroprotective process called reverse cholesterol transport, effluxing cholesterol from macrophages in the periphery and transporting it back to the liver.13 Additionally, NO has been shown to play a critical role in the progression of atherosclerosis. NO production by eNOS is chronically impaired during atherosclerotic lesion development,67–68 resulting in increased oxidative stress, inflammation and endothelial dysfunction, suggesting that exogenous NO administration may decrease atherosclerosis. To characterize the function of SNO HDL NP in the chronic NO loss setting, we quantified the ability of SNO HDL NP to reduce atherosclerotic plaque formation in a mouse model of atherosclerosis.
Mice lacking ApoE (ApoE KO) develop significant atherosclerosis when fed a high fat diet (HFD) over a prolonged period (Figure S8). ApoE KO mice were fed a high fat diet for 18 weeks. After 12 weeks of HFD, the mice were administered tail vein injections (3×/ week) of 100 μL of 1 μM SNO HDL NP or HDL NP, or PBS control, during the final 6 weeks. Following treatment, the aortas were harvested and stained for plaque burden. ApoE KO mice on a normal chow diet developed minimal atherosclerosis (Figure S9). From Figures 6D–E and S9, PBS-treated mice developed significant atherosclerotic plaque burden with an atherosclerotic area of 48.13 ± 4.82 %. However, for HDL NP-treated mice, the atherosclerotic area decreases to 37.63 ± 8.09%, a decrease of ~ 21.82% compared to PBS treated mice (Figures 6D–E, S10). The reduction of plaque burden supports the protective effect of HDL in reducing atherosclerosis. Further, the atherosclerotic area in SNO HDL NP-treated mice decreases to 27.83 ± 3.63%, a decrease of ~ 26.12% in comparison with HDL NP-treated mice and ~ 42.18% compared to PBS treated mice (Figures 6D–E, S11). In all, these data demonstrated greater efficacy of SNO HDL NPs in reducing plaque burden due to synergistic effects.
Conclusion
Here we report the synthesis of an S-nitrosylated phospholipid, DPPNOTE, by the reaction between NaNO2 and a thiol-containing phospholipid, DPPTE, under acidic conditions. DPPNOTE was stably incorporated into the synthesis of HDL NPs, generating an NO-loaded HDL NP. These SNO HDL NPs are similar to HDL NPs in size and function. SNO HDL NPs stabilized the –S–N=O group relative to free DPPNOTE. The improvement of stability benefits from packing and ordering of phospholipid bilayer further limiting the freedom of DPPNOTE in SNO HDL NPs, which also decreases RSNO decomposition. Data show that SNO HDL NPs are robust cholesterol acceptors and can mimic natural HDLs in function, while displaying no toxicity towards endothelial cells, vascular smooth muscle cells, or macrophages.
Due to the fact that SNO groups are partly present in the outer layer of SNO HDL NP, the loading of NO in SNO HDL NPs is hard to compare to some reported NO-delivery nanoparticles7, 9–11, 37 in quantity, where NO is loaded in the entire particle. However, SNO HDL NPs mimic natural HDLs, which enables receptor-mediated, targeted properties. By merging the properties of HDL, NO-scaffold, and targeted nanocarrier delivery, data demonstrate that SNO HDL NPs reduce IRI in a mouse kidney transplant model and atherosclerotic plaque burden in a mouse model of atherosclerosis, corresponding to acute and chronic vascular diseases, respectively. Thus, SNO HDL NPs are capable of delivering a therapeutically relevant dose of NO, and show great potential for vascular disease.
As mentioned previously, most synthetic nanoparticles are prepared under relatively harsh conditions, while NO and NO-donors are very sensitive to environmental factors (e.g. heat, light, and heavy metal ions). Complex post assembly modifications have to be employed to load NO or NO-donors to nanoparticles. Here we demonstrate the synthesis of SNO HDL NPs via a process of self-assembly under mild conditions similar to natural processes. As such, SNO HDL NPs avoid the complex, post assembly modifications that other NO-donor nanoparticles must endure.
In all, this proof-of-concept work describes not only a biomimetic nanotherapy for NO delivery, but also a platform to potentially delivery other unstable therapeutic agents. Further, given the targeted ability of HDL NPs and their inherent anti-inflammatory properties, the potential of NO-loaded or other drug-loaded HDL NPs is not limited strictly to vascular diseases, but may be therapeutically useful in other disorders.
Experimental Section
Materials and Chemicals.
AuNPs (80 × 10−9 M, 5 ± 0.75 nm, in aqueous solution) came from Ted Pella, Inc. DPPTE (> 99 %), PDP PE (> 99 %) and DPPC (> 99 %) were purchased from Avanti Polar Lipids. Apo AI came from MyBioSource. HCl (> 95 %), NaNO2 (99.999 %), pentatonic acid (DPTA) (> 99 %), glutathione (> 98 %), 5,5’-Dithiobis(2-nitrobenzoic acid) (DNTB, > 98 %), and pure ethanol were from Sigma Aldrich. DAF FM was obtained from Thermo Fisher Scientific.
Preparation and Characterization of DPPNOTE.
DPPNOTE was synthesized via S-nitrosylation of DPPTE through addition of NaNO2 under acidic conditions. Briefly, DPPTE was first reconstituted in 100% ethanol to a concentration of 25 mM and then diluted with water to a final concentration of 5 mM DPPTE in 20 % ethanol / 80 % water. The pH of the solution was then lowered to 3 by addition of 1 M HCl. The S–N=O group is particularly susceptible to degradation by heavy metals such as copper and zinc. As a strong chelating agent, DPTA was added at a final concentration of 50 μM to chelate any heavy metal ions that may be present. Finally, NaNO2 was added to the solution at a 1:1 ratio with DPPTE.
UV–Vis absorbance spectra of DPPNOTE and controls (DPPTE and GSNO) were obtained using an Agilent 8453 UV–Vis spectrophotometer (Agilent Technologies). To get FTIR, Raman and mass spectra, DPPNOTE was frozen by liquid nitrogen and lyophilized with a FreeZone 6 L Cascade Console Freeze Dry System for 24 h. Lyophilized DPPNOTE powder was mixed with KBr powder to form discs for transmission FTIR spectra on a Nicolet Nexus 870 spectrometer. All FTIR spectra were collected with a resolution of 4 cm−1 over 32 scans. Further, lyophilized DPPNOTE powder was put on Au substrates (with a thickness of 1000 Å over a titanium adhesion layer on silicon wafers purchased from Platypus Technologies) for Raman spectra taken on a HORIBA LabRAM HR Evolution Confocal RAMAN System. Using diffraction grating of 600 grooves per mm, samples were each excited by 633 nm light with 25 % of the power incident, which was focused by a ×100 long-working-distance objective. All Raman spectra were collected using 1 scan of 100 s acquisition for signal averaging. Utilizing an Agilent 6520 quadrupole time-of-flight (Q-TOF) mass spectrometer in the positive ion mode, mass spectra of DPPNOTE were analyzed with 0.1 % (v / v) NH4OH in a water−acetonitrile mix (70:30) as eluent. Data analysis, mass deconvolution, and spectra simulation were performed using data analysis software provided by the manufacturer. For this mass spectrometer, a peak of compound + NH3+ is typically observed as the highest mass peak. As a control, FTIR, Raman, and mass spectra of DPPTE were collected.
To measure the reduction of thiol in DPPTE during the synthesis of DPPNOTE, Ellman’s assay35–36 was employed to test the contents of thiol in the DPPNOTE product. The DPPNOTE product was dissolved in 20 % (v / v) ethanol aqueous solution to prepare the sample. Meanwhile, DPPTE was dissolved in 20 % (v / v) ethanol aqueous solution to prepare standard solutions with different concentrations of 0.2, 0.4, 0.6, 0.8 and 1.0 mM. In Ellman’s assay, DNTB (Ellman’s agent) stock solution was prepared with a final concentration of 50 mM sodium acetate and 2 mM DTNB in water and kept refrigerated. ~ 975 μL of the DTNB working reagent in 20 % (v / v) ethanol aqueous solution was then prepared by adding 500 μL of the DTNB solution, 100 μL of Tris-HCl buffer solution (1 M, pH=8, Boston BioProducts), 195 μL of ethanol, and 180 μL of molecular grade biology water. 25 μL of each standard solution was well mixed with 975 μL of DTNB reagent prepared above and incubated at room temperature for 5 minutes to get the optical absorbance at 415 nm with an Agilent 8453 UV–Vis spectrophotometer (Agilent Technologies), using the mixture of 25 μL of 20 % (v / v) ethanol aqueous solution and 975 μL of DTNB reagent as the blank. According to the absorbances of the different standard solutions, a linear standard curve was set up for measuring the thiol group arranging from 0 ~ 25 μM. Similarly, the absorbance of the sample solution was measured after it was treated as those standard solutions. Thus, the content of the thiol group in the DPPNOTE product was assayed by comparing it with the standard curve.
Synthesis and Characterization of HDL NPs and SNO HDL NPs.
HDL NP synthesis was carried out as previously described.20–21, 30 In brief, 5 nm citrate stabilized AuNPs were surface functionalized with a 5-fold molar excess of Apo AI. Both PDP PE and DPPC dissolved in ethanol were added to the solution of Apo AI-AuNPs in 250-fold molar excess to the AuNPs, with the resultant solution containing 20 % ethanol/ 80 % water (v / v). Following an overnight incubation, the HDL NPs were then subjected to tangential flow filtration using a Kros Flo II tangential flow filtration system (Spectrum Labs, Inc.) fitted with #14 tubing and a 50 kDa molecular weight cutoff (MWCO)-modified polyethersulfone module to remove ethanol, free Apo AI, and phospholipids. Similarly, SNO HDL NPs were prepared by replacing DPPC with DPPNOTE. For fluorescently labeled HDL NPs, the intercalating dye DiI (Thermo Fisher Scientific) was added at a 12.5×molar excess relative to AuNPs during the phospholipid addition step. Purification was carried out as with non-fluorescently labeled HDL NPs.
UV–Vis absorbance spectra and the concentrations of citrate stabilized AuNPs, HDL NPs, DiI HDL NPs, and SNO HDL NPs were obtained using an Agilent 8453 UV–Vis spectrophotometer (Agilent Technologies) and Beer’s law. DLS measurements and surface charge (zeta potential) of HDL NPs and SNO HDL NPs were obtained using a Zetasizer Nano ZS (Malvern Instruments Ltd.).
AFM imaging in air was performed on a Bioscope Resolve / Nanoscope V system (Bruker, Santa Barbara) by using silicon nitride probes having nominal spring constant of 0.4 N / m and tip radius 2 nm (ScanAsyst Air, Bruker). The samples were drop cast on a freshly exfoliated mica substrate and left drying in air for 10 minutes before imaging. PeakForce Tapping mode was used for imaging by keeping the peak force at 30 pN.
Quantification of Outer-Layer Phospholipids and Apo AI on SNO HDL NPs.
To measure the loading of DPPNOTE on SNO HDL NPs, the Griess assay11, 20 was employed. Using the Griess Reagent System (Promega), the nitrite standard (0.1M sodium nitrite in water) was diluted with PBS to form standard solutions (0, 1.56, 3.13, 6.25, 12.5, 25.0 and 37.5 μM). Then, 200 μL of each standard solution was mixed with 200 μL of 1% sulfanilamide in 5% phosphoric acid and incubated at room temperature for 5 minutes. Next, these solutions were mixed with 200 μL of 0.1% N-1-napthylethylenediamine dihydrochloride (NED) in water for another 5 minutes and the optical absorbance at 540 nm was obtained using an Agilent 8453 UV–Vis spectrophotometer (Agilent Technologies), using pure water as the blank. According to the absorbance values obtained from the standard solutions, a linear standard curve was obtained for measuring nitrite from unknown solutions. SNO HDL NPs were diluted in PBS and added to the 200 μL sulfanilamide solution. Then, 40 μL of CuSO4 (250 μM, catalyze the release of NO) was added into the 200 μL diluted SNO HDL NPs dispersion. After standing for 30 mins under light, 200 μL of NED was added. After 5 minutes, the mixed solution was centrifuged for 30 mins (13,000 × g) to deposit the aggregated SNO HDL NPs. The supernatant was slowly removed using a syringe and the absorbance was measured similar to the standard solutions. Thus, the content of nitrite, corresponding to NO released from DPPNOTE in SNO HDL NPs, was assayed by comparing it to the standard curve. The experiment was repeated twice, and the loading of DPPNOTE in SNO HDL NPs calculated via dividing the molar amount of nitrite by the SNO HDL NPs concentration.
To measure the loading of DPPTE on SNO HDL NPs, Au NP, the core in the SNO HDL NP was first oxidized and dissolved with KCN. Chloroform was then employed to extract the lipids from the KCN solution. After chloroform was evaporated out by nitrogen, the extracted lipids were further dissolved by 20 % (v / v) ethanol aqueous solution. The amount of extracted lipids was then similarly assayed by aforementioned Ellman’s assay35–36. The experiment was repeated twice, and the loading of DPPTE in SNO HDL NPs calculated via dividing the molar concentration of DPPTE by molar concentration of the SNO HDL NPs.
As a control, the loading of DPPC on HDL NPs was measured by Phospholipid Assay Kit (Sigma Aldrich) for measuring choline-containing phospholipids. Briefly, the 2 mM phosphatidylcholine standard was diluted with water to form standard solutions (0, 6, 12, and 20 μM), respectively. Then, 20 μL of each standard solution was transfer into separate wells of 96 well plate and then mixed with 80 μL reaction mixes composed of 85 parts of Assay Buffer, 1 part of Enzyme Mix, 1 part of PLD Enzyme, and 1 part of Dye Reagent. 30 minutes later, the fluorescence intensity (λex = 530 / λem = 585 nm) was obtained via a Cytation3 Automated Microscope Plate Reader (BioTek Inc), using pure water as the blank (20 μL, mixed with 80 μL reaction mixes composed of 86 parts of Assay Buffer, 1 part of Enzyme Mix, and 1 part of Dye Reagent). According to the values of fluorescence intensities obtained from the standard solutions, a linear standard curve was obtained for measuring DPPC. The molar amount of DPPC HDL NPs was triply measured with the standard curve. Finally, the loading of DPPC in HDL NPs was calculated via dividing the molar amount of DPPC by the HDL NPs concentration.
To quantify the number of Apo AI per nanoparticle, SNO HDL NPs and HDL NPs were synthesized with 3H-labeled Apo AI, using standard protocols. 3H-Apo AI was generated by reductive methylation of Apo AI by 3H-formaldehyde as described previously [cite Luthi JLR]. Following purification, the quantity of 3H label in each nanoparticle formulation was measured using liquid scintillation counting. A standard curve of 3H-labeled Apo AI was also run, to convert counts per minute to Apo AI concentration.
In Vitro Toxicity.
The MTS assay was used to quantify the toxicity of SNO HDL NPs and HDL NPs in vitro. Cells were plated at 1×10⁵ cells/ml into 96 well plates, and were treated with HDL NPs or SNO HDL NPs for 72 hours prior to addition of the MTS reagent. A Biotek Synergy 2 plate reader was used to measure the absorbance at 490 nm prior to MTS reagent addition, at time = 0, and at time = 120 minutes. Percent viability was calculated by subtracting values at the time = 0 from those at the time = 120, then standardizing the resultant values to the PBS control (set to 100%).
Nitric Oxide Release Assay.
NO release from SNO HDL NPs was quantified by incubating SNO HDL NPs in PBS buffer (pH=7.4) at 37 °C for varying lengths of time (0 to 24 hours). Briefly, 10 × PBS buffer (pH=7.4) was first diluted to 2 × PBS buffer with water. The dispersion of SNO HDL NPs was then diluted with 2 × PBS with the same volume. Next, three dialysis tubes (Float-A-Lyzer G2 Dialysis Device CE, Biotech CE, 0.1 – 0.5 kD MWCO, Spectrum Labs) each were added with 2 mL diluted dispersion of SNO HDL NPs. The dialysis tubes were incubated in a closed container containing 300 mL PBS at 37 °C. Following incubation, 200 μL of each sample was removed from each dialysis tube at different time point to measure the remaining DPPNOTE in SNO HDL NPs similarly to assaying the loading of DPPNOTE in SNO HDL NPs, as mentioned above. The released NO at different time point was calculated as: [1-(the remained content of DPPNOTE / content of DPPNOTE before incubation)] × 100 %. Free DPPNOTE was used as the control.
Glutathione-induced NO release from SNO HDL NPs was conducted by incubating 100 nM SNO HDL NPs with varying concentrations of GSH for 2 hours at 4 °C and 37 °C, respectively. Following incubation, the nanoparticles were purified by centrifugation (13,000 × g, 45 min.) and the NO content remaining on the surface of the nanoparticles quantified using the fluorescent dye DAF FM. Data are presented as relative to NO on SNO HDL NPs + 0 mM GSH.
For NO release from SNO HDL NPs in the presence of cells, the cell permeable variant of DAF FM, DAF FM diacetate, was utilized. J774 cells were plated out at a density of 3×10⁵ cells/ mL and allowed to adhere to glass coverslips. THP-1 cells were plated out at a density of 1 × 10⁵ cells/ mL and treated with 100nM of phorbol 12-myristate 13-acetate (PMA; Sigma Aldrich) for 72 hours to facilitate differentiation into macrophages and adherence to glass coverslips. Cells were then cultured in phenol-red free MEM containing 0.2% bovine serum albumin overnight. The cells were washed twice with warm 1 × PBS and the cells labeled with DAF FM diacetate (10 μM) dissolved in phenol-red free MEM for 1 hour. After labeling, the cells were washed twice with 1 × PBS and treated with 5 – 25 nM HDL NP, SNO HDL NP, or free DPPNOTE at a dose about quadruple what is found on the surface of SNO HDL NPs (400 nM – 2 μM) for 4 hours. The cells were then fixed with 4% paraformaldehyde for 10 minutes, washed twice with 1 × PBS and mounted using VectaShield with DAPI mounting media (Vector Labs). DAF FM diacetate (green) and DAPI (blue) fluorescence was visualized using a Nikon epifluorescent microscope.
Competitive Binding Assay.
To quantify the ability of SNO HDL NPs to bind to macrophages, relative to HDL NP, a competitive binding assay was utilized. THP-1 cells (Invivogen) were treated with DiI HDL NPs (10 nM) in combination with PBS, unlabeled HDL NPs (10 nM) or SNO HDL NPs (10 nM) for 2 hours. Cells were then washed twice with 1 × PBS and resuspended in FACS buffer (1 × PBS, 2% fetal bovine serum, 0.1% sodium azide) and analyzed on a BD Fortessa flow cytometer in Northwestern University’s Robert H. Lurie Comprehensive Cancer Center Flow Cytometry Core Facility. FCS Express software was used to analyze the data.
NF-κB Quantiblue Assay.
The Quantiblue assay was carried out according to manufacturer’s protocol. THP-1 Dual cells (Invivogen) were plated out at a concentration of 5×10⁵ cells / mL in a 96-well plate, and treated with 5 ng / mL LPS (Sigma Aldrich) for 1 hour. DPPNOTE (0 ~ 2 μM), HDL NPs (0 ~ 50 nM), or SNO HDL NPs (0 ~ 50 nM) were then added and the cells incubated for an additional 24 hours. Following incubation, 25 μL of media was added to 175 μL of Quantiblue reagent (Invivogen), the plate was incubated at 37 oC for 1 hour, and the absorbance read at 655 nm. Data are presented as Quantiblue absorbance standardized to no LPS addition.
Cholesterol Efflux Assay.
The cholesterol efflux assay was performed as described previously.21, 30, 54 J774 macrophages were plated into-24 well plates and incubated with 2 μCi/mL of 3H-cholesterol for 24 hours. The small molecule inhibitor Sandoz 58–035 (2 μg/ mL) was added to the culture media to prevent cholesterol esterification. Following labeling, cAMP (0.3 mM) was added over night to upregulate ABCA1 expression. The cells were then washed twice with MEM containing 20 mM HEPES and 1 % PenStrep, and the cholesterol acceptors added to the cells, in a solution of MEM, 20 mM HEPES, and 1 % PenStrep, for 24 hours at 37 °C. After incubation, the culture media was filtered, added to 6 mL pony vials containing 3mL of Ultima Gold liquid scintillation fluid, and counted using a Perkin Elmer Tri-Carb 3100TR liquid scintillation counter. The resultant counts were standardized to the total cholesterol in the cells prior to the addition of the cholesterol acceptors, and the results reported as a percentage of total cholesterol.
To measure cholesterol efflux from human macrophages, THP-1 cells were plated at a concentration of 1.5 ×10⁵ cells/ well and treated with 100nM PMA for 72 hours to induce the THP-1 monocytes to differentiate into adherent macrophages. Following incubation, the cells were washed 1 × with serum-free RPMI and incubated with 2 μCi/mL of 3H-cholesterol for 24 hours. As with the J774 cells, Sandoz 58–035 was added to prevent esterification of the radiolabeled cholesterol. Post labeling, the cells were incubated with serum free media overnight, prior to addition of cholesterol acceptors using the same protocol as for J774 cells.
Aortic Smooth Muscle Cell Transwell Migration Assay.
AoSMCs (Lonza) were resuspended at a concentration of 1×10⁶ cells / mL, and 100 μL of cells was added to the interior of an 8 μm pore size transwell (EMD Millipore) insert placed in a 24-well plate. The cells were incubated for 10 minutes to allow for attachment, then 600 μL of culture media (Smooth Muscle Growth Media; Lonza) + treatment was added. HDL NPs and SNO HDL NPs were added at a final concentration of 50 nM. DPPNOTE was added at a final concentration of 4 μM, approximately four times the amount of DPPNOTE in 50 nM SNO HDL NP, The cells were incubated for 4 hours, then washed twice with PBS, and fixed with 100 % ethanol. Following fixation, the cells were stained with crystal violet (Sigma Aldrich) and the number of cells migrating through the insert calculated by averaging 10 fields per replicate.
Murine Kidney Transplantation Model.
All animal work was conducted in accordance to IACUC approved protocols (NU IS00001663; approved 9/28/2015). The murine kidney transplant model was performed as described previously.62 Donor C57/Bl6 mice (male, 8 – 12 weeks old, body weight 25 – 30g each; Jackson Laboratories) were injected with 100 μL of PBS, 1 μM HDL NPs or 1 μM SNO HDL NPs 2 hours prior to harvesting of the donor kidney. The kidney was resected, along with a portion of the aorta and inferior vena cava, perfused with a cold solution of 250 nM HDL NP or SNO HDL NP in University of Wisconsin (UW) solution. The donor organ was transferred to 4°C for 4 hours prior to transplantation into the recipient C57/Bl6 mouse (Jackson Laboratories). The recipient mouse underwent a bilateral nephrectomy, with the first native kidney removed prior to transplantation and the second native kidney removed following transplantation. The transplanted kidney is connected to the vasculature using the aorta and vena cava segments retained from the donor. Following transplantation, mice were treated with either 100 μL of PBS, 1 μM HDL NP, or 1 μM SNO HDL NP intraperitoneally. The following day, the recipients received an additional dose, this time via tail vein. Blood was collected on Day 2 and analyzed for plasma creatinine level. The transplanted organs were also resected, fixed with formalin, embedded in O.C.T. (optimum cutting temperature medium; VWR), and processed by the Mouse Histology and Phenotyping Laboratory at Northwestern University to investigate infiltration of the grafts by immune cells (e.g. Gr-1), apoptosis (TUNEL staining), proliferation (Ki67) and gross histology (H&E). The Nikon A1R GaAsP confocal fluorescent microscope in the Center for Advanced Microscopy/ Nikon Imaging Facility at Northwestern University was used to image immunocytochemical stained kidney sections. Fluorescent intensities were quantified using the open source Fiji imaging software.69
Murine Atherosclerosis Model.
All animal work was conducted in accordance to IACUC approved protocols (NU IS00002415; approved 1/11/2016). ApoE KO mice (female, 4–6 weeks old, body weights ~20g each; Jackson Laboratories) were fed a high fat diet (42% of calories from fat, TD.88137; Envigo) for 12 weeks to induce formation of atherosclerosis. Mice were injected I.V. with 100 μL of PBS, 1 μM HDL NPs or 1 μM SNO HDL NPs 3 times per week for 6 weeks. Mice continued on the high fat diet during the 6 weeks of treatment. Following treatment, mice were euthanized and their aortas removed, cleaned and pinned for Sudan IV (Sigma Aldrich) staining. Atherosclerosis was quantified by measuring the area of the aorta and the atherosclerotic plaques, using ImageJ. JPEG images were taken of the aortas on a black background, using a variable focus dissection microscope. In ImageJ, the free hand selection tool was sued to trace the entire aorta (Area_total), which was then quantified using the Measure function. Individual plaques were then traced and their areas quantified using the Measure function (Area_athero). The percent atherosclerotic area was then calculated by: (Area_athero / Area_total) × 100. Data are presented as a percentage of total aortic area.
Statistics.
The student’s t-test and 1-way ANOVA test, with Tukey post-hoc for multiple comparisons, were used where appropriate.
Supplementary Material
Acknowledgments
The authors thank Dr. Chiara Musumeci, from the Northwestern University Atomic and Nanoscale Characterization and Experimental Center Scanned Probe Imaging and Development (NUANCE SPID) facility at Northwestern University, for technical assistance, and Dr. Nick D. Tsihlis, from the Department of Surgery at the University of North Carolina at Chapel Hill, for his comments and proofreading of the manuscript. For financial support, we thank the NTU-NU Institute for Nanomedicine and NIH/NHLBI BRP 5R01HL116577, NIH/NHLBI T32HL094293, and NIH R01CA167041. The authors would also like to thank the CRN Regenerative Nanomedicine Catalyst Award Program at Northwestern University for supporting this research. This work made use of the Keck-II facility of the NUANCE Center at Northwestern University, which has received support from the Soft and Hybrid Nanotechnology Experimental (SHyNE) Resource (NSF NNCI-1542205); the MRSEC program (NSF DMR-1121262) at the Materials Research Center; the International Institute for Nanotechnology (IIN); the Keck Foundation; and the State of Illinois, through the IIN. Mass Spectrometry was performed in the Peptide Synthesis Core Facility of the Simpson Querrey Institute at Northwestern University. The US Army Research Office, the US Army Medical Research and Material Command, and Northwestern University provided funding to develop this facility and ongoing support is being received from the Soft and Hybrid Nanotechnology Experimental (SHyNE) Resource (NSF NNCI-1542205). Imaging work was performed at the Northwestern University Center for Advanced Microscopy generously supported by NCI CCSG P30 CA060553 awarded to the Robert H. Lurie Comprehensive Cancer Center.
REFERENCES
- 1.Roger VL; Go AS; Lloyd-Jones DM; Adams RJ; Berry JD; Brown TM; Camethon MR; Dai S; de Simone G; Ford ES; Fox CS; Fullerton HJ; Gillespie C; Greenlund KJ; Hailpem SM; Heit JA; Ho PM; Howard VJ; Kissela BM; Kittner SJ; Lackland DT; Lichtman JH; Lisabeth LD; Makuc DM; Marcus GM; Marelli A; Matchar DB; McDermott MM; Meigs JB; Moy CS; Mozaffarian D; Mussolino ME; Nichol G; Paynter NP; Rosamond WD; Sorlie PD; Stafford RS; Turan TN; Turner MB; Wong ND; Wylie-Rosett J; American Heart Assoc Stat, C.; Stroke Stat, S., Heart Disease and Stroke Statistics-2011 Update A Report From the American Heart Association. Circulation 2011, 123 (4), E18–E209. [DOI] [PMC free article] [PubMed] [Google Scholar]
- 2.Schulz R; Kelm M; Heusch G, Nitric oxide in myocardial ischemia/reperfusion injury. Cardiovascular research 2004, 61 (3), 402–413. [DOI] [PubMed] [Google Scholar]
- 3.Giraldez RR; Panda A; Xia Y; Sanders SP; Zweier JL, Decreased nitric-oxide synthase activity causes impaired endothelium-dependent relaxation in the postischemic heart. Journal of Biological Chemistry 1997, 272 (34), 21420–21426. [DOI] [PubMed] [Google Scholar]
- 4.Napoli C; de Nigris F; Williams-Ignarro S; Pignalosa O; Sica V; Ignarro LJ, Nitric oxide and atherosclerosis: an update. Nitric oxide 2006, 15 (4), 265–279. [DOI] [PubMed] [Google Scholar]
- 5.Garg UC; Hassid A, Nitric oxide-generating vasodilators and 8-bromo-cyclic guanosine monophosphate inhibit mitogenesis and proliferation of cultured rat vascular smooth muscle cells. Journal of Clinical Investigation 1989, 83 (5), 1774–1777. [DOI] [PMC free article] [PubMed] [Google Scholar]
- 6.Kerwin JF Jr; Lancaster JR; Feldman PL, Nitric oxide: a new paradigm for second messengers. Journal of medicinal chemistry 1995, 38 (22), 4343–4362. [DOI] [PubMed] [Google Scholar]
- 7.Quinn JF; Whittaker MR; Davis TP, Delivering nitric oxide with nanoparticles. Journal of Controlled Release 2015, 205, 190–205. [DOI] [PubMed] [Google Scholar]
- 8.Wang PG; Xian M; Tang X; Wu X; Wen Z; Cai T; Janczuk AJ, Nitric oxide donors: chemical activities and biological applications. Chemical reviews 2002, 102 (4), 1091–1134. [DOI] [PubMed] [Google Scholar]
- 9.Riccio DA; Schoenfisch MH, Nitric oxide release: Part I. Macromolecular scaffolds. Chemical Society Reviews 2012, 41 (10), 3731–3741. [DOI] [PMC free article] [PubMed] [Google Scholar]
- 10.Carpenter AW; Schoenfisch MH, Nitric oxide release: Part II. Therapeutic applications. Chemical Society Reviews 2012, 41 (10), 3742–3752. [DOI] [PMC free article] [PubMed] [Google Scholar]
- 11.Coneski PN; Schoenfisch MH, Nitric oxide release: Part III. Measurement and reporting. Chemical Society Reviews 2012, 41 (10), 3753–3758. [DOI] [PMC free article] [PubMed] [Google Scholar]
- 12.Phillips MC, Molecular mechanisms of cellular cholesterol efflux. Journal of Biological Chemistry 2014, 289 (35), 24020–24029. [DOI] [PMC free article] [PubMed] [Google Scholar]
- 13.Luthi AJ; Patel PC; Ko CH; Mutharasan RK; Mirkin CA; Thaxton CS, Nanotechnology for synthetic high-density lipoproteins. Trends in molecular medicine 2010, 16 (12), 553–560. [DOI] [PMC free article] [PubMed] [Google Scholar]
- 14.Thaxton CS; Rink JS; Naha PC; Cormode DP, Lipoproteins and lipoprotein mimetics for imaging and drug delivery. Advanced drug delivery reviews 2016, 106, 116–131. [DOI] [PMC free article] [PubMed] [Google Scholar]
- 15.Duivenvoorden R; Tang J; Cormode DP; Mieszawska AJ; Izquierdo-Garcia D; Ozcan C; Otten MJ; Zaidi N; Lobatto ME; van Rijs SM; Priem B; Kuan EL; Martel C; Hewing B; Sager H; Nahrendorf M; Randolph GJ; Stroes ESG; Fuster V; Fisher EA; Fayad ZA; Mulder WJM, A statin-loaded reconstituted high-density lipoprotein nanoparticle inhibits atherosclerotic plaque inflammation. Nature Communications 2014, 5. [DOI] [PMC free article] [PubMed] [Google Scholar]
- 16.Gomaraschi M; Calabresi L; Franceschini G, Protective effects of HDL against ischemia/reperfusion injury. Frontiers in pharmacology 2016, 7, Article 2. [DOI] [PMC free article] [PubMed] [Google Scholar]
- 17.Huang H; Cruz W; Chen J; Zheng G, Learning from biology: synthetic lipoproteins for drug delivery. Wiley Interdisciplinary Reviews: Nanomedicine and Nanobiotechnology 2015, 7 (3), 298–314. [DOI] [PMC free article] [PubMed] [Google Scholar]
- 18.Katz E; Willner I, Integrated nanoparticle–biomolecule hybrid systems: synthesis, properties, and applications. Angewandte Chemie International Edition 2004, 43 (45), 6042–6108. [DOI] [PubMed] [Google Scholar]
- 19.Niemeyer CM, Nanoparticles, proteins, and nucleic acids: biotechnology meets materials science. Angewandte Chemie International Edition 2001, 40 (22), 4128–4158. [DOI] [PubMed] [Google Scholar]
- 20.Thaxton CS; Daniel WL; Giljohann DA; Thomas AD; Mirkin CA, Templated spherical high density lipoprotein nanoparticles. Journal of the American Chemical Society 2009, 131 (4), 1384–1385. [DOI] [PMC free article] [PubMed] [Google Scholar]
- 21.Luthi AJ; Zhang H; Kim D; Giljohann DA; Mirkin CA; Thaxton CS, Tailoring of biomimetic high-density lipoprotein nanostructures changes cholesterol binding and efflux. ACS nano 2011, 6 (1), 276–285. [DOI] [PMC free article] [PubMed] [Google Scholar]
- 22.Rink JS; Yang S; Cen O; Taxter T; McMahon KM; Misener S; Behdad A; Longnecker R; Gordon LI; Thaxton CS, Rational Targeting of Cellular Cholesterol in Diffuse Large B-Cell Lymphoma (DLBCL) Enabled by Functional Lipoprotein Nanoparticles: A Therapeutic Strategy Dependent on Cell of Origin. Molecular Pharmaceutics 2017, 14 (11), 4042–4051. [DOI] [PMC free article] [PubMed] [Google Scholar]
- 23.Foit L; Thaxton CS, Synthetic high-density lipoprotein-like nanoparticles potently inhibit cell signaling and production of inflammatory mediators induced by lipopolysaccharide binding Toll-like receptor 4. Biomaterials 2016, 100, 67–75. [DOI] [PubMed] [Google Scholar]
- 24.McMahon KM; Mutharasan RK; Tripathy S; Veliceasa D; Bobeica M; Shumaker DK; Luthi AJ; Helfand BT; Ardehali H; Mirkin CA, Biomimetic high density lipoprotein nanoparticles for nucleic acid delivery. Nano letters 2011, 11 (3), 1208–1214. [DOI] [PMC free article] [PubMed] [Google Scholar]
- 25.Meyers MW; Rink JS; Jiang Q; Kelly ME; Vercammen JM; Thaxton CS; Kibbe MR, Systemically administered collagen‐targeted gold nanoparticles bind to arterial injury following vascular interventions. Physiological reports 2017, 5 (4), e13128. [DOI] [PMC free article] [PubMed] [Google Scholar]
- 26.Plebanek MP; Mutharasan RK; Volpert O; Matov A; Gatlin JC; Thaxton CS, Nanoparticle targeting and cholesterol flux through scavenger receptor type B-1 inhibits cellular exosome uptake. Scientific reports 2015, 5. [DOI] [PMC free article] [PubMed] [Google Scholar]
- 27.Angeloni NL; McMahon KM; Swaminathan S; Plebanek MP; Osman I; Volpert OV; Thaxton CS, Pathways for modulating exosome lipids identified by high-density lipoprotein-like nanoparticle binding to scavenger receptor type B-1. Scientific reports 2016, 6, 22915. [DOI] [PMC free article] [PubMed] [Google Scholar]
- 28.McMahon KM; Plebanek MP; Thaxton CS, Properties of Native High‐Density Lipoproteins Inspire Synthesis of Actively Targeted In Vivo siRNA Delivery Vehicles. Advanced Functional Materials 2016, 26 (43), 7824–7835. [DOI] [PMC free article] [PubMed] [Google Scholar]
- 29.Yang S; Damiano MG; Zhang H; Tripathy S; Luthi AJ; Rink JS; Ugolkov AV; Singh AT; Dave SS; Gordon LI, Biomimetic, synthetic HDL nanostructures for lymphoma. Proceedings of the National Academy of Sciences 2013, 110 (7), 2511–2516. [DOI] [PMC free article] [PubMed] [Google Scholar]
- 30.Luthi AJ; Lyssenko NN; Quach D; McMahon KM; Millar JS; Vickers KC; Rader DJ; Phillips MC; Mirkin CA; Thaxton CS, Robust passive and active efflux of cellular cholesterol to a designer functional mimic of high density lipoprotein. Journal of lipid research 2015, 56 (5), 972–985. [DOI] [PMC free article] [PubMed] [Google Scholar]
- 31.Sun W; Kewalramani S; Hujsak K; Zhang H; Bedzyk MJ; Dravid VP; Thaxton CS, Mesophase in a Thiolate-Containing Diacyl Phospholipid Self-Assembled Monolayer. Langmuir 2015, 31 (10), 3232–3241. [DOI] [PubMed] [Google Scholar]
- 32.Zhang X; Mansouri S; Mbeh D; Yahia LH; Sacher E; Veres T, Nitric oxide delivery by core/shell superparamagnetic nanoparticle vehicles with enhanced biocompatibility. Langmuir 2012, 28 (35), 12879–12885. [DOI] [PubMed] [Google Scholar]
- 33.Filipovic MR; Miljkovic JL; Nauser T; Royzen M; Klos K; Shubina T; Koppenol WH; Lippard SJ; Ivanović-Burmazović, I., Chemical characterization of the smallest S-nitrosothiol, HSNO; cellular cross-talk of H2S and S-nitrosothiols. Journal of the American Chemical Society 2012, 134 (29), 12016–12027. [DOI] [PMC free article] [PubMed] [Google Scholar]
- 34.Pulfer M; Murphy RC, Electrospray mass spectrometry of phospholipids. Mass spectrometry reviews 2003, 22 (5), 332–364. [DOI] [PubMed] [Google Scholar]
- 35.Bulaj G; Kortemme T; Goldenberg DP, Ionization− reactivity relationships for cysteine thiols in polypeptides. Biochemistry 1998, 37 (25), 8965–8972. [DOI] [PubMed] [Google Scholar]
- 36.Ellman GL, Tissue sulfhydryl groups. Archives of biochemistry and biophysics 1959, 82 (1), 70–77. [DOI] [PubMed] [Google Scholar]
- 37.Thomas CE; Darley-Usmar V, Forum on therapeutic applications of reactive oxygen and nitrogen species in human disease. Free radical biology & medicine 2000, 28 (10), 1449–1450. [DOI] [PubMed] [Google Scholar]
- 38.Sun W; Wu W; McMahon KM; Rink JS; Thaxton CS, Mosaic Interdigitated Structure in Nanoparticle‐Templated Phospholipid Bilayer Supports Partial Lipidation of Apolipoprotein A‐I. Particle & Particle Systems Characterization 2016, 33 (6), 300–305. [DOI] [PMC free article] [PubMed] [Google Scholar]
- 39.Fendler JH; Meldrum FC, The colloid chemical approach to nanostructured materials. Advanced Materials 1995, 7 (7), 607–632. [Google Scholar]
- 40.Johnson TA; Stasko NA; Matthews JL; Cascio WE; Holmuhamedov EL; Johnson CB; Schoenfisch MH, Reduced ischemia/reperfusion injury via glutathione-initiated nitric oxide-releasing dendrimers. Nitric oxide : biology and chemistry / official journal of the Nitric Oxide Society 2010, 22 (1), 30–36. [DOI] [PubMed] [Google Scholar]
- 41.Singh SP; Wishnok JS; Keshive M; Deen WM; Tannenbaum SR, The chemistry of the S-nitrosoglutathione/glutathione system. Proc Natl Acad Sci U S A 1996, 93 (25), 14428–14433. [DOI] [PMC free article] [PubMed] [Google Scholar]
- 42.Barak LS; Webb WW, Fluorescent low density lipoprotein for observation of dynamics of individual receptor complexes on cultured human fibroblasts. The Journal of cell biology 1981, 90 (3), 595–604. [DOI] [PMC free article] [PubMed] [Google Scholar]
- 43.Honig MG; Hume RI, Fluorescent carbocyanine dyes allow living neurons of identified origin to be studied in long-term cultures. The Journal of cell biology 1986, 103 (1), 171–187. [DOI] [PMC free article] [PubMed] [Google Scholar]
- 44.Lohne K; Urdal P; Leren TP; Tonstad S; Ose L, Standardization of a flow cytometric method for measurement of low-density lipoprotein receptor activity on blood mononuclear cells. Cytometry 1995, 20 (4), 290–295. [DOI] [PubMed] [Google Scholar]
- 45.Kojima H; Sakurai K; Kikuchi K; KAWAHARA S; KIRINO Y; NAGOSHI H; HIRATA Y; NAGANO T, Development of a fluorescent indicator for nitric oxide based on the fluorescein chromophore. Chemical and pharmaceutical bulletin 1998, 46 (2), 373–375. [DOI] [PubMed] [Google Scholar]
- 46.Kojima H; Nakatsubo N; Kikuchi K; Kawahara S; Kirino Y; Nagoshi H; Hirata Y; Nagano T, Detection and imaging of nitric oxide with novel fluorescent indicators: diaminofluoresceins. Analytical chemistry 1998, 70 (13), 2446–2453. [DOI] [PubMed] [Google Scholar]
- 47.Carden DL; Granger DN, Pathophysiology of ischaemia–reperfusion injury. The Journal of pathology 2000, 190 (3), 255–266. [DOI] [PubMed] [Google Scholar]
- 48.Collard CD; Gelman S, Pathophysiology, clinical manifestations, and prevention of ischemia-reperfusion injury. The Journal of the American Society of Anesthesiologists 2001, 94 (6), 1133–1138. [DOI] [PubMed] [Google Scholar]
- 49.Brand K; Page S; Rogler G; Bartsch A; Brandl R; Knuechel R; Page M; Kaltschmidt C; Baeuerle PA; Neumeier D, Activated transcription factor nuclear factor-kappa B is present in the atherosclerotic lesion. The Journal of clinical investigation 1996, 97 (7), 1715–1722. [DOI] [PMC free article] [PubMed] [Google Scholar]
- 50.Collins T; Cybulsky MI, NF-kappaB: pivotal mediator or innocent bystander in atherogenesis? The Journal of clinical investigation 2001, 107 (3), 255–264. [DOI] [PMC free article] [PubMed] [Google Scholar]
- 51.Cuaz-Perolin C; Billiet L; Bauge E; Copin C; Scott-Algara D; Genze F; Buchele B; Syrovets T; Simmet T; Rouis M, Antiinflammatory and antiatherogenic effects of the NF-kappaB inhibitor acetyl-11-keto-beta-boswellic acid in LPS-challenged ApoE−/− mice. Arteriosclerosis, thrombosis, and vascular biology 2008, 28 (2), 272–277. [DOI] [PubMed] [Google Scholar]
- 52.Denecke C; Tullius S, Innate and adaptive immune responses subsequent to ischemia-reperfusion injury in the kidney. Progrès en urologie 2014, 24, S13–S19. [DOI] [PubMed] [Google Scholar]
- 53.Roberts BW; Mitchell J; Kilgannon JH; Chansky ME; Trzeciak S, Nitric oxide donor agents for the treatment of ischemia/reperfusion injury in human subjects: a systematic review. Shock 2013, 39 (3), 229–239. [DOI] [PubMed] [Google Scholar]
- 54.de la Llera-Moya M; Drazul-Schrader D; Asztalos BF; Cuchel M; Rader DJ; Rothblat GH, The ability to promote efflux via ABCA1 determines the capacity of serum specimens with similar high-density lipoprotein cholesterol to remove cholesterol from macrophages. Arteriosclerosis, thrombosis, and vascular biology 2010, 30 (4), 796–801. [DOI] [PMC free article] [PubMed] [Google Scholar]
- 55.Owens GK; Kumar MS; Wamhoff BR, Molecular regulation of vascular smooth muscle cell differentiation in development and disease. Physiological reviews 2004, 84 (3), 767–801. [DOI] [PubMed] [Google Scholar]
- 56.Schwartz SM, Perspectives series: cell adhesion in vascular biology. Smooth muscle migration in atherosclerosis and restenosis. Journal of Clinical Investigation 1997, 99 (12), 2814–2817. [DOI] [PMC free article] [PubMed] [Google Scholar]
- 57.Yu X; Li Z, MicroRNAs regulate vascular smooth muscle cell functions in atherosclerosis. International journal of molecular medicine 2014, 34 (4), 923–933. [DOI] [PubMed] [Google Scholar]
- 58.Sarkar R; Meinberg EG; Stanley JC; Gordon D; Webb RC, Nitric oxide reversibly inhibits the migration of cultured vascular smooth muscle cells. Circulation research 1996, 78 (2), 225–230. [DOI] [PubMed] [Google Scholar]
- 59.von der Leyen HE; Gibbons GH; Morishita R; Lewis NP; Zhang L; Nakajima M; Kaneda Y; Cooke JP; Dzau VJ, Gene therapy inhibiting neointimal vascular lesion: in vivo transfer of endothelial cell nitric oxide synthase gene. Proc Natl Acad Sci U S A 1995, 92 (4), 1137–1141. [DOI] [PMC free article] [PubMed] [Google Scholar]
- 60.Tamama K; Tomura H; Sato K; Malchinkhuu E; Damirin A; Kimura T; Kuwabara A; Murakami M; Okajima F, High-density lipoprotein inhibits migration of vascular smooth muscle cells through its sphingosine 1-phosphate component. Atherosclerosis 2005, 178 (1), 19–23. [DOI] [PubMed] [Google Scholar]
- 61.Liu Q; Li J; Liang Q; Wang D; Luo Y; Yu F; Janicki JS; Fan D, Sparstolonin B suppresses rat vascular smooth muscle cell proliferation, migration, inflammatory response and lipid accumulation. Vascular pharmacology 2015, 67–69, 59–66. [DOI] [PMC free article] [PubMed] [Google Scholar]
- 62.Zhang ZW, J.; Wang X; Han J, Kidney Transplantation in Mice. In Experimental Organ Transplantation, 1st edition ed.; Chen HQ, S., Ed. Nova Science Pub Inc: New York, 2013; pp 45–64. [Google Scholar]
- 63.Northcott PA; Shih DJ; Peacock J; Garzia L; Morrissy S; Zichner T; Stütz AM; Korshunov A; Reimand J; Schumacher SE, Subgroup specific structural variation across 1,000 medulloblastoma genomes. Nature 2012, 488 (7409), 49–56. [DOI] [PMC free article] [PubMed] [Google Scholar]
- 64.Pomeroy SL; Tamayo P; Gaasenbeek M; Sturla LM; Angelo M; McLaughlin ME; Kim JY; Goumnerova LC; Black PM; Lau C; Allen JC; Zagzag D; Olson JM; Curran T; Wetmore C; Biegel JA; Poggio T; Mukherjee S; Rifkin R; Califano A; Stolovitzky G; Louis DN; Mesirov JP; Lander ES; Golub TR, Prediction of central nervous system embryonal tumour outcome based on gene expression. Nature 2002, 415 (6870), 436–442. [DOI] [PubMed] [Google Scholar]
- 65.Jang HR; Rabb H, Immune cells in experimental acute kidney injury. Nature Reviews Nephrology 2015, 11 (2), 88–101. [DOI] [PubMed] [Google Scholar]
- 66.Eltzschig HK; Eckle T, Ischemia and reperfusion [mdash] from mechanism to translation. Nature medicine 2011, 17 (11), 1391–1401. [DOI] [PMC free article] [PubMed] [Google Scholar]
- 67.Ignarro LJ; Napoli C, Novel features of nitric oxide, endothelial nitric oxide synthase, and atherosclerosis. Current atherosclerosis reports 2004, 6 (4), 281–287. [DOI] [PubMed] [Google Scholar]
- 68.Kuhlencordt PJ; Gyurko R; Han F; Scherrer-Crosbie M; Aretz TH; Hajjar R; Picard MH; Huang PL, Accelerated atherosclerosis, aortic aneurysm formation, and ischemic heart disease in apolipoprotein E/endothelial nitric oxide synthase double-knockout mice. Circulation 2001, 104 (4), 448–454. [DOI] [PubMed] [Google Scholar]
- 69.Schindelin J; Arganda-Carreras I; Frise E; Kaynig V; Longair M; Pietzsch T; Preibisch S; Rueden C; Saalfeld S; Schmid B; Tinevez JY; White DJ; Hartenstein V; Eliceiri K; Tomancak P; Cardona A, Fiji: an open-source platform for biological-image analysis. Nature methods 2012, 9 (7), 676–682. [DOI] [PMC free article] [PubMed] [Google Scholar]
Associated Data
This section collects any data citations, data availability statements, or supplementary materials included in this article.