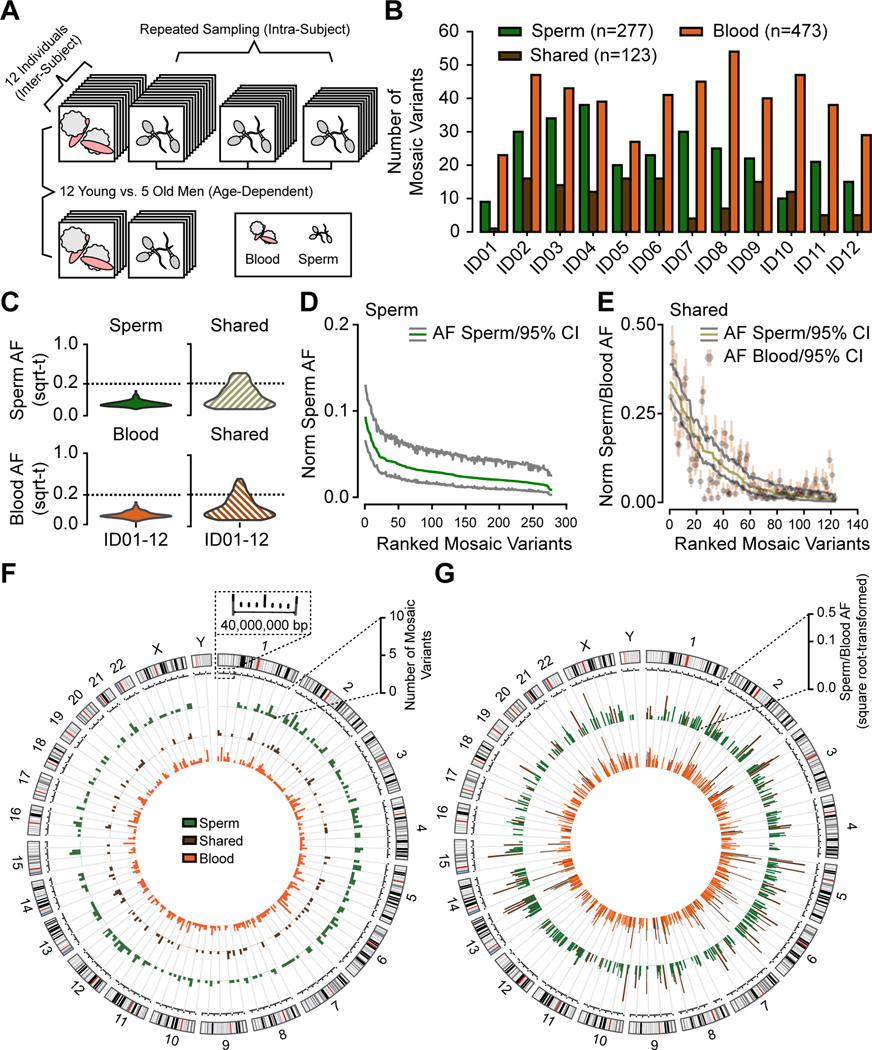
Figure 1. Analysis in 12 young aged men uncovers the landscape of sperm clonal mosaicism.
(A) Sampling strategy: 12 healthy males of young age (YA, 18–22 years, blood and up to 3 sperm samples) and 5 healthy males of advanced age (AA, >48 years, blood and 1 sperm sample). Samples subjected to 300× whole-genome sequencing (WGS), then the MSMF computational workflow (see STAR Methods).
(B) Bar charts: number of clonal mosaic variants per individual from each class (sperm-specific: ‘Sperm’, blood-specific: ‘Blood’, tissue-shared: ‘Shared’); Blood typically outnumber Shared or Sperm.
(C) AF distribution (square root-transformed; sqrt-t) of Sperm, Shared, and Blood variants in YA cohort. Shared variants showed higher peak and overall AF compared to Sperm and Blood. sqrt-t: square-root transformed.
(D-E) Rank plot of estimated sperm and blood AFs with 95% exact binomial confidence intervals (CIs) from the YA cohort, grouped by class. Sperm (D) showed steeper initial decay curves, suggesting a relatively lower mutation or higher expansion rate than Shared (E), showing a shallower decay. Norm Sperm AF: sex-chromosome normalized allelic fraction.
(F) Circos histograms for the number of mSNV/INDELs detected from the YA cohort. Variants were evenly distributed across the genome. Colors distinguish classes of variants.
(G) Mosaic SNV/INDELs and the corresponding allelic fractions (AFs) detected from the YA cohort, colors are the same as B. Inner circle: AFs in the blood; outer circle: AFs in the sperm. Colors distinguish classes of variants. Note that Shared variants in brown will be represented in both circles as they are—by definition—detected within both tissues.

