

Abstract
In demyelinating diseases, such as multiple sclerosis, primary loss of myelin and subsequent neuronal degeneration throughout the CNS impair patient functionality. While the importance of mechanistic target of rapamycin (mTOR) signaling during developmental myelination is known, no studies have yet directly examined the function of mTOR signaling specifically in the oligodendrocyte (OL) lineage during remyelination. Here, we conditionally deleted Mtor from adult oligodendrocyte precursor cells (OPCs) using Ng2-CreERT in male adult mice to test its function in new OLs responsible for remyelination. During early remyelination after cuprizone-induced demyelination, mice lacking mTOR in adult OPCs had unchanged OL numbers but thinner myelin. Myelin thickness recovered by late-stage repair, suggesting a delay in myelin production when Mtor is deleted from adult OPCs. Surprisingly, loss of mTOR in OPCs had no effect on efficiency of remyelination after lysophosphatidylcholine lesions in either the spinal cord or corpus callosum, suggesting that mTOR signaling functions specifically in a pathway dysregulated by cuprizone to promote remyelination efficiency. We further determined that cuprizone and inhibition of mTOR cooperatively compromise metabolic function in primary rat OLs undergoing differentiation. Together, our results support the conclusion that mTOR signaling in OPCs is required to overcome the metabolic dysfunction in the cuprizone-demyelinated adult brain.
SIGNIFICANCE STATEMENT Impaired remyelination by oligodendrocytes contributes to the progressive pathology in multiple sclerosis, so it is critical to identify mechanisms of improving remyelination. The goal of this study was to examine mechanistic target of rapamycin (mTOR) signaling in remyelination. Here, we provide evidence that mTOR signaling promotes efficient remyelination of the brain after cuprizone-mediated demyelination but has no effect on remyelination after lysophosphatidylcholine demyelination in the spinal cord or brain. We also present novel data revealing that mTOR inhibition and cuprizone treatment additively affect the metabolic profile of differentiating oligodendrocytes, supporting a mechanism for the observed remyelination delay. These data suggest that altered metabolic function may underlie failure of remyelination in multiple sclerosis lesions and that mTOR signaling may be of therapeutic potential for promoting remyelination.
Keywords: cuprizone, glycolysis, mTOR, mitochondria, oligodendrocyte, remyelination
Introduction
Loss of myelin and oligodendrocytes (OLs) in multiple sclerosis (MS) results in demyelinated CNS lesions, which contain bare axons that can no longer properly function (Haines et al., 2011; Alizadeh et al., 2015). Because of the immunologic nature of MS, currently available therapies target demyelination by suppressing the immune system; however, no approved treatments promote remyelination. Normally, oligodendrocyte precursor cells (OPCs) proliferate and differentiate into new mature OLs that remyelinate lesions. However, progressive loss of function occurs in MS because of the eventual failure of the oligodendroglia to remyelinate in later stages of the disease. A predominant hypothesis on remyelination failure in the adult is that OPCs fail to differentiate into mature OLs, and mature OLs that are present do not successfully produce and wrap myelin sheaths (Franklin, 2002). Interestingly, in some MS lesions, OLs display primary dystrophy and metabolic disruption, supporting the possibility of intrinsic OL pathology that contributes to demyelination and to remyelination failure (Aboul-Enein et al., 2003; Lassmann, 2003; Aboul-Enein and Lassmann, 2005; Mahad et al., 2008). This revelation suggests that OLs with metabolic abnormalities may be, at least in some cases, the primary cause of MS. The approach to MS therapeutic development should include consideration of supporting OL homeostasis to potentially reduce demyelination and improve remyelination.
The mechanistic target of rapamycin (mTOR) signaling pathway is a major intracellular signaling pathway that regulates developmental myelination (Bercury et al., 2014; Wahl et al., 2014). Previous studies revealed that mTOR signaling promotes OPC differentiation in vitro (Tyler et al., >2009, 2011; Guardiola-Diaz et al., 2012). Subsequent in vivo studies examining mTOR signaling in the OL lineage revealed that mTOR signaling promotes OPC differentiation into mature OLs during developmental myelination of the spinal cord (Bercury et al., 2014; Wahl et al., 2014; Ornelas et al., 2020). In addition, the spinal cord is hypomyelinated when mTOR signaling is disrupted developmentally in the OL lineage (Bercury et al., 2014; Lebrun-Julien et al., 2014; Wahl et al., 2014; Grier et al., 2017). In contrast, the loss of mTOR signaling in the OL lineage has no obvious impact on OL differentiation or myelination in the developing brain (Bercury et al., 2014; Wahl et al., 2014). However, increasing mTOR signaling activity, either through the deletion of phosphatase and tensin homolog or the expression of constitutively active serine/threonine kinase AKT, results in hypermyelination of the CNS, including the brain (Flores et al., 2008; Goebbels et al., 2010; Harrington et al., 2010).
Only a few studies have examined mTOR signaling in remyelination, and none has directly examined the cell-autonomous function of mTOR within the OL lineage during remyelination. Pharmacological inhibition of mTOR systemically using rapamycin (RAPA) and concurrent administration of cuprizone (CPZ) results in more complete brain demyelination than CPZ alone and in a severe delay in remyelination (Sachs et al., 2014). However, phosphatase and tensin homolog deletion from OLs to increase mTOR signaling has no effect on remyelination after lysophosphatidylcholine (LPC) demyelination of the spinal cord (Harrington et al., 2010).
In this study, we used tamoxifen-inducible Ng2-CreERT;Mtorfl/fl mice to delete Mtor from adult OPCs that generate new OLs responsible for remyelination. While existing mature OLs appear to contribute to remyelination in the rodent CNS under specific circumstances, such as a motor learning paradigm or genetic modulation (Mason et al., 2000; Bacmeister et al., 2020; Jeffries et al., 2020), published studies indicate that remyelination is otherwise largely a result of new OL production (Targett et al., 1996; Crawford et al., 2016). We show that Mtor deletion from adult OPCs significantly delays remyelination after CPZ demyelination but has no effect on remyelination after LPC demyelination of either the spinal cord or brain, suggesting that Mtor deletion and CPZ treatment may target a similar pathway to impair remyelination. The mechanism of CPZ demyelination in the brain is unknown but has been hypothesized to involve effects on mitochondria (Praet et al., 2014). We now show that mTOR inhibition and CPZ additively impair mitochondrial function, supporting altered metabolic function during remyelination. Together, our data support the conclusion that mTOR signaling is necessary for efficient remyelination of the CPZ-demyelinated brain because of its function in mitochondrial dynamics. These data reveal that downstream targets of mTOR signaling may be potential therapeutic targets for MS patients who exhibit lesions characterized by metabolic disruption.
Materials and Methods
Experimental animals
Homozygous Mtorfl/fl (Mtortm1.1Clyn) mice (Lang et al., 2010) on a C57Bl/6 background obtained from Christopher Lynch (Pennsylvania State College of Medicine) were bred to mice that carried a homozygous dual reporter, referred to as DR/DR (B6.129(Cg)-Gt(ROSA)26Sortm4(ACTB-tdTomato,-EGFP)Luo/J, The Jackson Laboratory, RRID:IMSR_JAX:007676). The mice express TdTomato in all cells but on loxP recombination express a membrane-bound GFP reporter. Homozygous Mtorfl/fl;DR/DR mice were then bred to heterozygous Ng2-CreERT (008538, The Jackson Laboratory, RRID:IMSR_JAX:008538) mice to establish the Ng2-CreERT;Mtorfl/fl;DR/DR (Ng2-Mtor cKO) mouse line with Cre+ conditional KO mice and Cre– control littermates. In the Ng2-Mtor cKO mouse CNS, NG2+ OPCs express tamoxifen-inducible CreERT recombinase, which enters the nucleus and recombines at loxP sites only on tamoxifen administration. Upon tamoxifen administration, NG2-expressing OPCs exhibit deletion of Mtor and expression of a membrane-bound GFP reporter. In order to induce recombination, tamoxifen (75 mg/kg; 10 mg/ml stock in 9:1 sunflower seed oil:ethanol) was administered by intraperitoneal injection to adult (7-10 weeks) Cre+ and Cre– control littermate mice for 5 consecutive days, resulting in recombination of NG2+ OPCs in adult Ng2-Mtor cKO mice. Mice were kept in microisolation in a pathogen-free environment and maintained on a 12 h light/12 h dark cycle with standard mouse chow and water ad libitum. All research and animal care procedures were approved by the Rutgers New Jersey Medical School Institutional Animal Care and Use Committee. Only male mice were used for all experiments to avoid endogenous estrogen-mediated Cre leakiness and variability associated with CPZ-mediated demyelination in females.
CPZ demyelination
In order to induce demyelination of the brain using CPZ, 3 d after the last tamoxifen injection, 8- to 11-week-old male Ng2-Mtor cKO and control littermate male mice were fed either a custom irradiated 0.2% CPZ (C9012, Sigma-Aldrich) diet (TD.01453, Envigo) or a control (CTL) irradiated Teklad 16% global protein diet (2916, Envigo) matched to the base diet used to manufacture the 0.2% CPZ diet. Each mouse received 1.5 pellets/day (equivalent to ∼6 g) of either CTL or CPZ diet, and uneaten CPZ pellets were removed and replenished every 2-3 d for the duration of demyelination. Uneaten control pellets were removed and replenished weekly. Both CTL and CPZ diets were administered over the course of either 4 or 6 weeks, as described for each experiment. Mouse weights were monitored weekly; mice did not exhibit ≥15% total weight loss and did not require intervention. In experiments where remyelination was observed after removal of CPZ, both CTL and CPZ-fed mice were switched to the standard mouse chow provided by the animal facility to allow endogenous remyelination to occur over the course of 2-4 weeks.
LPC injection
LPC (L4129, Sigma-Aldrich) injections were performed on 8- to 11-week-old Ng2-Mtor cKO and control littermate male mice 4-5 d after the last tamoxifen injection. For dorsal white matter lesions, a T10 dorsal laminectomy was performed and a hole was made in the dura using a 26 gauge syringe needle. A 5 µl Neuros syringe (65460-02, Hamilton) with a custom 33 gauge needle (7803-05, Hamilton) was used to inject 1 μl of 1% LPC in 0.9% NaCl at a rate of 0.25-0.3 µl/min directly into the dorsal white matter, which was targeted by inserting the entire needle bevel into the spinal cord. For ventral white matter lesions, mice were placed over a pillow bolster and the gap between T10 and T11 dorsal lamina exposed with microscissors. The same syringe and custom 33 gauge needle were used, but the needle was lowered into the spinal cord at the contralateral edge of the dorsal white matter to the lesion site at an angle of 45°. Upon touching the surface of the spinal cord, the needle was lowered an additional 1.5 mm. Similar to the dorsal white matter injections, 1 µl of 1% LPC in 0.9% NaCl was injected into the lateral ventral white matter at a rate of 0.2 µl/min using a Pump 11 Elite (Harvard Apparatus). For injection into the corpus callosum, the skull was exposed and bregma identified. Using a stereotactic frame, the same syringe and needle combination was positioned 1.1 mm rostral and 1.0 mm lateral to bregma. A Dremel was used to drill a hole in the skull over the injection site. The 33 gauge needle was lowered until the tip of the needle touched the surface of the cortex, and then the needle was lowered an additional 1.8 mm into the corpus callosum; 1.5 µl of 1% LPC in 0.9% NaCl was injected into callosum at a rate of 0.2 µl/min using a Pump 11 Elite. Importantly, for all LPC injections, charcoal was used to mark the site of the injection to allow for identification of lesion center regardless of remyelination status.
Immunostaining of frozen sections
Mice were intracardially perfused using 10 ml 1× PBS followed by 40 ml 3% PFA in 1× PBS. Brains and/or spinal cords were dissected and postfixed overnight at 4°C in 1% PFA, followed by cryoprotection for 48 h in 30% sucrose in mQH2O at 4°C. Tissues were embedded in OCT and cryosectioned at either 12 µm (for spinal cords) or 20 µm (for brains). Immunolabeling was performed as described previously (McLane et al., 2017), with specific treatments used for antibody staining as necessary. Briefly, for CC1 and SOX10 immunostaining, sections were subjected to antigen retrieval in 250 ml 0.01 m sodium citrate buffer heated 3 × 40 s at medium power (1450 wattage) with 25 min soaks between microwaving sessions. A mouse-on-mouse kit (M.O.M. kit, BMK-2202, Vector Laboratories, RRID:AB_2336833) was used to reduce nonspecific binding of the mouse anti-CC1 antibody. The M.O.M. mouse Ig block was performed at room temperature for 60 min before a 30 min room temperature incubation with mouse anti-CC1 antibody in M.O.M. diluent (M.O.M. protein concentrate in 1× TBS). Sections were blocked with 10% BSA (A6003, Sigma-Aldrich) and 10% serum of the appropriate secondary antibody host (donkey serum, D6993, Sigma-Aldrich; rat serum, R9759, Sigma-Aldrich; goat serum, G9023, Sigma-Aldrich) in 1× TBS for 60 min at room temperature followed by 4°C overnight incubation with primary antibodies diluted in 1% BSA, 1% donkey serum, 1% rat serum, and 0.1% Triton X-100 (T8787, Sigma-Aldrich) in 1× TBS. For myelin basic protein (MBP) staining, autofluorescence was reduced by treating with 50 mm ammonium chloride for 30 min; then sections were delipidated in 100% EtOH for 10 min before antigen retrieval as described above. Immunofluorescent-stained sections were coverslipped using Fluorogel (17 985-10, Electron Microscopy Sciences) and then sealed with nail lacquer. For myelin oligodendrocyte glycoprotein (MOG) staining, sections were delipidated for 10 min in 100% EtOH and then treated with 3% H2O2 to eliminate endogenous peroxidase activity. The NovaRed substrate kit (SK-4800, Vector Laboratories, RRID:AB_2336845) was used to detect positive signal; then slides were dehydrated in EtOH and coverslipped with Cytoseal (8312-4, Thermo Fisher Scientific). MBP- and MOG-stained sections were counterstained with DAPI. Primary antibodies used were mouse anti-CC1 (1:100, OP80, Millipore, RRID:AB_2057371), goat anti-SOX10 (1:25, AF2864, R&D Systems, RRID:AB_442208), rabbit anti-MOG (1:1000, ab32760, Abcam, RRID:AB_2145529), and mouse anti-MBP (1:1000, SMI-99, Covance, RRID:AB_2314772). Secondary antibodies used were rat anti-mouse IgG2β-647 (1:350, ab172327, Abcam, RRID:AB_2650513), donkey anti-goat AMCA (1:100, 705-155-147, Jackson ImmunoResearch Laboratories), goat anti-mouse 647 (1:750, A21235, Invitrogen, RRID:AB_2535804), and biotinylated goat anti-rabbit (1:500, BA-1000, Vector Laboratories, RRID:AB_2313606) followed by streptavidin-HRP (1:1000, 21126, Pierce).
Cell counts
To analyze CC1 and SOX10 immunostaining, images were taken with a 10× objective using an Olympus AX-70 microscope. Cell counts were performed using either Photoshop (for dorsal LPC lesions) or ImageJ software with the cell counter plugin (for all other experiments). For LPC lesions, the ROI was outlined as the entire lesion, defined by DAPI hypercellularity. For CPZ lesions, the entire midline callosum visible within the image was outlined as the ROI. The area in µm2 for each ROI was used to normalize all data to mm2. For all counts, 3 or 4 images/animal and 3 or 4 animals/group were analyzed. All SOX10+ cells within an ROI were counted, followed by all double-immunolabeled CC1+ SOX10+ cells. The number of CC1– SOX10+ OPCs was calculated by subtracting the number of CC1+ SOX10+ cells from the number of SOX10+ cells. Finally, the % of OL lineage cells positive for CC1 was calculated by dividing the number of CC1+ SOX10+ cells by the number of SOX10+ cells.
MBP and MOG image analysis
To analyze either MBP or MOG immunostaining, images were taken with either a 2× (for brain) or 10× (for spinal cord) objective using an Olympus AX-70 microscope. All analyses were performed using ImageJ software. For LPC lesions, the total lesion area was defined using DAPI hypercellularity; for CPZ lesions, the entire midline callosum visible in each 2× image was outlined as the ROI. For dorsal lesions, MBP and MOG area of positivity was calculated by measuring the positive area and expressed as a percentage of total lesion area. For ventral lesions and for CPZ lesions, MBP or MOG positivity was defined using the adjust threshold function for positive staining, and the area fraction within the ROI was calculated using ImageJ software. Data were then expressed as a percentage of the total lesion or callosal area.
Electron microscopy (EM)
Mice were transcardially perfused with 1× PBS followed by either 40 ml 3% PFA (15714-S, Electron Microscopy Sciences) in 1× PBS or 40 ml 2% PFA/2.5% glutaraldehyde (01909-199, PolySciences). For CPZ cohorts, brains were dissected and a 2 mm region just rostral of the hippocampus drop-fixed in 2% PFA/2.5% glutaraldehyde at 4°C overnight. For spinal cord LPC cohorts, spinal cords were dissected and the lesion center identified by the charcoal-marked injection site. Spinal cords were cut laterally at lesion center and drop-fixed in 2% PFA/2.5% glutaraldehyde overnight. For corpus callosum LPC cohorts, brains were dissected and the lesion site identified by the charcoal-marked injection site. Brains were cut in a rostral-caudal direction at lesion center and drop-fixed in 2% PFA/2.5% glutaraldehyde. Tissues were then embedded in 5% agarose in 0.1 m PB and sliced on a vibratome into 200- to 500-μm-thick sections. Sections with clear lesions were postfixed in 1% osmium and 1.5% potassium ferrocyanide followed by 1% osmium tetroxide, dehydrated in graded acetone with 2% uranyl acetate, and resin-embedded in Embed 812 (Electron Microscopy Sciences) using a PelcoBiowave Pro tissue processor (Ted Pella). One-micron-thick sections were cut from a trapezoid positioned over the lesioned area and mounted onto glass slides where they were then stained with a mixture of 1% toluidine blue, 1% methylene blue, and 1% sodium borate in water for ∼1 min. Ultrathin sections (65 nm) were cut at the same location within the lesion and mounted on Formvar-coated slot grids (Electron Microscopy Sciences). Blocks were sectioned deeper into the lesion, and another set of thick and ultrathin sections were collected for each sample. Ultrathin sections were viewed at 80 kV on a Tecnai G2 transmission electron microscope (FEI) and imaged with a side-mount AMT XR80S-B camera.
EM analysis
In order to calculate g-ratios, all axons within 2-4 electron micrographs were measured using ImageJ software to calculate the area of each axon as well as the total area of the myelinated fiber. Axon diameter and total myelinated fiber diameter were then extracted from each measured area in Microsoft Excel. At least 76 and up to 389 axons were measured in each animal, and 3 or 4 animals/group were analyzed. G-ratio was calculated as axon diameter/total myelinated fiber diameter. For average g-ratio, all measured g-ratios were averaged for each animal, and then each animal average used as a sample. For scatter plots and g-ratio distribution graphs, all measured g-ratios were used. In order to examine the number of myelinated axons, all myelinated axons within 3 electron micrographs/animal were counted using ImageJ software and the cell counter plugin. The number of myelinated axons within each animal was defined as the average number of myelinated axons in each micrograph. The ROI was defined as the entire micrograph area, 141.23 µm2.
Magnetic-activated cell sorting (MACS) isolation of NG2+/PDGFRα+ cells
Brain and spinal cord were dissected from Ng2-Mtor cKO mice and Cre– littermate controls at 9-12 weeks of age, 1-3 weeks after tamoxifen injections. Brain dissections included forebrain, midbrain, and cerebellum, and excluded olfactory bulb and brainstem. Spinal cord dissection included whole spinal cord. Three brain or three spinal cords were pooled for each sample. Tissues were dissociated into a single-cell suspension using the Neural Tissue Dissociation Kit (P) (Miltenyi 130-092-628). NG2+ and PDGFRα+ cells were isolated by MACS using anti-AN2 microbeads (Miltenyi 130-097-170), APC-conjugated CD140a Antibody (Miltenyi 130-102-473), and anti-APC microbeads (Miltenyi 130-090-855).
qRT-PCR
Primers were designed using the sequences of Mtor exons 49 and 50 and NCBI Primer Blast, and are as follows: Mtor Forward: GGCCAAGCTACTGTGGCTAA, Mtor Reverse: AGGGAGCGGGTATAGTTGGT. RNA was extracted from isolated NG2+/PDGFRα+ cells using the RNeasy Mini Prep Kit (QIAGEN) and the RNeasy Plus Micro Kit (QIAGEN). RNA concentration was measured using a NanoDrop spectrophotometer (Thermo Fisher Scientific), and cDNA was reverse-transcribed using the iScript cDNA Synthesis Kit (Bio-Rad, 1708890). RT-PCR was performed using SYBR green detection master mix (Bio-Rad 430001607) and amplification was normalized to expression levels of β-actin for each sample. RT-PCR was performed on the Applied Biosystems 7900B using the associated Sequence Detection System version 2.2.2. The thermal reaction profiles were performed as previously described (Tyler et al., 2009).
Rat primary OPC cultures
OPCs were purified from cortical mixed glial cultures by established methods and as for our prior studies (McCarthy and de Vellis, 1980; Tyler et al., 2009). Briefly, brains were removed from postnatal day 0-2 Sprague Dawley rat pups, and the cortices were dissected. Cortical pieces were enzymatically digested in 2.5% trypsin and DNase I followed by mechanical dissociation. Cells were resuspended in MEM-C, which consisted of MEM supplemented with 10% FBS, L-glutamine, and 1% penicillin-streptomycin, and plated in T75 flasks. The resulting mixed glial cultures were maintained for 10 d. Purified OPC cultures were isolated using a differential shake. OPCs were seeded onto poly-d-lysine-coated plates at a density of 5 × 10⁴ cells/cm2 in a chemically defined medium N2S. N2S consists of 66% N2B2 (DMEM/F12 supplemented with 0.66 mg/ml BSA, 10 ng/ml d-biotin, 5 µg/ml insulin, 20 nm progesterone, 100 μm putrescine, 5 ng/ml selenium, 50 µg/ml apo-transferrin, 100 U/ml penicillin, 100 µg/ml streptomycin, and 0.5% FBS) supplemented with 34% B104 conditioned media, 5 ng/ml FGF, and 0.5% FBS. Cell culture media (MEM, DMEM/F12), FBS, trypsin, and insulin-selenium-transferrin were purchased from Invitrogen-BRL. Additional N2 supplements (tri-iodothyronine and poly-d-lysine) were purchased from Sigma. Recombinant human FGF-2 was purchased from R&D Systems.
In vitro differentiation paradigm and treatments
To initiate OPC differentiation for primary rat OPCs, we followed an established mitogen withdrawal protocol (Tokumoto et al., 1999; Tyler et al., 2009). Briefly, OPCs were seeded onto poly-d-lysine-coated plates in N2S media and allowed to recover overnight. The following day, N2S media was replaced with differentiation media (mitogen-free N2B2 media supplemented with 30 ng/ml tri-iodothyronine and 0.5% FBS). To inhibit mTOR, cells were treated with 10 nm RAPA (553210, Calbiochem). This dose achieves effective mTOR inhibition in differentiating OLs based on our prior studies (Tyler et al., 2009, 2011). Stock solution of RAPA was prepared in DMSO. To treat with CPZ, cells were treated with 50 μm CPZ (C9012, Sigma-Aldrich). In vitro use of CPZ is uncommon as CPZ solubility in aqueous solutions is very low; however, various phenotypic and metabolic effects have been observed in primary OPC and OPC cell line cultures at concentrations ranging from 25 μm to 1 mm (Cammer, 1999; Benardais et al., 2013; Taraboletti et al., 2017); 2 mm CPZ stock solution was prepared in 25% EtOH in ddH2O. Control cultures received vehicle (DMSO and EtOH) alone. We selected 50 μm CPZ after performing an optimization experiment culturing a rat OPC cell line (CG-4) (Louis et al., 1992) with 25, 50, or 100 μm CPZ. Changes in cell morphology by MBP staining appeared in cultures treated with 50 μm CPZ without apparent cell loss, while cell death was observed in 100 μm CPZ cultures as well as vehicle cultures with the corresponding concentration of EtOH, indicating toxic EtOH levels. We were unable to dissolve higher concentrations of CPZ in lower concentrations of EtOH. Differentiation media with or without additional compounds was replenished every 48 h during experiments.
Live cell metabolic function
Seahorse XFp analyzer (Agilent Technologies) was used to measure metabolic function in live oligodendroglia. Primary OPCs were plated as described above in Seahorse cell culture microplates, allowed to recover overnight, then differentiated into OLs in the presence or absence of described compounds. After 3 d of differentiation, Seahorse XF Cell Mito Stress Test was performed following manufacturer instructions. In brief, oxygen consumption rate (OCR) and extracellular acidification rate (ECAR) were examined as measures of oxidative phosphorylation and glycolytic activity, respectively. Measurements were made under basal conditions, after addition of 1 mm oligomycin (ATP-synthase inhibitor), 2 mm carbonyl cyanide-4-(trifluoromethoxy) phenylhydrazone (FCCP, uncoupler of mitochondrial oxidative phosphorylation), and a 0.5 mm mixture of rotenone and antimycin A (Complex I and Complex III inhibitors). Three measurements were made for each condition. At the end of the assay, cells were lysed using RIPA lysis buffer (89900, Thermo Fisher Scientific) with Halt protease and phosphatase inhibitor cocktail (78440, Thermo Fisher Scientific), total protein/well was measured, and Seahorse results were normalized to this measurement.
Experimental design and statistical analyses
For all remyelination experiments, age-matched male Ng2-Mtor cKO and control littermate mice were used to avoid estrogen-induced Cre leakiness and increased CPZ demyelination variability associated with the use of females. Sample size for each experiment was 3-7 animals/group, as stated in each figure legend, and analyses were performed blinded to genotype and/or treatment group. For all immunostaining analyses, 3 or 4 sections each separated by at least 60-84 µm each were analyzed within each animal and the resulting values averaged for the sample value used in statistical analyses. Student's t test was performed for analyses comparing two treatment groups (or genotypes), and significance was defined as p ≤ 0.05. For g-ratio measurements, we measured all axons within 2-4 electron micrographs chosen by random number generator in each animal, with the number of micrographs used remaining consistent within each experiment. The average g-ratio for each animal was calculated by averaging all measured g-ratio values, with the number of measured axons ranging from 76 to 389. For g-ratio scatter plots, linear regression analyses were used to compare the slope and y intercept of the control and Ng2-Mtor cKO linear regressions using all measured g-ratios. For g-ratio distribution analysis, the Kolmogorov–Smirnov t test was used to compare cumulative ranks using all measured g-ratios. For primary rat OPC experiments, animals were pooled for each preparation. Purified OPCs were plated into Seahorse XFp plates and treatments were done in triplicate. For comparison of RAPA to control and RAPA plus CPZ to RAPA, 9 replicate wells were analyzed over three independent OPC preps. For comparison of CPZ to control and RAPA plus CPZ to CPZ, 6 replicate wells were analyzed over 2 independent OPC preps. For these combined analyses, multiple unpaired t tests with two-stage linear step-up procedure of Benjamini, Krieger, and Yekutieli were performed. For all experiments in which unequal sample sizes were used, F tests were run to verify equal variances before appropriately applying Student's t test. For those experiments where statistical significance was observed with unequal sample sizes, power analyses were applied with effect sizes and unequal sample sizes to ensure that the resulting power was to standard (≥80%) for statistical analysis. When unequal sample sizes resulted in no statistical significance, we ran power analyses to determine whether required sample numbers were reasonably attainable given observed effect size. Data are presented as mean ± standard error of the mean unless otherwise stated in figure legends.
Results
Mtor deletion from adult OPCs does not alter OL differentiation after CPZ-mediated demyelination
Previously published studies in conditional KO mouse lines revealed that mTOR is necessary for normal OL differentiation in the spinal cord, but not the brain (Tyler et al., 2009; Bercury et al., 2014; Wahl et al., 2014). In order to determine whether the loss of mTOR in adult OPCs affects differentiation during remyelination, we administered tamoxifen to adult Ng2-Mtor cKO and control littermate mice before CPZ demyelination. CPZ or control (CTL) diet was given over the standard course of 6 weeks to induce demyelination beginning 3 d after the last tamoxifen injection (Fig. 1A). Early remyelination is normally evident by 6 weeks post-induction (wpi) of CPZ and continues for several weeks after removal of CPZ, with peak remyelination apparent at 6 wpi + 2 weeks post-removal (wpr) of CPZ (Gudi et al., 2014; Praet et al., 2014). We first investigated whether OL lineage cell populations were altered by Mtor deletion during early recovery in CPZ-treated animals. At 6 wpi and 6 wpi + 2 wpr, we examined OL lineage populations in corpus callosa by immunostaining for CC1, a marker of mature OLs, and SOX10, a marker of the OL lineage (Fig. 1B). Counting the number of SOX10+ cells revealed a small increase in the number of total OL lineage cells in 6 wpi Ng2-Mtor cKO callosa compared with controls (Fig. 1C; p = 0.049, Student's t test). However, there was no change in the number of total OL lineage cells in Ng2-Mtor cKO mice compared with controls at 6 wpi + 2 wpr of CPZ (Fig. 1C; p = 0.594, Student's t test). The numbers of CC1– SOX10+ OPCs in Ng2-Mtor cKO at both 6 wpi and 6 wpi + 2 wpr were also unchanged compared with control callosa (Fig. 1D; 6 wpi, p = 0.987; 6 wpi + 2 wpr, p = 0.477, Student's t tests), indicating similar proliferation of adult OPCs lacking mTOR compared with controls.
Figure 1.

Mtor deletion from adult OPCs does not impair differentiation during remyelination after CPZ demyelination. A, Schematic of experimental timeline. B, Representative images of CC1 (red) and SOX10 (blue) immunostaining in control and Ng2-Mtor cKO callosa at 6 wpi + 2 wpr CTL diet, 6 wpi CPZ diet, and 6 wpi + 2 wpr CPZ diet. Scale bar, 50 µm. C, Quantification of SOX10+ OL lineage cells in control (black) and Ng2-Mtor cKO (red) callosa at 6 wpi + 2 wpr CTL diet, 6 wpi CPZ diet, and 6 wpi + 2 wpr CPZ diet; n = 3 or 4/group. D, Quantification of CC1– SOX10+ OPCs in control (black) and Ng2-Mtor cKO (red) callosa at 6 wpi + 2 wpr CTL diet, 6 wpi CPZ diet, and 6 wpi + 2 wpr CPZ diet; n = 3 or 4/group. E, Quantification of CC1+ SOX10+ mature OLs in control (black) and Ng2-Mtor cKO (red) callosa at 6 wpi + 2 wpr CTL diet, 6 wpi CPZ diet, and 6 wpi + 2 wpr CPZ diet; n = 3 or 4/group. F, % of all OL lineage cells that are CC1+ mature OLs in control (black) and Ng2-Mtor cKO (red) callosa at 6 wpi + 2 wpr CTL diet, 6 wpi CPZ diet, and 6 wpi + 2 wpr CPZ diet; n = 3 or 4/group. *p ≤ 0.05.
Differentiation of adult OPCs into mature OLs is critical for successful remyelination. The number of CC1+ SOX10+ mature OLs was similar in Ng2-Mtor cKO brains versus controls at either 6 wpi or 6 wpi + 2 wpr (Fig. 1E; 6 wpi, p = 0.300; 6 wpi + 2 wpr, p = 0.756, Student's t tests). Finally, the percentage of OL lineage cells that were CC1+ mature OLs was unchanged at 6 wpi and 6 wpi + 2 wpr in Ng2-Mtor cKO callosa compared with controls (Fig. 1F; 6 wpi, p = 0.224; 6 wpi + 2 wpr, p = 0.087, Student's t tests). Although we did observe a significant increase in OL lineage cells in Ng2-Mtor cKO mice compared with controls at 6 wpi, this was not reflected in a significant increase in either OPCs or mature OLs, or in the percentage of mature OLs, suggesting no change in differentiation of OLs. Importantly, Mtor deletion in adult OPCs did not alter OL populations in the normal adult brain, as there were no differences in the number of SOX10+ OL lineage cells, CC1– SOX10+ OPCs, CC1+ SOX10+ mature OLs, or the proportion of mature OLs in Ng2-Mtor cKO mice compared with controls given CTL diet for 6 weeks followed by 2 weeks of standard diet (Fig. 1C–F; SOX10, p = 0.931; CC1– SOX10+, p = 0.947; CC1+ SOX10+, p = 0.928; % CC1, p = 0.796, Student's t tests). Together, these data indicate that the loss of mTOR in adult OPCs does not affect OPC proliferation or differentiation into mature OLs during remyelination of the CPZ-demyelinated brain.
Remyelination is delayed after CPZ-mediated demyelination when Mtor is deleted from adult OPCs
To determine whether Mtor deletion specifically from adult OPCs altered remyelination in the CPZ-demyelinated brain, we administered either CTL or CPZ diet to Ng2-Mtor cKO and control littermate mice for 6 weeks to induce demyelination. Mice were then returned to standard mouse chow to allow for endogenous remyelination for up to 4 wpr of CPZ (Fig. 1A). Remyelination can be assessed both in terms of remyelinated area of the lesion as well as thickness of remyelinated sheaths. First, we examined the area of remyelination by immunostaining for MOG, a late-expressed myelin protein, in the corpus callosa of Ng2-Mtor cKO and control mice given either CTL or CPZ food for 6 wpi or 6 wpi + 2 wpr (Fig. 2A). Analysis of the percentage of the callosum positive for MOG immunostaining revealed no significant differences in Ng2-Mtor cKO and control littermate mice at either 6 wpi or 6 wpi + 2 wpr (Fig. 2B; 6 wpi, p = 0.590; 6 wpi + 2 wpr, p = 0.409, Student's t tests), suggesting no change in the overall area of remyelination of the callosum after CPZ demyelination. Additionally, there was no difference in Ng2-Mtor cKO and control littermate mice given CTL diet for 6 weeks followed by standard chow for 2 weeks (Fig. 2B; p = 0.129, Student's t test), supporting the conclusion that the loss of mTOR in adult OPCs does not alter myelination in the normal adult callosum.
Figure 2.
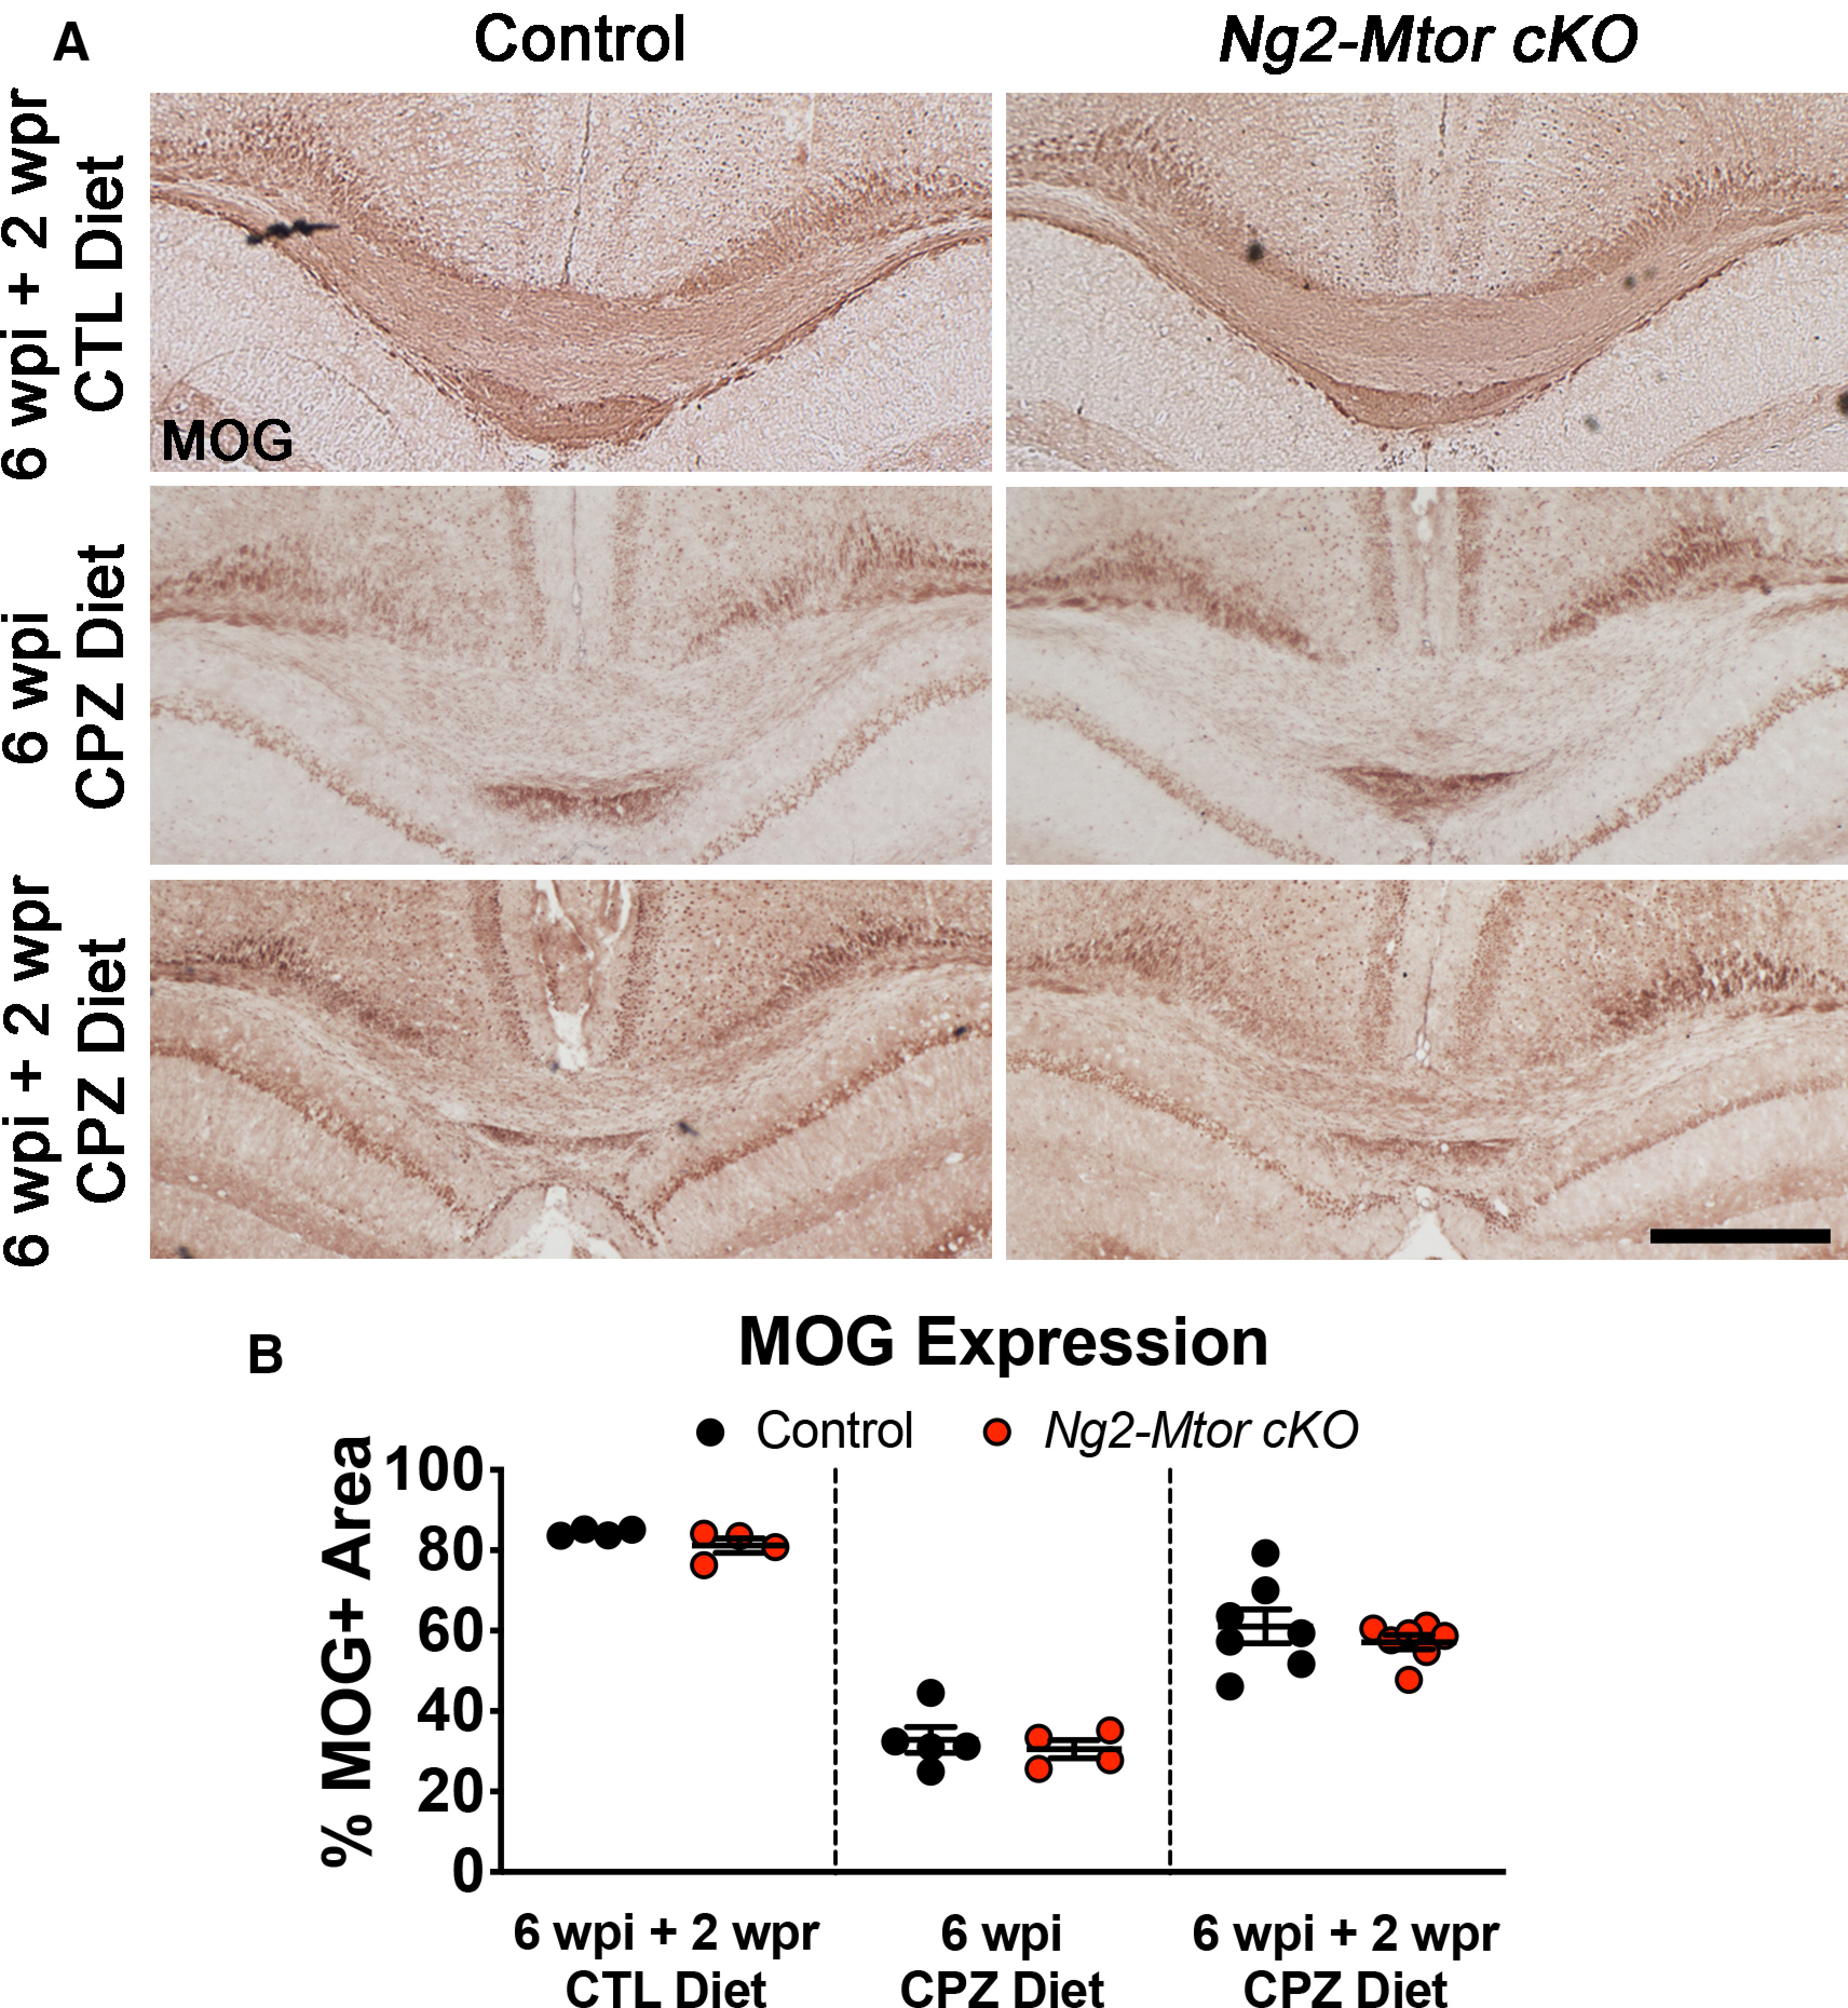
Area of remyelination is unaffected by Mtor deletion from adult OPCs after CPZ demyelination. A, Representative images of MOG immunostaining in control and Ng2-Mtor cKO callosa at 6 wpi + 2 wpr CTL diet, 6 wpi CPZ diet, and 6 wpi + 2 wpr CPZ diet. Scale bar, 500 µm. B, Quantification of the % of the callosum positive for MOG in control (black) and Ng2-Mtor cKO (red) at 6 wpi + 2 wpr CTL diet, 6 wpi CPZ diet, and 6 wpi + 2 wpr CPZ diet; n = 4-7/group.
It is well known that remyelination results in thinner myelin, even when the overall lesion area is completely remyelinated. Therefore, while the overall area of remyelination appeared unaltered by the loss of mTOR in adult OPCs, it was important to assess remyelination of individual axons. We used EM to quantify myelin thickness and number of myelinated axons. EM images were taken from the midline callosum of CPZ-fed Ng2-Mtor cKO and control littermate mice at 6 wpi (Fig. 3A), 6 wpi + 2 wpr (Fig. 3D), and 6 wpi + 4 wpr (Fig. 3G). No change in the number of myelinated axons was observed at any of the analyzed time points (Fig. 3M–O; 6 wpi, p = 0.847; 6 wpi + 2 wpr, p = 0.303; 6 wpi + 4 wpr, p = 0.317, Student's t tests), confirming that the extent of remyelination was unaffected as suggested by MOG immunostaining (Fig. 2A,B). However, myelin thickness as assessed by g-ratios (axon diameter/total myelinated fiber diameter) was reduced at 6 wpi (Fig. 3B; p = 0.005, Student's t test) and 6 wpi + 2 wpr (Fig. 3E; p = 0.022, Student's t test) in Ng2-Mtor cKO mice compared with controls. These deficits in myelin thickness in Ng2-Mtor cKO mice were also observed when analyzing the data by linear regression, with a clear shift toward higher g-ratios evident across all axon diameters at both 6 wpi (Fig. 3C; p < 0.0001, hypothesis tests) and 6 wpi + 2 wpr (Fig. 3F; p < 0.0001, hypothesis tests). Finally, Ng2-Mtor cKO mice at 6 wpi and 6 wpi + 2 wpr also exhibited a significant shift in g-ratio distribution, with a greater percentage of g-ratios binning into higher g-ratio values (Fig. 3J,K; 6 wpi p < 0.0001; 6 wpi + 2 wpr p < 0.0001, Kolmogorov– Smirnov t tests). These data indicate that remyelination thickness is deficient during early and active remyelination phases.
Figure 3.
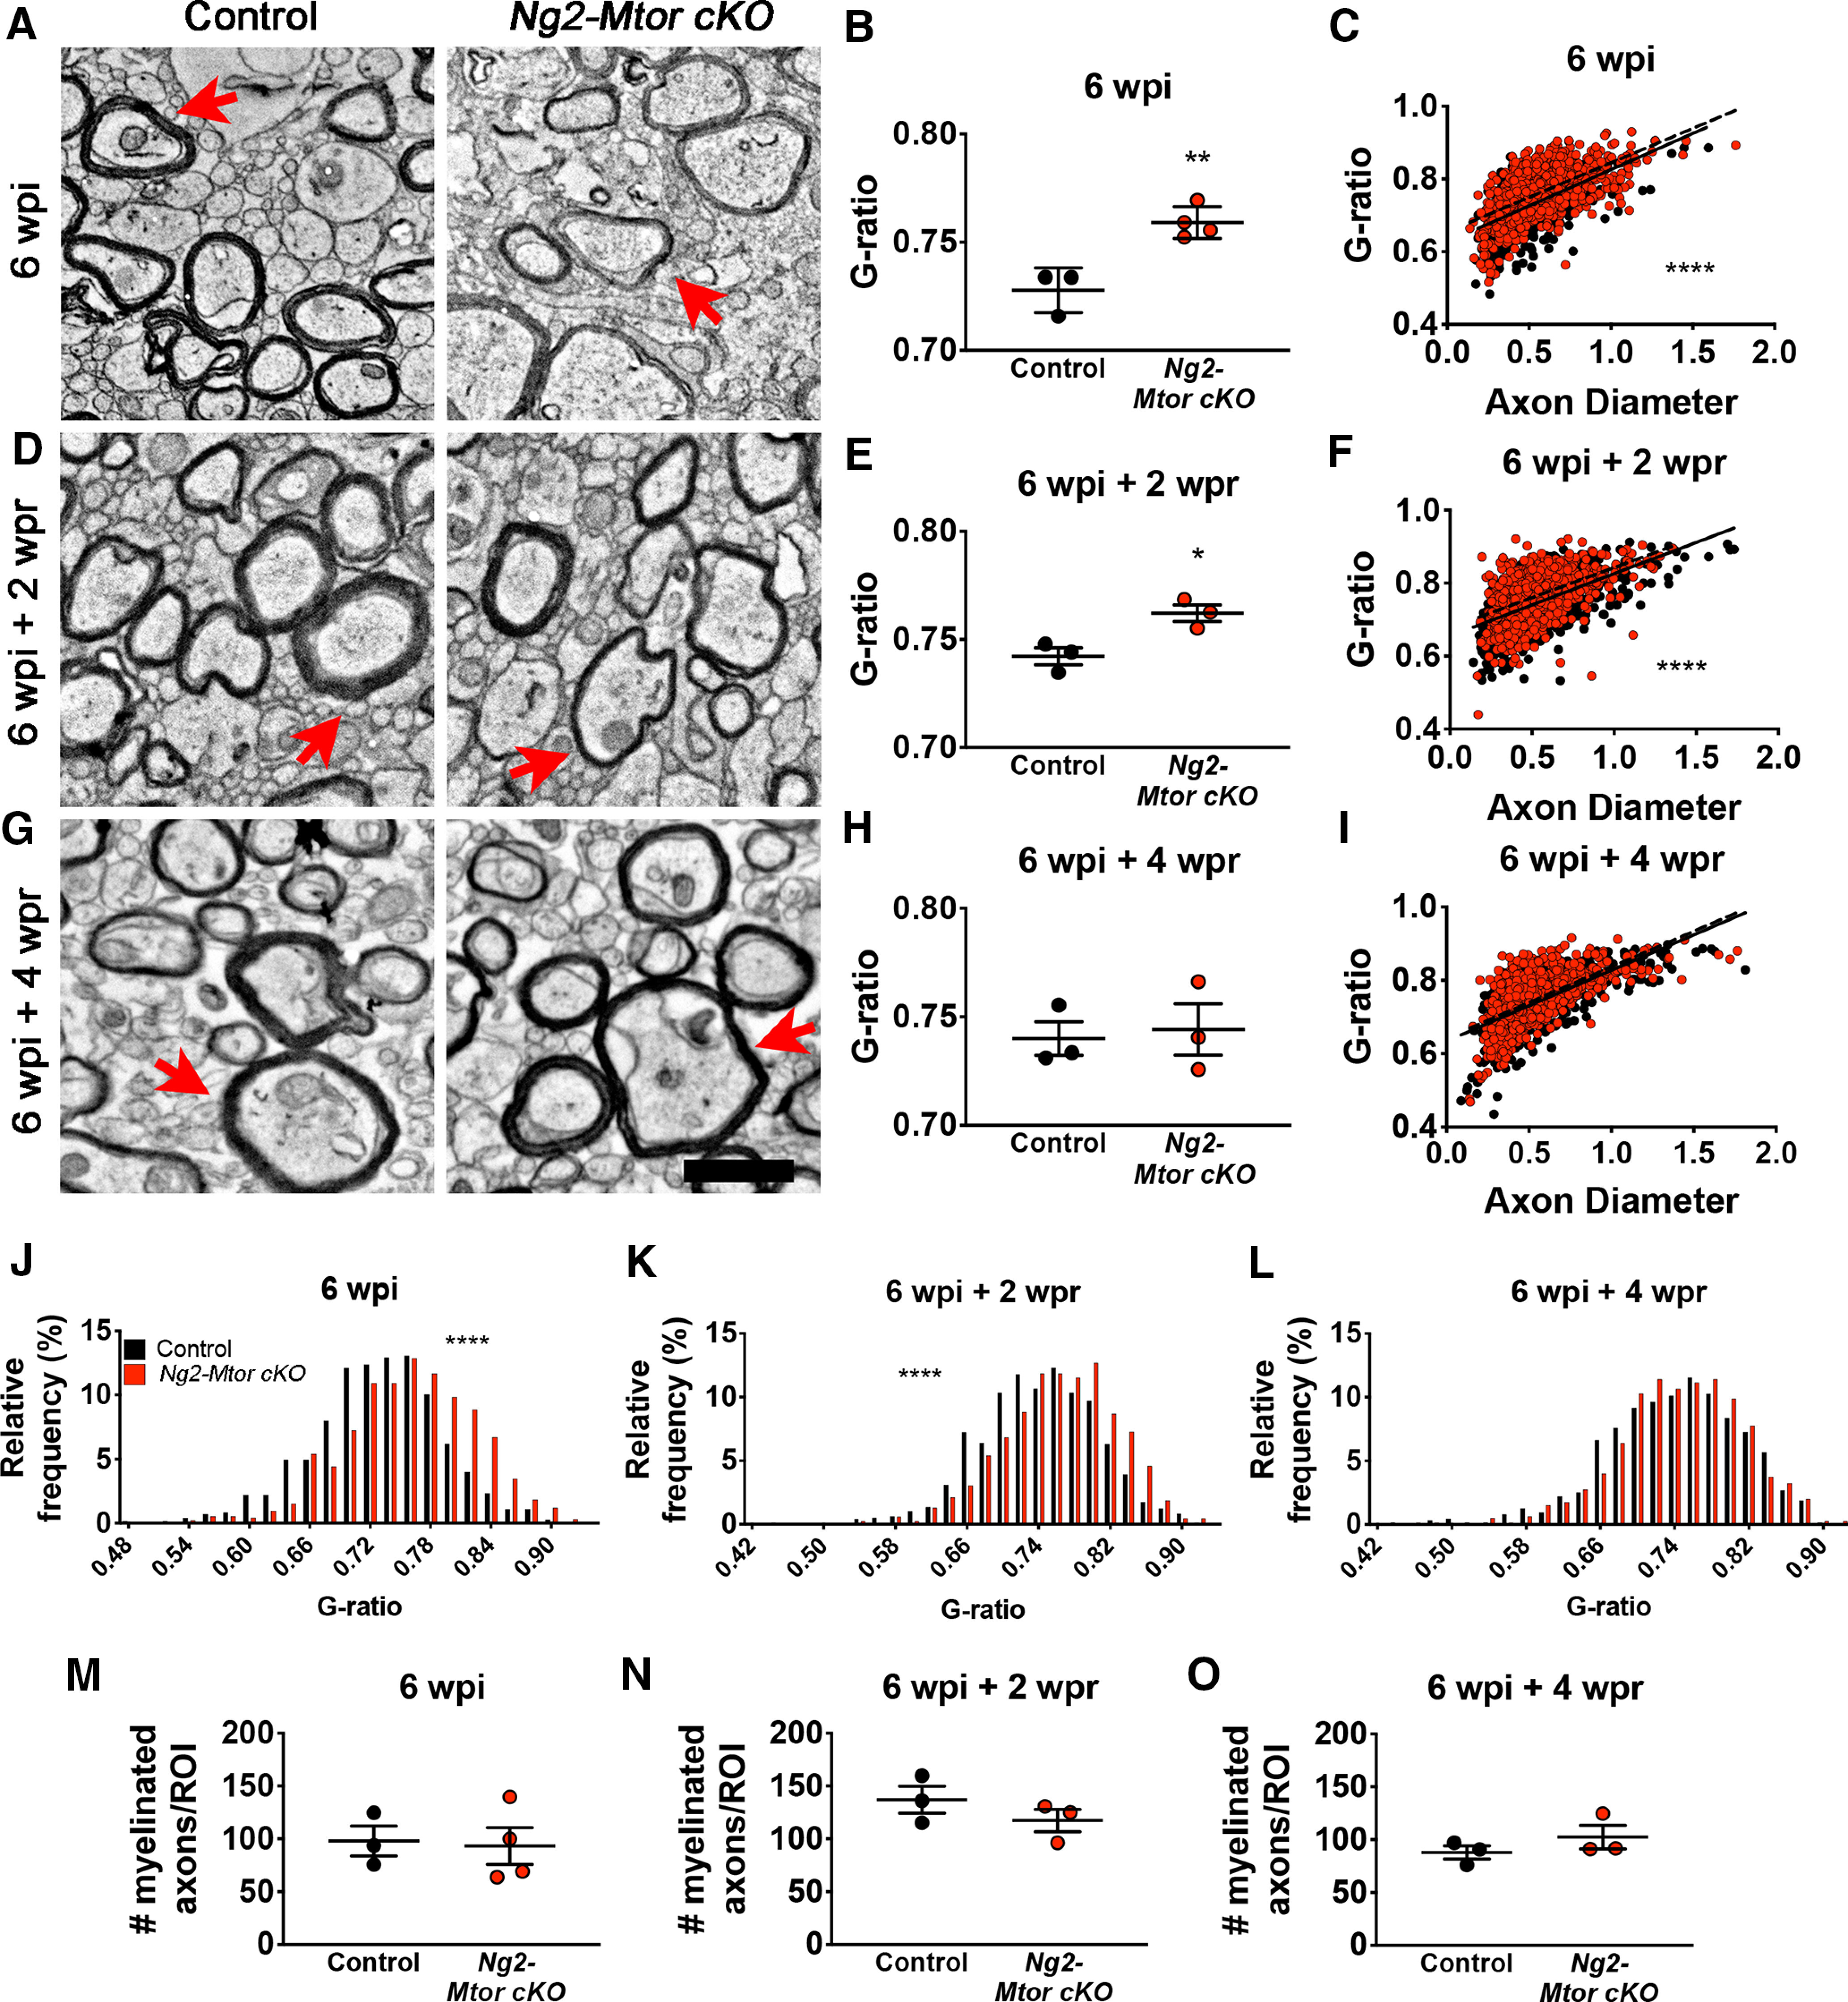
Ng2-Mtor cKO mice display delayed myelin wrapping during remyelination compared with controls after CPZ demyelination. A, Representative electron micrographs of control and Ng2-Mtor cKO callosa at 6 wpi CPZ diet. B, Quantification of average g-ratios in control (black) and Ng2-Mtor cKO (red) callosa at 6 wpi CPZ diet; n = 3 or 4/group. C, Scatter plot of control (black) and Ng2-Mtor cKO (red) g-ratios at 6 wpi CPZ diet; n > 700 axons/group. D, Representative electron micrographs of control and Ng2-Mtor cKO callosa at 6 wpi + 2 wpr CPZ diet. E, Quantification of average g-ratios in control (black) and Ng2-Mtor cKO (red) callosa at 6 wpi + 2 wpr CPZ diet; n = 3/group. F, Scatter plot of control (black) and Ng2-Mtor cKO (red) g-ratios at 6 wpi + 2 wpr CPZ diet; n > 800 axons/group. G, Representative electron micrographs of control and Ng2-Mtor cKO callosa at 6 wpi + 4 wpr CPZ diet. Scale bars: A, D, G, 1 µm. A, D, G, Red arrows point to representative similarly sized axons. H, Quantification of average g-ratios in control (black) and Ng2-Mtor cKO (red) callosa at 6 wpi + 4 wpr CPZ diet; n = 3/group. I, Scatter plot of control (black) and Ng2-Mtor cKO (red) g-ratios at 6 wpi + 4 wpr CPZ diet; n > 600 axons/group. J, g-ratio relative frequency diagram of control (black) and Ng2-Mtor cKO (red) g-ratios at 6 wpi CPZ diet. K, g-ratio relative frequency diagram of control (black) and Ng2-Mtor cKO (red) g-ratios at 6 wpi + 2 wpr CPZ diet. L, g-ratio relative frequency diagram of control (black) and Ng2-Mtor cKO (red) g-ratios at 6 wpi + 4 wpr CPZ diet. M, Quantification of the number of myelinated axons in control (black) and Ng2-Mtor cKO (red) callosa at 6 wpi CPZ diet; n = 3 or 4/group. N, Quantification of the number of myelinated axons in control (black) and Ng2-Mtor cKO (red) callosa at 6 wpi + 2 wpr CPZ diet; n = 3/group. O, Quantification of the number of myelinated axons in control (black) and Ng2-Mtor cKO (red) callosa at 6 wpi + 4 wpr CPZ diet; n = 3/group. *p ≤ 0.05. **p ≤ 0.01. ****p ≤ 0.0001.
While thinner myelin sheaths were observed during early and active remyelination, late-stage remyelination analysis at 6 wpi + 4 wpr revealed similar myelin thickness in Ng2-Mtor cKO mice compared with controls when analyzed by average g-ratio (Fig. 3H; p = 0.784, Student's t test). Along with this, while linear regression analysis of the 6 wpi + 4 wpr g-ratio data showed a significant shift when comparing y intercept (Fig. 3I; p = 0.002, hypothesis tests), a shift in linear regression was not observable in Ng2-Mtor cKO g-ratios compared with controls, in contrast to the clear increases in y intercept visible at both 6 wpi (Fig. 3C) and 6 wpi + 2 wpr (Fig. 3F). When examining g-ratio distribution, we saw no significant change in the percentage of g-ratios present across all g-ratio value bins (Fig. 3L; p = 0.242, Kolmogorov–Smirnov t test), further confirming that Ng2-Mtor cKO mice exhibit similar remyelination to controls by late-stage repair. Together, these data demonstrate that Mtor deletion from adult OPCs results in a specific deficit in early myelin production during remyelination, leading to delayed repair after CPZ demyelination.
Spinal cord OL differentiation is unaffected in LPC lesions when Mtor is deleted from adult OPCs
Our data reveal that Mtor deletion from adult OPCs results in delayed remyelination of the brain after CPZ demyelination, although our prior data indicate that Mtor deletion from the OL lineage has no effect on developmental myelination of the brain (Wahl et al., 2014). In the same study, developmental myelination of the spinal cord was severely impaired by Mtor deletion from the OL lineage, with reduced OL differentiation as well as persistent hypomyelination (Wahl et al., 2014). Because Mtor deletion from spinal cord OL lineage cells during development results in severe myelination deficits, we asked whether spinal cord remyelination was also altered by loss of mTOR in adult OPCs. Since CPZ only affects brain OLs and myelin, and does not demyelinate the spinal cord (Herder et al., 2011), we used the LPC model of demyelination to examine the cell-autonomous effect of mTOR loss on spinal cord OPCs during remyelination. Tamoxifen was administered to 7- to 10-week-old Ng2-Mtor cKO and control littermate mice as for CPZ studies to induce Mtor deletion in adult OPCs. In order to study spinal cord remyelination, we injected LPC directly into either the dorsal or ventral white matter of Ng2-Mtor cKO and control spinal cords 4–5 d after the last tamoxifen injection, resulting in focal demyelinated lesions that endogenously remyelinate over several weeks (Fig. 4A). We first examined OL lineage populations by immunostaining for CC1 and SOX10 at 14 d post-lesion (dpl) during active remyelination in both dorsal and ventral lesions (Fig. 4B). Cell counts of SOX10+ cells revealed unchanged numbers of total OL lineage cells in Ng2-Mtor cKO dorsal and ventral lesions compared with controls (Fig. 4C; dorsal, p = 0.631; ventral, p = 0.146, Student's t tests). We also found similar numbers of CC1– SOX10+ OPCs in Ng2-Mtor cKO dorsal and ventral lesions at 14 dpl compared with controls (Fig. 4D; dorsal, p = 0.592; ventral, p = 0.262, Student's t tests), suggesting no change in OPC proliferation. Additionally, the number and proportion of CC1+ SOX10+ mature OLs were unchanged in Ng2-Mtor cKO dorsal or ventral lesions compared with control lesions at 14 dpl (Fig. 4E, dorsal, p = 0.690; ventral, p = 0.240, Student's t tests; Fig. 4F, dorsal, p = 0.519; ventral, p = 0.562, Student's t tests). These data indicate that loss of mTOR from adult OPCs does not affect proliferation or differentiation during spinal cord remyelination, similar to our observations in the brain. These data led to the conclusion that mTOR signaling is not required for adult OPC differentiation during spinal cord remyelination, in contrast to the findings that mTOR signaling is necessary for appropriate spinal cord OPC differentiation during developmental myelination (Wahl et al., 2014).
Figure 4.

Mtor deletion from adult OPCs does not impair differentiation during remyelination after LPC demyelination of the spinal cord. A, Schematic of experimental timeline. B, Representative images of CC1 (red) and SOX10 (blue) immunostaining in control and Ng2-Mtor cKO 14 dpl dorsal and ventral LPC lesions. Scale bar, 50 µm. C, Quantification of SOX10+ OL lineage cells in control (black) and Ng2-Mtor cKO (red) 14 dpl dorsal and ventral lesions; n = 3 or 4/group. D, Quantification of CC1– SOX10+ OPCs in control (black) and Ng2-Mtor cKO (red) 14 dpl dorsal and ventral lesions; n = 3 or 4/group. E, Quantification of CC1+ SOX10+ mature OLs in control (black) and Ng2-Mtor cKO (red) 14 dpl dorsal and ventral lesions; n = 3 or 4/group. F, % of all OL lineage cells that are CC1+ mature OLs in control (black) and Ng2-Mtor cKO (red) 14 dpl dorsal and ventral lesions; n = 3 or 4/group.
Remyelination of spinal cord LPC lesions is not delayed by the loss of mTOR in adult OPCs
Although Mtor deletion from adult OPCs does not affect differentiation during remyelination of either the spinal cord or brain, our data indicate that myelin production during repair is delayed in the brain after CPZ demyelination. In order to assess remyelination of spinal cord dorsal and ventral white matter LPC lesions, we again used LPC to induce focal demyelinated lesions in dorsal or ventral white matter following tamoxifen administration to 7- to 10-week-old Ng2-Mtor cKO and control littermate mice (Fig. 4A). We examined the area of remyelination at 14 dpl by immunostaining for either MOG or MBP, a major myelin protein, in dorsal and ventral lesions from Ng2-Mtor cKO and control spinal cords (Fig. 5A,D). Analysis of the percentage of dorsal and ventral lesion area remyelinated by MBP immunostaining showed no significant differences in area of remyelination in Ng2-Mtor cKO compared with control lesions (Fig. 5B,C; dorsal, p = 0.830; ventral, p = 0.120, Student's t tests). Additionally, the area of remyelination was unchanged when the percentage of the lesion positive for MOG immunostaining was analyzed in either dorsal or ventral Ng2-Mtor cKO and control lesions (Fig. 5E,F; dorsal, p = 0.434; ventral, p = 0.076, Student's t tests). These data indicate that the area of remyelination in the spinal cord is unaffected by loss of mTOR in adult OPCs.
Figure 5.

Area of remyelination in spinal cord LPC lesions is unaffected by Mtor deletion from adult OPCs. A, Representative images of MBP (yellow represents dorsal lesions; red represents ventral lesions) and DAPI (blue) immunostaining in control and Ng2-Mtor cKO 14 dpl dorsal and ventral LPC lesions. Scale bar, 100 µm. White lines indicate lesions. B, Quantification of the % of the lesion positive for MBP in control (black) and Ng2-Mtor cKO (red) 14 dpl dorsal lesions; n = 4 or 5/group. C, Quantification of the % of the lesion positive for MBP in control (black) and Ng2-Mtor cKO (red) 14 dpl ventral lesions; n = 3/group. D, Representative images of MOG immunostaining in control and Ng2-Mtor cKO 14 dpl dorsal and ventral LPC lesions. Scale bar, 100 µm. E, Quantification of the % of the lesion positive for MOG in control (black) and Ng2-Mtor cKO (red) 14 dpl dorsal lesions; n = 4/group. F, Quantification of the % of the lesion positive for MOG in control (black) and Ng2-Mtor cKO (red) 14 dpl ventral lesions; n = 3/group.
Spinal cord remyelination thickness was assessed using EM, which revealed deficient remyelination in CPZ-demyelinated Ng2-Mtor cKO brains compared with controls (Fig. 3). EM images were taken from 21 dpl dorsal and ventral spinal cord lesion edges (Fig. 6A,C). The average g-ratio was unaltered in 21 dpl Ng2-Mtor cKO dorsal (Fig. 6B; p = 0.793, Student's t test) or ventral (Fig. 6D; p = 0.670, Student's t test) lesions, suggesting no change in remyelination thickness when mTOR is lost in adult OPCs. Both dorsal and ventral Ng2-Mtor cKO lesions exhibited significantly altered linear regression slopes compared with controls (Fig. 6E,G; dorsal, p = 0.002; ventral, p = 0.013, hypothesis tests), with smaller-diameter axons corresponding to higher g-ratios and larger-diameter axons associated with lower g-ratios. However, analyses of g-ratio distribution showed no change in the percentage of g-ratios across bins in dorsal Ng2-Mtor cKO lesions compared with controls (Fig. 6F; p = 0.997, Kolmogorov–Smirnov t test). In contrast, the distribution of g-ratios in higher value g-ratio bins was significantly shifted in ventral Ng2-Mtor cKO lesions compared with controls (Fig. 6H; p = 0.013, Kolmogorov–Smirnov t test). While dorsal lesions exhibited increased numbers of remyelinated axons (Fig. 6I; p = 0.042, Student's t test), ventral lesions did not (Fig. 6J; p = 0.128, Student's t test). Although remyelination may be differentially affected in dorsal and ventral lesions depending on axon diameter, these data do not reveal a clear deficit in myelin thickness during dorsal or ventral spinal cord LPC lesion remyelination in Ng2-Mtor cKO mice, in contrast to the well-defined delay in remyelination of the CPZ-demyelinated brain.
Figure 6.

Remyelination thickness in Ng2-Mtor cKO spinal cord LPC lesions is not affected comparably to CPZ demyelination. A, Representative electron micrographs of control and Ng2-Mtor cKO 21 dpl dorsal LPC lesions. Scale bar, 4 µm. B, Quantification of average g-ratios in control (black) and Ng2-Mtor cKO (red) 21 dpl dorsal lesions; n = 3/group. C, Representative electron micrographs of control and Ng2-Mtor cKO 21 dpl ventral LPC lesions. Scale bar, 2 µm. D, Quantification of average g-ratios in control (black) and Ng2-Mtor cKO (red) 21 dpl ventral lesions; n = 3/group. E, Scatter plot of control (black) and Ng2-Mtor cKO (red) 21 dpl dorsal lesion g-ratios; n > 300 axons/group. F, g-ratio relative frequency diagram of control (black) and Ng2-Mtor cKO (red) 21 dpl dorsal lesion g-ratios. G, Scatter plot of control (black) and Ng2-Mtor cKO (red) 21 dpl ventral lesion g-ratios; n > 400 axons/group. H, g-ratio relative frequency diagram of control (black) and Ng2-Mtor cKO (red) 21 dpl ventral lesion g-ratios. I, Quantification of the number of myelinated axons in control (black) and Ng2-Mtor cKO (red) dorsal white matter at 21 dpl; n = 3/group. J, Quantification of the number of myelinated axons in control (black) and Ng2-Mtor cKO (red) ventral white matter at 21 dpl; n = 3/group. *p ≤ 0.05.
Brain and spinal cord GFP+ OPCs both contribute to remyelination
One possible explanation for the contrast in brain and spinal cord remyelination phenotype in the absence of mTOR is that these tissues may exhibit different efficiencies of Mtor deletion using the Ng2-CreERT. In order to quantify loxP recombination in brain and spinal cord, we performed MACS for NG2+/PDGFRα+ OPCs from adult control and Ng2-Mtor cKO brain and spinal cord tissues, followed by RNA extraction and qRT-PCR. Amplification of the excised region of the Mtor gene revealed ∼20% reduction in Mtor mRNA in both brain (−21.2%) and spinal cord (−22.3%) Ng2-Mtor cKO OPCs compared with controls (Fig. 7A–D). While this reduction was not significant in the spinal cord because of sample variability (Fig. 7C,D; p = 0.22, Student's t test), it was significant in the brain (Fig. 7A,B; p = 0.04, Student's t test). Next, we visualized whether GFP+ OPCs contribute to remyelination in CPZ-demyelinated brains and LPC-demyelinated spinal cords. Immunostaining for GFP and MBP revealed that, in both CPZ-demyelinated brains and LPC-demyelinated spinal cords from Ng2-Mtor cKO mice, there was significant overlap between GFP and MBP immunostaining, suggestive of contribution of GFP+ OPCs to remyelination in both tissues (Fig. 7E,F). We attempted to examine mTOR+ immunostaining in OPCs of the brain and spinal cord white matter to extend our observations to the protein level. Unfortunately, multiple mTOR antibodies either alone or in combination with anti-GFP, anti-PDGFRα, or anti-NG2 were not sensitive enough to detect mTOR in white matter regions in our samples, making it unfeasible to directly quantify mTOR+ or mTOR– OPCs in brain and spinal cord.
Figure 7.

GFP+ OLs contribute to remyelination in demyelinated brain and spinal cord. A, qRT-PCR of Mtor gene transcription normalized to β-actin in isolated NG2+ PDGFRα+ OPCs from control (black) and Ng2-Mtor cKO (red) adult brains; n = 3 pools of 3 samples/group. B, Corresponding graphical difference between the means from Student's t test for brain OPCs. C, qRT-PCR of Mtor gene transcription normalized to β-actin in isolated NG2+ PDGFRα+ OPCs from control (black) and Ng2-Mtor cKO (red) adult spinal cords; n = 3 pools of 3 samples/group. D, Corresponding graphical difference between the means from Student's t test for spinal cord OPCs. E, Representative images of MBP (blue) and GFP (green) immunostaining in control and Ng2-Mtor cKO brains at 6 wpi CPZ. Scale bar, 100 µm. F, Representative images of MBP (blue) and GFP (green) immunostaining in control and Ng2-Mtor cKO spinal cords at 14 dpl LPC. Scale bar, 100 µm. *p ≤ 0.05.
Delayed remyelination when Mtor is deleted from adult brain OPCs is specific to the CPZ model of demyelination
The measurable deficit in remyelination thickness observed in CPZ-demyelinated Ng2-Mtor cKO brains was not observed in spinal cord LPC lesions despite comparable reductions in Mtor transcription and apparent contributions of GFP+ OPCs to remyelination. Other possibilities are that brain and spinal cord adult OPCs are differentially affected by the loss of mTOR signaling, or that remyelination during CPZ in combination with Mtor deletion from adult OPCs specifically affects their ability to remyelinate effectively. To investigate these two possibilities, we examined remyelination thickness in LPC lesions by analyzing EM g-ratios at 14 dpl during active remyelination to correspond with the 6 wpi and 6 wpi + 2 wpr CPZ time points where we observed thinner myelin sheaths in Ng2-Mtor cKO brains (Fig. 8A). EM images were taken from the lesion edge of Ng2-Mtor cKO and control LPC lesions in the callosum (Fig. 8B). Average g-ratios were similar in Ng2-Mtor cKO and control LPC lesions at 14 dpl (Fig. 8C; p = 0.699, Student's t test). Linear regression analysis confirmed no significant differences in g-ratios across axon diameter in Ng2-Mtor cKO and control lesions (Fig. 8D; slope p = 0.292, y intercept p = 0.757, hypothesis tests). Additionally, g-ratio distribution was unaltered in Ng2-Mtor cKO versus control LPC lesions (Fig. 8E; p = 0.322, Kolmogorov–Smirnov t test). Finally, no changes in the numbers of myelinated axons in callosal LPC lesions were observed (Fig. 8F; p = 0.202, Student's t test).
Figure 8.

Ng2-Mtor cKO remyelination is not delayed after LPC demyelination of the callosum. A, Schematic of experimental timeline. B, Representative electron micrographs of control and Ng2-Mtor cKO 14 dpl callosum LPC lesions. Scale bar, 1 µm. Red arrows indicate axons of similar diameter. C, Quantification of average g-ratios in control (black) and Ng2-Mtor cKO (red) 14 dpl callosum lesions; n = 3 or 4/group. D, Scatter plot of control (black) and Ng2-Mtor cKO (red) 14 dpl callosum lesion g-ratios; n > 400 axons/group. E, g-ratio relative frequency diagram of control (black) and Ng2-Mtor cKO (red) 14 dpl callosum lesion g-ratios. F, Quantification of the number of myelinated axons in control (black) and Ng2-Mtor cKO (red) corpus callosum at 14 dpl; n = 3 or 4/group.
Together, our results indicate that Mtor deletion from adult OPCs specifically affects timely remyelination after CPZ-mediated demyelination of the brain. Although it is standard to feed CPZ diet to mice over the course of 6 weeks to induce demyelination, peak demyelination occurs at ∼4 wpi, followed by OPC proliferation, differentiation, and remyelination that is apparent by 6 wpi of CPZ. Therefore, we asked whether the administration of CPZ during early remyelination is necessary to delay remyelination in Ng2-Mtor cKO brains. To answer this question, we administered either CTL or CPZ diet for 4 weeks following tamoxifen administration to induce peak demyelination. All mice were then returned to standard mouse chow for 2 weeks to allow endogenous remyelination to occur in the absence of CPZ (Fig. 9A). Since only remyelination thickness was altered in Ng2-Mtor cKO brains after CPZ demyelination, we analyzed g-ratios in EM images taken from the midline callosum at 4 wpi + 2 wpr in Ng2-Mtor cKO and control mice (Fig. 9B). Under these conditions, we observed no difference in average g-ratios in Ng2-Mtor cKO callosa compared with controls at 4 wpi + 2 wpr (Fig. 9C; p = 0.087, Student's t test). Additionally, there were no significant differences in linear regressions for Ng2-Mtor cKO and control g-ratios at 4 wpi + 2 wpr (Fig. 9D; slope p = 0.077, y intercept p = 0.606, hypothesis tests). Interestingly, g-ratio distribution analysis revealed a significant increase in the percentage of g-ratios in higher value g-ratio bins in Ng2-Mtor cKO versus control at 4 wpi + 2 wpr (Fig. 9E; p < 0.0001, Kolmogorov–Smirnov t test). Despite this, the reduction in myelin thickness we observed across all analyses at 6 wpi and 6 wpi + 2 wpr CPZ in Ng2-Mtor cKO callosa was not recapitulated when early remyelination occurred in the absence of CPZ. Together, these results support the conclusion that CPZ treatment during early remyelination specifically contributes to the delay in remyelination observed when Mtor is deleted in adult OPCs.
Figure 9.

Delayed remyelination in Ng2-Mtor cKO brains requires the presence of CPZ during early repair. A, Schematic of experimental timeline. B, Representative electron micrographs of control and Ng2-Mtor cKO callosa at 4 wpi + 2 wpr CPZ diet. Scale bar, 1 µm. Red arrows point to axons of similar diameter. C, Quantification of average g-ratios in control (black) and Ng2-Mtor cKO (red) callosa at 4 wpi + 2 wpr CPZ diet; n = 3 or 4/group. D, Scatter plot of control (black) and Ng2-Mtor cKO (red) g-ratios at 4 wpi + 2 wpr CPZ diet; n > 600 axons/group. E, g-ratio relative frequency diagram of control (black) and Ng2-Mtor cKO (red) g-ratios at 4 wpi + 2 wpr CPZ diet. *p ≤ 0.0001.
Metabolic function in OLs is impaired by both CPZ treatment and mTOR inhibition
Our data suggest that CPZ and loss of mTOR targets similar pathways to affect remyelination in Ng2-Mtor cKO brains. It is hypothesized that CPZ alters metabolic function, particularly mitochondrial oxidative phosphorylation and glycolysis, in mature OLs, which in turn contributes to OL death and demyelination (Komoly et al., 1987; Pasquini et al., 2007; Benardais et al., 2013; Faizi et al., 2016; Taraboletti et al., 2017). However, the effect of CPZ on mitochondrial function in OLs has never been directly quantified in relation to either demyelination or remyelination. Interestingly, mTOR is known to regulate mitochondrial function in other cell types, although this has not been examined in OLs (Ramanathan and Schreiber, 2009; Morita et al., 2013; Salmond, 2018; Xiaoyu et al., 2018; Rosario et al., 2019). In order to determine whether CPZ or mTOR loss impairs energy production, we differentiated primary rat OPCs in vitro for 3 d in the presence or absence of 50 μm CPZ or 10 nm RAPA, a pharmacological inhibitor of mTOR. We then performed Seahorse mitochondrial stress tests to simultaneously measure OCR (a readout of oxidative phosphorylation) and ECAR (a readout of glycolysis). The Seahorse mitochondrial stress test modulates oxidative phosphorylation by using serial injections of oligomycin, an inhibitor of ATP synthase that reduces oxidative phosphorylation and drives glycolysis, FCCP, an uncoupler of mitochondrial oxidative phosphorylation that stimulates maximal respiratory capacity, and rotenone/antimycin A, inhibitors of Complex I and III in the electron transport chain, which completely blocks ATP synthesis by oxidative phosphorylation. Treatment with either CPZ or RAPA resulted in a significant decrease in both OCR and ECAR (Fig. 10A,D,G,J), revealing decreased oxidative phosphorylation and glycolysis. Basal OCR, reflecting resting rates of oxidative phosphorylation, was decreased with either CPZ treatment (Fig. 10B; p < 0.0001, Student's t test with two-stage linear step-up procedure of Benjamini et al., 2006) or inhibition of mTOR (Fig. 10H; p < 0.0001, Student's t test with two-stage linear step-up procedure of Benjamini et al., 2006). Maximal capacity was also decreased with either CPZ (Fig. 10C; p < 0.0001, Student's t test with two-stage linear step-up procedure of Benjamini et al., 2006) or RAPA (Fig. 10I; p < 0.0001, Student's t test with two-stage linear step-up procedure of Benjamini et al., 2006) treatment, suggesting that, under greater energetic demand, CPZ- or RAPA-treated oligodendroglia are unable to increase ATP production through oxidative phosphorylation and reach the level of respiratory capacity seen in control cells. Additionally, ECAR was significantly decreased in CPZ or RAPA-treated primary rat OLs compared with controls across all measurements, indicating a deficit in glycolysis; this effect was particularly pronounced with RAPA treatment. Basal glycolysis was decreased with either CPZ treatment (Fig. 10E; p = 0.0002, Student's t test with two-stage linear step-up procedure of Benjamini et al., 2006) or mTOR inhibition (Fig. 10K; p < 0.0001, Student's t test with two-stage linear step-up procedure of Benjamini et al., 2006). Glycolytic capacity was similarly decreased with either CPZ treatment (Fig. 10F; p < 0.0001, Student's t test with two-stage linear step-up procedure of Benjamini et al., 2006) or mTOR inhibition (Fig. 10L; p < 0.0001, Student's t test with two-stage linear step-up procedure of Benjamini et al., 2006). Together, these data show that treatment with either CPZ or RAPA decreases oxidative phosphorylation and glycolytic function in cultured OLs.
Figure 10.

OLs treated in vitro with either CPZ or RAPA exhibit impaired mitochondrial function. A, A representative trace of OCR in differentiating primary rat OPCs treated with either vehicle (black) or 50 μm CPZ (blue) for 3 d. Dashed lines indicate the time points of sequential addition of compounds oligomycin, FCCP, and rotenone/antimycin A. B, Corresponding basal respiration graph for A. C, Corresponding maximal respiration graph for A. D, A representative trace of ECAR in differentiating primary rat OPCs treated with either vehicle (black) or 50 μm CPZ (blue) for 3 d. E, Corresponding basal glycolysis graph for C. F, Corresponding glycolytic capacity graph for C. G, A representative trace of OCR in differentiating primary rat OPCs treated with either vehicle (black) or 10 nm RAPA (orange) for 3 d. Dashed lines indicate the time points of sequential addition of compounds oligomycin, FCCP, and rotenone/antimycin A. H, Corresponding basal respiration graph for G. I, Corresponding maximal respiration graph for G. J, A representative trace of ECAR in differentiating primary rat OPCs treated with either vehicle (black) or 10 nm RAPA (orange) for 3 d. K, Corresponding basal glycolysis graph for J. L, Corresponding glycolytic capacity graph for J. Data are mean ± SD. ***p ≤ 0.001. ****p ≤ 0.0001.
Next, we asked whether the observed impairment in energy generation was exacerbated with combined CPZ and RAPA treatment, reflecting the in vivo paradigm of CPZ treatment in Ng2-Mtor cKO mice. Therefore, we treated primary rat OPCs with both 10 nm RAPA and 50 μm CPZ and compared either RAPA or CPZ alone using OCR and ECAR in Seahorse assays (Fig. 11A,D,G,J). We observed that combined CPZ + RAPA treatment significantly reduced basal OCR (Fig. 11B; p < 0.0001, Student's t test with two-stage linear step-up procedure of Benjamini et al., 2006) and maximal respiration (Fig. 11C; p = 0.0002, Student's t test with two-stage linear step-up procedure of Benjamini et al., 2006) compared with RAPA alone. Combined treatment also reduced glycolysis (Fig. 11E; p < 0.0001, Student's t test with two-stage linear step-up procedure of Benjamini et al., 2006) and glycolytic capacity (Fig. 11F; p = 0.003, Student's t test with two-stage linear step-up procedure of Benjamini et al., 2006) compared with RAPA alone. Moreover, combined CPZ + RAPA treatment significantly decreased basal OCR compared with CPZ alone (Fig. 11H; p = 0.01, Student's t test with two-stage linear step-up procedure of Benjamini et al., 2006) without affecting maximal respiration (Fig. 11I; p = 0.337, Student's t test with two-stage linear step-up procedure of Benjamini et al., 2006). We also observed a striking decrease in both glycolysis (Fig. 11K; p = 0.0003, Student's t test with two-stage linear step-up procedure of Benjamini et al., 2006) and glycolytic capacity (Fig. 11L; p = 0.0002, Student's t test with two-stage linear step-up procedure of Benjamini et al., 2006) when OLs were treated with CPZ + RAPA compared with CPZ alone. These data show that CPZ and RAPA additively impair oxidative phosphorylation and glycolysis in differentiating OLs in vitro. Given the particular relevance of the Seahorse analysis of CPZ alone versus CPZ and RAPA combined treatment to the in vivo phenotype, we suggest that delayed remyelination in the CPZ model with loss of mTOR in adult OPCs results from impaired metabolic function.
Figure 11.

CPZ and RAPA additively affect mitochondrial function in differentiating OLs in vitro. A, A representative trace of OCR in differentiating primary rat OPCs treated with either 10 nm RAPA (orange) or 50 μm CPZ + 10 nm RAPA (green) for 3 d. Dashed lines indicate the time points of sequential addition of compounds oligomycin, FCCP, and rotenone/antimycin A. B, Corresponding basal respiration graph for A. C, Corresponding maximal respiration graph for A. D, A representative trace of ECAR in differentiating primary rat OPCs treated with either 10 nm RAPA (orange) or 50 μm CPZ + 10 nm RAPA (green) for 3 d. E, Corresponding basal glycolysis graph for C. F, Corresponding glycolytic capacity graph for C. G, A representative trace of OCR in differentiating primary rat OPCs treated with either 50 μm CPZ (blue) or 50 μm CPZ + 10 nm RAPA (green) for 3 d. Dashed lines indicate the time points of sequential addition of compounds oligomycin, FCCP, and rotenone/antimycin A. H, Corresponding basal respiration graph for G. I, Corresponding maximal respiration graph for G. J, A representative trace of ECAR in differentiating primary rat OPCs treated with either 50 μm CPZ (blue) or 50 μm CPZ + 10 nm RAPA (green) for 3 d. K, Corresponding basal glycolysis graph for J. L, Corresponding glycolytic capacity graph for J. Data are mean ± SD. **p ≤ 0.01. ***p ≤ 0.001. ****p ≤ 0.0001.
Discussion
Here, we demonstrate that mTOR signaling in adult OPCs promotes efficient myelin production during remyelination of the brain in the presence of CPZ. Conversely, remyelination is normal in Ng2-Mtor cKO mice after LPC demyelination of the spinal cord or brain. We cannot eliminate the possibility that spinal cord remyelination is unaffected because of poor recombination efficiency in NG2+ OPCs, despite the presence of GFP+ MBP+ remyelination. However, our previous publication using the same tamoxifen paradigm with Ng2-CreERT to delete Tsc1 in OPCs resulted in significant remyelination enhancement after LPC demyelination of the spinal cord (McLane et al., 2017). Additionally, LPC demyelination in the brain does not elicit a deficit in remyelination, and the efficiency of remyelination is compromised by loss of mTOR in OPCs specifically when CPZ is administered during early remyelination, suggesting an additive effect of Mtor deletion and CPZ on myelin production. In support of this, OPCs undergoing differentiation in vitro show reduced mitochondrial oxidative phosphorylation and glycolysis when treated with CPZ or RAPA; these parameters are further reduced with the combination of CPZ and RAPA. These data are of particular interest as CPZ has been hypothesized to elicit demyelination largely through suppressing mitochondrial function, but this has never been directly demonstrated (Komoly et al., 1987; Pasquini et al., 2007; Benardais et al., 2013; Faizi et al., 2016; Taraboletti et al., 2017). Importantly, our data suggest that CPZ negatively impacts remyelination via suppression of metabolic function. Therefore, although CPZ may induce demyelination partially via effects on mitochondrial function, our data reveal that the effects on metabolic function may especially affect remyelination.
Mtor deletion has no impact on proliferation or differentiation of adult OPCs during remyelination, either in spinal cord or brain. Previous data support the conclusion that mTOR signaling in vivo is dispensable for OL differentiation during developmental myelination of the brain (Bercury et al., 2014; Wahl et al., 2014), despite its necessity for normal differentiation of OPCs in vitro and in the spinal cord in vivo (Tyler et al., 2009; Guardiola-Diaz et al., 2012; Wahl et al., 2014; Ornelas et al., 2020). OL differentiation in the spinal cord is dependent on mTOR signaling during developmental myelination, with fewer mature OLs in spinal cords of mice with disrupted mTOR signaling in the OL lineage (Bercury et al., 2014; Wahl et al., 2014; Ornelas et al., 2020). Therefore, our data on remyelination suggest that either adult OPCs do not require mTOR signaling to differentiate because they are intrinsically distinct from developmental OPCs, or adult OPCs have progressed past early differentiation stages requiring mTOR signaling to inhibit bone morphogenetic protein signaling (Ornelas et al., 2020). While the differences in developmental and adult OPCs are not yet entirely defined, there is evidence that adult OPCs may be intrinsically different from developmental OPCs (Shi et al., 1998; Windrem et al., 2004) as well as later stage OPCs (Tang et al., 2000).
Our finding that Mtor deletion from adult OPCs does not affect remyelination of the spinal cord after LPC demyelination is surprising, given the hypomyelination resulting from deletion of Mtor in the OL lineage during development (Bercury et al., 2014; Wahl et al., 2014). In particular, Mtor deletion from the OL lineage results in fewer myelinated axons and thinner myelin during active myelination, and persistent hypomyelination in adult spinal cord (Wahl et al., 2014). The persistent hypomyelination suggests that mTOR signaling promotes myelin production and wrapping in the spinal cord. In line with this, our recently published studies support functions for mTOR signaling during developmental myelination of the spinal cord in two phases: first, by modulating actin cytoskeletal organization during differentiation; and second, by regulating Mbp mRNA transport and localization during myelin production (Musah et al., 2020). Similar changes in MBP distribution are observed in vitro even when OPCs differentiate for several days before mTOR inhibition. However, Mtor deletion from mature OLs after differentiation in vivo does not alter cytoskeletal and MBP expression in contrast to when Mtor is deleted from the OL lineage during development (Musah et al., 2020). In the context of these data, it seems likely either that myelin production during remyelination is dependent on other signaling pathways specific to repair, or that hypomyelination is secondary to early differentiation deficits observed when Mtor is deleted developmentally from the OL lineage, that do not occur when Mtor is deleted from more mature adult OPCs.
Remyelination is significantly delayed in Ng2-Mtor cKO callosa after CPZ demyelination. Importantly, the presence of CPZ during early remyelination contributes to the observed delay, suggesting that CPZ and Mtor deletion from adult OPCs cooperates to impair remyelination. These data support previously published work indicating that concurrent systemic RAPA and CPZ administration for 6 weeks results in delayed remyelination even after removal of both treatments (Sachs et al., 2014). However, in this study, the delay in remyelination is more severe than what we observe with OPC-specific deletion of Mtor. This is likely because of the selective deletion of Mtor only in adult OPCs, while systemic RAPA administration alters mTOR signaling in all CNS cell types. Indeed, the authors of another study (Yamate-Morgan et al., 2019), using the same RAPA + CPZ protocol, concluded that axonal health is significantly affected in this model, which could in turn affect remyelination. Additionally, our tamoxifen paradigm results in an ∼20% decrease in Mtor transcription in brain and spinal cord OPCs; this low level of recombination may further dilute the effect of Mtor deletion from adult OPCs on remyelination efficiency in our studies.
Given our results showing that loss of mTOR in adult OPCs delays remyelination in the corpus callosum in the CPZ model, it was initially surprising that remyelination of the corpus callosum after LPC injection is unaffected by the loss of mTOR in adult OPCs. These data reveal new functions for mTOR during OL differentiation. While either LPC and CPZ treatment results in demyelination, LPC and CPZ cause OL death and myelin loss by different mechanisms. LPC is a membrane-solubilizing agent that demyelinates by physically disrupting the lipid-rich myelin sheath (Plemel et al., 2018), while CPZ is a copper chelator and is hypothesized to specifically affect mature OLs through impairing mitochondrial function and other metabolic processes (Komoly et al., 1987; Pasquini et al., 2007; Benardais et al., 2013; Taraboletti et al., 2017). Our novel data reveal that both mitochondrial oxidative phosphorylation and glycolysis are significantly impaired with CPZ treatment of differentiating OLs. Importantly, we observed that the presence of CPZ during remyelination is required in order for Mtor deletion from adult OPCs to compromise remyelination thickness. Reduced cellular energy production therefore seems a likely candidate for a mechanism by which CPZ additively impairs remyelination in Ng2-Mtor cKO brains.
While the role of mTOR signaling in OLs in regulating mitochondrial function has not been studied to date, mTOR signaling is known to directly modulate mitochondrial dynamics and glycolysis in other cell types (Ramanathan and Schreiber, 2009; Morita et al., 2013; Salmond, 2018; Xiaoyu et al., 2018; Rosario et al., 2019). Our data indicate that mTOR inhibition in differentiating OLs in vitro results in impaired mitochondrial oxidative phosphorylation and glycolysis. Moreover, we observed that coadministration of CPZ and RAPA to OLs in vitro results in decreased oxidative phosphorylation and glycolytic activity compared with either treatment alone. The additive effect of CPZ and RAPA suggests that energy production is likely disrupted to an extent that slows myelin production by mature OLs, an incredibly energy-demanding process (Harris and Attwell, 2012; Rosko et al., 2019). This conclusion is supported by previous studies revealing that OLs are highly metabolically active and use both oxidative phosphorylation (particularly as OPCs and newly differentiated OLs) and glycolysis (particularly as adult mature OLs) to support themselves and axons (Funfschilling et al., 2012; Amaral et al., 2016; Rao et al., 2017). Importantly, inducing metabolic stress conditions in human OPCs and OLs in vitro results in strongly decreased glycolysis and OL process retraction, reminiscent of the dying-back pathology present in MS lesions (Rone et al., 2016). Moreover, OL process outgrowth is decreased in vitro when oxidative phosphorylation is impaired, and myelin lipid synthesis is increased when glycolytic function is improved (Ziabreva et al., 2010; Steiner et al., 2014). Together, these data suggest that improving metabolic function of OLs may both prevent mature OL loss and promote remyelination.
Previous work has described four patterns of MS lesions representing unique types of demyelination (Lucchinetti et al., 2000). Both Pattern I and II lesions are located around vasculature and characterized by sharply demarcated lesion borders and the infiltration of immune cells. Conversely, Pattern III/IV lesions are not centered around vasculature and do not exhibit Ig or complement deposition despite the presence of infiltrating immune cells. Pattern III lesions, which are the second most prevalent pattern of demyelination in MS, appear to be caused by primary OL pathology and resemble hypoxic/ischemic damage that may be attributable to mitochondrial impairment (Aboul-Enein et al., 2003; Lassmann, 2003; Aboul-Enein and Lassmann, 2005; Mahad et al., 2008). Notably, CPZ demyelination largely recapitulates Pattern III lesions, which are characterized by ill-defined lesion borders, primary OL dystrophy and apoptosis, and significant myelin-associated glycoprotein loss (Kipp et al., 2009; Praet et al., 2014; Burrows et al., 2019). Interestingly, all active lesions within an individual MS patient appear to be of one pattern (Lucchinetti et al., 2000). Therefore, optimal therapies to promote remyelination may be specific to an individual patient's lesion pattern. Because remyelination by adult OPCs without mTOR is specifically affected after CPZ demyelination, our data suggest that downstream targets of mTOR signaling may be viable therapeutic targets for promoting remyelination in MS patients with Pattern III lesions characterized by OL dystrophy.
Footnotes
This work was supported by National Institute of Neurological Disorders and Stroke R01/R37 NS082203 to T.L.W. and W.B.M., and F31 NS108521 to M.A.J.; and National Multiple Sclerosis Society RG5371-A-4 to T.L.W. We thank Quan Shang for technical assistance with demyelination experiments; Dr. Ira Bergman and the UPMC Children's Hospital of Pittsburgh for the use of the Pump 11 Elite for spinal cord and callosum lysophosphatidylcholine demyelination injections; and Dr. Cheryl Dreyfus and her laboratory, particularly Yangyang Huang and Kyle Saitta, for assisting us with the cuprizone demyelination technique and callosal microdissections.
The authors declare no competing financial interests.
References
- Aboul-Enein F, Lassmann H (2005) Mitochondrial damage and histotoxic hypoxia: a pathway of tissue injury in inflammatory brain disease? Acta Neuropathol 109:49–55. 10.1007/s00401-004-0954-8 [DOI] [PubMed] [Google Scholar]
- Aboul-Enein F, Rauschka H, Kornek B, Stadelmann C, Stefferl A, Bruck W, Lucchinetti C, Schmidbauer M, Jellinger K, Lassmann H (2003) Preferential loss of myelin-associated glycoprotein reflects hypoxia-like white matter damage in stroke and inflammatory brain diseases. J Neuropathol Exp Neurol 62:25–33. 10.1093/jnen/62.1.25 [DOI] [PubMed] [Google Scholar]
- Alizadeh A, Dyck SM, Karimi-Abdolrezaee S (2015) Myelin damage and repair in pathologic CNS: challenges and prospects. Front Mol Neurosci 8:35. 10.3389/fnmol.2015.00035 [DOI] [PMC free article] [PubMed] [Google Scholar]
- Amaral AI, Hadera MG, Tavares JM, Kotter MR, Sonnewald U (2016) Characterization of glucose-related metabolic pathways in differentiated rat oligodendrocyte lineage cells. Glia 64:21–34. 10.1002/glia.22900 [DOI] [PMC free article] [PubMed] [Google Scholar]
- Bacmeister CM, Barr HJ, McClain CR, Thornton MA, Nettles D, Welle CG, Hughes EG (2020) Motor learning promotes remyelination via new and surviving oligodendrocytes. Nat Neurosci 23:819–831. 10.1038/s41593-020-0637-3 [DOI] [PMC free article] [PubMed] [Google Scholar]
- Benardais K, Kotsiari A, Skuljec J, Koutsoudaki PN, Gudi V, Singh V, Vulinovic F, Skripuletz T, Stangel M (2013) Cuprizone [bis(cyclohexylidenehydrazide)] is selectively toxic for mature oligodendrocytes. Neurotox Res 24:244–250. 10.1007/s12640-013-9380-9 [DOI] [PubMed] [Google Scholar]
- Benjamini Y, Krieger A, Yekutieli D (2006) Adaptive linear step-up procedures that control the false discovery rate. Biometrika 93:491–507. [Google Scholar]
- Bercury KK, Dai J, Sachs HH, Ahrendsen JT, Wood TL, Macklin WB (2014) Conditional ablation of raptor or rictor has differential impact on oligodendrocyte differentiation and CNS myelination. J Neurosci 34:4466–4480. 10.1523/JNEUROSCI.4314-13.2014 [DOI] [PMC free article] [PubMed] [Google Scholar]
- Burrows DJ, McGown A, Jain SA, De Felice M, Ramesh TM, Sharrack B, Majid A (2019) Animal models of multiple sclerosis: from rodents to zebrafish. Mult Scler 25:306–324. 10.1177/1352458518805246 [DOI] [PubMed] [Google Scholar]
- Cammer W (1999) The neurotoxicant, cuprizone, retards the differentiation of oligodendrocytes in vitro. J Neurol Sci 168:116–120. 10.1016/s0022-510x(99)00181-1 [DOI] [PubMed] [Google Scholar]
- Crawford AH, Tripathi RB, Foerster S, McKenzie I, Kougioumtzidou E, Grist M, Richardson WD, Franklin RJ (2016) Pre-existing mature oligodendrocytes do not contribute to remyelination following toxin-induced spinal cord demyelination. Am J Pathol 186:511–516. 10.1016/j.ajpath.2015.11.005 [DOI] [PMC free article] [PubMed] [Google Scholar]
- Faizi M, Salimi A, Seydi E, Naserzadeh P, Kouhnavard M, Rahimi A, Pourahmad J (2016) Toxicity of cuprizone a Cu(2+) chelating agent on isolated mouse brain mitochondria: a justification for demyelination and subsequent behavioral dysfunction. Toxicol Mech Methods 26:276–283. 10.3109/15376516.2016.1172284 [DOI] [PubMed] [Google Scholar]
- Flores AI, Narayanan SP, Morse EN, Shick HE, Yin X, Kidd G, Avila RL, Kirschner DA, Macklin WB (2008) Constitutively active Akt induces enhanced myelination in the CNS. J Neurosci 28:7174–7183. 10.1523/JNEUROSCI.0150-08.2008 [DOI] [PMC free article] [PubMed] [Google Scholar]
- Franklin RJ (2002) Why does remyelination fail in multiple sclerosis? Nat Rev Neurosci 3:705–714. 10.1038/nrn917 [DOI] [PubMed] [Google Scholar]
- Funfschilling U, Supplie LM, Mahad D, Boretius S, Saab AS, Edgar J, Brinkmann BG, Kassmann CM, Tzvetanova ID, Mobius W, Diaz F, Meijer D, Suter U, Hamprecht B, Sereda MW, Moraes CT, Frahm J, Goebbels S, Nave KA (2012) Glycolytic oligodendrocytes maintain myelin and long-term axonal integrity. Nature 485:517–521. 10.1038/nature11007 [DOI] [PMC free article] [PubMed] [Google Scholar]
- Goebbels S, Oltrogge JH, Kemper R, Heilmann I, Bormuth I, Wolfer S, Wichert SP, Mobius W, Liu X, Lappe-Siefke C, Rossner MJ, Groszer M, Suter U, Frahm J, Boretius S, Nave KA (2010) Elevated phosphatidylinositol 3,4,5-trisphosphate in glia triggers cell-autonomous membrane wrapping and myelination. J Neurosci 30:8953–8964. 10.1523/JNEUROSCI.0219-10.2010 [DOI] [PMC free article] [PubMed] [Google Scholar]
- Grier MD, West KL, Kelm ND, Fu C, Does MD, Parker B, McBrier E, Lagrange AH, Ess KC, Carson RP (2017) Loss of mTORC2 signaling in oligodendrocyte precursor cells delays myelination. PLoS One 12:e0188417. 10.1371/journal.pone.0188417 [DOI] [PMC free article] [PubMed] [Google Scholar]
- Guardiola-Diaz HM, Ishii A, Bansal R (2012) Erk1/2 MAPK and mTOR signaling sequentially regulates progression through distinct stages of oligodendrocyte differentiation. Glia 60:476–486. 10.1002/glia.22281 [DOI] [PMC free article] [PubMed] [Google Scholar]
- Gudi V, Gingele S, Skripuletz T, Stangel M (2014) Glial response during cuprizone-induced de- and remyelination in the CNS: lessons learned. Front Cell Neurosci 8:73. [DOI] [PMC free article] [PubMed] [Google Scholar]
- Haines JD, Inglese M, Casaccia P (2011) Axonal damage in multiple sclerosis. Mt Sinai J Med 78:231–243. 10.1002/msj.20246 [DOI] [PMC free article] [PubMed] [Google Scholar]
- Harrington EP, Zhao C, Fancy SP, Kaing S, Franklin RJ, Rowitch DH (2010) Oligodendrocyte PTEN is required for myelin and axonal integrity, not remyelination. Ann Neurol 68:703–716. 10.1002/ana.22090 [DOI] [PMC free article] [PubMed] [Google Scholar]
- Harris JJ, Attwell D (2012) The energetics of CNS white matter. J Neurosci 32:356–371. 10.1523/JNEUROSCI.3430-11.2012 [DOI] [PMC free article] [PubMed] [Google Scholar]
- Herder V, Hansmann F, Stangel M, Skripuletz T, Baumgartner W, Beineke A (2011) Lack of cuprizone-induced demyelination in the murine spinal cord despite oligodendroglial alterations substantiates the concept of site-specific susceptibilities of the central nervous system. Neuropathol Appl Neurobiol 37:676–684. 10.1111/j.1365-2990.2011.01168.x [DOI] [PubMed] [Google Scholar]
- Jeffries MA, Obr AE, Urbanek K, Fyffe-Maricich SL, Wood TL (2020) Cnp promoter-driven sustained ERK1/2 activation increases B-cell activation and suppresses experimental autoimmune encephalomyelitis. ASN Neuro 12:1759091420971916. 10.1177/1759091420971916 [DOI] [PMC free article] [PubMed] [Google Scholar]
- Kipp M, Clarner T, Dang J, Copray S, Beyer C (2009) The cuprizone animal model: new insights into an old story. Acta Neuropathol 118:723–736. 10.1007/s00401-009-0591-3 [DOI] [PubMed] [Google Scholar]
- Komoly S, Jeyasingham MD, Pratt OE, Lantos PL (1987) Decrease in oligodendrocyte carbonic anhydrase activity preceding myelin degeneration in cuprizone induced demyelination. J Neurol Sci 79:141–148. 10.1016/0022-510x(87)90268-1 [DOI] [PubMed] [Google Scholar]
- Lang CH, Frost RA, Bronson SK, Lynch CJ, Vary TC (2010) Skeletal muscle protein balance in mTOR heterozygous mice in response to inflammation and leucine. Am J Physiol Endocrinol Metab 298:E1283–E1294. 10.1152/ajpendo.00676.2009 [DOI] [PMC free article] [PubMed] [Google Scholar]
- Lassmann H (2003) Hypoxia-like tissue injury as a component of multiple sclerosis lesions. J Neurol Sci 206:187–191. 10.1016/s0022-510x(02)00421-5 [DOI] [PMC free article] [PubMed] [Google Scholar]
- Lebrun-Julien F, Bachmann L, Norrmen C, Trotzmuller M, Kofeler H, Ruegg MA, Hall MN, Suter U (2014) Balanced mTORC1 activity in oligodendrocytes is required for accurate CNS myelination. J Neurosci 34:8432–8448. 10.1523/JNEUROSCI.1105-14.2014 [DOI] [PMC free article] [PubMed] [Google Scholar]
- Louis JC, Magal E, Muir D, Manthorpe M, Varon S (1992) CG-4, a new bipotential glial cell line from rat brain, is capable of differentiating in vitro into either mature oligodendrocytes or type-2 astrocytes. J Neurosci Res 31:193–204. 10.1002/jnr.490310125 [DOI] [PubMed] [Google Scholar]
- Lucchinetti C, Brück W, Parisi J, Scheithauer B, Rodriguez M, Lassmann H (2000) Heterogeneity of multiple sclerosis lesions: implications for the pathogenesis of demyelination. Ann Neurol 47:707–717. [DOI] [PubMed] [Google Scholar]
- Mahad D, Ziabreva I, Lassmann H, Turnbull D (2008) Mitochondrial defects in acute multiple sclerosis lesions. Brain 131:1722–1735. 10.1093/brain/awn105 [DOI] [PMC free article] [PubMed] [Google Scholar]
- Mason JL, Ye P, Suzuki K, D'Ercole AJ, Matsushima GK (2000) Insulin-like growth factor-1 inhibits mature oligodendrocyte apoptosis during primary demyelination. J Neurosci 20:5703–5708. 10.1523/JNEUROSCI.20-15-05703.2000 [DOI] [PMC free article] [PubMed] [Google Scholar]
- McCarthy KD, de Vellis J (1980) Preparation of separate astroglial and oligodendroglial cell cultures from rat cerebral tissue. J Cell Biol 85:890–902. 10.1083/jcb.85.3.890 [DOI] [PMC free article] [PubMed] [Google Scholar]
- McLane LE, Bourne JN, Evangelou AV, Khandker L, Macklin WB, Wood TL (2017) Loss of tuberous sclerosis complex1 in adult oligodendrocyte progenitor cells enhances axon remyelination and increases myelin thickness after a focal demyelination. J Neurosci 37:7534–7546. 10.1523/JNEUROSCI.3454-16.2017 [DOI] [PMC free article] [PubMed] [Google Scholar]
- Morita M, Gravel SP, Chenard V, Sikstrom K, Zheng L, Alain T, Gandin V, Avizonis D, Arguello M, Zakaria C, McLaughlan S, Nouet Y, Pause A, Pollak M, Gottlieb E, Larsson O, St-Pierre J, Topisirovic I, Sonenberg N (2013) mTORC1 controls mitochondrial activity and biogenesis through 4E-BP-dependent translational regulation. Cell Metab 18:698–711. 10.1016/j.cmet.2013.10.001 [DOI] [PubMed] [Google Scholar]
- Musah AS, Brown TL, Jeffries MA, Shang Q, Hashimoto H, Evangelou AV, Kowalski A, Batish M, Macklin WB, Wood TL (2020) Mechanistic target of rapamycin regulates the oligodendrocyte cytoskeleton during myelination. J Neurosci 40:2993–3007. 10.1523/JNEUROSCI.1434-18.2020 [DOI] [PMC free article] [PubMed] [Google Scholar]
- Ornelas IM, Khandker L, Wahl SE, Hashimoto H, Macklin WB, Wood TL (2020) The mechanistic target of rapamycin pathway downregulates bone morphogenetic protein signaling to promote oligodendrocyte differentiation. Glia 68:1274–1290. 10.1002/glia.23776 [DOI] [PMC free article] [PubMed] [Google Scholar]
- Pasquini LA, Calatayud CA, Bertone Una AL, Millet V, Pasquini JM, Soto EF (2007) The neurotoxic effect of cuprizone on oligodendrocytes depends on the presence of pro-inflammatory cytokines secreted by microglia. Neurochem Res 32:279–292. 10.1007/s11064-006-9165-0 [DOI] [PubMed] [Google Scholar]
- Plemel JR, Michaels NJ, Weishaupt N, Caprariello AV, Keough MB, Rogers JA, Yukseloglu A, Lim J, Patel VV, Rawji KS, Jensen SK, Teo W, Heyne B, Whitehead SN, Stys PK, Yong VW (2018) Mechanisms of lysophosphatidylcholine-induced demyelination: a primary lipid disrupting myelinopathy. Glia 66:327–347. 10.1002/glia.23245 [DOI] [PubMed] [Google Scholar]
- Praet J, Guglielmetti C, Berneman Z, Van der Linden A, Ponsaerts P (2014) Cellular and molecular neuropathology of the cuprizone mouse model: clinical relevance for multiple sclerosis. Neurosci Biobehav Rev 47:485–505. 10.1016/j.neubiorev.2014.10.004 [DOI] [PubMed] [Google Scholar]
- Ramanathan A, Schreiber SL (2009) Direct control of mitochondrial function by mTOR. Proc Natl Acad Sci USA 106:22229–22232. 10.1073/pnas.0912074106 [DOI] [PMC free article] [PubMed] [Google Scholar]
- Rao VT, Khan D, Cui QL, Fuh SC, Hossain S, Almazan G, Multhaup G, Healy LM, Kennedy TE, Antel JP (2017) Distinct age and differentiation-state dependent metabolic profiles of oligodendrocytes under optimal and stress conditions. PLoS One 12:e0182372. 10.1371/journal.pone.0182372 [DOI] [PMC free article] [PubMed] [Google Scholar]
- Rone MB, Cui QL, Fang J, Wang LC, Zhang J, Khan D, Bedard M, Almazan G, Ludwin SK, Jones R, Kennedy TE, Antel JP (2016) Oligodendrogliopathy in multiple sclerosis: low glycolytic metabolic rate promotes oligodendrocyte survival. J Neurosci 36:4698–4707. 10.1523/JNEUROSCI.4077-15.2016 [DOI] [PMC free article] [PubMed] [Google Scholar]
- Rosario FJ, Gupta MB, Myatt L, Powell TL, Glenn JP, Cox L, Jansson T (2019) Mechanistic target of rapamycin complex 1 promotes the expression of genes encoding electron transport chain proteins and stimulates oxidative phosphorylation in primary human trophoblast cells by regulating mitochondrial biogenesis. Sci Rep 9:246. 10.1038/s41598-018-36265-8 [DOI] [PMC free article] [PubMed] [Google Scholar]
- Rosko L, Smith VN, Yamazaki R, Huang JK (2019) Oligodendrocyte bioenergetics in health and disease. Neuroscientist 25:334–343. 10.1177/1073858418793077 [DOI] [PMC free article] [PubMed] [Google Scholar]
- Sachs HH, Bercury KK, Popescu DC, Narayanan SP, Macklin WB (2014) A new model of cuprizone-mediated demyelination/remyelination. ASN Neuro 6:1759091414551955. 10.1177/1759091414551955 [DOI] [PMC free article] [PubMed] [Google Scholar]
- Salmond RJ (2018) mTOR regulation of glycolytic metabolism in T cells. Front Cell Dev Biol 6:122. [DOI] [PMC free article] [PubMed] [Google Scholar]
- Shi J, Marinovich A, Barres BA (1998) Purification and characterization of adult oligodendrocyte precursor cells from the rat optic nerve. J Neurosci 18:4627–4636. [DOI] [PMC free article] [PubMed] [Google Scholar]
- Steiner J, Martins-de-Souza D, Schiltz K, Sarnyai Z, Westphal S, Isermann B, Dobrowolny H, Turck CW, Bogerts B, Bernstein HG, Horvath TL, Schild L, Keilhoff G (2014) Clozapine promotes glycolysis and myelin lipid synthesis in cultured oligodendrocytes. Front Cell Neurosci 8:384. 10.3389/fncel.2014.00384 [DOI] [PMC free article] [PubMed] [Google Scholar]
- Tang DG, Tokumoto YM, Raff MC (2000) Long-term culture of purified postnatal oligodendrocyte precursor cells: evidence for an intrinsic maturation program that plays out over months. J Cell Biol 148:971–984. 10.1083/jcb.148.5.971 [DOI] [PMC free article] [PubMed] [Google Scholar]
- Taraboletti A, Walker T, Avila R, Huang H, Caporoso J, Manandhar E, Leeper TC, Modarelli DA, Medicetty S, Shriver LP (2017) Cuprizone intoxication induces cell intrinsic alterations in oligodendrocyte metabolism independent of copper chelation. Biochemistry 56:1518–1528. 10.1021/acs.biochem.6b01072 [DOI] [PMC free article] [PubMed] [Google Scholar]
- Targett MP, Sussman J, Scolding N, O'Leary MT, Compston DA, Blakemore WF (1996) Failure to achieve remyelination of demyelinated rat axons following transplantation of glial cells obtained from the adult human brain. Neuropathol Appl Neurobiol 22:199–206. 10.1046/j.1365-2990.1996.4398043.x [DOI] [PubMed] [Google Scholar]
- Tokumoto YM, Durand B, Raff MC (1999) An analysis of the early events when oligodendrocyte precursor cells are triggered to differentiate by thyroid hormone, retinoic acid, or PDGF withdrawal. Dev Biol 213:327–339. 10.1006/dbio.1999.9397 [DOI] [PubMed] [Google Scholar]
- Tyler WA, Gangoli N, Gokina P, Kim HA, Covey M, Levison SW, Wood TL (2009) Activation of the mammalian target of rapamycin (mTOR) is essential for oligodendrocyte differentiation. J Neurosci 29:6367–6378. 10.1523/JNEUROSCI.0234-09.2009 [DOI] [PMC free article] [PubMed] [Google Scholar]
- Tyler WA, Jain MR, Cifelli SE, Li Q, Ku L, Feng Y, Li H, Wood TL (2011) Proteomic identification of novel targets regulated by the mammalian target of rapamycin pathway during oligodendrocyte differentiation. Glia 59:1754–1769. 10.1002/glia.21221 [DOI] [PMC free article] [PubMed] [Google Scholar]
- Wahl SE, McLane LE, Bercury KK, Macklin WB, Wood TL (2014) Mammalian target of rapamycin promotes oligodendrocyte differentiation, initiation and extent of CNS myelination. J Neurosci 34:4453–4465. 10.1523/JNEUROSCI.4311-13.2014 [DOI] [PMC free article] [PubMed] [Google Scholar]
- Windrem MS, Nunes MC, Rashbaum WK, Schwartz TH, Goodman RA, McKhann G 2nd, Roy NS, Goldman SA (2004) Fetal and adult human oligodendrocyte progenitor cell isolates myelinate the congenitally dysmyelinated brain. Nat Med 10:93–97. 10.1038/nm0204-209a [DOI] [PubMed] [Google Scholar]
- Xiaoyu H, Yiru Y, Shuisheng S, Keyan C, Zixing Y, Shanglin C, Yuan W, Dongming C, Wangliang Z, Xudong B, Jie M (2018) The mTOR pathway regulates PKM2 to affect glycolysis in esophageal squamous cell carcinoma. Technol Cancer Res Treat 17:1533033818780063. 10.1177/1533033818780063 [DOI] [PMC free article] [PubMed] [Google Scholar]
- Yamate-Morgan H, Lauderdale K, Horeczko J, Merchant U, Tiwari-Woodruff SK (2019) Functional effects of cuprizone-induced demyelination in the presence of the mTOR-inhibitor rapamycin. Neuroscience 406:667–683. 10.1016/j.neuroscience.2019.01.038 [DOI] [PMC free article] [PubMed] [Google Scholar]
- Ziabreva I, Campbell G, Rist J, Zambonin J, Rorbach J, Wydro MM, Lassmann H, Franklin RJ, Mahad D (2010) Injury and differentiation following inhibition of mitochondrial respiratory chain Complex IV in rat oligodendrocytes. Glia 58:1827–1837. 10.1002/glia.21052 [DOI] [PMC free article] [PubMed] [Google Scholar]