

Abstract
Oligodendrocytes exist in a heterogenous state and are implicated in multiple neuropsychiatric diseases including dementia. Cortical oligodendrocytes are a glial population uniquely positioned to play a key role in neurodegeneration by synchronizing circuit connectivity but molecular pathways specific to this role are lacking. We utilized oligodendrocyte-specific translating ribosome affinity purification and RNA-seq (TRAP-seq) to transcriptionally profile adult mature oligodendrocytes from different regions of the central nervous system. Weighted gene co-expression network analysis reveals distinct region-specific gene networks. Two of these mature myelinating oligodendrocyte gene networks uniquely define cortical oligodendrocytes and differentially regulate cortical myelination (M8) and synaptic signaling (M4). These two cortical oligodendrocyte gene networks are enriched for genes associated with dementia including MAPT and include multiple gene targets of the regulatory microRNA, miR-142-3p. Using a combination of TRAP-qPCR, miR-142-3p overexpression in vitro, and miR-142-null mice, we show that miR-142-3p negatively regulates cortical myelination. In rTg4510 tau-overexpressing mice, cortical myelination is compromised, and tau-mediated neurodegeneration is associated with gene co-expression networks that recapitulate both the M8 and M4 cortical oligodendrocyte gene networks identified from normal cortex. We further demonstrate overlapping gene networks in mature oligodendrocytes present in normal cortex, rTg4510 and miR-142-null mice, and existing datasets from human tauopathies to provide evidence for a critical role of miR-142-3p-regulated cortical myelination and oligodendrocyte-mediated synaptic signaling in neurodegeneration.
Graphical abstract

Introduction
Oligodendrocytes provide insulating myelin to axons throughout the central nervous system. Recent work suggests a rich heterogeneity in oligodendrocytes and defines up to 20 different populations of oligodendrocytes that vary in density throughout the central nervous system (1). Non-myelinating functions of oligodendrocytes have been proposed (2) that contribute to a heterogeneity of function for this unique glial cell and potentially to disease phenomena. Consistent with this observation, a number of neurodegenerative and neuropsychiatric diseases including dementia, implicate oligodendrocytes in their pathogenesis yet details regarding the cellular heterogeneity and molecular mechanisms that drive these contributions are unknown (3–10).
Partly due to the morphologic complexity of myelinating oligodendrocytes, in vivo gene expression studies of these cells are limited. Single cell approaches have been utilized with success but a significant amount of mRNA transcript regulation in oligodendrocytes occurs outside of the cell body in myelin and oligodendrocyte processes (11,12). Transcriptional profiling with translating ribosome affinity purification (TRAP) provides an attractive method for deep gene expression profiling of oligodendrocytes since tagged ribosomes expressed only in mature oligodendrocytes can be immunoprecipitated directly from tissue homogenates along with mRNA transcripts undergoing active translation (13). This approach allows enhanced capture of mRNA and non-coding RNA species associated with the ribosome wherever translation is occurring thereby offering a particular advantage for morphologically complex cell types like myelinating oligodendrocytes.
We utilized the adult 2′,3′-cyclic-nucleotide 3′-phosphodiesterase (CNP)-Rpl10a-GFP bac-transgenic TRAP mouse (14) coupled with direct RNA sequencing (TRAP-seq) to exploit differences in the transcriptome of mature oligodendrocytes in four distinct neuroanatomical regions in the central nervous system. This approach confirms an increasing transcriptional complexity in oligodendrocytes moving rostrally in the central nervous system (CNS) and identifies new molecular signatures of regionally specific mature oligodendrocytes. Using comparative bioinformatics, we asked whether the exploitation of this regionally distinct profiling could inform how oligodendrocytes in different regions contribute to neuropsychiatric disease. We specifically focused on the role of cortical oligodendrocytes given their emerging role in the dynamic regulation of neural circuits and prior evidence suggesting a role for cortical myelination in neurodegenerative disease. Finally, we sought to identify microRNA species that may uniquely regulate oligodendrocyte diversity in the nervous system.
Results
Distinct regional gene expression profiles in mature oligodendrocytes
Mature oligodendrocyte gene expression profiles were isolated from P60 CNP-Rpl10a-enhanced green fluorescent protein (EGFP) bac-transgenic TRAP mice (Fig. 1A) that robustly express GFP-tagged ribosomes and are present throughout the frontal cortex, subcortical white matter, cerebellum, and spinal cord and consistently co-localized with the mature oligodendrocyte marker GST-π (Fig. 1B). Immunoprecipitation of GFP-tagged ribosomes from CNP-60S Ribosomal Protein L10a (Rpl10a)-GFP mice results in 11.4- and 4.4-fold enrichment for the known mature oligodendrocyte marker genes, Cnp and Cmtm5, respectively (Fig. 1C), by qPCR relative to expression in mouse whole brain. TRAP-seq performed from the four indicated CNS regions indicates that five of the top 10 detected transcripts across all samples were well-established mature oligodendrocyte marker genes (Fig. 1D; Supplementary Material, Data S1 and S2) further establishing significant enrichment of the mature oligodendrocyte phenotype in CNP-Rpl10a-GFP TRAP-seq generated samples. Comparisons of differentially expressed genes (DEGs) (q < 0.05) between frontal cortex oligodendrocytes and oligodendrocytes in other CNS regions indicates that conserved DEGs are enriched for those controlling myelination (Fig. 1E; Supplementary Material, Data S3). Gene ontology of DEGs that distinguish frontal cortex oligodendrocytes from those in more rostral portions of the CNS suggests a number of unique biologic pathways that may differentiate oligodendrocytes throughout the CNS. TRAP-qPCR validation of 15 selected putative regionally distinct oligodendrocyte marker genes identified by TRAP-seq (Supplementary Material, Fig. S1) generated several examples of genes not previously associated with oligodendrocytes that demonstrate regional heterogeneity (Supplementary Material, Fig. S2). Thus, TRAP-seq profiling of mature oligodendrocytes validates heterogeneity in the oligodendrocyte lineage and identifies new marker genes for regional heterogeneity.
Figure 1 .

Oligodendrocyte TRAP-seq WGCNA identifies regionally distinct, disease-associated gene modules. Schematic illustrating oligodendrocyte TRAP-seq WGCNA from P60 bacCNP-Rpl10a-EGFP transgenic mice (A). GFP (green) expression in mature oligodendrocytes (OL) throughout the CNS including the frontal cortex and subcortical white matter and co-localizes with GST-π (magenta) (B). TRAP enrichment of two mature OL marker genes by qPCR (left panel) (C). Top genes by %fpkm from OL TRAP-seq shows numerous OL marker genes (bold) among the top 11 genes overall (D). Venn diagram of regionally unique DEGs (q < 0.05) between frontal cortex OL and other CNS regions with gene ontology of shared biological pathways that distinguish cortical OL and those that differ between FC versus CC OL (red), FC versus CBL OL (green), and FC versus SC OL (blue) (E). Scatter plot of 14 regionally distinct modules identified by WGCNA (yellow plane represents P = 0.05) (F). Composite hypergeometric enrichment of cortical OL modules for known single cell oligodendrocyte classifications (1) (size relative to average # of overlapping genes) (G). Disease category enrichment among the six FC OL modules with two modules (M4 and M8) enriched for genes associated with clinical dementia (H). White box indicates no enrichment. Scale bars = 500 μm (B, upper left); 100 μm (B, right); 10 μm (lower). fc = frontal cortex, wm = corpus callosum, cbl = cerebellum, sc = cervical spinal cord.
Identification of gene co-expression networks unique to cortical oligodendrocytes and enriched in neurologic disease
To identify regionally distinct oligodendrocyte co-expressed gene networks, we performed weighted gene co-expression network analysis (WGCNA) (15) on mature oligodendrocyte TRAP-seq samples (n = 24). WGCNA produced 35 distinct oligodendrocyte gene modules (Supplementary Material, Fig. S3 and Data S4) of which 14 demonstrated significant regional enrichment (Fig. 1F; Supplementary Material, Fig. S4). We initially focused on the frontal cortex to examine whether a link between myelination and neurodegeneration could be observed. Of the six modules enriched in frontal cortex (M4, M5, M8, M9, M11 and M21), five were enriched for genes marking unique single-cell gene expression profiles from previously characterized mature oligodendrocyte subtypes that are over-represented in cortex (1) (Fig. 1G; Supplementary Material, Data S5). All five of these M modules skewed towards myelin-forming or mature oligodendrocyte populations further supporting the fundamental enrichment of mature oligodendrocyte transcriptomics using CNP-Rpl10a-EGFP bac-transgenic TRAP-seq.
Modules enriched in samples from frontal cortex were significantly enriched for genes associated with human neurologic disease (Fig. 1H; Supplementary Material, Data S6). Unsurprisingly, we found strong enrichment for a number of disease associations of neuron connectivity or development that might be expected when profiling oligodendrocytes including multiple sclerosis (M9), leukodystrophies (M8, M9, M11), spastic paraparesis (M4, M9) and intellectual disability/developmental delay (all M modules). In contrast, several modules showed unanticipated enrichment for conditions not classically associated with myelination including epilepsy (M4, M5, M8, M11, M21) and dementia (M4, M8). Although modest, this enrichment for dementia genes was intriguing (Fig. 1H; Supplementary Material, Data S6), given the significant global health impact posed by dementing illness, their rapidly growing prevalence, (16) and recent studies implicating a role for myelination in their development, (17–19) so we specifically focused on exploring the relationship of these modules to dementia. Multiple recent reports have implicated a critical role for oligodendrocytes in memory formation (20–22), multiple neurodegenerative models (23–25), in human imaging (26,27) and post-mortem brain specimens (19,28) but the link to the normal myelinating and non-myelinating biology of oligodendrocytes, particularly outside of white matter tracts, has remained elusive. Therefore, to investigate this relationship between frontal cortical oligodendrocytes and genes associated with Mendelian-inherited forms of dementia in humans, we focused on the M4 and M8 modules as these were only frontal cortical-specific modules whose module eigengenes were correlated in both frontal cortex and corpus callosal white matter suggesting a relationship to both myelinating and non-myelinating functions of oligodendrocytes (Supplementary Material, Fig. S3). Importantly, these dementia-associated modules are also strongly enriched for previously characterized and distinct single-cell mature oligodendrocyte subtypes over-represented in frontal cortex with M4 enriched for genes associated with mature oligodendrocyte single-cell subtype MOL3 (P = 1.47 × 10⁻¹²), and M8 enriched for genes marking mature oligodendrocyte single-cell subtype MOL5 (P = 1.09 × 10⁻¹²) (Supplementary Material, Fig. S5).
Representation of the gene co-expression networks of M4 and M8 (Fig. 2) illustrate complex gene interactions active within cortical oligodendrocytes. The M8 module is heavily enriched for oligodendrocyte genes (P = 6.80 × 10⁻²³; Supplementary Material, Data S7) and the most highly connected genes within this network, or hubs, include genes such as Olig1 and Mical that regulate various stages of myelination (29,30). Notably, one of the centrally connected genes in this network is the microtubule-associated protein tau (MAPT), a primary genetic driver of neurodegeneration (31). Familial mutations in MAPT result in frontotemporal dementia and neuronal accumulation of tau is implicated in Alzheimer’s disease. Tau also plays a central role in cytoskeletal elaboration critical to the final stages of myelination (32,33). This M8 module also includes Sort1, which functions as cell-surface receptor for the Alzheimer’s disease risk allele, apolipoprotein E (ApoE) (34).
Figure 2 .

Gene co-expression networks from cortical oligodendrocytes associated with dementia. Representation of the top interconnected genes in the M8 (myelination module, top) and M4 (non-myelination module, bottom) weighted gene co-expression network modules enriched in frontal cortex OL from mouse brain. The top 800 connections are depicted. Highly connected genes (hubs) are depicted as larger sized nodes. Cell-type-specific and disease-associated genes are indicated. The M4 non-myelination module network found in cortical OL is enriched for classically neuronal genes. MAPT, a key gene associated with human dementia, is highlighted (blue text) within the M8 myelination module.
Interestingly, the M4 module found in mature cortical oligodendrocytes is enriched for neuronal genes (P = 2.41 × 10−85; Supplementary Material, Data S7) with most of these traditionally neuronal genes functional at the synapse. The presence of synaptic genes in this network suggests that normal resident mature cortical oligodendrocytes are responsive to cortical activity consistent with recent evidence of cortical plasticity mediated through myelination (35). Thus, the M4 module likely reflects non-myelinating functions of cortical oligodendrocytes and the balance between M4 and the pro-myelinating M8 module may function as a regulatory switch important in the cortical microenvironment.
miR-142-3p negatively regulates cortical oligodendrocyte gene networks and cortical myelination
microRNAs (miRs) play a central role in regulating oligodendrocyte development and myelination (36–38). Because of their significant enrichment in the CNS and their repressive ability of mRNA translation, we reasoned that distinct miRs might function to regulate WGCNA-identified oligodendrocyte modules. To identify potential broad regulators that might control transitions in M4 and M8 network expression, we examined microRNA target enrichment in regionally distinct WGCNA-derived oligodendrocyte networks using TargetScan (39). Among the top enriched microRNAs for all modules was miR-142-3p (Fig. 3A), a microRNA previously associated with lung differentiation and malignancy (40,41) but, surprisingly, not among the top microRNAs present in the brain (42). Both M4 and M8 were significantly enriched for miR-142-3p targets suggesting a putative role for miR-142-3p in regulating these modules within the cerebral cortex (Supplementary Material, Data S7). Mature oligodendrocyte miR-142-3p expression by oligodendrocyte TRAP-qPCR in all CNS regions was increased relative to whole brain (P=0.003 by one-way ANOVA). miR-142-3p expression was 33-fold enriched (P=0.006) by qPCR in frontal cortex TRAP isolates normalized to expression in whole brain, while other microRNAs (106b and 103a-3p) were not significantly altered (Fig. 3B). To confirm a role for miR-142-3p in regulating myelination, we isolated early post-natal rat oligodendrocyte progenitor cells and differentiated them into mature oligodendrocytes (43). After differentiation, we transfected 1 nm miR-142-3p analogs and examined mature oligodendrocyte marker gene expression by qPCR array (Fig. 3C). Compared to scrambled miR analogs, miR-142-3p transfection broadly reduced mature oligodendrocyte marker gene expression while transfection with miR-23a did not (Supplementary Material, Fig. S6). In miR-142-null mice (Fig. 3D) (44), cortical myelination is significantly increased compared to wild-type mice with a shift in immature:mature oligodendrocyte lineage cells in the frontal cortex (Fig. 3E) and an increased cortical myelination index (Fig. 3F). These findings suggest that miR-142-3p negatively regulates myelination uniquely within the cerebral cortex and its specific expression within the cortex may regulate a balance between the M8 myelination module and the M4 non-myelination module. Though we only tested the effect of miR-142-3p on myelination, given its target enrichment profile (Supplementary Material, Data S7), miR-142-3p may more dramatically regulate disease-associated networks (M4) and the non-myelinating functions of cortical oligodendrocytes.
Figure 3 .

miR-142-3p negatively regulates cortical myelination. miR-142-3p target enrichment in OL gene co-expression modules (# target genes/module on top of bar) (A). qPCR for miR species using independent OL TRAP replicates from different CNS regions relative to expression in whole brain (P = 0.003 by one-way ANOVA) (B). qPCR array for mature OL gene markers (48) after transfection with miR-142-3p analog (1 nm) versus scrambled miR control (*>95% confidence interval testing) with representative MBP (green), CNP (purple), DAPI (white) immunostaining of miR-transfected OLs (C). Immunolabeling for myelin (white), mature (GST-π; red), and immature (PDGFRα; green) OL populations in miR-142 knockout animals demonstrates increased mature OL in frontal cortex (D). Box and violin plot of GST-π cells/cortical field-of-view (149.8 ± 5.8 versus 203.5 ± 5.6; *P < 0.0001; n = 5; red) and PDGFRα cells/cortical FOV (57.26 ± 1.2 versus 49.0 ± 1.1; *P < 0.0001; n = 5) in wild-type and miR-142 knockout mice (E). Box and violin plot of cortical myelination index (17.1 ± 0.8 versus 30.1 ± 1.5; n = 5; *P < 0.0001) with representative MBP staining in wild-type (left) and miR-142 knockout mice (right) frontal cortex (F). Scale bar = 200 μm (left) 20 μm (right) (D); 100 μm (F).
Conservation of cortical oligodendrocyte gene networks in a tau mouse model
Of the two dementia-associated, cortical oligodendrocyte gene co-expression networks, M8 was of particular interest, given that it included the dementia-associated gene, MAPT. To determine the relevance of M8 and a potential role for cortical myelination in tauopathy, we examined cortical myelination and performed tissue RNA-seq and WGCNA on frontal cortex samples from 8-month old rTg4510 tau transgenic mice (45) (Fig 4A). This tau transgenic strain harbors a P301L mutation in Mapt, in addition to genomic disruption of the Fgf14 locus (46) generated by transgene insertion, and develops progressive accumulation of human mutant tau protein over time in CamKIIa-expressing neurons including in the frontal cortex beginning around 8 months (47). Differential gene expression in the frontal cortex of rTg4510+ and rTg4510– mice (Supplementary Material, Data S8) indicates a shift in the expression pattern of the genes that define the two cortical oligodendrocyte subpopulations (MOL3 and MOL5) that showed the greatest overlap with M4 (17/50 genes; P=1.56×10⁻⁶) and M8 (10/50 genes; P = 0.0167), respectively. In rTg4510+ frontal cortex, conserved and expressed MOL3/M4 genes were up-regulated while MOL5/M8 genes were down-regulated (P = 8.83×10⁻⁵) (Fig. 4B). Recognizing that the primary role of the M8 myelination module is regulating cortical myelination, we examined the frontal cortex of rTg4510 animals for evidence of reduced myelination. Compared to 8-month old rTg4510– animals, rTg4510+ mice showed a loss of cortical myelin and fewer mature oligodendrocytes in frontal cortex (Fig. 4C). WGCNA of bulk RNA-seq from the frontal cortex of rTg4510+ mice identified 45 unique modules, of which, only three (T4, T20 and T25) were significantly associated with the presence of the tau transgene (Fig. 4D; Supplementary Material, Fig. S7, Data S9). Both M4 and M8 modules were preserved in the T module dataset (preservation z-summary: M4 = 11.0; M8 = 3.8). Module comparative analysis revealed that two of these rTg4510-derived tauopathy-associated modules (T20 and T25), were enriched for hypergeometric overlap with oligodendrocyte-derived module M4 (124 genes, P=3.16×10−49 and 66 genes, P=8.9×10⁻³¹, respectively) (Fig. 4E; Supplementary Material, Data S7 and S10). The other tauopathy-associated module, T4 overlapped with the oligodendrocyte-derived module M8 (94 genes, P=4.36×10⁻¹⁰) (Fig. 4F; Supplementary Material, Data S7 and S10). This analysis demonstrates that the distinct and fundamental biologic networks specific to cortical oligodendrocytes and enriched for genes linked to dementia identified in normal mouse brain (M modules) are associated with the development of tau-mediated neurodegeneration (T modules) in the frontal cortex of rTg4510 mouse model.
Figure 4 .

Cortical myelination and conservation of cortical oligodendrocyte gene co-expression modules in rTg4510 tau transgenic mice. The rTg4510 tau transgenic mouse strain was used to examine cortical myelination and conservation of OL gene networks in association with tau-mediated neurodegeneration (A). Average log-fold change of conserved and DEGs in defined frontal cortex single cell OL populations (Mol 3 and Mol 5) that overlap with M4 and M8, respectively, in 8-month old rTg4510+ mice (dashed line = median; P = 8.83×10⁻⁵) (B). Frontal cortex myelination measured by MBP immunoreactivity (white) and GST-π+ cells (red) are reduced in the frontal cortex of 8-month old rTg4510+ mice compared to non-transgenic controls (GST-π+ cell number = 38.83 ± 2.37 versus 28.67 ± 1.32, n = 4/grp, P = 0.001) (C). Disease association index for WCGNA-derived modules from rTg4510 frontal cortex RNA-seq defines three tau-associated modules (T4, T20, T25) (D). Scatter plot of T module disease enrichment versus M4 (E) and M8 (F) module enrichment by module size (# of genes in T-module = y-axis; # of overlapping M/T genes = size of point). RNA-seq data from the hippocampus of miR-142+/− and miR-142−/− mice (n = 4/grp) were used for WGCNA to identify modules specific for miR-142−/− status (G). Scatter plot of K modules versus miR-142−/− trait association index with miR-142-null K modules shown in light blue (H). Module preservation analysis of M modules in both K and T datasets (I). Venn diagram of hypergeometric gene list comparisons between M, T and K modules (J). Color bars = composite –log10 P-value enrichment. Dashed red lines indicate significance threshold. Yellow plane represents disease enrichment P = 0.05.
Cortical oligodendrocyte gene networks are preserved in human tauopathy
To further assess the connection between cortical oligodendrocytes and human Alzheimer’s disease, we compared the overlapping cortical OL modules (M4 and M8) and tauopathy-associated modules (T4, T20, and T25) to published WGCNA modules identified in cortical samples from human subjects with tauopathies including Alzheimer’s disease (19). In this analysis, M8 shows significant overlap with a disease-associated myelination module found in human subjects (P=2.12×10⁻¹⁰) with the overlapping genes strongly expressed in mature oligodendrocytes (48) (P=1.77×10−40) (Supplementary Material, Data S7). Similarly, the T4 tauopathy-associated module, strongly overlapping with the M8 myelination module, also demonstrated significant overlap with a disease-associated myelination module found in these human subjects (P=0.026) (Supplementary Material, Data S10). This indicates that gene co-expression networks intrinsic to mature cortical oligodendrocytes in normal mouse brain are also differentially regulated during the pathogenesis of tauopathy in both mouse and human brain.
Cortical oligodendrocyte and tauopathy gene networks are associated with genetic deletion of miR-142
Variants of miR-142-3p have recently been associated with a reduced risk of Alzheimer’s disease (49). Building on in vitro and in vivo data implicating miR-142-3p in the regulation of novel oligodendrocyte gene networks, we examined miR-142-null mice by WGCNA to directly assess whether our significant oligodendrocyte modules (M4, M8) or tauopathy modules (T4, T20, T25) were affected by absence of the miR (Fig. 4G). Given the association of these oligodendrocyte gene networks with dementia, to better examine the connection between these networks and disease, we focused on the more clinically- and biologically relevant hippocampus (50) rather than frontal cortex in these animals, although the identical relationships were observed in both tissues (Supplementary Material, Fig. S8; Data S11–S15). Comparison of miR-142-null mice with miR-142-heterozygotes identified four modules (K31, K42, K44, K45) strongly associated with the complete loss of miR-142 (Fig. 4H; Supplementary Material, Data S13). Both the M4 and M8 oligodendrocyte modules were preserved in the K dataset (preservation z-summary: M4 = 4.5; M8 = 3.6), indicating these networks are biologically conserved across gray matter brain regions. Reciprocal preservation of M4 and M8 in both the K and T datasets indicates these oligodendrocyte gene networks are universally conserved in both normal and disease states (Fig. 4I). Hypergeometric analysis demonstrates a significant relationship between the genes within K31 and M4 (P = 2.04×10⁻⁴), while K42 overlaps most significantly with M8 (P = 1.47×10⁻⁵) and with M4 to a lesser extent (P = 5.33×10⁻³) (Fig. 4J). Cell-type enrichment analysis indicates K42 is most like oligodendrocytes (P = 0.002) and is enriched for disease-associated genes causing leukodystrophy, dementia and motor neuron disease, similar to M4 and M8 (Supplementary Material, Data S14). Taken together, these findings signal a fundamental and novel role for miR-142 in both normal cortical myelination and in disorders of myelination.
Tauopathy-associated modules including T20 and T25 were also preserved in the hippocampal K module dataset (preservation z-summary: T20 = 3.2; T25 = 2.3). These modules both overlapped significantly with the K31 miR-142-null module T20, P = 5.53 × 10⁻⁴, T25, P = 0.014) while T20 also showed significant overlap with K44 (P = 4.49 × 10⁻³). Although not preserved in the hippocampal K dataset, the T4 tauopathy-associated module still demonstrated significant overlap with K45 (P = 0.017). The association of miR-142-null-specific modules with the overlapping cortical oligodendrocyte M modules and tauopathy-associated T modules further implicates a critical role for miR-142 in oligodendrocyte-associated tauopathy-related gene networks.
miR-142-regulated cortical oligodendrocyte protein–protein interaction networks associated with tauopathy
Next we sought to identify biological pathways linking cortical oligodendrocyte function, miR-142 regulation, and tauopathy by examining whether specific biological pathways were conserved across the key modules identified by WGCNA. Representation of the protein–protein interactions conserved between the M8, T4, K42 and K45 modules reveals a highly interconnected functional network (Fig. 5). Four distinct clusters of protein interactions that are enriched for biologic processes previously implicated in neurodegeneration including inflammation, RNA processing, protein metabolism and signal transduction (Supplementary Material, Data S15) are present in the network (51,52). Fourteen established miR-142-3p targets are present within this conserved network, although it is overall not significantly enriched for miR-142-3p targets. However, the presence of multiple genes contained within all four modules, including the two miR-142-null-associated modules, strongly supports a regulatory role for miR-142-3p in coordinating the biological function of this network.
Figure 5 .
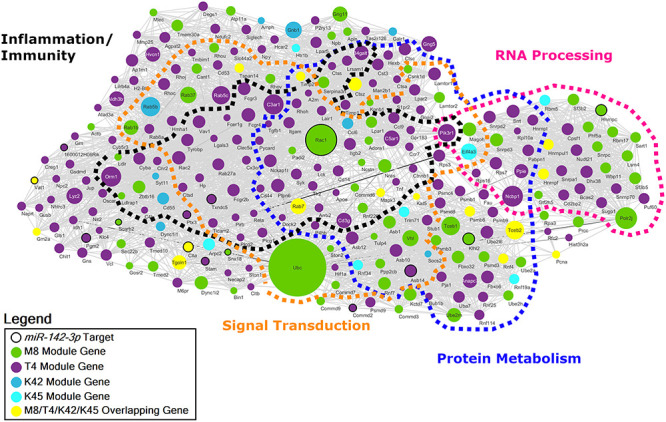
Conserved M8/T4/K42/K45 protein–protein interaction network derived from cortical oligodendrocytes. Network diagram of conserved protein–protein interactions intersecting the OL myelination M8 module, the tauopathy-associated T4, and the miR-142-null-specific K42/K45 modules organized into functional clusters based on significantly enriched gene ontologies. Node size corresponds to the number of connections (degree) prior to filtering.
We constructed a similar network representation of the conserved genes in the M4, T20, T25 and K31 modules (Fig. 6). This protein–protein interaction network implicates frontal cortical oligodendrocytes in the dysregulation of synaptic signaling and protein modification, as well as disorders of neurodevelopment. This network contains multiple genes associated with syndromes of intellectual disability and developmental delay (P = 9.28 × 10⁻¹²). Gene ontology conservation among the M4/T20/T25/K31 interaction network points to oligodendrocyte-mediated regulation of the synapse as a novel mechanism contributing to cortical neurodegeneration (Supplementary Material, Data S15). Although this combined interaction network is not statistically enriched for miR-142-3p targets overall, the presence of 20 established miR-142-3p targets in the M4/T20/T25/K31 interaction network together with a substantial number of genes present in all modules within the network, including the K31 miR-142-null-associated modules, again points to a direct role for this miR in the regulation of cortical neurodegeneration. Importantly, the T20 and T25 WGCNA tauopathy-associated gene modules and the M4 OL gene module individually show significant enrichment for miR-142-3p targets (Fig. 3A; Supplementary Material, Fig. S7, Data S7 and S10).
Figure 6 .
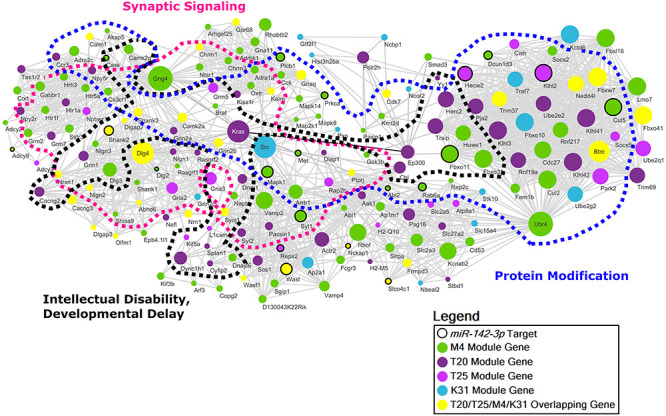
Conserved M4/T20/T25/K31 protein–protein interaction network derived from cortical oligodendrocytes. Network diagram of conserved protein–protein interactions intersecting the OL non-myelination M4 module, the tauopathy-associated T20 and T25, and the miR-142-null-specific K31 modules organized into functional clusters based on significantly enriched gene ontologies and neuropsychiatric diseases. Node size corresponds to the number of connections (degree) prior to filtering.
Discussion
Beyond their obvious contribution to diseases of white matter, oligodendrocytes may play a significant and substantial role in modulating a wide variety of neuropsychiatric diseases including various forms of neurodegenerative disease. Precisely how these complex cells directly or indirectly influence the development of neurodegenerative disease is unknown but likely to be driven by their intrinsic cellular and molecular heterogeneity. In this study, we utilized cell-specific transcriptional profiling enabled by TRAP coupled with direct RNA sequencing (TRAP-seq) to exploit differences in the transcriptome of mature oligodendrocytes in cortex, white matter, cerebellum and spinal cord. Using comparative bioinformatics with existing cell-type transcriptional databases together with WGCNA, we identified oligodendrocyte gene expression networks specific to distinct regions of the central nervous system.
This unique and rich database generated by our TRAP-seq-WGCNA approach for oligodendrocytes includes multiple gene networks with biologic and disease-associated relationships with myelination and white matter. We focused our analysis on gene co-expression networks unique to mature oligodendrocyte populations residing in the frontal cortex that were found to be enriched for and highly connected with genes related to human disorders of myelination and white matter. Among these oligodendrocyte gene co-expression networks enriched in the frontal cortex were two networks enriched for genes associated with Mendelian forms of dementia suggesting cortical myelination has a direct functional relationship with neurodegenerative disease pathogenesis. To confirm this relationship, we used a common mouse model of tauopathy to determine the conservation of these gene co-expression modules both within the cortex and in association with the development of tauopathy. Several prior studies have examined myelin and oligodendrocytes at earlier stages in the progression of tauopathy in the rTg4510 strain. A combined light and electron microscopy study demonstrated that up until 9 months of age most of the myelinated nerve fibers in the cortex have a normal appearance with progressive loss between 9 and 13 months of age (53). Additionally, progressive loss of myelin and abnormal oligodendrocytes during the development of tauopathy has been observed in the subcortical white matter using both histopathology (54) and in vivo brain imaging (55). Finding direct overlap of naturally occurring oligodendrocyte gene networks with tau-associated gene networks coupled with a failure of cortical myelination in the rTg4510 mouse model validates the postulate that declines in cortical myelination may be a potential driver of neurodegenerative disease.
While a central role for oligodendrocytes is the elaboration of myelin and axonal support, functions beyond myelination performed by this abundant cell type within the CNS remain relatively elusive. Prior comprehensive single-cell sequencing of oligodendrocyte lineage cells characterized multiple different populations of OLs throughout the CNS including six different populations of mature OLs present in the cortex, providing direct support for the concept of regional heterogeneity and suggests additional functions beyond myelination are likely. Together with the recent evidence implicating oligodendrocytes in the pathology of motor neuron disease (6), multiple system atrophy (7), and Alzheimer’s disease (56), disorders that are not traditionally associated with white matter tract dysfunction, the importance of understanding oligodendrocyte biology and functionality within brain regions outside of myelinated tracts becomes increasingly vital. Yet even single-cell sequencing approaches have not identified regulatory checkpoints that might provide clues to how this regional heterogeneity is patterned or identified disease-related genes that signal roles for oligodendroglial heterogeneity in varying disease processes.
Using the regionally specific gene co-expression networks we identified, a detailed analysis for regulatory checkpoints of M4 and M8 identifies a novel role for miR-142-3p in oligodendrocyte biology. miR-142-3p is a microRNA that is well-positioned to exert a regulatory role on cellular differentiation with prior studies suggesting it can serve as a multifaceted regulator in organogenesis, homeostasis and disease (57). Based on our in vitro and in vivo data, miR-142-3p appears to play a role in regulating oligodendrocyte differentiation and myelinating gene expression of oligodendrocytes within the microenvironment of the cerebral cortex and perhaps in other gray matter regions such as the hippocampus. In the lung, miR-142-3p positively regulates WNT/CTNNB1 (β-catenin) signaling via targeting of the 3′ UTR of adenomatous polyposis coli, providing a potential pathway to block the final steps necessary for the expansion of myelin membranes within the cortex (40,58). Alternatively, miR-142-3p targets within these cortical oligodendrocyte gene networks may have a greater influence on driving non-myelinating functions of oligodendrocytes in the cortex. miR-142-null mice show conserved gene co-expression networks in the frontal cortex and hippocampus that overlap significantly with both cortical oligodendrocyte-derived M modules and frontal cortical tauopathy-associated T modules further supporting a role for miR-142-3p in the regulation of these networks and in the development of neurodegenerative disease. Establishing a direct connection between miR-142-3p and regulation of these networks is a critical next step and additional efforts to identify the precise regulatory mechanism of miR-142-3p and its targets within oligodendrocytes are underway. Understanding the effect of miR-142-3p inhibition in oligodendrocyte biology may provide new opportunities to selectively target remyelinating therapies to particular anatomic regions within the central nervous system.
The broad categories of gene functions identified in the M8/T4/K42/K44 and M4/T20/T25/K31 networks contain biologic pathways that are constitutively active in oligodendrocytes but also some that are novel. Interacting gene networks driving RNA processing and protein metabolism present in the M8/T4/K42/K44 network are core functions critical to myelination and therefore likely reflect pathways associated with cortical myelination failure in tauopathy. Similarly, strong signals for protein modification in the M4/T20/T25/K31 network reflect age-related pathways regulating myelin and oligodendrocyte protein targeting and turnover that have been implicated in age-related cognitive impairment (59). In contrast, consistent enrichment of genes involved in synaptic signaling and associated with neurodevelopmental disorders within cortical oligodendrocytes suggests an important non-myelinating role for these cells and a novel set of synaptic signaling pathways in oligodendrocytes. Replication of these highly connected gene networks in frontal cortex neurodegeneration mediated by tau and in the hippocampus of miR-142-null mice suggests cortical oligodendrocytes may specifically drive unique disease-relevant synaptic failure, perhaps through miR-142-3p-mediated network regulation.
Cortical myelination plays a central role in regulating neuroplasticity and provides an important conduit for the brain to consolidate neural circuitry (60). Using a network analysis approach, we confirm a fundamental heterogeneity of mature oligodendrocytes and show that cortical oligodendrocytes harbor fundamentally distinct gene expression networks that may underlie their role in cortical plasticity. Importantly, our TRAP-seq-WGCNA approach identified two gene co-expression modules specific to cortical oligodendrocytes with distinct biologic functions (M8: myelination; M4: synaptic function) that are associated with tau-mediated neurodegeneration in both mouse and human as well as with miR-142 knockout in mice. In so doing, we connect the plastic control of cortical myelination, partially regulated through miR-142-3p, to tau-mediated neurodegeneration. Further studies are required to determine if modulating cortical myelination and specific cortical oligodendrocyte gene co-expression networks can dynamically alter neurodegeneration, however this work indicates that recognition of the fundamental diversity in oligodendroglia may have important implications in human neurologic disease.
Materials and Methods
Animals
All experiments were approved by the UCLA Animal Research Committee and performed in accordance with the National Institutes of Health animal protection guidelines. Male mice hemizygous for the CNP-EGFP/Rpl10a allele (B6;FVB-Tg(CNP-EGFP/Rpl10a)JD368Htz/J; Jackson Labs) (13) expressing EGFP+ ribosomes under control of the genomic sequence including the CNP promoter were used in the study (n = 8 for TRAP, n = 3 for biologic replicates, n = 8 for staining). miR-142-null mice (n = 7) and miR-142-heterozygotes (n = 4) on the C57Bl/6 background were generated as described (44) and processed as below at 3 months of age. Wild-type C57Bl/6 mice (n = 7) were used as controls for miR-142 null mice. Male mice hemizygous for the rTg4510 allele (Tg(Camk2a-tTA)1Mmay Fgf14Tg(tetO-MAPT*P301L)4510Kha/J; Jackson Labs) (n=8) (45) along with littermate controls (n=8) were used at 8 months of age. Mice were genotyped using established qPCR assays (Transnetyx) or through local genotyping protocols (miR-142-null).
Translating ribosome affinity purification
Adult male CNP-EGFP/Rpl10a mice aged 60 days were used to ensure that myelination was complete. TRAP was performed as described (13). Briefly, mice were euthanized, decapitated, and the brain and superior spinal cord rapidly dissected and placed into ice-cold dissection buffer. Using a brain block, the cerebellum was removed using a fresh razor blade. The bilateral cerebral cortex anterior to the hippocampus was removed using a fresh scalpel under a dissecting microscope. The subcortical white matter including the corpus callosum was similarly dissected from overlying cortex and underlying striatum. Tissue blocks were transferred to lysis buffer and homogenized thoroughly using 20 passes of a graded glass homogenizer. Entire homogenates were used in TRAP immunoprecipitation.
RNA isolation
Following immunoprecipitation, ribosomal-bound RNA was isolated using the Nucleospin miRNA isolation kit (Clontech) allowing purification of large and small RNA species. Bulk RNA from miR-142-null and heterozygote mice as well as rTg4510 mice was generated by fresh dissection of the frontal cortex (rTg4510) or hippocampus (miR-142-null), homogenization in lysis buffer and RNA isolation using the Nucleospin miRNA isolation kit. RNA quality was measured using an Aligent Bioanalyzer generating RINs between 6.1 and 9.5 for all samples.
qPCR
cDNA was generated using equal starting amounts of RNA and synthesized using the SuperScript VILO cDNA synthesis kit (ThermoFisher) or the NCode VILO miRNA cDNA Synthesis kit (ThermoFisher) to amplify miRNA sequences. Whole brain or thymus total RNA preparations (Clontech) were used in parallel as controls. Triplicate SYBR Green reactions were prepared for each sample and analyzed using a Roche Lightcycler 480. Target gene Cts were normalized to housekeeping gene expression and then further normalized to target gene expression in whole brain. Relative fold expression values were then averaged across biologic replicates. Primer sequences for each target gene are available upon request. For miRNA analysis by qPCR, we designed miR-specific primers using miRprimer (61). The primer sequences were as follows: miR-142-3p 5′-CGCTGTAGTGTTTCCTACTTTATGGA-3′; miR-106b 5′-CGTAAAGTGCTGACAGTGCAGAT-3′; miR-103a-3p 5′-AGCAGCATTGTACAGGGCTATG-3′; snoRNA202 5′-GACTTGATGAAAGTACTTTTGAACCCT-3′. qPCR reactions were run as above and miR expression values were normalized for expression of snoRNA202 and compared relative to expression levels in whole brain and thymus. To confirm specificity of miR-specific PCR products, PCR products were cloned into pCR-Blunt II-TOPO using a commercially available kit (ThermoFisher) and sequenced. For qPCR analysis of miR-transfected oligodendrocytes in culture, a group of 14 rat-specific primers were generated (43). Target gene Cts were normalized to two housekeeping gene markers (Actb, Gapdh) using a commercially available primer set (RealTime Primers). Primer sequences for all assayed genes are available upon request.
Immunofluorescence and confocal microscopy
Adult male mice from the CNP-EGFP/Rpl10a transgenic colony, miR-142-null mice, rTg4510 mice, and littermate or wild-type control animals were transcardially perfused, brain and spinal cord tissue removed, post-fixed and cryoprotected. Brain tissue was sectioned into 40 μm free floating sections as previously reported (62). Spinal cord tissue was sectioned in the coronal plane and mounted on 1% gelatin coated slides and stored at −20°C until staining. Sections were immunofluorescently labeled with the following antibodies: chicken anti-GFP (Abcam, Catalog #ab13970, 1:1000), rabbit anti-Lrrc10b (Novus Biologicals USA, Catalog #NBP2-33493, 1:100), rabbit anti-Crtam (Bioss Antibodies, Catalog #bs-4957R, 1:300), and rabbit anti-Hoxb8 (Antibodies-Online.com, Catalog #ABIN717776, 1:500). Primary antibodies were visualized by secondary antibody labeling with donkey anti-chicken-AlexaFluor 488 or donkey anti-rabbit AlexaFluor 594 antibodies (Jackson Immunoresearch). Thin optical slices of 0.300 μm were obtained at 60× magnification on a Nikon C2 confocal microscope equipped with Nikon Elements Software. Immunostaining of miR-142-null mice and rTg4510 transgenic mice was performed as above using the following antibodies: mouse anti-myelin basic protein (EMD Millipore, Catalog #NE1018, 1:1000), rabbit anti-GST-π (EMD Millipore, Catalog #AB8902, 1:500), and goat anti-platelet-derived growth factor receptor alpha (PDGFR-α) (Neuromics, Catalog #GT15150, 1:500). Six 20× fields of view were obtained from both hemispheres in the frontal cortex as above using maximum intensity projections of optical slices through the frontal cortex. Myelination index was generated by thresholding MBP-stained images and measuring the average mean intensity within the 20× field of view. Image intensity and cell count analysis was performed using Fiji (63).
miR-142-3p expression in primary rat oligodendrocytes
Primary rat oligodendrocytes were isolated using established methodology (43). Briefly, rat oligodendrocyte precursors were maintained in high-glucose Dulbecco's Modified Eagle Medium (DMEM) culture medium (4 mm l-glutamine, 1 mm sodium pyruvate, 01.% BSA, 50 μg/ml insulin, 30 mm sodium selenite, 10 nm d-biotin, and 10 nm hydrocortisone) containing basic Fibroblast Growth Factor (bFGF)/platelet-derived growth factor (PDGF) (10 ng/ml) for 3 days and were differentiated into mature oligodendrocytes by DMEM medium containing ciliary neurotrophic factor (CNTF) (10 ng/ml), T3 (15 mm), and NT3 (10 ng/ml) for 7 days. Mouse miR-142-3p, miR-23a, and negative control miR mimics (ThermoFisher) were transfected using RNAiMAX along with a fluorescent indicator and cultured for 48 h. RNA was isolated using Trizol, genomic DNA cleared using standard DNAase-treatment, and RNA utilized in qPCR analysis as above.
RNA sequencing and bioinformatics
RNA-sequencing was carried out using either the NuGEN RNA amplification with RiboZero treatment with 50 bp paired end reads (M dataset) or the Illumina TruSeq Stranded RNA library kit with RiboZero Gold treatment with 75 bp paired end reads (T dataset). The K dataset was prepared as described (49). We utilized Cuffdiff from the Cufflinks package for differential gene expression analysis (64) with the following modifications. Sequence reads were aligned to the mouse mm10 reference genome and RefSeq GTF using the Spliced Transcripts Alignment to a Reference (STAR) (65). Mapped reads were counted with HTSeq (66). Reads per kilobase million (RPKM) were calculated using a custom script in R based on the GenomicFeatures library (67) and rtracklayer library (67). The CummeRbund package was used to visualize gene expression. Oligodendrocyte TRAP RNA samples from different regions of the brain were derived from the same animal and pairwise comparisons were performed for analysis. Sequencing of frontal cortex from rTg4510 mice was compared with age-matched littermate controls. DEGs were identified using Cuffdiff and the bioconductor package CummeRbund was used to visualize gene expression. WGCNA was performed as described using version 1.66 of the R package (https://horvath.genetics.ucla.edu/html/CoexpressionNetwork/Rpackages/WGCNA/) (15). Any covariates that were present were accounted for using the empiricalBayesLM function prior to performing WGCNA. Modules were defined by a signed network approach with the following parameters (minimum module size = 100, power = 12, deepSplit = 4 and cutHeight = 0.995). The WGCNA module preservation function was used to calculate module preservation between datasets by applying 50 permutations (68). Data integration and statistical analysis were based on custom R scripts and are available upon request. Data were deposited in the Gene Expression Omnibus (GEO) repository (https://www.ncbi.nlm.nih.gov/geo/). Key modules were selected based on the degree of correlation between the module eigengene with the specified trait in the experimental samples relative to the controls and modules demonstrating significant correlation (P < 0.05) were selected for further analysis. Cell-type enrichment studies were performed using published data sets (48,69). Gene ontologies were determined using either the DAVID Bioinformatic resources (NIAID, NIH) (70) or GOrilla (71). Disease gene lists were compiled via phenotypic keyword search of the Online Mendelian Inheritance in Man (OMIM) database (http://www.omim.org). Genes with overlapping phenotypes were allowed to be represented on multiple lists. MicroRNA targets gene lists were generated from miRBase (72) and Target Scan (39) using the M4 and M8 gene lists as inputs and compared to nine additional modules of similar size that were not regionally specific.
Protein–protein network generation
Module genes were imported into Cytoscape software (73) and the STRING app (data version 11.0, app version 1.5.0) (74) was used to assess and visualize protein–protein interactions among module genes with the following setting (Species: Mus musculus; confidence (score) cutoff: 0.900; maximum additional interactors: none). Multiple testing correction was accounted for by the STRING software. Cytoscape’s NetworkAnalyzer was used to compute the topological parameters for undirected networks. Data were filtered by minimum degree cutoff of 20 for modules M8 versus T4 versus K42 versus K45 and minimum degree cutoff of 10 for modules M4 versus T20 versus T25 versus K31 for ease of visualization.
Statistical analysis
All differential gene expression and gene ontology analyses assumed a positive false discovery rate (q) of <0.05 to determine statistical significance. Statistical comparisons for enrichment were made using hypergeometric probability assuming P < 0.05 to determine statistical significance. Where appropriate, the significance of the P-values for overlaps involving multiple comparisons were confirmed by Bonferroni correction. ΔCt values from miR-142-3p qPCR results were compared using one-way ANOVA with Dunnett’s multiple comparisons test applied for region-specific comparisons. Statistical significance for myelin gene expression by qPCR in vitro was determined using 95% confidence interval testing. Oligodendrocyte cell counts and myelin index values were compared using Mann–Whitney testing assuming significance at P < 0.05. Comparisons of gene expression in single cell oligodendrocyte populations in the rTg4510 model were made using an unpaired t-test assuming significance at P < 0.05.
Data and Materials Availability
Reasonable requests for additional data not available in the Supplementary Materials will be honored. Gene expression data sets are available through Geo.
Author Contributions (CRediT format)
J.D.H.: conceptualization, data curation, formal analysis, funding acquisition, investigation, project administration, resources, supervision, visualization, writing – original draft.
K.N.: data curation, formal analysis, investigation, visualization, writing – review & editing.
D.K.: investigation.
C.C.: investigation, methodology.
C.R.A.: project administration, resources, supervision, writing – original draft.
M.G.: conceptualization, investigation, formal analysis, resources.
M.A.I.: investigation, formal analysis, resources.
S.K.: investigation, formal analysis.
R.K.: data curation, formal analysis, investigation, validation, writing – original draft.
G.C.: supervision.
K.G.: investigation, project administration, resources.
S.B.: funding acquisition, project administration, resources, supervision, writing – review & editing.
I.H.: investigation, resources.
K.K.: funding acquisition, resources, supervision.
B.L.F.: conceptualization, data curation, formal analysis, funding acquisition, investigation, project administration, resources, supervision, validation, visualization, writing – review & editing.
Supplementary Material
Acknowledgements
This work is dedicated to the inspiration of the late Dr George Bartzokis (1956–2014). Drs Hinman and Fogel contributed equally to the design, analysis and supervision of the work described in this manuscript.
Conflict of Interest statement. Authors declare no competing interests.
Funding
National Multiple Sclerosis Society (PP1892 to J.D.H.); the National Institute for Neurological Disorders and Stroke (R01 NS082094 to B.L.F.); the National Institute for Neurological Disorders and Stroke (K08 NS083740 to J.D.H.); the Deutsche Forschungsgemeinschaft (BE4443/4-1, BE4443/6-1, CRC1213 to S.B.); Landes-Offensive zur Entwicklung Wissenschaftlichökonomischer Exzellenz (to S.B.); the Universtätsklinikum Giessen Marburg, the University of Giessen Marburg Lung Center, the German Center for Lung Research (DZL to S.B.); COST (BM1201 to S.B.); the Program of Competitive Growth of Kazan Federal University (to S.B.). Additional support was provided by the United States Department of Veterans Affairs Greater Los Angeles Healthcare System and the UCLA Department of Neurology.
References
- 1.Marques, S., Zeisel, A., Codeluppi, S., van Bruggen, D., Mendanha Falcao, A., Xiao, L., Li, H., Haring, M., Hochgerner, H., Romanov, R.A.et al. (2016) Oligodendrocyte heterogeneity in the mouse juvenile and adult central nervous system. Science, 352, 1326–1329. [DOI] [PMC free article] [PubMed] [Google Scholar]
- 2.Funfschilling, U., Supplie, L.M., Mahad, D., Boretius, S., Saab, A.S., Edgar, J., Brinkmann, B.G., Kassmann, C.M., Tzvetanova, I.D., Mobius, W.et al. (2012) Glycolytic oligodendrocytes maintain myelin and long-term axonal integrity. Nature, 485, 517–521. [DOI] [PMC free article] [PubMed] [Google Scholar]
- 3.Saab, A.S., Tzvetanova, I.D. and Nave, K.A. (2013) The role of myelin and oligodendrocytes in axonal energy metabolism. Curr. Opin. Neurobiol., 23, 1065–1072. [DOI] [PubMed] [Google Scholar]
- 4.Tognatta, R. and Miller, R.H. (2016) Contribution of the oligodendrocyte lineage to CNS repair and neurodegenerative pathologies. Neuropharmacology, 110, 539–547. doi: 10.1016/j.neuropharm.2016.04.026. [DOI] [PMC free article] [PubMed] [Google Scholar]
- 5.Armstrong, R.C., Mierzwa, A.J., Sullivan, G.M. and Sanchez, M.A. (2016) Myelin and oligodendrocyte lineage cells in white matter pathology and plasticity after traumatic brain injury. Neuropharmacology, 110, 654–659. doi: 10.1016/j.neuropharm.2015.04.029. [DOI] [PubMed] [Google Scholar]
- 6.Nonneman, A., Robberecht, W. and Van Den Bosch, L. (2014) The role of oligodendroglial dysfunction in amyotrophic lateral sclerosis. Neurodegener Dis. Manag., 4, 223–239. [DOI] [PubMed] [Google Scholar]
- 7.Wenning, G.K., Stefanova, N., Jellinger, K.A., Poewe, W. and Schlossmacher, M.G. (2008) Multiple system atrophy: a primary oligodendrogliopathy. Ann. Neurol., 64, 239–246. [DOI] [PubMed] [Google Scholar]
- 8.Bartzokis, G. (2011) Alzheimer's disease as homeostatic responses to age-related myelin breakdown. Neurobiol. Aging, 32, 1341–1371. [DOI] [PMC free article] [PubMed] [Google Scholar]
- 9.Haroutunian, V., Katsel, P., Roussos, P., Davis, K.L., Altshuler, L.L. and Bartzokis, G. (2014) Myelination, oligodendrocytes, and serious mental illness. Glia, 62, 1856–1877. [DOI] [PubMed] [Google Scholar]
- 10.Hinman, J.D. and Abraham, C.R. (2007) What's behind the decline? The role of white matter in brain aging. Neurochem. Res., 32, 2023–2031. [DOI] [PubMed] [Google Scholar]
- 11.Ainger, K., Avossa, D., Morgan, F., Hill, S.J., Barry, C., Barbarese, E. and Carson, J.H. (1993) Transport and localization of exogenous myelin basic protein mRNA microinjected into oligodendrocytes. J. Cell Biol., 123, 431–441. [DOI] [PMC free article] [PubMed] [Google Scholar]
- 12.Trapp, B.D., Moench, T., Pulley, M., Barbosa, E., Tennekoon, G. and Griffin, J. (1987) Spatial segregation of mRNA encoding myelin-specific proteins. Proc. Natl. Acad. Sci. USA, 84, 7773–7777. [DOI] [PMC free article] [PubMed] [Google Scholar]
- 13.Heiman, M., Schaefer, A., Gong, S., Peterson, J.D., Day, M., Ramsey, K.E., Suarez-Farinas, M., Schwarz, C., Stephan, D.A., Surmeier, D.J.et al. (2008) A translational profiling approach for the molecular characterization of CNS cell types. Cell, 135, 738–748. [DOI] [PMC free article] [PubMed] [Google Scholar]
- 14.Doyle, J.P., Dougherty, J.D., Heiman, M., Schmidt, E.F., Stevens, T.R., Ma, G., Bupp, S., Shrestha, P., Shah, R.D., Doughty, M.L.et al. (2008) Application of a translational profiling approach for the comparative analysis of CNS cell types. Cell, 135, 749–762. [DOI] [PMC free article] [PubMed] [Google Scholar]
- 15.Langfelder, P. and Horvath, S. (2008) WGCNA: an R package for weighted correlation network analysis. BMC Bioinformatics, 9, 559. [DOI] [PMC free article] [PubMed] [Google Scholar]
- 16.Alzheimer's Association . (2020) 2020 Alzheimer's disease facts and figures. Alzheimer's Dement., 16, 391–460. 10.1002/alz.12068. [DOI] [Google Scholar]
- 17.Nasrabady, S.E., Rizvi, B., Goldman, J.E. and Brickman, A.M. (2018) White matter changes in Alzheimer's disease: a focus on myelin and oligodendrocytes. Acta Neuropathol. Commun., 6, 22. [DOI] [PMC free article] [PubMed] [Google Scholar]
- 18.Dean, D.C., 3rd, Hurley, S.A., Kecskemeti, S.R., O'Grady, J.P., Canda, C., Davenport-Sis, N.J., Carlsson, C.M., Zetterberg, H., Blennow, K., Asthana, S.et al. (2017) Association of amyloid pathology with myelin alteration in preclinical Alzheimer disease. JAMA Neurol., 74, 41–49. [DOI] [PMC free article] [PubMed] [Google Scholar]
- 19.Allen, M., Wang, X., Burgess, J.D., Watzlawik, J., Serie, D.J., Younkin, C.S., Nguyen, T., Malphrus, K.G., Lincoln, S., Carrasquillo, M.M.et al. (2018) Conserved brain myelination networks are altered in Alzheimer's and other neurodegenerative diseases. Alzheimers Dement., 14, 352–366. [DOI] [PMC free article] [PubMed] [Google Scholar]
- 20.Steadman, P.E., Xia, F., Ahmed, M., Mocle, A.J., Penning, A.R.A., Geraghty, A.C., Steenland, H.W., Monje, M., Josselyn, S.A. and Frankland, P.W. (2020) Disruption of oligodendrogenesis impairs memory consolidation in adult mice. Neuron, 105, 150–164. doi: 10.1016/j.neuron.2019.10.013. [DOI] [PMC free article] [PubMed] [Google Scholar]
- 21.Pan, S., Mayoral, S.R., Choi, H.S., Chan, J.R. and Kheirbek, M.A. (2020) Preservation of a remote fear memory requires new myelin formation. Nat. Neurosci., 23, 487–499. doi: 10.1038/s41593-019-0582-1. [DOI] [PMC free article] [PubMed] [Google Scholar]
- 22.Wang, F., Ren, S.Y., Chen, J.F., Liu, K., Li, R.X., Li, Z.F., Hu, B., Niu, J.Q., Xiao, L., Chan, J.R.et al. (2020) Myelin degeneration and diminished myelin renewal contribute to age-related deficits in memory. Nat. Neurosci., 23, 481–486. doi: 10.1038/s41593-020-0588-8. [DOI] [PMC free article] [PubMed] [Google Scholar]
- 23.Lee, Y., Morrison, B.M., Li, Y., Lengacher, S., Farah, M.H., Hoffman, P.N., Liu, Y., Tsingalia, A., Jin, L., Zhang, P.W.et al. (2012) Oligodendroglia metabolically support axons and contribute to neurodegeneration. Nature, 487, 443–448. [DOI] [PMC free article] [PubMed] [Google Scholar]
- 24.Higuchi, M., Zhang, B., Forman, M.S., Yoshiyama, Y., Trojanowski, J.Q. and Lee, V.M. (2005) Axonal degeneration induced by targeted expression of mutant human tau in oligodendrocytes of transgenic mice that model glial tauopathies. J. Neurosci., 25, 9434–9443. [DOI] [PMC free article] [PubMed] [Google Scholar]
- 25.Kang, S.H., Li, Y., Fukaya, M., Lorenzini, I., Cleveland, D.W., Ostrow, L.W., Rothstein, J.D. and Bergles, D.E. (2013) Degeneration and impaired regeneration of gray matter oligodendrocytes in amyotrophic lateral sclerosis. Nat. Neurosci., 16, 571–579. [DOI] [PMC free article] [PubMed] [Google Scholar]
- 26.Bartzokis, G., Lu, P.H. and Mintz, J. (2007) Human brain myelination and amyloid beta deposition in Alzheimer's disease. Alzheimers Dement., 3, 122–125. [DOI] [PMC free article] [PubMed] [Google Scholar]
- 27.Bartzokis, G., Lu, P.H., Geschwind, D.H., Edwards, N., Mintz, J. and Cummings, J.L. (2006) Apolipoprotein E genotype and age-related myelin breakdown in healthy individuals: implications for cognitive decline and dementia. Arch. Gen. Psychiatry, 63, 63–72. [DOI] [PubMed] [Google Scholar]
- 28.McKenzie, A.T., Moyon, S., Wang, M., Katsyv, I., Song, W.M., Zhou, X., Dammer, E.B., Duong, D.M., Aaker, J., Zhao, Y.et al. (2017) Multiscale network modeling of oligodendrocytes reveals molecular components of myelin dysregulation in Alzheimer's disease. Mol. Neurodegener., 12, 82. [DOI] [PMC free article] [PubMed] [Google Scholar]
- 29.Pasterkamp, R.J., Dai, H.N., Terman, J.R., Wahlin, K.J., Kim, B., Bregman, B.S., Popovich, P.G. and Kolodkin, A.L. (2006) MICAL flavoprotein monooxygenases: expression during neural development and following spinal cord injuries in the rat. Mol. Cell. Neurosci., 31, 52–69. [DOI] [PubMed] [Google Scholar]
- 30.Lu, Q.R., Cai, L., Rowitch, D., Cepko, C.L. and Stiles, C.D. (2001) Ectopic expression of Olig1 promotes oligodendrocyte formation and reduces neuronal survival in developing mouse cortex. Nat. Neurosci., 4, 973–974. [DOI] [PubMed] [Google Scholar]
- 31.Gao, Y.L., Wang, N., Sun, F.R., Cao, X.P., Zhang, W. and Yu, J.T. (2018) Tau in neurodegenerative disease. Ann Transl Med, 6, 175. [DOI] [PMC free article] [PubMed] [Google Scholar]
- 32.Seiberlich, V., Bauer, N.G., Schwarz, L., Ffrench-Constant, C., Goldbaum, O. and Richter-Landsberg, C. (2015) Downregulation of the microtubule associated protein tau impairs process outgrowth and myelin basic protein mRNA transport in oligodendrocytes. Glia, 63, 1621–1635. [DOI] [PubMed] [Google Scholar]
- 33.Klein, C., Kramer, E.M., Cardine, A.M., Schraven, B., Brandt, R. and Trotter, J. (2002) Process outgrowth of oligodendrocytes is promoted by interaction of fyn kinase with the cytoskeletal protein tau. J. Neurosci., 22, 698–707. [DOI] [PMC free article] [PubMed] [Google Scholar]
- 34.Carlo, A.S. (2013) Sortilin, a novel APOE receptor implicated in Alzheimer disease. Prion, 7, 378–382. [DOI] [PMC free article] [PubMed] [Google Scholar]
- 35.Sampaio-Baptista, C. and Johansen-Berg, H. (2017) White matter plasticity in the adult brain. Neuron, 96, 1239–1251. [DOI] [PMC free article] [PubMed] [Google Scholar]
- 36.Dugas, J.C., Cuellar, T.L., Scholze, A., Ason, B., Ibrahim, A., Emery, B., Zamanian, J.L., Foo, L.C., McManus, M.T. and Barres, B.A. (2010) Dicer1 and miR-219 are required for normal oligodendrocyte differentiation and myelination. Neuron, 65, 597–611. [DOI] [PMC free article] [PubMed] [Google Scholar]
- 37.Lau, P., Verrier, J.D., Nielsen, J.A., Johnson, K.R., Notterpek, L. and Hudson, L.D. (2008) Identification of dynamically regulated microRNA and mRNA networks in developing oligodendrocytes. J. Neurosci., 28, 11720–11730. [DOI] [PMC free article] [PubMed] [Google Scholar]
- 38.Lin, S.T., Huang, Y., Zhang, L., Heng, M.Y., Ptacek, L.J. and Fu, Y.H. (2013) MicroRNA-23a promotes myelination in the central nervous system. Proc. Natl. Acad. Sci. USA, 110, 17468–17473. [DOI] [PMC free article] [PubMed] [Google Scholar]
- 39.Agarwal, V., Bell, G.W., Nam, J.W. and Bartel, D.P. (2015) Predicting effective microRNA target sites in mammalian mRNAs. Elife, 4, e05005. doi: 10.7554/eLife.05005. [DOI] [PMC free article] [PubMed] [Google Scholar]
- 40.Carraro, G., Shrestha, A., Rostkovius, J., Contreras, A., Chao, C.M., El Agha, E., Mackenzie, B., Dilai, S., Guidolin, D., Taketo, M.M.et al. (2014) miR-142-3p balances proliferation and differentiation of mesenchymal cells during lung development. Development, 141, 1272–1281. [DOI] [PMC free article] [PubMed] [Google Scholar]
- 41.Schwickert, A., Weghake, E., Bruggemann, K., Engbers, A., Brinkmann, B.F., Kemper, B., Seggewiss, J., Stock, C., Ebnet, K., Kiesel, L.et al. (2015) microRNA miR-142-3p inhibits breast cancer cell invasiveness by synchronous targeting of WASL, integrin alpha V, and additional cytoskeletal elements. PLoS One, 10, e0143993. [DOI] [PMC free article] [PubMed] [Google Scholar]
- 42.Jovicic, A., Roshan, R., Moisoi, N., Pradervand, S., Moser, R., Pillai, B. and Luthi-Carter, R. (2013) Comprehensive expression analyses of neural cell-type-specific miRNAs identify new determinants of the specification and maintenance of neuronal phenotypes. J. Neurosci., 33, 5127–5137. [DOI] [PMC free article] [PubMed] [Google Scholar]
- 43.Chen, C.D., Sloane, J.A., Li, H., Aytan, N., Giannaris, E.L., Zeldich, E., Hinman, J.D., Dedeoglu, A., Rosene, D.L., Bansal, R.et al. (2013) The antiaging protein Klotho enhances oligodendrocyte maturation and myelination of the CNS. J. Neurosci., 33, 1927–1939. [DOI] [PMC free article] [PubMed] [Google Scholar]
- 44.Shrestha, A., Carraro, G., El Agha, E., Mukhametshina, R., Chao, C.M., Rizvanov, A., Barreto, G. and Bellusci, S. (2015) Generation and validation of miR-142 knock out mice. PLoS One, 10, e0136913. [DOI] [PMC free article] [PubMed] [Google Scholar]
- 45.Santacruz, K., Lewis, J., Spires, T., Paulson, J., Kotilinek, L., Ingelsson, M., Guimaraes, A., DeTure, M., Ramsden, M., McGowan, E.et al. (2005) Tau suppression in a neurodegenerative mouse model improves memory function. Science, 309, 476–481. [DOI] [PMC free article] [PubMed] [Google Scholar]
- 46.Gamache, J., Benzow, K., Forster, C., Kemper, L., Hlynialuk, C., Furrow, E., Ashe, K.H. and Koob, M.D. (2019) Factors other than hTau overexpression that contribute to tauopathy-like phenotype in rTg4510 mice. Nat. Commun., 10, 2479. [DOI] [PMC free article] [PubMed] [Google Scholar]
- 47.Ramsden, M., Kotilinek, L., Forster, C., Paulson, J., McGowan, E., SantaCruz, K., Guimaraes, A., Yue, M., Lewis, J., Carlson, G.et al. (2005) Age-dependent neurofibrillary tangle formation, neuron loss, and memory impairment in a mouse model of human tauopathy (P301L). J. Neurosci., 25, 10637–10647. [DOI] [PMC free article] [PubMed] [Google Scholar]
- 48.Zhang, Y., Chen, K., Sloan, S.A., Bennett, M.L., Scholze, A.R., O'Keeffe, S., Phatnani, H.P., Guarnieri, P., Caneda, C., Ruderisch, N.et al. (2014) An RNA-sequencing transcriptome and splicing database of glia, neurons, and vascular cells of the cerebral cortex. J. Neurosci., 34, 11929–11947. [DOI] [PMC free article] [PubMed] [Google Scholar]
- 49.Ghanbari, M., Munshi, S.T., Ma, B., Lendemeijer, B., Bansal, S., Adams, H.H., Wang, W., Goth, K., Slump, D.E., van den Hout, M.et al. (2019) A functional variant in the miR-142 promoter modulating its expression and conferring risk of Alzheimer disease. Hum. Mutat., 40, 2131–2145. [DOI] [PubMed] [Google Scholar]
- 50.Josephs, K.A., Dickson, D.W., Tosakulwong, N., Weigand, S.D., Murray, M.E., Petrucelli, L., Liesinger, A.M., Senjem, M.L., Spychalla, A.J., Knopman, D.S.et al. (2017) Rates of hippocampal atrophy and presence of post-mortem TDP-43 in patients with Alzheimer's disease: a longitudinal retrospective study. Lancet Neurol., 16, 917–924. [DOI] [PMC free article] [PubMed] [Google Scholar]
- 51.Nussbacher, J.K., Tabet, R., Yeo, G.W. and Lagier-Tourenne, C. (2019) Disruption of RNA metabolism in neurological diseases and emerging therapeutic interventions. Neuron, 102, 294–320. [DOI] [PMC free article] [PubMed] [Google Scholar]
- 52.Glass, C.K., Saijo, K., Winner, B., Marchetto, M.C. and Gage, F.H. (2010) Mechanisms underlying inflammation in neurodegeneration. Cell, 140, 918–934. [DOI] [PMC free article] [PubMed] [Google Scholar]
- 53.Ludvigson, A.E., Luebke, J.I., Lewis, J. and Peters, A. (2011) Structural abnormalities in the cortex of the rTg4510 mouse model of tauopathy: a light and electron microscopy study. Brain Struct. Funct., 216, 31–42. [DOI] [PMC free article] [PubMed] [Google Scholar]
- 54.Sahara, N., Perez, P.D., Lin, W.L., Dickson, D.W., Ren, Y., Zeng, H., Lewis, J. and Febo, M. (2014) Age-related decline in white matter integrity in a mouse model of tauopathy: an in vivo diffusion tensor magnetic resonance imaging study. Neurobiol. Aging, 35, 1364–1374. [DOI] [PMC free article] [PubMed] [Google Scholar]
- 55.Wells, J.A., O'Callaghan, J.M., Holmes, H.E., Powell, N.M., Johnson, R.A., Siow, B., Torrealdea, F., Ismail, O., Walker-Samuel, S., Golay, X.et al. (2015) In vivo imaging of tau pathology using multi-parametric quantitative MRI. NeuroImage, 111, 369–378. [DOI] [PMC free article] [PubMed] [Google Scholar]
- 56.Cai, Z. and Xiao, M. (2016) Oligodendrocytes and Alzheimer's disease. Int. J. Neurosci., 126, 97–104. [DOI] [PubMed] [Google Scholar]
- 57.Shrestha, A., Mukhametshina, R.T., Taghizadeh, S., Vasquez-Pacheco, E., Cabrera-Fuentes, H., Rizvanov, A., Mari, B., Carraro, G. and Bellusci, S. (2017) MicroRNA-142 is a multifaceted regulator in organogenesis, homeostasis and disease. Dev Dyn, 246, 285–290. [DOI] [PubMed] [Google Scholar]
- 58.Isobe, T., Hisamori, S., Hogan, D.J., Zabala, M., Hendrickson, D.G., Dalerba, P., Cai, S., Scheeren, F., Kuo, A.H., Sikandar, S.S.et al. (2014) miR-142 regulates the tumorigenicity of human breast cancer stem cells through the canonical WNT signaling pathway. Elife, 3, e01977. doi: 10.7554/eLife.01977. [DOI] [PMC free article] [PubMed] [Google Scholar]
- 59.Hinman, J.D., Chen, C.D., Oh, S.Y., Hollander, W. and Abraham, C.R. (2008) Age-dependent accumulation of ubiquitinated 2′,3′-cyclic nucleotide 3′-phosphodiesterase in myelin lipid rafts. Glia, 56, 118–133. [DOI] [PubMed] [Google Scholar]
- 60.Gibson, E.M., Purger, D., Mount, C.W., Goldstein, A.K., Lin, G.L., Wood, L.S., Inema, I., Miller, S.E., Bieri, G., Zuchero, J.B.et al. (2014) Neuronal activity promotes oligodendrogenesis and adaptive myelination in the mammalian brain. Science, 344, 1252304. [DOI] [PMC free article] [PubMed] [Google Scholar]
- 61.Busk, P.K. (2014) A tool for design of primers for microRNA-specific quantitative RT-qPCR. BMC Bioinformatics, 15, 29. [DOI] [PMC free article] [PubMed] [Google Scholar]
- 62.Hinman, J.D., Rasband, M.N. and Carmichael, S.T. (2013) Remodeling of the axon initial segment after focal cortical and white matter stroke. Stroke, 44, 182–189. [DOI] [PMC free article] [PubMed] [Google Scholar]
- 63.Schindelin, J., Arganda-Carreras, I., Frise, E., Kaynig, V., Longair, M., Pietzsch, T., Preibisch, S., Rueden, C., Saalfeld, S., Schmid, B.et al. (2012) Fiji: an open-source platform for biological-image analysis. Nat. Methods, 9, 676–682. [DOI] [PMC free article] [PubMed] [Google Scholar]
- 64.Trapnell, C., Roberts, A., Goff, L., Pertea, G., Kim, D., Kelley, D.R., Pimentel, H., Salzberg, S.L., Rinn, J.L. and Pachter, L. (2012) Differential gene and transcript expression analysis of RNA-seq experiments with TopHat and Cufflinks. Nat. Protoc., 7, 562–578. [DOI] [PMC free article] [PubMed] [Google Scholar]
- 65.Dobin, A., Davis, C.A., Schlesinger, F., Drenkow, J., Zaleski, C., Jha, S., Batut, P., Chaisson, M. and Gingeras, T.R. (2013) STAR: ultrafast universal RNA-seq aligner. Bioinformatics, 29, 15–21. [DOI] [PMC free article] [PubMed] [Google Scholar]
- 66.Anders, S., Pyl, P.T. and Huber, W. (2015) HTSeq—a Python framework to work with high-throughput sequencing data. Bioinformatics, 31, 166–169. [DOI] [PMC free article] [PubMed] [Google Scholar]
- 67.Lawrence, M., Huber, W., Pages, H., Aboyoun, P., Carlson, M., Gentleman, R., Morgan, M.T. and Carey, V.J. (2013) Software for computing and annotating genomic ranges. PLoS Comput. Biol., 9, e1003118. [DOI] [PMC free article] [PubMed] [Google Scholar]
- 68.Langfelder, P., Luo, R., Oldham, M.C. and Horvath, S. (2011) Is my network module preserved and reproducible? PLoS Comput. Biol., 7, e1001057. [DOI] [PMC free article] [PubMed] [Google Scholar]
- 69.Sharma, K., Schmitt, S., Bergner, C.G., Tyanova, S., Kannaiyan, N., Manrique-Hoyos, N., Kongi, K., Cantuti, L., Hanisch, U.K., Philips, M.A.et al. (2015) Cell type- and brain region-resolved mouse brain proteome. Nat. Neurosci., 18, 1819–1831. [DOI] [PMC free article] [PubMed] [Google Scholar]
- 70.Huang da, W., Sherman, B.T. and Lempicki, R.A. (2009) Systematic and integrative analysis of large gene lists using DAVID bioinformatics resources. Nat. Protoc., 4, 44–57. [DOI] [PubMed] [Google Scholar]
- 71.Eden, E., Navon, R., Steinfeld, I., Lipson, D. and Yakhini, Z. (2009) GOrilla: a tool for discovery and visualization of enriched GO terms in ranked gene lists. BMC Bioinformatics, 10, 48. [DOI] [PMC free article] [PubMed] [Google Scholar]
- 72.Ambros, V., Bartel, B., Bartel, D.P., Burge, C.B., Carrington, J.C., Chen, X., Dreyfuss, G., Eddy, S.R., Griffiths-Jones, S., Marshall, M.et al. (2003) A uniform system for microRNA annotation. RNA, 9, 277–279. [DOI] [PMC free article] [PubMed] [Google Scholar]
- 73.Saito, R., Smoot, M.E., Ono, K., Ruscheinski, J., Wang, P.L., Lotia, S., Pico, A.R., Bader, G.D. and Ideker, T. (2012) A travel guide to Cytoscape plugins. Nat. Methods, 9, 1069–1076. [DOI] [PMC free article] [PubMed] [Google Scholar]
- 74.Szklarczyk, D., Morris, J.H., Cook, H., Kuhn, M., Wyder, S., Simonovic, M., Santos, A., Doncheva, N.T., Roth, A., Bork, P.et al. (2017) The STRING database in 2017: quality-controlled protein-protein association networks, made broadly accessible. Nucleic Acids Res., 45, D362–D368. [DOI] [PMC free article] [PubMed] [Google Scholar]
Associated Data
This section collects any data citations, data availability statements, or supplementary materials included in this article.