

Abstract
Objective
Prenatal metabolomics profiles, providing measures of in utero nutritional and environmental exposures, may improve the prediction of childhood outcomes. We aimed to identify prenatal plasma metabolites associated with early childhood body mass index (BMI) trajectories and overweight/obesity risk in offspring.
Methods
This study included 450 African American mother-child pairs from the Conditions Affecting Neurocognitive Development and Learning in Early Childhood Study. An untargeted metabolomics analysis was performed on the mothers’ plasma samples collected during the second trimester. The children’s BMI-z-score trajectories from birth to age 4 [rising-high- (9.8%), moderate- (68.2%), and low-BMI (22.0%)] and overweight/obesity status at age 4 were the main outcomes. The least absolute shrinkage and selection operator (LASSO) was used to select the prenatal metabolites associated with childhood outcomes.
Results
The mothers were 24.5 years old on average at recruitment, 76.4% having education less than 12 years and 80.0% with Medicaid or Medicare. In LASSO, seven and five prenatal metabolites were associated with the BMI-z-score trajectories and overweight/obese at age 4, respectively. These metabolites are mainly from/relevant to the pathways of steroid biosynthesis, amino acid metabolism, vitamin B complex, and xenobiotics metabolism (e.g., caffeine and nicotine). The odds ratios (95% CI) associated with a one SD increase in the prenatal metabolite risk scores (MRSs) constructed from the LASSO-selected metabolites were 2.97 (1.95–4.54) and 2.03 (1.54–2.67) for children being in the rising-high-BMI trajectory group and overweight/obesity at age 4, respectively. The MRSs significantly improved the risk prediction for childhood outcomes beyond traditional prenatal risk factors. The increase (95% CI) in the area under the receiver operating characteristic curves were 0.10 (0.03–0.18) and 0.07 (0.02–0.12) for the rising-high-BMI trajectory (P=0.005) and overweight/obesity at age 4 (P=0.007), respectively.
Conclusions
Prenatal metabolomics profiles advanced prediction of early childhood growth trajectories and obesity risk in offspring.
Keywords: childhood obesity, growth trajectory, maternal exposure, metabolomics, pregnancy
Introduction
Childhood obesity is still one of the most serious public health challenges in the US. According to the latest data of CDC, one third of children and adolescents aged 2–19 years had obesity (18.5%) or overweight (16.6%) in 2015–2016 (1). Childhood obesity is linked with a wide range of serious consequences, such as adult obesity, type 2 diabetes, and cardiovascular disease. The impact extends to increased costs throughout the health care system (2–4). Identification of early risk factors for childhood obesity would lead to interventions to prevent or delay the onset of cardiometabolic chronic diseases later in life and reduce their economic impact on the healthcare system.
According to the Developmental Origins of Health and Disease hypothesis, the intrauterine environment impacts fetal development in ways that could have irreversible and lifelong consequences (5). Indeed, prenatal risk factors reflecting maternal metabolism (6–10), maternal diet (11, 12), or exposure to environmental toxins or endocrine-disrupting chemical exposures (13–16), have been associated with an increased risk for childhood obesity. These findings strongly support that investigating in utero exposure is important for identifying early risk factors for the development of obesity.
The emerging metabolomics technology, which can systematically profile small molecules in biofluids, cells, and tissues, has been applied in the research of perinatal health (17), such as gestational diabetes (18), fetal growth restriction (19, 20), and preterm birth (21). These studies demonstrate that prenatal metabolomics changes are underlying the pathogenesis of maternal complications during pregnancy and fetal intrauterine development. Since perinatal conditions have long-term effects on children’s health, changes in prenatal metabolomics profiles may also underlie the developmental origin of health conditions in offspring. However, to the best of our knowledge, no metabolomics studies have been conducted to investigate prenatal circulating metabolomics profiles associated with childhood weight gain and obesity risk. Therefore, this study aimed to conduct comprehensive metabolomics profiling among pregnant women and examine their associations with children’s growth trajectories and obesity risk using a contemporary birth cohort of the US.
Methods
Study Cohort
Study subjects were drawn from the Conditions Affecting Neurocognitive Development and Learning in Early Childhood (CANDLE) study, a prospective birth cohort of mother-child dyads in Shelby County, Tennessee, which is a major part of the Memphis metropolitan area (6, 11, 22). The CANDLE study enrolled a total of 1 503 women aged 16–40 years during their 2nd trimester of pregnancy resulting in 1 455 live births. The sample accrued between 2006 and 2011, demographically representing Shelby County, a highly disadvantaged urban population. The study participants are primarily African Americans (AA) (65.5%) and European Americans (32.4%). In this study, we included 450 randomly selected AA mother-child pairs from the CANDLE study (Supplemental Figure 1). The characteristics of this sample were similar with all the AA mothers and children in the CANDLE study (Supplemental Table 1). The CANDLE study was conducted in accordance with the Helsinki Declaration and approved by the Institutional Review Board of The University of Tennessee Health Science Center. Informed consent was given by participants 18 years or older, while assent was given by those less than 18 years and consent provided by their legally authorized representative prior to enrollment.
Maternal Measures and Metabolomics Analysis
Self-administered questionnaires were used to collect sociodemographic information (age, race/ethnicity, education, insurance type, and marital status), lifestyle (cigarette smoking and alcohol use during pregnancy), parity, and medical history at enrollment. Self-reported height and weight prior to pregnancy were collected at enrollment and used to calculate pre-pregnancy BMI as weight (in kilograms) divided by the square of height (in meters).
The nonfasting maternal plasma samples collected in the second trimester (at recruitment) and stored at −80°C were used to conduct prenatal metabolomics profiling. The untargeted metabolomics analysis was performed using the Metabolon Discovery HD4™ Platform (Metabolon Inc., Morrisville, NC), which includes four ultra-high-performance liquid chromatography-mass spectrometry methods (Supplementary Materials). A total of 949 metabolites with known structural identity (named biochemicals) were identified in the study samples. After excluding 69 metabolites with missing/below-the-detection-limit > 80% of the samples, 880 metabolites were included in the present study.
Child Measures
Birth weight and length of the children were extracted from medical charts by research assistants (23). The body weight and length/height were also measured at each annual visit until 4 years old using the methods guided by the NHANES protocol (24). The sex- and age-specific BMI-z-score for each child were calculated based on the World Health Organization growth standards (< 2 years) and the Center for Disease Control and Prevention (CDC) growth charts (≥ 2 years) as recommended by CDC (25). In addition, a 24-hour dietary recall of the child including food and beverage consumed was administered at 2, 2.5, and 3 years, respectively. All the 24-hour dietary recall data have been processed using Nutrition Data System for Research software (http://www.ncc.umn.edu/products/) to yield energy, macro, and micronutrient intakes. At the 4-year visit, the frequency of engaging in vigorous physical activity per week was also asked and collected.
Childhood Outcomes
Childhood growth trajectories have been demonstrated to be more predictive for obesity risk later in life than a single growth measurement. An early childhood high-BMI or rapid BMI gain trajectories are associated with a higher risk of obesity later in life (26). In this study, both BMI trajectories and overweight and obesity status at age 4 were the early childhood outcomes of interest. 1) Three BMI-z-score trajectories (rising-high-, moderate-, and low-BMI) among the 450 children were identified using the latent class growth modeling approach (Figure 1) (27). The rising-high-BMI trajectory was considered as the risk trajectory for obesity later in life and selected as the main trajectory outcome. 2) Childhood overweight and obesity at age 4 were defined according to CDC criteria (28). Overweight was defined as a BMI at or above the 85th percentile and below the 95th percentile for children of the same age and sex. Obesity was defined as a BMI at or above the 95th percentile for children of the same age and sex.
Figure 1.

BMI-z-score trajectories of the studied children.
Statistical Analysis
We imputed the missing values for the metabolites with missing rates < 50% using the K-nearest neighbor imputation method implemented in the R package “impute”. After imputation, the values were natural log-transformed, followed by median normalization and auto-scaling. For metabolites with missing rates between 50% and 80%, the abundance of metabolites was recoded as the following: missing values were coded as 0; values below the median of the non-missing values were coded as 1; and values above the median of the non-missing values were coded as 2.
The partial least-squares discriminant analysis (PLS-DA) method was used to examine whether prenatal metabolomics profiles could distinguish children’s BMI-z-score trajectory groups and overweight/obesity status at age 4. PLS-DA is a classification method based on PLS regression (29). A permutation test was used to examine whether differences found between groups were significant (30). In the permutation test, the outcome groups were permuted and randomly assigned 1000 times. For each permutated dataset, a sum of squares between/sum of squares within (B/W) ratio from the PLS-DA model was calculated for the class assignment predictions. A p value is calculated as the proportion of the times that class separation based on randomly assigned sample is at least as good as the one based on the original data. The least absolute shrinkage and selection operator (LASSO) regression implemented in the R package “glmnet” was used to select the most predictive metabolites in association with childhood outcomes of interest (31). In LASSO, a penalization parameter λ is added to the least-squares criterion, resulting in that the most predictive variables are selected into the model and the coefficients of the remaining variables are shrunk to zero. In our analysis, a 10-fold cross-validation approach was used to determine the parameter λ that gave the minimum mean error. We fit LASSO with the 880 metabolites and traditional prenatal risk factors for childhood obesity, including maternal age at pregnancy, pre-pregnancy BMI, parity, education levels, insurance types, alcohol drinking, and smoking during pregnancy. Gestational diabetes, gestational weight gain, birth weight, or gestational age at birth were not included in the LASSO model because these variables might be on the same pathways as the prenatal metabolites and mediate their effects on childhood outcomes. The associations between the final LASSO-selected maternal metabolites and these four potential mediators were examined.
A metabolite risk score (MRS) was constructed using the sum of selected metabolite levels weighted by the effect sizes from the LASSO model. Logistic regression models were used to examine the association between the prenatal MRS and childhood outcomes of interest with the adjustment for the traditional prenatal risk factors. Considering childhood nutrition and physical activities might also be confounding factors but had less complete data (69.3% having both variables), we did a sensitivity analysis to further adjust for the mean total energy intake of 2–3 years and weekly frequency of vigorous physical activity at age 4 in the logistic regression models. The area under the receiver operating characteristic (ROC) curve (AUC) was used to examine whether the MRS improved the risk prediction of the studied childhood outcomes beyond traditional prenatal risk factors.
Results
Table 1 shows the characteristics of the CANDLE mothers and children included in this study. The average (SD) age of the mothers at recruitment was 24.5 (5.1) years, with relatively low education (76.4% of ≤ 12 years of education) and a high rate of being covered by Medicaid or Medicare (80.0%). Nearly 60% of the mothers were overweight (24.2%) or obese (33.6%) before pregnancy. Almost 30% of the children were overweight (13.1%) or obese (15.5%) at 4 years old.
Table 1.
Characteristics of the CANDLE mothers and children
| Variables | Mean (SD) or percentage (N=450) |
|---|---|
| Mothers | |
| Age, years | 24.5 (5.1) |
| Education (≤ 12 years), % | 76.4 |
| Insurance (Medicaid or Medicare), % | 80.0 |
| Smoking during pregnancy, % | 9.1 |
| Alcohol drinking during pregnancy, % | 5.8 |
| Parity (primiparous), % | 27.1 |
| Pre-pregnancy BMI, kg/m2 | 28.3 (8.3) |
| Pre-pregnancy overweight, % | 24.2 |
| Pre-pregnancy obesity, % | 33.6 |
| Gestational weight gain, kg | 14.4 (8.3) |
| Gestational diabetes mellitus, % | 4.5 |
| Children | |
| Male, % | 51.8 |
| Gestational age at birth, weeks | 38.5 (2.3) |
| Birth weight, kg | 3.1 (0.6) |
| BMI-z-score at birth | −0.7 (1.4) |
| BMI-z-score at age 1 | 0.7 (1.2) |
| BMI-z-score at age 2 | 0.2 (1.2) |
| BMI-z-score at age 3 | 0.3 (1.3) |
| BMI-z-score at age 4 | 0.5 (1.2) |
| Overweight at age 4, % | 13.1 |
| Obesity at age 4, % | 15.5 |
BMI, body mass index; SD, standard deviation.
Prenatal Metabolic Profiles and Childhood Outcomes
Using the PLS-DA method, we found that the overall prenatal metabolomics profiles could significantly separate the children in the different BMI-z-score trajectories (P for imputation = 0.017). Although the PLS-DA model was not statistically significant for the BMI groups (normal/overweight/obese groups) at age 4 (P for imputation = 0.267), we still saw a trend for separation, suggesting the difference in metabolomics profiles among the three groups (Figure 2).
Figure 2.

The classification of the childhood growth trajectory groups and weight groups at age 4 using PLS-DA. PLS-DA, partial least-squares discriminant analysis. a. PLS-DA analysis for BMI-z-score trajectories groups; b. PLS-DA analysis for weight groups.
LASSO-selected Prenatal Metabolites Associated with Childhood Outcomes
The LASSO method selected seven and five metabolites associated with the BMI-z-score trajectories and overweight/obesity at age 4, respectively (Table 2). The metabolite β-sitosterol was negatively associated with both the rising-high-BMI trajectory and overweight/obesity risk at age 4. Most of the metabolites are involved in/relevant to the pathways of lipid and amino acid metabolism. Interestingly, three of the identified metabolites are related to xanthines (5-acetylamino-6-amino-3-methyluracil, 1,3-dimethyluric acid, and 1-methyluric acid), and one derives from nicotine metabolism (hydroxycotinine). Most of the outcome-related metabolites showed very low or no correlations with each other (Supplemental Figure 2) and were not associated with gestational diabetes, gestational weight gain, gestational birth weight, or gestational age at birth (Supplemental Table 2).
Table 2.
Childhood outcome-associated metabolites selected by LASSO
| Metabolite | Class | Pathwaysa | β/ORb |
|---|---|---|---|
| Rising-high-BMI trajectory | |||
| β-Sitosterol | Lipid | Steroid biosynthesis | −0.194/0.824 |
| Methylmalonic acid | Organic acid | Branch-chain amino acid, pyrimidine, and propanoate metabolism | −0.005/0.996 |
| Hydroxyasparagine | Amino acid | Alanine and aspartate metabolism | 0.143/1.153 |
| Hydroxyproline | Amino acid | Arginine and proline metabolism | 0.052/1.054 |
| 5-Acetylamino-6-amino-3-methyluracil | Xenobiotics | Xanthine metabolism | 0.069/1.072 |
| Hydroxycotinine | Xenobiotics | Tobacco metabolite | 0.068/1.071 |
| 2,6-Dihydroxybenzoic acid | Xenobiotics | Food component/plant | −0.043/0.958 |
| Overweight/obesity at age 4 | |||
| FAD | Cofactors and Vitamins | Riboflavin metabolism | −0.142/0.867 |
| β-Sitosterol | Lipid | Steroid biosynthesis | −0.133/0.875 |
| Isoeugenol sulfate | Xenobiotics | Food component/plant | 0.087/1.091 |
| 1,3-Dimethyluric acid | Xenobiotics | Xanthine metabolism | 0.015/1.015 |
| 1-Methyluric acid | Xenobiotics | Xanthine metabolism | 0.005/1.005 |
LASSO, least absolute shrinkage and selection operator.
Involved in or relevant to the pathways;
Associated with a standard deviation increase in the metabolite level
Associations of the MRSs and Childhood Outcomes
After adjusting for prenatal covariates (maternal age at pregnancy, pre-pregnancy BMI, parity, education level, insurance type, alcohol drinking, and smoking during pregnancy), the odds ratios (ORs) (95% CI) associated with an SD increase in the MRSs were 2.97 (1.95–4.54) and 2.03 (1.54–2.67) for the rising-high-BMI trajectory (P = 4.6×10⁻⁷) and overweight/obesity (P = 4.3×10⁻⁷) in the children, respectively. With additional adjustment for childhood energy intake and physical activity, the associations were attenuated but still significant. The ORs (95% CI) of the children decreased to 2.30 (1.40–3.77) and 1.84 (1.36–2.50) for being in the rising-high-BMI trajectory group (P = 9.5×10⁻⁴) and overweight/obese (P = 7.6×10⁻⁵), respectively.
Prediction Improvement with the MRSs
Adding the MRSs to the models with the traditional prenatal risk factors significantly improved the prediction of childhood outcomes (Figure 3). For the childhood outcome of being in the rising-high-BMI trajectory, the AUC of ROC (95% CI) significantly increased from 0.72 (0.64–0.80) to 0.82 (0.76–0.88) with the ΔAUC (95% CI) of 0.10 (0.03–0.18) (P = 0.005). For the childhood outcome of being overweight/obese at age 4, the AUC of ROC (95% CI) significantly increased from 0.67 (0.61–0.79) to 0.74 (0.68–0.79) with the ΔAUC (95% CI) of 0.07 (0.02–0.12) (P=0.007).
Figure 3.
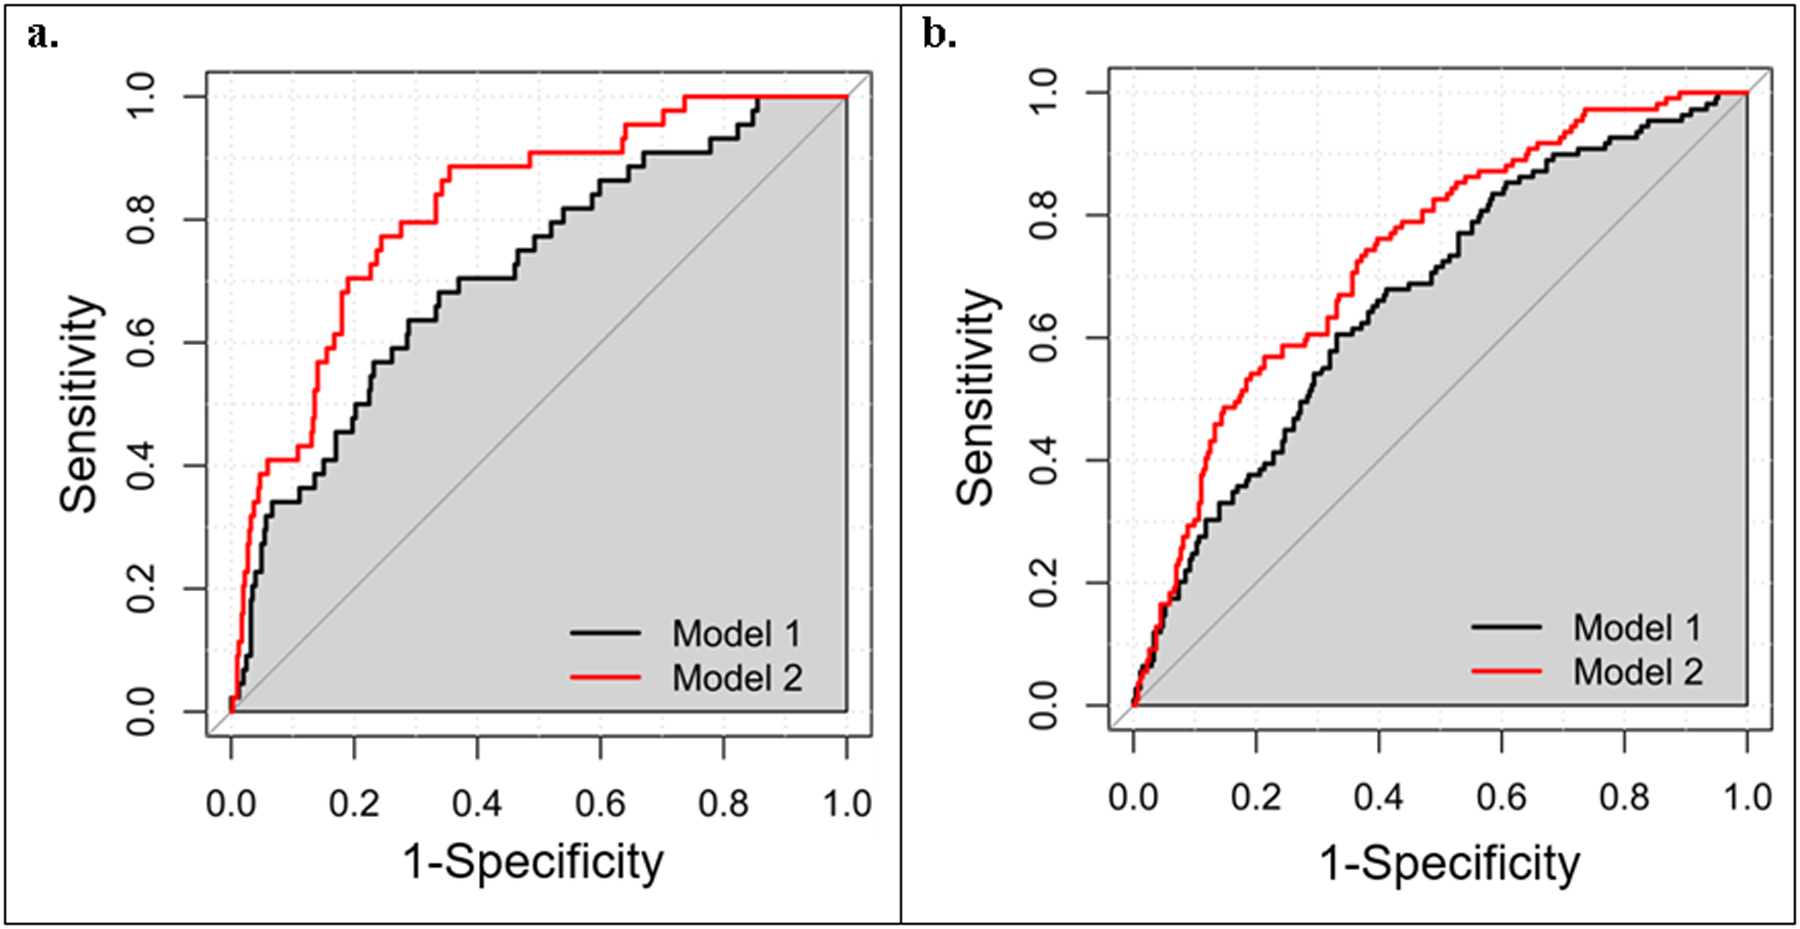
ROC curves of predictive models. a. ROC curves for the rising-high-BMI trajectory; b. ROC curves for overweight/obesity at age 4. Model 1: traditional risk factors including maternal age, education, health insurance, smoking and drinking status, parity, and pre-pregnancy BMI; Model 2: Model + metabolite risk score. ROC, receiver operating characteristic.
Discussion
In this birth cohort of African American women and their children, we identified 11 maternal prenatal metabolites associated with early childhood growth trajectories and/or overweight/obesity risk in offspring, highlighting the importance of the maternal metabolism of lipids, amino acids, vitamins, caffeine, and nicotine in child development. Furthermore, the prenatal MRS constructed by the metabolites significantly improved the prediction of the studied childhood growth outcomes beyond traditional prenatal risk factors.
The maternal diet provides energy and key nutrients for fetal development and provides programming for post-natal growth. Our study highlighted the importance of the metabolism of lipids (β-sitosterol) and proteins (hydroxyproline and hydroxyasparagine) in the developmental origins of childhood obesity. Mechanistically, β-sitosterol, a phytosterol, decreases the intestinal absorption of cholesterol thereby limiting the transfer of cholesterol to the fetal circulation via placental transfer (32). Protective effects of lower maternal cholesterol are probably mediated through in utero programming of adipocyte development (33), epigenetics changes (34), and offspring’s eating behavior (35). Evidence is emerging that phytosterol supplementation during pregnancy can normalize cholesterol in both mothers and children in observational studies of human and animal studies (36, 37). More human studies including clinical trials are still warranted to investigate the protective effect of prenatal β-sitosterol on postnatal growth in the future.
Hydroxyproline and hydroxyasparagine are posttranslationally modified amino acids proline and asparagine, respectively. Hydroxyproline is a major component of the protein collagen and plays key roles in collagen stability. Increased hydroxyproline levels in amniotic fluid have been associated with neural tube defects (38). Hydroxyproline is also a biomarker for the consumption of processed meat which has relatively high collagen content and is undesirable because of deficiency in essential amino acids (39, 40). Prenatal intake of processed meat has been associated with childhood obesity (41, 42). Hydroxyasparagine is found in fibrillin which is essential for the formation of elastic fibers in connective tissue. Mutations of the coding gene of fibrillin lead to abnormalities of cardiovascular development, such as Marfan syndrome (43). However, like hydroxyproline, the mechanisms underlying the effect of maternal hydroxyasparagine on child development and obesity risk are still unclear.
The metabolites, methylmalonic acid and FAD, implicated the potential importance of the metabolism of B complex vitamins during pregnancy. Specifically, the B complex vitamins are required for decarboxylation, transamination, acylation, oxidation, and reduction of substrates that ultimately are used for energy utilization (44). These processes are used in the metabolism of amino acid, fatty acid, cholesterol, steroid, glucose synthesis, methylgroup transfer and the supply of single-carbon units for DNA synthesis. Elevation of methylmalonic acid can be caused by vitamin B12 deficiency. Maternal vitamin B12 deficiency has been associated with an increased risk of preterm delivery and intrauterine growth retardation (45, 46). FAD is derived from vitamin B2 and an indispensable cofactor for the cellular antioxidant defense of oxidative stress which has been linked with adiposity development and elevated risks of metabolic disorders in offspring (47, 48). Our findings suggest further investigation targeting these B complex vitamins may be a plausible pathway for their preventive effects on childhood obesity.
We identified some other metabolites which might be indicators of food/drug intake. Metabolic indicators of caffeine (5-acetylamino-6-amino-3-methyluracil) and theophylline (1,3-dimethyluric acid, and 1-methyluric acid), were found to be positively associated with accelerated infant growth and childhood obesity. Both caffeine and theophylline are xanthines, a group of purine alkaloids, and can be from the intake of coffee, tea, and chocolate. Theophylline also can be one of the products of caffeine metabolic processing in the liver (49). Our findings are in line with previous epidemiology studies which reported maternal caffeine intake during pregnancy is a risk factor for childhood obesity (50–52). Caffeine is a neural stimulant and can penetrate the placental barrier and enter fetal circulation (53). Caffeine can affect fetal neurological development which regulates appetite and metabolic processes (54, 55). In addition, prenatal caffeine exposure induces a lower level of fetal blood leptin, resulting in greater appetite and energy storage (56). We also identified another protective metabolite for accelerated early childhood growth, 2,6-dihydroxybenzoic acid, which is a potential marker of consumption of beers and olives (e.g., olive oil). However, the biological mechanisms underlying these associations with the childhood outcome are still largely unknown.
The metabolomics study also identified a couple of metabolic indicators of environmental exposures. Hydroxycotinine along with cotinine is the main metabolite of nicotine and a biomarker of tobacco exposure from either active or passive smoking. Maternal smoking during pregnancy has been associated with an increased risk of many adverse health outcomes in offspring, including overweight and obesity (13, 57). Nicotine can be transported across the placenta. Animal studies have shown that the administration of nicotine to pregnant mothers results in smaller birthweight but increased body fat and faster postnatal weight gain (58). Fetal exposure to nicotine causes abnormal cell proliferation, differentiation, and synaptic activity in the brain and the peripheral autonomic pathways, which may lead to permanent changes in the hypothalamic regulation of food intake and energy expenditure (59). Another interesting metabolite is isoeugenol sulfate which derives from isoeugenol. Isoeugenol is a commonly used fragrance added to many commercially available hair and skin products and occurs naturally in the essential oils of plants. An animal study has shown the developmental toxicity of isoeugenol in rats, including intrauterine growth retardation (60).
Our study has several strengths. First, this study is the initial study to investigate prenatal metabolomics profiles in association with childhood growth and obesity risk. Second, the contemporary birth cohort included repeated measurements during early childhood, which enabled longitudinal growth trajectory analysis among offspring. Third, we included African Americans mother-child pairs, as we targeted an understudied population with a high obesity rate in the US (61). Fourth, an untargeted or global metabolomics platform which is a hypothesis-free approach was used to maximize the study’s ability to identify novel prenatal biomarkers for childhood growth outcomes of interest. Furthermore, a comprehensive set of confounding factors was controlled for in the analyses examining the associations of prenatal plasma metabolites with childhood outcomes. No fasting was required for the blood sample collection considering the potential difficulty for the research clinic visit of some pregnant women. This might have introduced variance to the metabolites because of diet. However, the nonfasting metabolomics profiles might be more likely to reflect the metabolic status of the pregnant women during most time of the day and more relevant to the fetus development. This may be partially supported by the previous findings that similar with fasting measures, nonfasting glucose and triglycerides were still associated with ischemic heart disease (62, 63). A potential limitation is the lack of replication samples for this metabolomics study. However, we identified the associations of the plasma metabolites of caffeine and nicotine with childhood growth outcomes, which are in line with previous studies based on self-reported measures of these two substances (13, 50–52, 57). This may support the robustness of our study findings to some extent.
In conclusion, our study has provided novel metabolites and metabolic pathways for advancing the understanding of the in utero environment and the obesity development in offspring. The outcome-related metabolites provide early prenatal markers for better predicting the development of childhood obesity, and most of them are likely to be modifiable through maternal dietary and behavioral interventions during pregnancy. Future studies are warranted to validate our findings and to clarify the biological mechanisms underlying the effects of these prenatal metabolites on childhood outcomes.
Supplementary Material
Acknowledgments
We thank all the participants of the CANDLE study. This study was supported by the startup fund of Dr. Qi Zhao from the University of Tennessee Heath Science Center. The CANDLE study was supported by the Urban Child Institute, the University of Tennessee Heath Science Center, and the National Institutes of Health grants (1R01HL109977, 1UG3OD023271-01, and 5R01HL109977-05). Dr. Qi Zhao was also supported by the grant R01AG061917 from the National Institutes of Health.
Footnotes
Conflict of Interest
The authors declare that they have no conflict of interest.
References
- 1.Fryar CD, Carroll MD, Ogden CL. Prevalence of Overweight, Obesity, and Severe Obesity Among Children and Adolescents Aged 2–19 Years: United States, 1963–1965 Through 2015–2016. National Center for Health Statistics: Health E-Stats. 2018. [Google Scholar]
- 2.Hammond RA, Levine R. The economic impact of obesity in the United States. Diabetes Metab Syndr Obes. 2010;3:285–95. [DOI] [PMC free article] [PubMed] [Google Scholar]
- 3.Cawley J The economics of childhood obesity. Health Aff (Millwood). 2010;29:364–71. [DOI] [PubMed] [Google Scholar]
- 4.Trasande L, Chatterjee S. The impact of obesity on health service utilization and costs in childhood. Obesity (Silver Spring). 2009;17:1749–54. [DOI] [PubMed] [Google Scholar]
- 5.Heindel JJ, Vandenberg LN. Developmental origins of health and disease: a paradigm for understanding disease cause and prevention. Curr Opin Pediatr. 2015;27:248–53. [DOI] [PMC free article] [PubMed] [Google Scholar]
- 6.Hu Z, Tylavsky FA, Han JC, Kocak M, Fowke JH, Davis RL, et al. Maternal metabolic factors during pregnancy predict early childhood growth trajectories and obesity risk: the CANDLE Study. Int J Obes (Lond). 2019;43:1914–22. [DOI] [PMC free article] [PubMed] [Google Scholar]
- 7.Zhu Y, Olsen SF, Mendola P, Yeung EH, Vaag A, Bowers K, et al. Growth and obesity through the first 7 y of life in association with levels of maternal glycemia during pregnancy: a prospective cohort study. Am J Clin Nutr. 2016;103:794–800. [DOI] [PMC free article] [PubMed] [Google Scholar]
- 8.Zhao P, Liu E, Qiao Y, Katzmarzyk PT, Chaput JP, Fogelholm M, et al. Maternal gestational diabetes and childhood obesity at age 9–11: results of a multinational study. Diabetologia. 2016;59:2339–48. [DOI] [PMC free article] [PubMed] [Google Scholar]
- 9.Gaillard R, Steegers EA, Franco OH, Hofman A, Jaddoe VW. Maternal weight gain in different periods of pregnancy and childhood cardio-metabolic outcomes. The Generation R Study. Int J Obes (Lond). 2015;39:677–85. [DOI] [PubMed] [Google Scholar]
- 10.Guo L, Liu J, Ye R, Liu J, Zhuang Z, Ren A. Gestational Weight Gain and Overweight in Children Aged 3–6 Years. J Epidemiol. 2015;25:536–43. [DOI] [PMC free article] [PubMed] [Google Scholar]
- 11.Hu Z, Tylavsky FA, Kocak M, Fowke JH, Han JC, Davis RL, et al. Effects of Maternal Dietary Patterns during Pregnancy on Early Childhood Growth Trajectories and Obesity Risk: The CANDLE Study. Nutrients. 2020;12. [DOI] [PMC free article] [PubMed] [Google Scholar]
- 12.Zhu Y, Olsen SF, Mendola P, Halldorsson TI, Yeung EH, Granstrom C, et al. Maternal dietary intakes of refined grains during pregnancy and growth through the first 7 y of life among children born to women with gestational diabetes. Am J Clin Nutr. 2017;106:96–104. [DOI] [PMC free article] [PubMed] [Google Scholar]
- 13.Oken E, Levitan EB, Gillman MW. Maternal smoking during pregnancy and child overweight: systematic review and meta-analysis. Int J Obes (Lond). 2008;32:201–10. [DOI] [PMC free article] [PubMed] [Google Scholar]
- 14.Riedel C, Schonberger K, Yang S, Koshy G, Chen YC, Gopinath B, et al. Parental smoking and childhood obesity: higher effect estimates for maternal smoking in pregnancy compared with paternal smoking--a meta-analysis. Int J Epidemiol. 2014;43:1593–606. [DOI] [PubMed] [Google Scholar]
- 15.La Merrill M, Birnbaum LS. Childhood obesity and environmental chemicals. Mt Sinai J Med. 2011;78:22–48. [DOI] [PMC free article] [PubMed] [Google Scholar]
- 16.Gutierrez-Torres DS, Barraza-Villarreal A, Hernandez-Cadena L, Escamilla-Nunez C, Romieu I. Prenatal Exposure to Endocrine Disruptors and Cardiometabolic Risk in Preschoolers: A Systematic Review Based on Cohort Studies. Ann Glob Health. 2018;84:239–49. [DOI] [PMC free article] [PubMed] [Google Scholar]
- 17.Souza RT, Mayrink J, Leite DF, Costa ML, Calderon IM, Rocha Filho EA, et al. Metabolomics applied to maternal and perinatal health: a review of new frontiers with a translation potential. Clinics (Sao Paulo). 2019;74:e894. [DOI] [PMC free article] [PubMed] [Google Scholar]
- 18.Chen Q, Francis E, Hu G, Chen L. Metabolomic profiling of women with gestational diabetes mellitus and their offspring: Review of metabolomics studies. J Diabetes Complications. 2018;32:512–23. [DOI] [PubMed] [Google Scholar]
- 19.Maitre L, Fthenou E, Athersuch T, Coen M, Toledano MB, Holmes E, et al. Urinary metabolic profiles in early pregnancy are associated with preterm birth and fetal growth restriction in the Rhea mother-child cohort study. BMC Med. 2014;12:110. [DOI] [PMC free article] [PubMed] [Google Scholar]
- 20.Luthra G, Vuckovic I, Bangdiwala A, Gray H, Redmon JB, Barrett ES, et al. First and second trimester urinary metabolic profiles and fetal growth restriction: an exploratory nested case-control study within the infant development and environment study. BMC Pregnancy Childbirth. 2018;18:48. [DOI] [PMC free article] [PubMed] [Google Scholar]
- 21.Carter RA, Pan K, Harville EW, McRitchie S, Sumner S. Metabolomics to reveal biomarkers and pathways of preterm birth: a systematic review and epidemiologic perspective. Metabolomics. 2019;15:124. [DOI] [PMC free article] [PubMed] [Google Scholar]
- 22.Tylavsky FA, Kocak M, Murphy LE, Graff JC, Palmer FB, Volgyi E, et al. Gestational Vitamin 25(OH)D Status as a Risk Factor for Receptive Language Development: A 24-Month, Longitudinal, Observational Study. Nutrients. 2015;7:9918–30. [DOI] [PMC free article] [PubMed] [Google Scholar]
- 23.Colon-Ramos U, Racette SB, Ganiban J, Nguyen TG, Kocak M, Carroll KN, et al. Association between dietary patterns during pregnancy and birth size measures in a diverse population in Southern US. Nutrients. 2015;7:1318–32. [DOI] [PMC free article] [PubMed] [Google Scholar]
- 24.Fernandez-Barres S, Romaguera D, Valvi D, Martinez D, Vioque J, Navarrete-Munoz EM, et al. Mediterranean dietary pattern in pregnant women and offspring risk of overweight and abdominal obesity in early childhood: the INMA birth cohort study. Pediatr Obes. 2016;11:491–9. [DOI] [PubMed] [Google Scholar]
- 25.Grummer-Strawn LM, Reinold C, Krebs NF. Use of World Health Organization and CDC growth charts for children aged 0–59 months in the United States. MMWR Recomm Rep. 2010;59:1–15. [PubMed] [Google Scholar]
- 26.Aris IM, Chen LW, Tint MT, Pang WW, Soh SE, Saw SM, et al. Body mass index trajectories in the first two years and subsequent childhood cardio-metabolic outcomes: a prospective multi-ethnic Asian cohort study. Sci Rep. 2017;7:8424. [DOI] [PMC free article] [PubMed] [Google Scholar]
- 27.Hu Z, Tylavsky FA, Han JC, Kocak M, Fowke JH, Davis RL, et al. Maternal metabolic factors during pregnancy predict early childhood growth trajectories and obesity risk: the CANDLE Study. International journal of obesity. 2019;43:1914–22. [DOI] [PMC free article] [PubMed] [Google Scholar]
- 28.National Center for Health Statistics. Growth Charts. https://www.cdc.gov/growthcharts/index.htm. [DOI] [PubMed]
- 29.Xi B, Gu H, Baniasadi H, Raftery D. Statistical analysis and modeling of mass spectrometry-based metabolomics data. Methods Mol Biol. 2014;1198:333–53. [DOI] [PMC free article] [PubMed] [Google Scholar]
- 30.Bijlsma S, Bobeldijk I, Verheij ER, Ramaker R, Kochhar S, Macdonald IA, et al. Large-scale human metabolomics studies: a strategy for data (pre-) processing and validation. Anal Chem. 2006;78:567–74. [DOI] [PubMed] [Google Scholar]
- 31.Tibshirani R Regression Shrinkage and Selection Via the Lasso. J R Stat Soc. 1996;58:267–88. [Google Scholar]
- 32.Bartels A, O’Donoghue K. Cholesterol in pregnancy: a review of knowns and unknowns. Obstet Med. 2011;4:147–51. [DOI] [PMC free article] [PubMed] [Google Scholar]
- 33.Taylor PD, Poston L. Developmental programming of obesity in mammals. Exp Physiol. 2007;92:287–98. [DOI] [PubMed] [Google Scholar]
- 34.Masuyama H, Mitsui T, Nobumoto E, Hiramatsu Y. The Effects of High-Fat Diet Exposure In Utero on the Obesogenic and Diabetogenic Traits Through Epigenetic Changes in Adiponectin and Leptin Gene Expression for Multiple Generations in Female Mice. Endocrinology. 2015;156:2482–91. [DOI] [PubMed] [Google Scholar]
- 35.McMillen IC, Adam CL, Muhlhausler BS. Early origins of obesity: programming the appetite regulatory system. J Physiol. 2005;565:9–17. [DOI] [PMC free article] [PubMed] [Google Scholar]
- 36.Liu J, Iqbal A, Raslawsky A, Browne RW, Patel MS, Rideout TC. Influence of maternal hypercholesterolemia and phytosterol intervention during gestation and lactation on dyslipidemia and hepatic lipid metabolism in offspring of Syrian golden hamsters. Mol Nutr Food Res. 2016;60:2151–60. [DOI] [PMC free article] [PubMed] [Google Scholar]
- 37.Rideout TC, Movsesian C, Tsai YT, Iqbal A, Raslawsky A, Patel MS. Maternal Phytosterol Supplementation during Pregnancy and Lactation Modulates Lipid and Lipoprotein Response in Offspring of apoE-Deficient Mice. J Nutr. 2015;145:1728–34. [DOI] [PMC free article] [PubMed] [Google Scholar]
- 38.Ozyurt H, Totan A, Sahin S, Kilinc C, Sogut S, Akyol O. Maternal serum and amniotic fluid hydroxyproline levels in neural tube defects. Fetal Diagn Ther. 2003;18:321–3. [DOI] [PubMed] [Google Scholar]
- 39.Messia MC, Marconi E. Innovative and rapid procedure for 4-hydroxyproline determination in meat-based foods. Methods Mol Biol. 2012;828:281–9. [DOI] [PubMed] [Google Scholar]
- 40.Salim D, Abou EI-Roos N. Detection of Phosphates and Hydroxyproline in some Meat Products. BVMJ. 20131–9. [Google Scholar]
- 41.Murrin CM, Heinen MM, Kelleher CC. Are Dietary Patterns of Mothers during Pregnancy Related to Children’s Weight Status? Evidence from the Lifeways Cross- Generational Cohort Study. AIMS Public Health. 2015;2:274–96. [DOI] [PMC free article] [PubMed] [Google Scholar]
- 42.Martin CL, Siega-Riz AM, Sotres-Alvarez D, Robinson WR, Daniels JL, Perrin EM, et al. Maternal Dietary Patterns during Pregnancy Are Associated with Child Growth in the First 3 Years of Life. J Nutr. 2016;146:2281–8. [DOI] [PMC free article] [PubMed] [Google Scholar]
- 43.Hayward C, Brock DJ. Fibrillin-1 mutations in Marfan syndrome and other type-1 fibrillinopathies. Hum Mutat. 1997;10:415–23. [DOI] [PubMed] [Google Scholar]
- 44.Institute of Medicine. Dietary Reference Intakes for Thiamin, Riboflavin, Niacin, Vitamin B6, Folate, Vitamin B12, Pantothenic Acid, Biotin, and Choline. Washington, DC: The National Academies Press; 1998. 592 p. [PubMed] [Google Scholar]
- 45.Horan MK, McGowan CA, Gibney ER, Donnelly JM, McAuliffe FM. The association between maternal dietary micronutrient intake and neonatal anthropometry - secondary analysis from the ROLO study. Nutr J. 2015;14:105. [DOI] [PMC free article] [PubMed] [Google Scholar]
- 46.Muthayya S, Kurpad AV, Duggan CP, Bosch RJ, Dwarkanath P, Mhaskar A, et al. Low maternal vitamin B12 status is associated with intrauterine growth retardation in urban South Indians. Eur J Clin Nutr. 2006;60:791–801. [DOI] [PubMed] [Google Scholar]
- 47.Luo ZC, Fraser WD, Julien P, Deal CL, Audibert F, Smith GN, et al. Tracing the origins of “fetal origins” of adult diseases: programming by oxidative stress? Med Hypotheses. 2006;66:38–44. [DOI] [PubMed] [Google Scholar]
- 48.Loy SL, Sirajudeen KN, Hamid Jan JM. The effects of prenatal oxidative stress levels on infant adiposity development during the first year of life. J Dev Orig Health Dis. 2014;5:142–51. [DOI] [PubMed] [Google Scholar]
- 49.Sved S, Hossie RD, McGilveray IJ. The human metabolism of caffeine to theophylline. Res Commun Chem Pathol Pharmacol. 1976;13:185–92. [PubMed] [Google Scholar]
- 50.Chen LW, Murrin CM, Mehegan J, Kelleher CC, Phillips CM, Cross-Generation Cohort Study for the L. Maternal, but not paternal or grandparental, caffeine intake is associated with childhood obesity and adiposity: The Lifeways Cross-Generation Cohort Study. Am J Clin Nutr. 2019;109:1648–55. [DOI] [PMC free article] [PubMed] [Google Scholar]
- 51.Papadopoulou E, Botton J, Brantsaeter AL, Haugen M, Alexander J, Meltzer HM, et al. Maternal caffeine intake during pregnancy and childhood growth and overweight: results from a large Norwegian prospective observational cohort study. BMJ Open. 2018;8:e018895. [DOI] [PMC free article] [PubMed] [Google Scholar]
- 52.Li DK, Ferber JR, Odouli R. Maternal caffeine intake during pregnancy and risk of obesity in offspring: a prospective cohort study. Int J Obes (Lond). 2015;39:658–64. [DOI] [PMC free article] [PubMed] [Google Scholar]
- 53.Goldstein A, Warren R. Passage of caffeine into human gonadal and fetal tissue. Biochem Pharmacol. 1962;11:166–8. [DOI] [PubMed] [Google Scholar]
- 54.Xu D, Wu Y, Liu F, Liu YS, Shen L, Lei YY, et al. A hypothalamic-pituitary-adrenal axis-associated neuroendocrine metabolic programmed alteration in offspring rats of IUGR induced by prenatal caffeine ingestion. Toxicol Appl Pharmacol. 2012;264:395–403. [DOI] [PubMed] [Google Scholar]
- 55.Xu D, Zhang B, Liang G, Ping J, Kou H, Li X, et al. Caffeine-induced activated glucocorticoid metabolism in the hippocampus causes hypothalamic-pituitary-adrenal axis inhibition in fetal rats. PLoS One. 2012;7:e44497. [DOI] [PMC free article] [PubMed] [Google Scholar]
- 56.Wu YM, Luo HW, Kou H, Wen YX, Shen L, Pei LG, et al. Prenatal caffeine exposure induced a lower level of fetal blood leptin mainly via placental mechanism. Toxicol Appl Pharmacol. 2015;289:109–16. [DOI] [PubMed] [Google Scholar]
- 57.Rayfield S, Plugge E. Systematic review and meta-analysis of the association between maternal smoking in pregnancy and childhood overweight and obesity. J Epidemiol Community Health. 2017;71:162–73. [DOI] [PubMed] [Google Scholar]
- 58.Gao YJ, Holloway AC, Zeng ZH, Lim GE, Petrik JJ, Foster WG, et al. Prenatal exposure to nicotine causes postnatal obesity and altered perivascular adipose tissue function. Obes Res. 2005;13:687–92. [DOI] [PubMed] [Google Scholar]
- 59.Ino T Maternal smoking during pregnancy and offspring obesity: meta-analysis. Pediatr Int. 2010;52:94–9. [DOI] [PubMed] [Google Scholar]
- 60.George JD, Price CJ, Marr MC, Myers CB, Jahnke GD. Evaluation of the developmental toxicity of isoeugenol in Sprague-Dawley (CD) rats. Toxicol Sci. 2001;60:112–20. [DOI] [PubMed] [Google Scholar]
- 61.National Center for Health Statistics. Prevalence of Obesity and Severe Obesity Among Adults: United States, 2017–2018.
- 62.Nordestgaard BG, Benn M, Schnohr P, Tybjaerg-Hansen A. Nonfasting triglycerides and risk of myocardial infarction, ischemic heart disease, and death in men and women. JAMA. 2007;298:299–308. [DOI] [PubMed] [Google Scholar]
- 63.Benn M, Tybjaerg-Hansen A, McCarthy MI, Jensen GB, Grande P, Nordestgaard BG. Nonfasting glucose, ischemic heart disease, and myocardial infarction: a Mendelian randomization study. J Am Coll Cardiol. 2012;59:2356–65. [DOI] [PMC free article] [PubMed] [Google Scholar]
Associated Data
This section collects any data citations, data availability statements, or supplementary materials included in this article.