

Abstract
Background:
Head and brain anatomy have been related to e-field strengths induced by transcranial electrical stimulation (tES). Individualization based on anatomic factors require high-quality structural magnetic resonance images, which are not always available. Head circumference (HC) can serve as an alternative means, but its linkage to electric field strength has not yet been established.
Methods:
We simulated electric fields induced by tES based on individual T1w- and T2w-images of 47 healthy adults, for four conventional (“standard”) and four corresponding focal (“4×1”) electrode montages. Associations of electric field strengths with individual HC were calculated using linear mixed models.
Results:
Larger HC was associated with lower electric field strength across montages. We provide mathematical equations to estimate individual electric field strengths based on the HC.
Conclusion:
HC can be used as an alternative to estimate interindividual differences of the tES-induced electric field strength and to prospectively individualize stimulation dose, e.g., in the clinical context.
Keywords: Transcranial electrical stimulation, non-invasive brain stimulation, electric field simulation, computational modelling, individualization
Introduction
Transcranial electric stimulation (tES) is used to alter cognitive and motor functions in healthy and diseased human subjects by modulating intrinsic brain activity [1, 2]. However, increasing number of studies reporting high variability of the effects call for the identification of factors causing variability and individualization of tES parameters [3–5].
Head and brain anatomy has been identified as one factor producing variability in e-fields, which may contribute to the variability in tES-induced effects on neural and behavioral levels [6–11]. In order to estimate e-fields, computational modeling approaches have been established that allow accurate head reconstruction and subsequent simulation of current distributions [12, 13]. However, these models require the acquisition of high-quality magnetic resonance (MR) structural images that in addition should be optimized for modeling purposes to ensure accurate automatic segmentation of the head tissues [14]. This is not always possible in larger studies due to limited scanner access, computational expertise, as well as high costs, and will therefore obstruct the wide-spread implementation of such individualized tES parameters, e.g., in the clinical routine.
In the current study, we therefore evaluated for the first time the use of head circumference as an easy to implement and low cost surrogate to account for variability of the e-field caused by different head sizes. For this aim, we investigated the linkage between head circumference and e-fields induced by different tES montages. We used T1w- and T2w-images of 47 subjects acquired in two previous studies to simulate four conventional (i.e., “standard”) and four focal (i.e., “4×1”) electrode configurations, covering spatial targeting of frontal, central and parietal brain sites. We show that head circumference captures a practically relevant amount of the interindividual variability of the e-field, and provide equations to estimate electric field strengths based on knowledge of head circumference only.
Material and methods
Participants.
Data from two studies were used for the current analysis [15, 16]. The studies were approved by the ethics committee of the Greifswald University Medicine and conducted in accordance with the Helsinki Declaration. Of 55 available datasets, 47 were included (29 females, mean/SD age: 24.8/3.9) after quality control of the segmentation and head reconstruction (see below).
MR imaging.
High-resolution T1- (1 × 1 × 1 mm3, TR = 2300 ms, TE = 2.96 ms, TI = 900 ms, flip angle = 9°; using selective water excitation for fat suppression) and T2-weighted images (1 × 1 × 1 mm3, TR = 12770 ms, TE = 86 ms, flip angle = 111°) were recorded.
Simulations.
The software SimNIBS (version 3) was used to calculate the electric field induced by tES, based on the finite element method and individualized tetrahedral head meshes generated from the structural T1- and T2-weighted images of the participant (http://simnibs.org) [12, 14, 17]. Electric field simulations were computed for four conventional bipolar tES montages with two round electrodes (5 cm diameter) as well as four focal tES montages with five to ten round electrodes (1 cm diameter) arranged in one or two 1×4 configurations (see Figure 1). Procedures for head reconstruction, for electrode placement and for determining the head circumference are described in the Supplementary Methods that also list the stimulation parameters and the standard conductivity values of SimNIBS which were used for all tissues.
Figure 1.
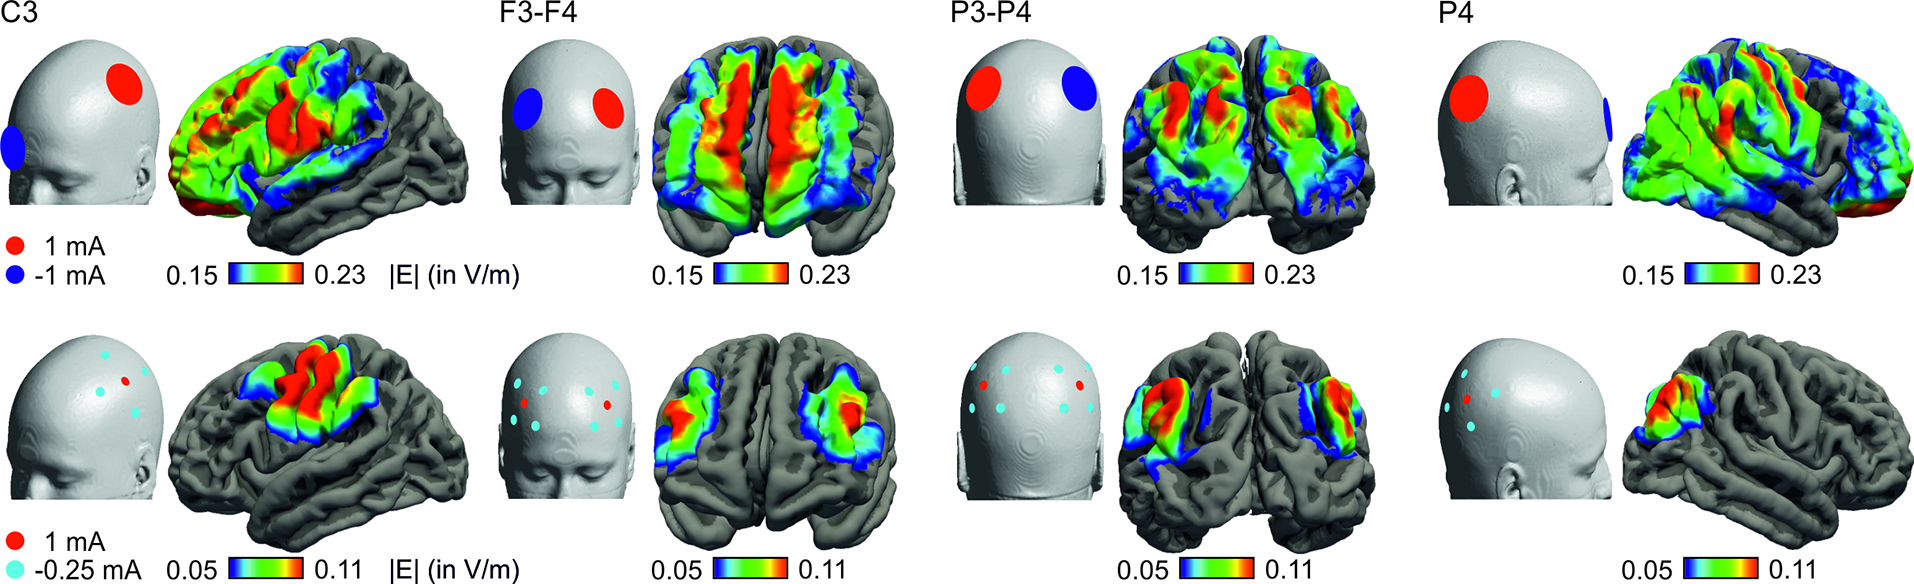
Electrode configurations included in the analysis (upper row: conventional “standard”; lower row: focal “4×1” montages) and mean e-field strengths (|E| in V/m) averaged over participants.
To calculate average field distributions, simulation results were transformed into fsaverage space. Average e-fields were calculated on a surface following the middle of the grey matter sheet (i.e., placed at 50% of the gray matter thickness). The electric field strength was extracted from the individual surface output for each tES montage. E-field strength was quantified as follows: For conventional montages, we chose the average e-field strength in the target regions-of-interest (ROIs). ROIs were defined using the Desikan-Killiany atlas [18]: left middle frontal gyrus for frontal montages, left precentral for central montages, left and right parietal for posterior montages. For focal montages, e-fields were indexed by the 99th percentile of the field magnitudes as this better captured field strength in the “target” region (please see Supplementary Methods and Supplementary Figure S1 for further information).
Statistical analysis.
R was used for statistical analysis [19]. Separate linear mixed model analyses were computed for conventional and focal montages with the independent variable head circumference (given in dm, divided by 1000) and montage as repeated measure (referred to as “specific model”). In order to obtain average equations for the estimation of electric field strength under a given head circumference, models were also computed without inclusion of the repeated measures factor (referred to as “mean model”). For the analyses of focal montages, an interaction term for head circumference and montage was included. A two-sided significance level of α = 0.05 was used.
Results
Association of e-field strengths with head circumference
Averaged distributions of electric fields for each montage are depicted in Figure 1. For conventional montages, maximum field strengths were observed between and below the electrodes whereas in focal montages, the highest field strengths were centered below the electrodes. Higher head circumference was associated with lower electric field strengths (conventional: F(1,45) = 18.54, p < 0.001, focal: F(1,45)= 10.84, p = 0.002), Figure 2. Models explained 28% (for conventional) and 24 % (for focal) of the variance in e-field strength, see Supplementary Tables S1 and S2. Changing the electrode shape from round to rectangular did not affect this relationship (see Supplementary Figure S2). In addition, the field component perpendicular to the cortical sheet (indicating current in- and outflow) exhibits a similar association (see Supplementary Figure S3).
Figure 2.
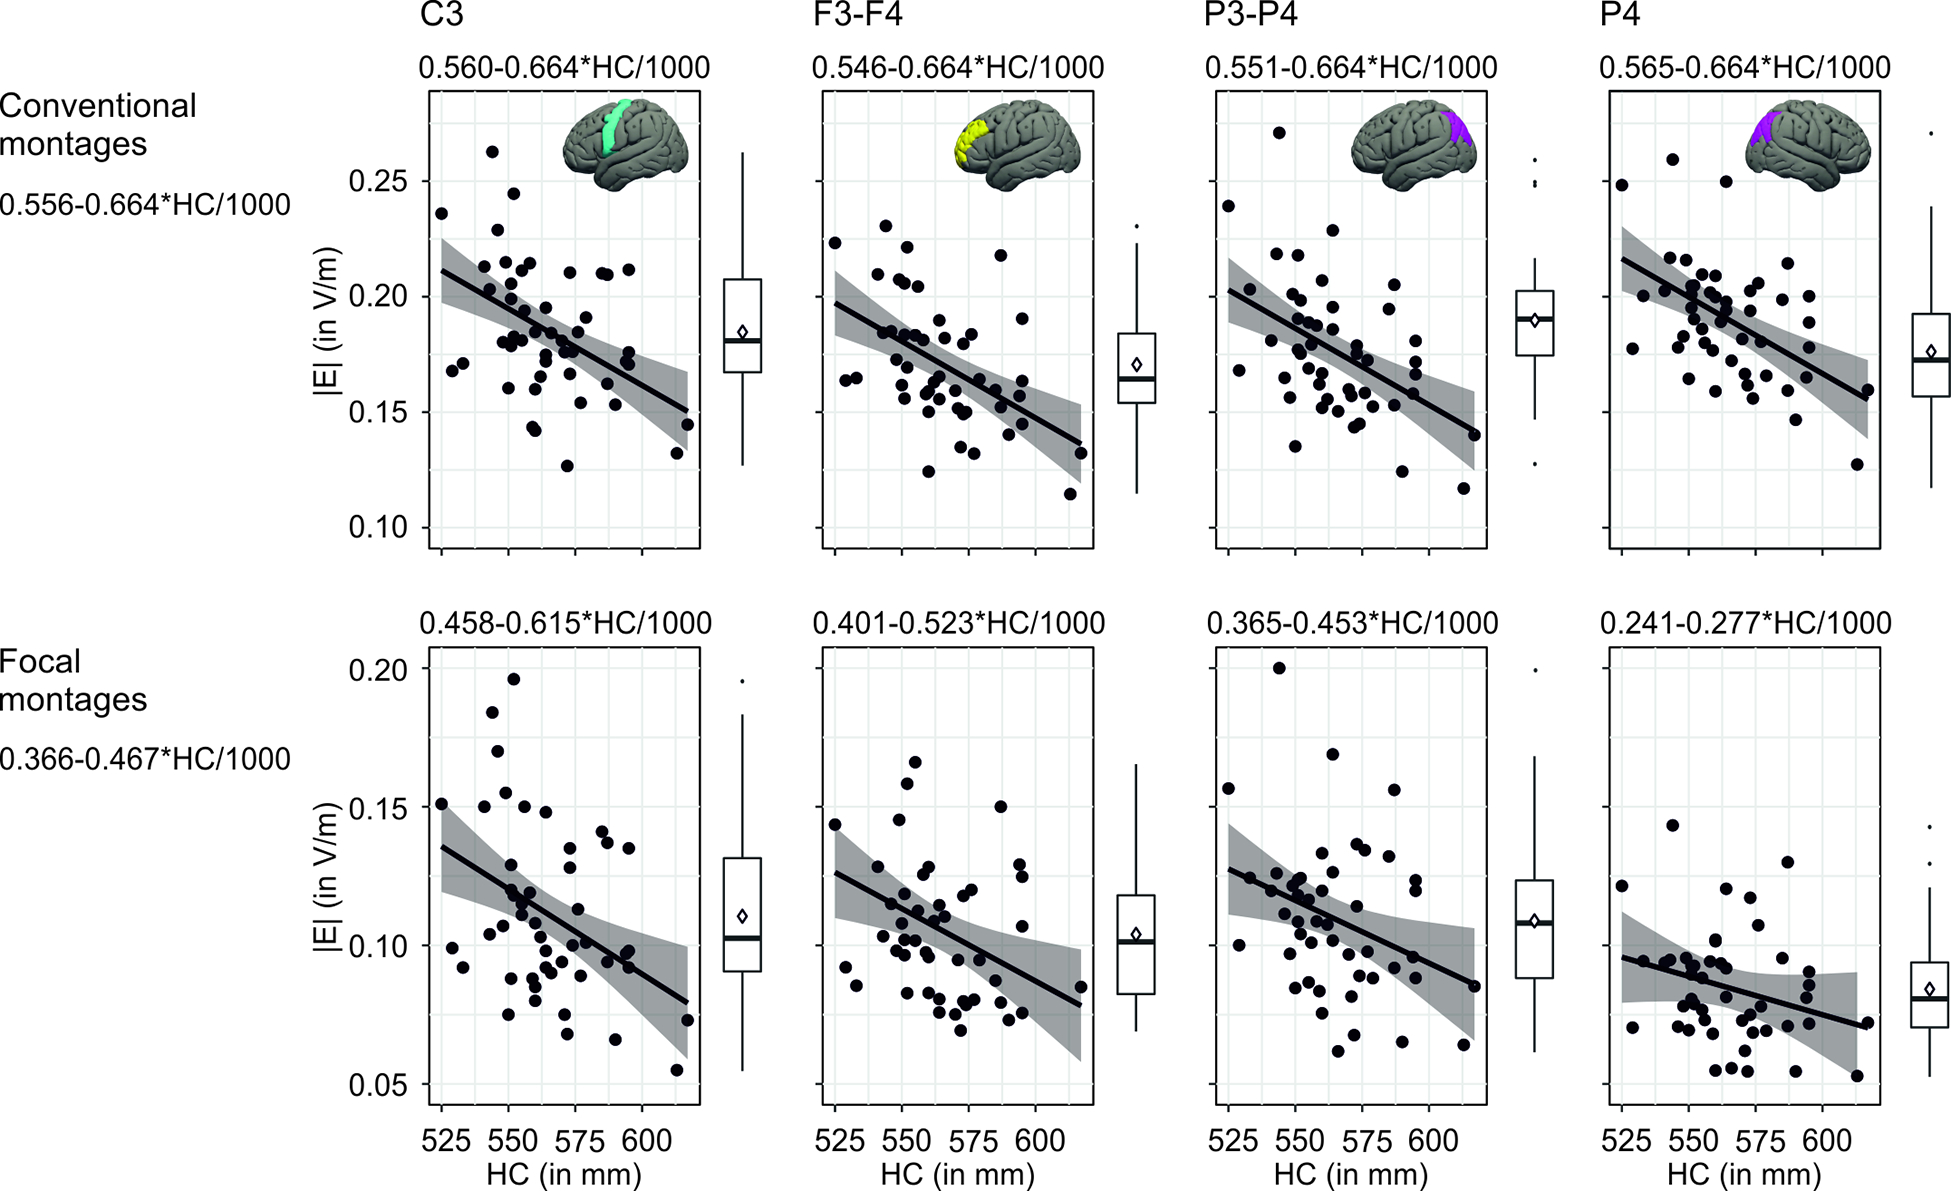
Association of head circumference with electric field strengths (upper row: conventional “standard” montages, ROI average values; lower row: focal “4×1” montages, 99th percentile values of field magnitudes). Scatterplots and boxplots show distribution of individual data. Regression lines (including 95% CIs) and equations derived from linear mixed models (including a random intercept for each participants) with montage as repeated measures factor (equations above each scatterplot) and without (“mean models” equation on the left).
In order to calculate individual e-field strength (|E| in V/m), we extracted equations from the linear mixed model analysis based on the intercept and beta weights for each montage. For the conventional montage “C3”, e.g., the individually induced e-field strength can be calculated using the formula 0.560-0.664*HC/1000 (where HC is the head circumference in dm). As an example: With a HC of 60 cm (= 600 dm), one will have an estimated e-field of 0.560–0.664*0.6 = 0.162 V/m.
Calculation of individual tDCS dose
The equations from the linear mixed model analysis could be used to individualize the dose for a given participant based on the known head circumference (using a rule of three). With regard to the example of conventional montage “C3”, the equation to derive the individualized tDCS current intensity is:
For example, if the participant had an HC of 60 cm (600 mm) and the optimal |E| was assumed to be 0.185 V/m (corresponding here to the mean e-field strength in the target ROI, i.e., the left precentral gyrus), the individualized tDCS intensity should be 1*0.185/(0.56–0.664*0.6) = 1.14 mA. If the applied montage is not one of the above, using the “mean model” formula would result here in an individualized intensity of 1.17 mA (see Supplementary Figure S4 and Supplementary Table S3 for individual doses based on calculations using model-based equations for each montage).
Using individualized tDCS intensity to simulate e-fields
Compared to a fixed stimulation intensity, using this approach to estimate individual stimulation intensities reduces the variability between individuals in the simulated e-fields in large parts of the cortex, see Supplementary Figure S5 and S6.
Discussion
We here propose to use head circumference as a surrogate measure for estimating the inter-individual variability in induced e-field strengths due to variations in head size. Our data shows a robust negative linear relationship between individual head circumference and e-field strength that is stable across different montages.
We observed a slightly stronger relationship for “standard” compared to “4×1” electrode configurations, indicating that this general index of head size may be a better predictor of e-fields induced by conventional montages where fields are distributed over the cortex. For focal montages, it is conceivable that regional parameters such as volume of the brain region or thickness of skin, skull, CSF underneath the electrodes have stronger impact on induced fields. Importantly, however, these sources of variability are not captured by measuring head circumference and it is not clear yet which aspect of head size (including scalp thickness, skull thickness, greater scalp-to-cortex distance etc.) would be most expected to influence the electric field. We provide simple mathematical equations that are straight-forward to implement either for prospective dose planning or during post-hoc analysis in a context where MR data or resources to perform computational modeling analyses are not available.
Using a reverse-calculation modeling approach [4], we calculated individual current intensities based on our regression-derived equations (using the information about head circumference of a particular participant) under the assumption that an optimal “target” intensity may lay around our “observed” e-field strength averaged for a given montage over the group of participants [5]. This approach was able to reduce inter-individual e-field variability in large parts of the cortex by up to 40%.
Our finding based on regression analyses for a given dataset. It is possible that in other datasets (based on different groups of participants varying in their age, sex, etc.), the magnitude of association between anatomical parameters and e-field strength may be different [16]. To be able to draw firm conclusions, the relationship would benefit from being replicated in independent datasets. Future studies still need to show how much variability in the estimated e-field is linked to inter-individual variability in specific behavioral or neurophysiological responses (when compared to a “fixed” intensity applied over a group of participants), as the latter are influenced by several other factors, such as endogenous brain activity during stimulation. Here, head circumference can be valuable in post-hoc analyses, filling a knowledge gap in studies which did not include MR scans. In terms of establishing its value for prospective dose control, a next step could be to individually adjust current intensity based on head circumference in first empirical pilot studies. In this regard, the suggested approach has the advantage of being easily implementable also in large-scale clinical studies.
Likely, the observed relation between field and head circumference will be weaker in stroke patients with large lesions [20]. It will also weaker if the aim is to stimulate highly localized functionally specific regions, as our approach does not account for inter-individual variations in their cortical location.
Conclusions
We introduce an approach to compute individual electric field strengths based on the individual head circumference which may open up the possibility to prospectively individualize tES intensity in empirical studies, e.g., in the clinical context. Head circumference is an easy-to-implement surrogate for head size and may provide a proxy for variability in e-fields, e.g., in post-hoc analyses of studies where no MR data were available. Empirical studies could examine whether head circumference explains variance in tES-induced behavioral and neurophysiological effects, and whether it can be used to lower the variability in the tES responses across participants.
Supplementary Material
Funding
This work was supported by the Bundesministerium für Bildung und Forschung (Grant 01GQ1424A to AF), by the Deutsche Forschungsgemeinschaft (FL 379/24-1 to AF and AN 1103/3-1 to DA) by the Lundbeck foundation (R244-2017-196 and R313-2019-622 to AT) and by the NIH (1RF1MH117428-01A1).
Footnotes
Declaration of competing interest
None.
Publisher's Disclaimer: This is a PDF file of an unedited manuscript that has been accepted for publication. As a service to our customers we are providing this early version of the manuscript. The manuscript will undergo copyediting, typesetting, and review of the resulting proof before it is published in its final form. Please note that during the production process errors may be discovered which could affect the content, and all legal disclaimers that apply to the journal pertain.
References
- [1].Perceval G, Flöel A, Meinzer M. Can transcranial direct current stimulation counteract age-associated functional impairment? Neuroscience & Biobehavioral Reviews 2016;65:157–72. [DOI] [PubMed] [Google Scholar]
- [2].Polania R, Nitsche MA, Ruff CC. Studying and modifying brain function with non-invasive brain stimulation. Nat Neurosci 2018;21(2):174–87. [DOI] [PubMed] [Google Scholar]
- [3].Krause B, Cohen Kadosh R. Not all brains are created equal: the relevance of individual differences in responsiveness to transcranial electrical stimulation. Frontiers in systems neuroscience 2014;8:25. [DOI] [PMC free article] [PubMed] [Google Scholar]
- [4].Caulfield KA, Badran BW, DeVries WH, Summers PM, Kofmehl E, Li X, et al. Transcranial electrical stimulation motor threshold can estimate individualized tDCS dosage from reverse-calculation electric-field modeling. Brain Stimul 2020;13(4):961–9. [DOI] [PMC free article] [PubMed] [Google Scholar]
- [5].Evans C, Bachmann C, Lee JSA, Gregoriou E, Ward N, Bestmann S. Dose-controlled tDCS reduces electric field intensity variability at a cortical target site. Brain Stimul 2020;13(1):125–36. [DOI] [PubMed] [Google Scholar]
- [6].Antonenko D, Thielscher A, Saturnino GB, Aydin S, Ittermann B, Grittner U, et al. Towards precise brain stimulation: Is electric field simulation related to neuromodulation? BrainStimulation 2019;12(5):1159–68. [DOI] [PubMed] [Google Scholar]
- [7].Huang Y, Liu AA, Lafon B, Friedman D, Dayan M, Wang X, et al. Measurements and models of electric fields in the in vivo human brain during transcranial electric stimulation. eLife 2017;6:e18834. [DOI] [PMC free article] [PubMed] [Google Scholar]
- [8].Jamil A, Batsikadze G, Kuo H-I, Meesen RLJ, Dechent P, Paulus W, et al. Current intensity- and polarity-specific online and aftereffects of transcranial direct current stimulation: An fMRI study. Human brain mapping 2019;n/a(n/a). [DOI] [PMC free article] [PubMed] [Google Scholar]
- [9].Indahlastari A, Albizu A, O’Shea A, Forbes MA, Nissim NR,Kraft JN, et al. Modeling transcranial electrical stimulation in the aging brain. Brain Stimulation 2020;13(3):664–74. [DOI] [PMC free article] [PubMed] [Google Scholar]
- [10].Caulfield KA, Indahlastari A, Nissim NR, Lopez JW, Fleischmann HH, Woods AJ, et al. Electric Field Strength From Prefrontal Transcranial Direct Current Stimulation Determines Degree of Working Memory Response: A Potential Application of Reverse-Calculation Modeling? Neuromodulation : journal of the International Neuromodulation Society 2020. [DOI] [PubMed] [Google Scholar]
- [11].Suen PJC, Doll S, Batistuzzo MC, Busatto G, Razza LB, Padberg F, et al. Association between tDCS computational modeling and clinical outcomes in depression: data from the ELECT-TDCS trial. European archives of psychiatry and clinical neuroscience 2021;271(1):101–10. [DOI] [PMC free article] [PubMed] [Google Scholar]
- [12].Thielscher A, Antunes A, Saturnino GB. Field modeling for transcranial magnetic stimulation: A useful tool to understand the physiological effects of TMS? Conference proceedings: Annual International Conference of the IEEE Engineering in Medicine and Biology Society IEEE Engineering in Medicine and Biology Society Annual Conference 2015;2015:222–5. [DOI] [PubMed] [Google Scholar]
- [13].Hartwigsen G, Bergmann TO, Herz DM, Angstmann S, Karabanov A, Raffin E, et al. Modeling the effects of noninvasive transcranial brain stimulation at the biophysical, network, and cognitive level. Prog Brain Res 2015;222:261–87. [DOI] [PubMed] [Google Scholar]
- [14].Saturnino GB, Puonti O, Nielsen JD, Antonenko D, Madsen KH, Thielscher A. SimNIBS2.1: A Comprehensive Pipeline for Individualized Electric Field Modelling for Transcranial Brain Stimulation. In: Makarov S, Horner M, Noetscher G, editors. Brain and Human Body Modeling: Computational Human Modeling at EMBC 2018, Cham: Springer; International Publishing; 2019, p. 3–25. [PubMed] [Google Scholar]
- [15].Antonenko D, Nierhaus T, Meinzer M, Prehn K, Thielscher A, Ittermann B, et al. Age-dependent effects of brain stimulation on network centrality. NeuroImage 2018;176:71–82. [DOI] [PubMed] [Google Scholar]
- [16].Antonenko D, Grittner U, Saturnino G, Nierhaus T, Thielscher A, Flöel A. Inter-individualand age-dependent variability in simulated electric fields induced by conventional transcranial electrical stimulation. NeuroImage 2020;224:117413. [DOI] [PubMed] [Google Scholar]
- [17].Windhoff M, Opitz A, Thielscher A. Electric field calculations in brain stimulation based on finite elements: an optimized processing pipeline for the generation and usage of accurate individual head models. Human brain mapping 2013;34(4):923–35. [DOI] [PMC free article] [PubMed] [Google Scholar]
- [18].Desikan RS, Segonne F, Fischl B, Quinn BT, Dickerson BC, Blacke r D,et al. Anautomated labeling system for subdividing the human cerebral cortex on MRI scans into gyral based regions of interest. NeuroImage 2006;31(3):968–80. [DOI] [PubMed] [Google Scholar]
- [19].RCor eTeam. R: A languag ean denvironment for statistical computing. Vienna, Austria. URL https://www.R-project.org/. R Foundation for Statistical Computing; 2020. [Google Scholar]
- [20].Minjoli S, Saturnino GB, Blicher JU,Stagg CJ,Siebner H R,Antunes A,et al. The impact of large structural brain changes in chronic stroke patients on the electric field caused by transcranial brain stimulation. NeuroImage Clinical 2017;15:106–17. [DOI] [PMC free article] [PubMed] [Google Scholar]
Associated Data
This section collects any data citations, data availability statements, or supplementary materials included in this article.