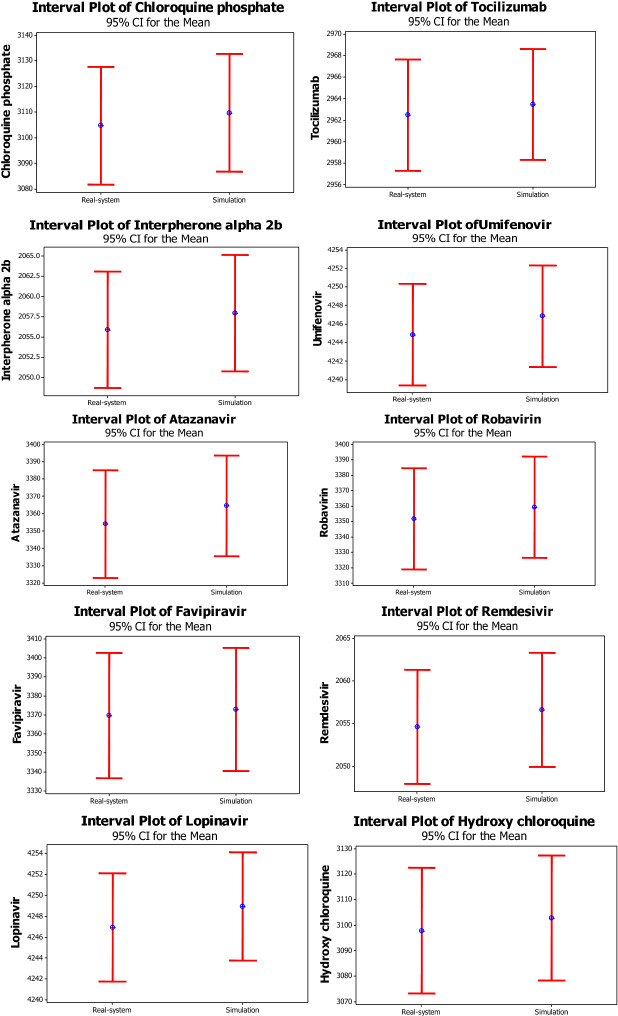
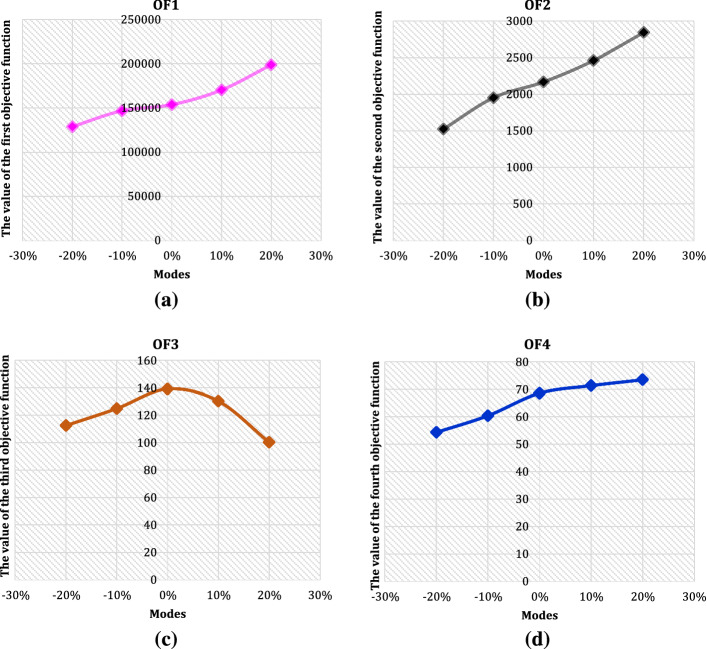
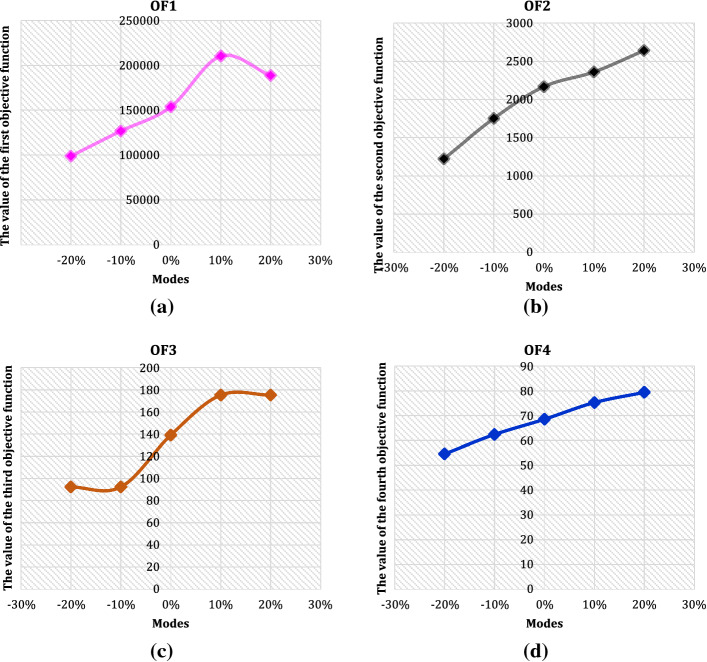
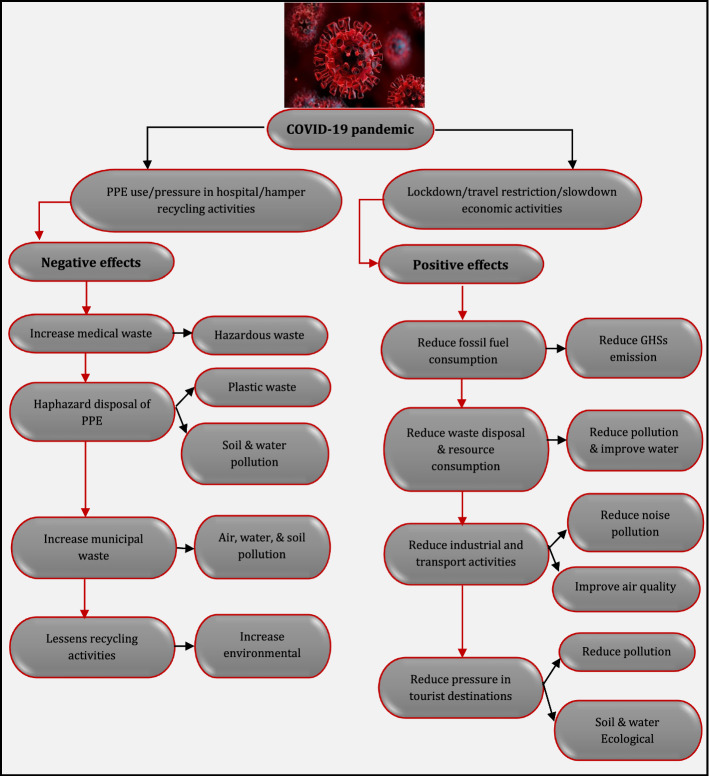
Abstract
In this paper, a new production, allocation, location, inventory holding, distribution, and flow problems for a new sustainable-resilient health care network related to the COVID-19 pandemic under uncertainty is developed that also integrated sustainability aspects and resiliency concepts. Then, a multi-period, multi-product, multi-objective, and multi-echelon mixed-integer linear programming model for the current network is formulated and designed. Formulating a new MILP model to design a sustainable-resilience healthcare network during the COVID-19 pandemic and developing three hybrid meta-heuristic algorithms are among the most important contributions of this research. In order to estimate the values of the required demand for medicines, the simulation approach is employed. To cope with uncertain parameters, stochastic chance-constraint programming is proposed. This paper also proposed three meta-heuristic methods including Multi-Objective Teaching–learning-based optimization (TLBO), Particle Swarm Optimization (PSO), and Genetic Algorithm (GA) to find Pareto solutions. Since heuristic approaches are sensitive to input parameters, the Taguchi approach is suggested to control and tune the parameters. A comparison is performed by using eight assessment metrics to validate the quality of the obtained Pareto frontier by the heuristic methods on the experiment problems. To validate the current model, a set of sensitivity analysis on important parameters and a real case study in the United States are provided. Based on the empirical experimental results, computational time and eight assessment metrics proposed methodology seems to work well for the considered problems. The results show that by raising the transportation costs, the total cost and the environmental impacts of sustainability increased steadily and the trend of the social responsibility of staff rose gradually between − 20 and 0%, but, dropped suddenly from 0 to + 20%. Also in terms of the on-resiliency of the proposed network, the trends climbed slightly and steadily. Applications of this paper can be useful for hospitals, pharmacies, distributors, medicine manufacturers and the Ministry of Health.
Supplementary Information
The online version contains supplementary material available at 10.1007/s10479-021-04238-2.
Keywords: Healthcare network, Sustainability, Resiliency, COVID-19 pandemic, Heuristics
Introduction
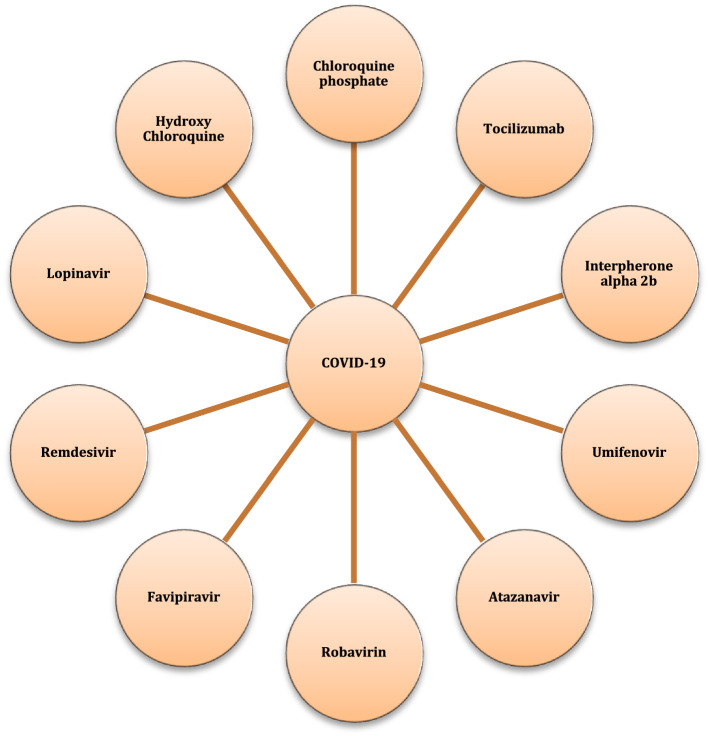
COVID-19 pandemic that is caused by coronavirus 2 (SARS-CoV-2), was identified in December 2019 in Wuhan (China) for the first time and has resulted in the deaths of many people in various countries (Ivanov, 2020). Reports indicate that as of December 6, 2020, 15,318,189, 9,703,908, and 2,295,908 people in the United States, India, and France have been infected, and 290,136, 140,994, and 55,521 people have died in these countries, respectively (World Health Organization, 2020). Various medicines have been recommended to reduce the risk of death from this disease. It should be noted that there is no definitive medicine for the treatment of COVID-19 in the world (Mardani et al., 2020b). At present, antiviral medicines are mainly used to treat this disease, which has a relative effect but is not definitively effective (Nagurney, 2021; Shirazi et al., 2020). The importance of this issue is such that many factories have stopped their activities and started transporting medicines. For example, automobile manufacturer Shanghai-GM-Wuling (SGMW) quickly redesigned its flexible production system to produce medical equipment during the COVID-19 outbreak as the demand for automobile declined whereas it increased drastically for medical equipment (Betti & Ni, 2020). These medicines are usually prescribed and used for patients in the acute phase. Figure 1 indicates the names of the recommended medicines for the relief of COVID-19 patients.
Fig. 1.
The known medicines to relieve COVID-19 patients (Dragojevic Simic et al. 2020)
Moreover, it is necessary to design a supply chain network (SCN) that can monitor the inventory of medicines and can control the flow between members of the supply chain. The location of distribution centers and warehouses in this chain also accelerates the distribution of medicines and causes to minimize total costs. Due to the importance of location, allocation and distribution of medical equipment, many studies have paid attention to it (Salehi-Amiri et al., 2021; Schmidt et al., 2021; Tirkolaee et al., 2021). The importance of the issue becomes clearer when not paying attention to its optimal management can cause a lot of financial and human losses (Valizadeh & Mozafari, 2021). Therefore, determining the optimal location of distribution centers and warehouses, allocating them to hospitals and pharmacies, and determining the optimal number of used vehicles including the strategic measures in the field of medicine supply chain management in the outbreak of the COVID-19 pandemic is considered (Li et al., 2020). It is clear that the uncertainty of demand for various medicines is inherent (Babaeinesami & Ghasemi, 2020). The reason for this is the uncertainty in the number of COVID-19 patients. Hence, the need for an approach that can estimate the medicine demand is felt more than ever (Nikolopoulos et al., 2021).
Sustainability in the SCNs as a new and very influential sector has recently attracted the attention of researchers in the scope of supply chain management (Kaya & Urek, 2016; Mardani et al., 2020a; Sharma et al., 2020; Zhang et al., 2016). In addition to academia scope, communities, governments, businesses, international agencies, and nonprofits are increasingly addressing this issue. Sustainability refers to an appropriate balance of economic, environmental, and social aspects of the SCN (Barbosa-Póvoa et al., 2018). Therefore, in the paper, an attempt has been made to satisfy the economic aspect of sustainability by reducing the costs in the proposed supply chain. Then, no detailed study has been conducted on air pollution to increase the outbreaks of the COVID-19 pandemic. But, since air is associated with respiration, and most of the damage that COVID-19 patients see is from the airways and lungs. Therefore, when the body's oxygen system is disrupted, anything that possibly affects this mechanism can be effective. It should be noted that air pollution can cause more harm to the affected person, but the effect of air pollution on the increase in the outbreak of COVID-19 requires more detailed studies. In this regard, the research has tried to minimize the number of pollutants from the transportation and storage of medicines, as well as the opening of distribution centers and warehouses. One of the main aspects of social responsibility is community participation and development that maximizing job opportunities, as well as balanced economic development, are one of the most important and significant aims of social responsibility. Then, maximizing the employment rate in opening centers and minimizing unemployment including the important goals that should be considered in order to satisfy social responsibility.
Additionally, vulnerability to disorders has increased significantly by increasing complexity and uncertainty in the medicine SCN. Technology malfunctions can cause irreparable damage during an outbreak of the COVID-19 pandemic. Damage to hospital equipment, which is often electronic, could endanger the lives of COVID-19 patients. In order to respond quickly and cost-effectively to such disturbances, effective strategies must be adopted and the concept of resilience in the medicine SCN must be considered. The resilience of the medicine SCN is a capable supply chain to be prepared for unexpected risk events. Then, a resilient supply chain is able to manage to respond and recover quickly to these disruptions by returning to the initial situation/condition, if there is a resilient SCN.
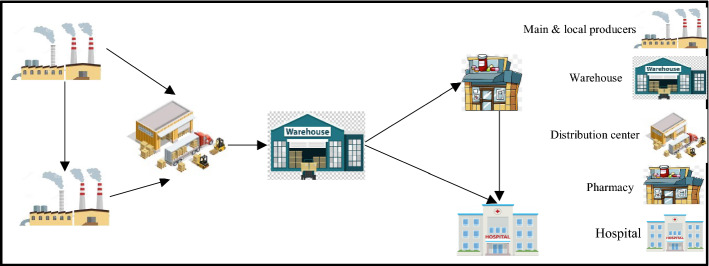
Accordingly, according to the noted considerations to the supply chain network during COVID-19, this research designs sustainable-resilience healthcare network for handling the COVID-19 epidemic that have five echelons including main/local producers, pharmacies, hospitals, warehouses, and distribution centers. The main aim of this paper is to find the best network design according to the three pillars of sustainability and resiliency. The important novelties and contributions that distinguish this paper from current papers are follow as:
Formulating a new MILP model to design a sustainable-resilience healthcare network during the COVID-19 pandemic which aims at optimizing network total costs, environmental aspects, and social effects simultaneously;
Covering the most aspects of social effects in the sustainable healthcare network, which includes balancing service of COVID-19 patients and economic development in the COVID-19 condition simultaneously;
Considering resiliency in the healthcare network that is divided into four assessment metrics in the resiliency concept containing (a) the complexity in the allocation between nodes, (b) the complexity of the node, (c) the criticality of the node, and (d) efficiency;
Providing , , , , , and gasses in the environmental effects simultaneously for the first time;
Developing three hybrid meta-heuristic algorithms called hybrid Teaching–Learning-Based Optimization (TLBO) with Particle Swarm Optimization (PSO) (TLBO-PSO-1 (H-MO-1) and TLBO-PSO-2 (H-MO-2) algorithms) and hybrid TLBO with PSO, and Genetic Algorithm (GA) (TLBO-GA-PSO-3 (H-MO-3) algorithm).
The rest of the paper organized as follows. In Sects. 1 and 2 introduction and literature review are provided. The main purpose of literature review is to determine the research gap and identify research contributions. In Sect. 3, the suggested problem description is explained. Simulation approach is stated in Sect. 4. The main purpose of the simulation is to estimate the amount of medicines needed for patients. Mathematical modeling of SRHCN problem, notations, and resilience concepts are formulated and addressed in Sect. 5. At this section, the location, allocation and distribution of medicines are done. The main purpose of this section is to minimize supply chain costs, environmental impact, non-resiliency and maximize social responsibility. In Sect. 6, solution methodology, multi-objective optimization, and initialize and encoding scheme are illustrated. The main purpose of this section is to determine the value of objective functions and decision variables for the case study. Then, numerical examples and results, assessment metrics, case study, simulation results, and sensitivity analysis are addressed in Sect. 7. In Sect. 8, conclusion of this paper and future works is provided.
Literature review
In this section, recent studies related to the proposed fields in this paper are investigated. In this regard, Mousazadeh et al. (2015) designed a bi-objective multi-period mathematical modeling for a medicine SCN along with minimizing the total costs and unfulfilled demands. To tackle with uncertain parameters, a robust possibilistic programming method is used to solve the location and location problems. Also, to validate their model, a real case study is provided. Savadkoohi et al. (2018) proposed a mathematical model for distribution and inventory control in the medicine SCN. The location of the distribution and production centers along with examining the flow of medicines under the time window was one of their research aims. The possibilistic programming method has been utilized to cope with uncertain parameters. The case study is considered in the supply chain of Iran's National Organization of Food & Drug and the results are shown to minimizing total costs after the implementation of the model. Sabouhi et al. (2018) developed a hybrid method according to the data envelopment analysis (DEA) and mathematical modeling for the pharmaceutical SCN. Therefore, a two-stage possibilistic-stochastic model is presented in order to select suppliers in the supply chain and decrease costs. Considering disruption along with supply chain resilience is one of the contributions of their research. Their results are indicated that increasing demand causes increasing supply chain costs. Zahiri et al. (2018) designed a pharmaceutical SCN under uncertain along with perishability and substitutability of products as well as formulated a bi-objective model. Their main aims were to decrease the total costs and to maximize unmet demands. To tackle with uncertain parameters, a robust possibilistic optimization method is developed. Then, a case study is considered to validate their model. Nematollahi et al. (2018) considered multi-objective coordination a socially responsible medicine supply chain under periodic review replenishment policies. To obtain the Pareto optimal solutions, the augmented Epsilon-constraint method is employed. Nasrollahi and Razmi (2019) formulated a multi-period mathematical model to design an integrated pharmaceutical SCN. Maximizing coverage and supply chain reliability by considering medicine replacement rates were one of the most important goals of their research. Their proposed supply chain included manufacturers, hospital distributors, and patients. NSGA-II and MOPSO algorithms have been utilized for solving their model. The results of the case study indicate an increase in the reliability of the proposed supply chain. Then, a multi-objective and bi-level mathematical model for the distribution of relief commodities in crisis situations is designed by Roshan et al. (2019). Considering the perishability and substitutability of medicines is one of the contributions of their research. Maximizing social satisfaction and securing unsatisfied demand due to the breakdown of distribution centers in crisis conditions has been one of the most important goals of their model. The case study is in Seattle, USA and the Augmecon-2 method is used to solve it.
Weraikat et al. (2019) developed a mathematical model of distribution management and inventory control of pharmaceutical products. Minimizing spoiled medicine in hospitals and minimizing government penalties for environmental pollution during medicine manufacturing were their most important goals. Considering sustainability with the implementation of Vendor-Managed Inventory (VMI) system customization was one of the contributions of their model. Finally, various examples are generated by Monte-Carlo simulations, and the outcomes show a reduction in supply chain costs of up to 19%. Thus, a multi-objective, multi-commodity, and multi-period model for production and distribution in the pharmaceutical SCN is developed by Goodarzian et al. (2020a). In their model, ordering, purchasing, and delivery costs had fuzzy-robust uncertainty. The main purposes of their proposed model were to decrease the whole cost and delivery time of medicines and increase the reliability of the vehicles in the proposed chain. To solve the proposed model, several multi-objective meta-heuristic algorithms have been used and compared with each other. Goodarzian et al. (2020b) developed a multi-objective sustainable medicine SCN that their main aims were to minimize economic and environmental aspects and maximize social impacts. To solve their model, a hybrid meta-heuristic algorithm is developed as well as to control and tune the parameters, the Taguchi method is used. Shamsuzzoha et al. (2020) presented mathematical modeling for distributing medicine from distributors to wholesalers. The main purpose of their model is to minimize environmental pollutants and distribution costs. Considering supply chain sustainability was one of their research contributions. Their results show that with increasing demand for medicines, transportation system costs and the released amount of CO2 will increase sharply. A decentralized and centralized mathematical model to minimize costs in the pharmaceutical SCN is presented by Tat et al. (2020). The main goal of their paper is to minimize waste costs and government penalties for medicine suppliers. Considering resilience and cooperation between supply chain components was one of the contributions of their model. Finally, solving numerical examples has proven the correctness of the solution approach performance. Zandkarimkhani et al. (2020) designed a two-objective model for designing the pharmaceutical SCN under uncertainty. Then, considering demand as a fuzzy parameter and considering location, routing and inventory control simultaneously were among their research contributions. Their main goal was to decrease supply chain costs with unsatisfied demand. To solve their presented model, the hybrid approach of goal programming and chance constrained programming has been used. Their outcomes show the suitable efficiency of their presented model for a case study in Tehran/Iran. Two stochastic simulation–optimization models for strategic and operational decisions in the pharmaceutical supply chain is presented by Franco and Alfonso-Lizarazo (2020). In their first model, the time of medicine perishable and service level and in their second model, inventory control of medicine is considered. The main purpose of their proposed models was to decrease supply chain costs while decreasing the amount of perishable medicine. Their proposed model was finally solved for a numerical example with 22 types of medicines by the Epsilon-constrained approach.
Rastegar et al. (2021) proposed an inventory-location MILP model for equitable influenza vaccine distribution during the COVID-19 epidemic in developing countries. They considered an equitable objective function to distribute vaccines to critical healthcare providers and first responders, pregnant women, the elderly, and those with underlying health conditions in their model. Finally, they suggested a real case study to show the performance of their model's applicability. Tavana et al. (2021) formulated an MILP model for equitable COVID-19 vaccine distribution. They considered vaccines in different groups including cold, very cold, and ultra-cold. Additionally, budgetary considerations, manufacturer selection, the possibility of storage for future periods, time-dependent capacities, the grouping of the heterogeneous population, order allocation, and facing a shortage were considered as the assumptions in their approach. To indicate the application of their model, a real case study was suggested. Goodarzian et al. (2021c) designed a multi-echelon, multi-objective, multi-product, and multi-period mathematical model for a sustainable medical supply chain network during COVID-19 pandemic. To solve their model, they suggested three meta-heuristic algorithms called fish swarm algorithm, firefly algorithm, and ant colony optimization and hybridized with variable neighborhood search. The response surface approach was used to tune the algorithm's parameters. Finally, to demonstrate the efficiency and effectiveness of their model, a case study was provided in Tehran/Iran. Babaee Tirkolaee and Aydın (2021) investigated the sustainable medical waste management problem during the COVID-19 epidemic. Hence, they designed test problems with various sizes and solved them using a CPLEX solver. Finally, they discussed the practical implications of utilizing the sensitivity analysis of demand parameters and compared various conditions. Goodarzian et al. (2021b) proposed a new pharmaceutical supply chain network to decrease the total cost and the delivery time and maximize the reliability of the transportation system. They formulated an MILP model for the production-allocation-distribution-inventory-ordering-routing problem. To solve their model, some heuristic methods and meta-heuristic algorithms were provided. To evaluate their model, they presented extensive simulation experiments by analyzing various metrics. Goodarzian et al. (2021a) developed a green medicine supply chain network under uncertainty for allocation, location, production, distribution, routing, inventory, and purchasing decisions. To cope with uncertain parameters, fuzzy method was used. Then, meta-heuristic algorithms were utilized containing social engineering optimization, improved kill herd, improved social spider optimization, and hybrid whale optimization with simulated annealing to solve their model. In this regard, two new hybrid meta-heuristics called hybrid firefly algorithm and simulated annealing and hybrid firefly algorithm and social engineering optimization to solve their model for the first time were developed. They provided a set of simulated data in two sizes to indicate the applicability of their paper (Table 1).
Table 1.
The details of the literature review
| Author | Type of model | Solution procedure | Type of Optimization model | Decision level | |||||||||
|---|---|---|---|---|---|---|---|---|---|---|---|---|---|
| Optimization | Simulation | Exact | Heuristic | Meta-Heuristic | Deterministic | Uncertainty | Location | Inventory | Routing | Allocation | Flow | Distribution | |
| Mousazadeh et al. (2015) | x | x | x | x | |||||||||
| Sabouhi et al. (2018) | x | x | x | x | x | ||||||||
| Savadkoohi et al.(2018) | x | x | x | x | x | x | |||||||
| Zahiri et al. (2018) | x | x | x | x | |||||||||
| Nematollahi et al. (2018) | x | x | x | ||||||||||
| Roshan et al. (2019) | x | x | x | x | x | x | |||||||
| Nasrollahi and Razmi (2019) | x | X | x | x | |||||||||
| Franco and Alfonso-Lizarazo (2020) | x | x | x | x | x | ||||||||
| Zandkarimkhani et al. (2020) | x | x | x | x | x | ||||||||
| Tat et al. (2020) | x | x | x | x | |||||||||
| Shamsuzzoha et al.(2020) | x | x | x | x | x | ||||||||
| Goodarzian et al. (2020a) | x | X | x | x | x | x | |||||||
| Goodarzian et al. (2020b) | x | X | x | x | |||||||||
| Weraikat et al. (2020) | x | x | x | x | x | ||||||||
| Rastegar et al. (2021) | x | x | x | x | |||||||||
| Tavana et al. (2021) | x | x | x | x | x | ||||||||
| Goodarzian et al. (2021c) | x | x | x | X | x | x | x | x | |||||
| Babaee Tirkolaee and Aydın (2021) | |||||||||||||
| Goodarzian et al. (2021b) | x | x | x | x | x | x | x | x | |||||
| Goodarzian et al. (2021a) | x | x | x | x | x | x | x | x | |||||
| Current research | x | x | x | X | x | x | x | x | x | x | |||
| Author | Commodity | Period | Echelon number | Supply chain characteristics | Case type | ||||||
|---|---|---|---|---|---|---|---|---|---|---|---|
| Single | Multi | Single | Multi | Single | Multi | Sustainability | Resilience | Fuel consumption | Numerical Example | Original case study | |
| Mousazadeh et al. (2015) | x | x | x | ||||||||
| Sabouhi et al. (2018) | x | x | x | x | x | ||||||
| Savadkoohi et al.(2018) | x | x | x | x | |||||||
| Zahiri et al. (2018) | x | x | x | x | |||||||
| Nematollahi et al. (2018) | x | x | x | x | |||||||
| Roshan et al. (2019) | x | x | x | x | x | ||||||
| Nasrollahi and Razmi (2019) | x | x | x | x | |||||||
| Franco and Alfonso-Lizarazo (2020) | x | x | x | x | |||||||
| Zandkarimkhani et al. (2020) | x | x | x | x | x | ||||||
| Tat et al. (2020) | x | x | x | x | x | ||||||
| Shamsuzzoha et al.(2020) | x | x | x | x | x | ||||||
| Goodarzian et al. (2020a) | x | x | x | x | |||||||
| Goodarzian et al. (2020b) | x | x | x | x | x | ||||||
| Weraikat et al. (2020) | x | x | x | x | |||||||
| Rastegar et al. (2021) | x | x | x | x | |||||||
| Tavana et al. (2021) | x | x | x | x | |||||||
| Goodarzian et al. (2021c) | x | x | x | x | x | x | |||||
| Babaee Tirkolaee and Aydın (2021) | |||||||||||
| Goodarzian et al. (2021b) | x | x | x | x | |||||||
| Goodarzian et al. (2021a) | x | x | x | x | |||||||
| Current research | x | x | x | x | x | x | x | x | |||
According to the literature review table, it can be seen that a comprehensive study to estimate the amount of medicine during the outbreak of COVID- 19 has not been done so far. Also, the structure of the dynamic system of COVID-19 outbreak has not been comprehensively analyzed. In addition, uncertain models that simultaneously focus on the location, allocation, distribution, and inventory control of COVID-19 medicines have received less attention. Considering resilience and sustainability at the same time is one of the ideas that have not been explored during the COVID-19. Paying attention to these two issues can bring the problem closer to the real world. Finally, the lack of attention to hybrid solution approaches that converge with less CPU time and higher quality is one of the other research gaps in this paper. Therefore, in this paper, a new production, allocation, location, inventory control, and distribution problems for a new Sustainable-Resilient Health Care Network (SRHCN) related to the COVID-19 patients under uncertainty is developed. Additionally, a new multi-objective multi-period multi-level multi-commodity Mixed-Integer Linear Programming (MILP) mathematical modeling is formulated in order to the allocation of the distribution centers and warehouses, the management of the medicine distribution and inventory, and the control of the medicine flows. One of the important novelties of this paper is the hybridization sustainability and resilience concepts in the health care network. The main pillars of sustainability are economic, environmental, and social aspects are considered. In terms of the economic impacts, the aim is minimizing total transportation cost form main producer and local producer to distribution center, from distribution center to warehouse, and from warehouse to hospital and pharmacy along with related to the emission costs, operating cost in the distribution center and warehouse, inventory holding cost of medicines relevant to COVID-19 patients along with emission cost, and the opening fixed costs of medicines related to COVID-19 patients warehouses and distribution centers considering resilient. Then, the second contribution in this paper is considering resilience in the opening fixed costs. In terms of the environmental aspects, air pollutants cause spread quickly in the air during the COVID-19 pandemic. Because of this, , , , , , and through industrial emissions, transport, car exhaust, hospitals, fuel burning, exhaust gases, mechanical processes, plants (main and local producers) pharmacies, the opening of the medicine warehouses, and biological process (viruses and bacteria) which causes the greenhouse effect, respiratory diseases, eye and skin irritation, headache, loss of consciousness, confusion, cough, nausea, dizziness, risk of respiratory infections, asthma, heart attack, decreased lung function, and premature death that are provided as other important novelty and are used these gasses simultaneously for the first time in this research. Hence, social effects divided into balanced service of COVID-19 patients and balanced economic development simultaneously that considering two concepts of the social aspects simultaneously is another contribution in this paper. One other important novelty is related to resiliency that four-assessment metrics in the resiliency concept are considered including (i) the complexity in the allocation between nodes, (ii) the complexity of the node, (iii) the criticality of the node, and (iv) efficiency for the first time. Additionally, for estimating the amount of the needed demand is used a simulation approach. The estimated demand distribution function enters the mathematical modeling as a parameter called a simulation–optimization approach. To tackle with uncertain parameters, stochastic chance constraint programming method is employed. The other significant contribution in solution methodology, to solve the presented stochastic model, three heuristic methods based on meta-heuristic algorithms called hybrid Teaching–Learning-Based Optimization (TLBO) with Particle Swarm Optimization (PSO) (TLBO-PSO-1 (H-MO-1) and TLBO-PSO-2 (H-MO-2) algorithms) and hybrid TLBO, PSO, and Genetic Algorithm (GA) (TLBO-GA-PSO-3 (H-MO-3) algorithm) are developed for the first time in this research. Taguchi approach is utilized to control and tune the heuristic parameters. As there is not any benchmark function in the literature, some test problems are generated randomly. In order to validate the heuristic methods, the eight-assessment metrics are stated containing Mean Ideal Distance (MID), Quality Metric (QM), Spread of Non-Dominance Solution (SNS), Hyper Volume (HV), Number of Pareto Solution (NPS), Inverted Generational Distance (IGD), Maximum Spread (MS), and Spacing Metric (SM). Several sensitivity analyses on important parameters and real case study in United States are described to validate the proposed model.
Problem description
The main problem during the outbreak of COVID-19 is the logistics and distribution of medicine to patients. Also, the location of distribution centers and the allocation of pharmacies, warehouses, distribution centers to hospitals have always been among the concerns of decision makers. Simultaneous attention to the optimal allocation, location and distribution of medicines can reduce the loss of life of patients. Also, due to the increasing demand for medicines during the outbreak of COVID-19, estimating the amount of medicines can reduce costs and provide faster service to patients and prevent medicine shortages. Therefore, in this paper, a new mathematical model of the production-allocation-inventory control-location-distribution problem considering carbon emissions among health care network members and air pollutants for Sustainable-Resilient Health Care Network (SRHCN) related to the COVID-19 patients is developed. In this regard, the SRHCN has various levels includes main and local producers (MP and LP), hospital, pharmacy, distribution center (DC), warehouse along with COVID-19 patients. Here, a Mixed Integer Linear Programming (MILP) model for calculating the total optimal cost with emissions, according to the transportation, production, distribution, operating, fixed cost of opening, and inventory holding costs (economic aspects), to minimize CO2 emission through transportation systems for shipping medicines and COVID-19 patients, environmental impacts of opening facilities (main and local producers, warehouse, DC, pharmacy, and hospital) and inventory holding (environmental effects), and to maximize the social responsibility of staff related to the COVID-19 patients that it is divided into two categories, firstly, balanced service of COVID-19 patients, and secondly, balanced economic development (social effects) is developed. Here, the balance of generated job opportunities in various regions will be warranted according to the number of generated job opportunities for each opening a center (DC and warehouse) in a region is multiplied by the rate of regional unemployment. The number of generated job opportunities for each opening a center is dependent on the capacity and the sort of centers. In this regard, in terms of balanced economic development, opening centers in the less developed regions centers the generation of balance in economic development. Consequently, the less the regional development level of a location is, the more significant opening a center in this location will be in terms of social and economic development. Air pollution is one of the most significant health and environmental issues in the world. The main goal of this paper in the social (health) and environmental impacts is to specify the change in air quality during the COVID-19 pandemic outbreak based on daily recorded data. Also, there is a high number of air pollutants causes be risk environmental and health effects during the COVID-19 pandemic (Jánošová, 2020). Air pollutants include Nitric Oxide , Cyclohexatriene (, Carbon monoxide (, Sulfur dioxide (, nitrogen dioxide , and Particulate Matter () through industrial emissions, transport, car exhaust, hospitals, fuel burning, exhaust gases, mechanical processes, plants (main and local producers) pharmacies, opening of the medicine warehouses, and biological process (viruses and bacteria) which causes greenhouse effect, respiratory diseases, eye and skin irritation, headache, loss of consciousness, confusion, cough, nausea, dizziness, risk of respiratory infections, asthma, heart attack, decreased lung function, and premature death. Several time periods are considered in the planning horizon. In terms of resiliency, the various assessment metrics of resilience have been extended and provided in the suggested mathematical model that the important focus has on the opening and production aspects in the presented network. This causes the proposed network more reliable against any type of complexity and efficiency at the warehouses and DCs during the COVID-19 pandemic. In any case, this guarantees to organize the existing demand in this network. More information about these metrics is stated in Sect. 5.2. In the warehouses, there are only medicines related to COVID-19 patients, also producers are produced only medicines relevant to COVID-19 patients, and DCs are distributed only medicines related to COVID-19 patients. Additionally, only hospitals that are assigned to the COVID-19 patients are considered. Only one warehouse of medicines relevant COVID-19 patients is allocated to each pharmacy and hospital, only one main and local producers are assigned to each warehouse and DC, and also only one pharmacy is devoted to each hospital. In addition, there are a flow between main and local producers. Additionally, capacity levels divided into three groups: small, medium, and large.
During the medicine shipping process, the amount of needed medicines (medicine demand) for each COVID-19 patients and transportation, production, and purchasing costs are considered as uncertain parameters. In this regard, to cope with uncertain parameters, a stochastic programming approach is developed for the first time in this paper for SRHCN. This paper addresses the joint resilient MP, LP, warehouse, DC, hospital, and pharmacy opening and sustainability health care network design problem considering both carbon emissions and air pollutants during COVID-19 pandemic condition. Three capacity sorts for DCs, warehouses, pharmacies, hospitals, MPs, and LPs are considered to contain small, medium, and large in this paper. It should be noted that the amount of demand for required medicines at the time of the outbreak of COVID-19 is an uncertain parameter. Therefore, a simulation approach is employed to determine the value of the required medicines distribution function. In this regard, the estimated distribution functions enter the mathematical model as a parameter after estimating the amount of demand. This approach is called a simulation–optimization method. Figure 2 displays a framework of the SRHCN related to the COVID-19 patients.
Fig. 2.
The framework of the presented SRHCN related to the COVID-19 patients
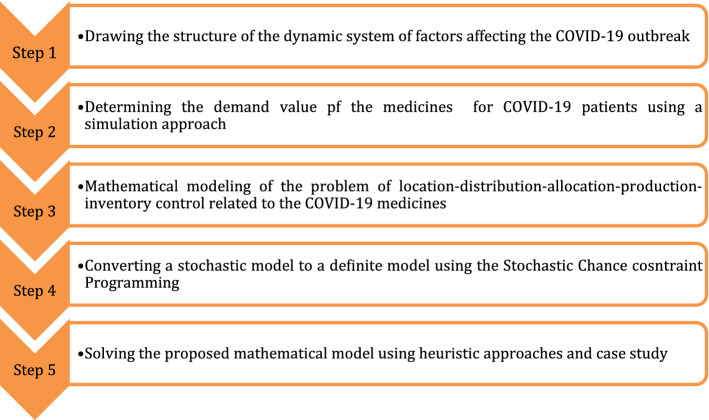
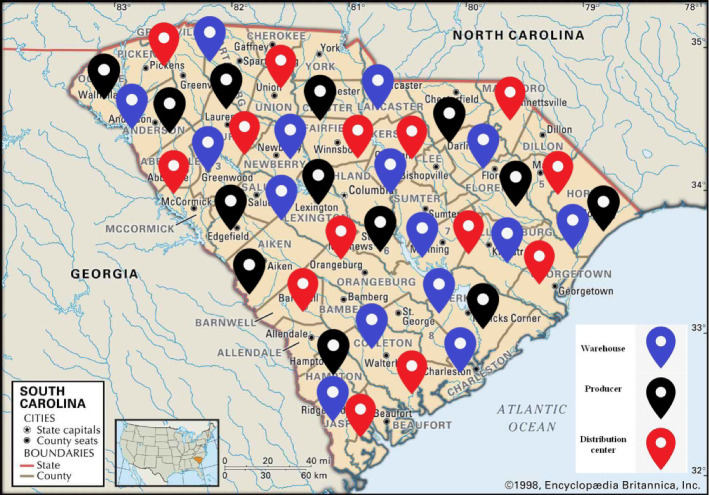
Figure 3 shows the used framework for this paper. In the first step, the structure of the dynamic system of how the prevalence of COVID-19 is drawn to estimate the number of patients. In the second step, the amount of demand for required medicines is estimated by the simulation approach. Then, the next step, a multi-level, multi-objective, multi-period, and multi-commodity mathematical model for a location, allocation, distribution, production, and inventory control problem are developed. In the fourth step, the proposed stochastic model is transformed into a definitive model by the stochastic chance constraint approach. Eventually, the suggested model is solved by using heuristic approaches based on meta-heuristic algorithms for a case study in South Carolina in United States.
Fig. 3.
The used framework for this research
Simulation approach
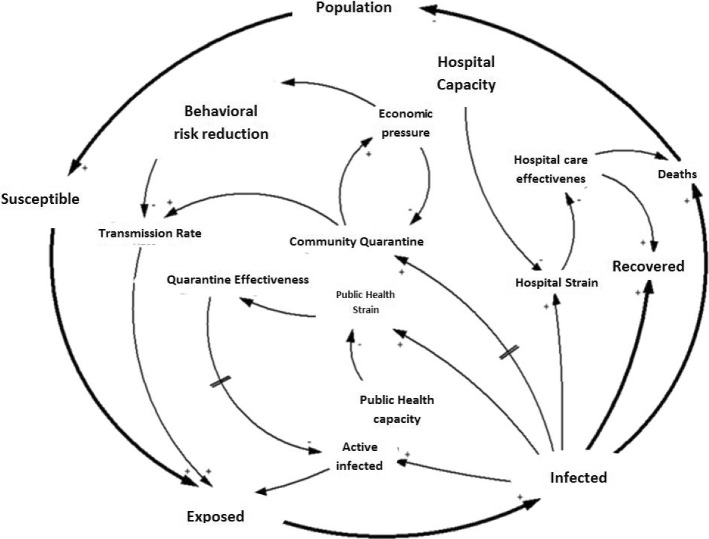
The structure of the considered dynamic system in this study is shown in Fig. 4. It is clear that the "susceptible" population can be "infected" by being "exposed" to the disease. There is a possibility of death in terms of mortality rate. Patients can also "recover" in terms of recovery rate. The number of patients also depends on "community quarantine" and "public health capacity". As the "quarantine effectiveness" increases, the number of "active infected" decreases. But increasing "behavioral risk" can increase the "transmission rate" and this will make them more exposed to COVID-19. After determining the structure of the dynamic system of the spread of COVID-19, the proposed structure is simulated.
Fig. 4.
The structure of the considered dynamic system
The proposed structure simulation is performed by Enterprise Dynamic (ED) software. ED software is one of the most powerful and widely used simulation platforms for Discrete Event Simulation. This software can optimize the problems of logistics, scheduling, inventory, etc. using atoms, 4DScript codes, and its digital library. Many successful applications of this software have been reported (Ghasemi et al., 2020).
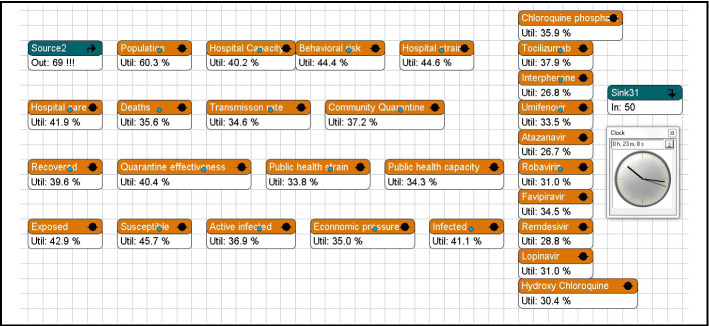
In this research, 29 atoms have been used to simulate the proposed structure including source atoms, 1 sink atom, and 27 server atoms, which is indicated in Fig. 5. There are also 10 servers to estimate the amount of distribution function of 10 types of medicines. The observation time is equal to 1,000,000 h and the warm-up period is equal to 100,000 h and the simulation type is considered as a separate run. The warm up period is the time that the simulation will run before starting to collect results (Law, 2020). This allows the Queues (and other aspects in the simulation) to get into conditions that are typical of normal running conditions in the simulated system (Grassmann, 2014). Related Performance Measure (PFM) has been used to estimate the demand distribution functions. In this study, AvgContent (cs) was used as a PFM. This PFM specifies the average amount of inputs per atom and can provide a good estimate of the amount of needed medicines.
Fig. 5.
The used atoms to simulate the proposed structure
Estimation of the number of infected people occurs in the infected atom. After estimating the number of infected people, the amount of needed medicine for each person is estimated. So, the 4D Script code for this atom is equal to:
Mathematical modeling of the SRHCN problem
The assumptions are as follows:
The demand for medicines is probabilistic and is estimated by simulation.
The mathematical model is multi-commodity, multi echelon, multi-period and multi-product.
In the mathematical model, distribution centers are located. Selected distribution centers are selected from potential centers.
The capacity of distribution centers, warehouses, pharmacies, hospitals and manufacturers is considered as three capacities: small, medium and large.
Notations
Some commonly employed notations are offered before the model making.
Indices and sets
| Set of pharmacy | |
| Set of all vehicles | |
| Set of distribution center | |
| Set of warehouse | |
| Set of hospital | |
| Set of main and local producers | |
| Index of medicines | |
| Index of period (day) | |
| Index of the capacity level of DC | |
| Index of the capacity level of warehouse | |
| Index of the capacity level of pharmacy | |
| Index of the capacity level of hospital | |
| Index of the capacity level of main and local producers |
Parameters
| Demand of medicine from warehouse by hospitals at the period | |
| Demand of medicine from warehouse by pharmacies at the period | |
| Demand of medicine from pharmacies by hospitals at the period | |
| Demand of medicine from DC by MP at the period | |
| Demand of medicine from DC by LP at the period | |
| Demand of medicine from DC by warehouse at the period | |
| Demand of medicine from MP by LP at the period | |
| Operating cost at the DC at the period | |
| Operating cost at the warehouse at the period | |
| Inventory holding cost of medicines at the MP at the period | |
| Inventory holding cost of medicines at the LP at the period | |
| Inventory holding cost of medicines at the warehouse at the period | |
| Inventory holding cost of medicines at the DC at the period | |
| Inventory holding cost of medicines at the pharmacy at the period | |
| Inventory holding cost of medicines at the hospital at the period | |
| Transportation cost of medicines from MP to DC at the period | |
| Transportation cost of medicines from LP to DC at the period | |
| Transportation cost of medicines from MP to LP at the period | |
| Transportation cost of medicines from DC to warehouses at the period | |
| Transportation cost of medicines from warehouse to pharmacy at the period | |
| Transportation cost of medicines from warehouse to hospitals at the period | |
| Transportation cost of medicines from pharmacy to hospitals at the period | |
| The fixed cost of opening warehouse with capacity level at location at the period | |
| The fixed cost of opening DC with capacity level at location at the period | |
| Production cost of medicine in the MP at the period | |
| Production cost of medicine in the LP at the period | |
| Fixed emissions based on transportation of medicines related to COVID-19 patients from MP | |
| Variable emissions based on transportation of medicines related to COVID-19 patients from MP | |
| Fixed emissions based on transportation of medicines related to COVID-19 patients from LP | |
| Fixed emissions based on transportation of medicines related to COVID-19 patients from LP | |
| Fixed emissions based on transportation of medicines related to COVID-19 patients from warehouse | |
| Variable emissions based on transportation of medicines related to COVID-19 patients from warehouse | |
| Fixed emissions based on transportation of medicines related to COVID-19 patients from pharmacy | |
| Variable emissions based on transportation of medicines related to COVID-19 patients from pharmacy | |
| Fixed emissions based on transportation of medicines related to COVID-19 patients from DC | |
| Variable emissions based on transportation of medicines related to COVID-19 patients from DC | |
| Distance between MP and DC | |
| Distance between LP and DC | |
| Distance between MP and LP | |
| Distance between DC and warehouse | |
| Distance between warehouse and hospital | |
| Distance between warehouse and pharmacy | |
| Distance between pharmacy and hospital | |
| Emissions based on inventory at the warehouse | |
| Emissions based on inventory at the MP | |
| Emissions based on inventory at the LP | |
| Emissions based on inventory at the DC - | |
| Emissions based on inventory at the hospital | |
| Emissions based on inventory at the pharmacy | |
| The released CO2 emission of transported medicines from DC to warehouse by vehicle | |
| The released CO2 emission of transported medicines from MP to DC by vehicle | |
| The released CO2 emission of transported medicines from LP to DC by vehicle | |
| The released CO2 emission of transported medicines from MP to LP by vehicle | |
| The released CO2 emission of transported medicines from warehouse to hospital by vehicle | |
| The released CO2 emission of transported medicines from warehouse to pharmacy by vehicle | |
| The released CO2 emission of transported medicines from pharmacy to hospital by vehicle | |
| The environmental aspect of opening a warehouse with capacity level at location at period | |
| The environmental aspect of opening a DC with capacity level at location at period | |
| The environmental aspect of holding medicines at MP at period | |
| The environmental aspect of holding medicines at LP at period | |
| The environmental aspect of holding medicines at warehouse at period | |
| The environmental aspect of holding medicines at DC at period | |
| The environmental aspect of holding medicines at pharmacy at period | |
| The environmental aspect of holding medicines at hospital at period | |
| The number of job opportunities created by opening a warehouse with capacity level at location | |
| The number of job opportunities created by opening a DC with capacity level at location | |
| The rate of unemployment at warehouse | |
| The rate of unemployment at DC | |
| The regional of developed level at warehouse | |
| The regional of developed level at DC | |
| The maximum of social aspect relevant to the balanced service of COVID-19 patients | |
| The maximum of social aspect relevant to the balanced economic development | |
| The minimum of social aspect relevant to the balanced service of COVID-19 patients | |
| The minimum of social aspect relevant to the balanced economic development | |
| The weight of social aspect relevant to the balanced service of COVID-19 patients | |
| The weight of social aspect relevant to the balanced economic development | |
| The rate of minimum capacity utilization of MP | |
| The rate of minimum capacity utilization of LP | |
| The rate of minimum capacity utilization of DC | |
| The rate of minimum capacity utilization of warehouse | |
| The rate of minimum capacity utilization of pharmacy | |
| The rate of minimum capacity utilization of hospital | |
| The capacity of maximum medicine of MP with capacity level at period (ton) | |
| The capacity of maximum medicine of LP with capacity level at period (ton) | |
| The capacity of maximum medicine of DC with capacity level at period (ton) | |
| The capacity of maximum medicine of warehouse with capacity level at period (ton) | |
| The capacity of maximum medicine of pharmacy with capacity level at period (ton) | |
| The capacity of maximum medicine of hospital with capacity level at period (ton) | |
| The released through transport | |
| The released through car exhaust | |
| The released through car exhaust and the opening of the medicine warehouses, DCs | |
| The released through fuel burning | |
| The released through exhaust gases, transport, mechanical processes, biological processes | |
| The economic value of warehouse with capacity level | |
| The economic value of DC with capacity level | |
| Efficiency of warehouse | |
| Efficiency of DC | |
| The coefficient of penalty for the first metrics of resilience among warehouse and pharmacy | |
| The coefficient of penalty for the first metrics of resilience among warehouse and hospital | |
| The coefficient of penalty for the first metrics of resilience among DC and warehouse | |
| The coefficient of penalty for the first metrics of resilience among MP and DC | |
| The coefficient of penalty for the first metrics of resilience among LP and DC | |
| The coefficient of penalty for the second metrics of resilience of DCs | |
| The coefficient of penalty for the second metrics of resilience of warehouses | |
| The coefficient of penalty for the third metrics of resilience of DCs | |
| The coefficient of penalty for the third metrics of resilience of warehouses |
Decision variables
| The quantity of transported medicines from DC to warehouse using vehicle at the period | |
| The quantity of transported medicines from MP to DC using vehicle at the period | |
| The quantity of transported medicines from LP to DC using vehicle at the period | |
| The quantity of transported medicines from MP to LP using vehicle at the period | |
| The quantity of transported medicines from warehouse to hospital using vehicle at the period | |
| The quantity of transported medicines from warehouse to pharmacy using vehicle at the period | |
| The quantity of transported medicines from pharmacy to hospital using vehicle at the period | |
| The amount of produced medicines in the MP at the period | |
| The amount of produced medicines in the LP at the period | |
| The inventory level of medicines at MP at the period | |
| The inventory level of medicines at LP at the period | |
| The inventory level of medicines at warehouse at the period | |
| The inventory level of medicines at DC at the period | |
| The inventory level of medicines at pharmacy at the period | |
| The inventory level of medicines at hospital at the period | |
| If the vehicle travels from DC to warehouse equal to 1 at the period ; otherwise 0 | |
| If the vehicle travels from MP to DC equal to 1 at the period ; otherwise 0 | |
| If the vehicle travels from LP to DC equal to 1 at the period ; otherwise 0 | |
| If the vehicle travels from MP to LP equal to 1 at the period ; otherwise 0 | |
| If the vehicle travels from warehouse to pharmacy equal to 1 at the period ; otherwise 0 | |
| If the vehicle travels from pharmacy to hospital equal to 1 at the period ; otherwise 0 | |
| If the vehicle travels from warehouse to hospital equal to 1 at the period ; otherwise 0 | |
| If a warehouse with capacity level is opened at location equal to 1; otherwise 0 | |
| If a DC with capacity level is opened at location equal to 1; otherwise 0 | |
| If a warehouse is allocated to pharmacy at the period equal to 1; otherwise 0 | |
| If a warehouse is allocated to hospital at the period equal to 1; otherwise 0 | |
| If a DC is allocated to warehouse at the period equal to 1; otherwise 0 | |
| If a MP is allocated to DC at the period equal to 1; otherwise 0 | |
| If a LP is allocated to DC at the period equal to 1; otherwise 0 |
Metrics of resilience in SRHCN
Since the resiliency metrics of a network are still arguable, the following four metrics are provided.
The first metric: the complexity in the allocation between nodes
This metric computes the total interaction between levels in the network, where the first and second terms related to the allocation of warehouses to pharmacies and hospitals, respectively, the third term indicates the assignment of DCs to warehouses, the fourth term relevant to the allocation of MPs to DCs and the final term illustrates to the assignment of LPs to DCs. The flow allocation between nodes in the proposed network is considered to be complex if the total number of related links is numerous based on the first metric. The total number of links in the network is computed in Eqs. (1) and (2).
| 1 |
| 2 |
The second metric: the complexity of the node
In this metric, similar the first metric, if the total number of active nodes is high, we will have a network with the complexity of the node. Hence, the total number of opening DC and warehouse in the network are formulated according to Eqs. (3) and (4).
| 3 |
| 4 |
The third metric: the criticality of the node
Since the whole input and output overpass a certain threshold in the network, a node is investigated to be critical. The nodes of the critical for DCs and warehouse, respectively are illustrated in Eqs. (5)-(7).
| 5 |
| 6 |
| 7 |
The fourth metric: the efficiency in the DCs and warehouses
Despite the significance of DCs and warehouses in the resiliency of the proposed network, the utilize of the related to efficiency metrics for the opening of the DCs and warehouses has not been widely examined in the related works.
MILP model
The MILP model can be formulated as:
| 8 |
| 9 |
| 10 |
| 11 |
The first objective function (8) is considered economic effects that aim to minimize total transportation cost from MP and LP to DC, from DC to warehouse, and from warehouse to hospital and pharmacy along with its related emission cost, operating cost in DC and warehouse, inventory holding cost of medicines relevant to COVID-19 patients along with emission cost, and the opening fixed costs of medicine related COVID-19 patients warehouses and DCs considering resilient. The second objective function (9) is focused on the environmental impacts of sustainability, in which this function decreases the amount of CO2 emission of shipping medicines from MP and LP to DCs, from DCs to warehouses, from warehouses to hospitals and pharmacies, and from pharmacies to hospitals and the environmental aspects of opening facilities include opening medicines related to COVID-19 patients' warehouses and DCs. Next, environmental effects of holding inventory contain environmental impacts of holding medicines at MPs, LPs, warehouses, DCs, pharmacies and hospitals. In addition, the air pollutants include , , , , , and are obtained through industrial emissions, transport, car exhaust, hospitals, fuel burning, exhaust gases, mechanical processes, pharmacies, the medicine warehouses, and biological process (viruses and bacteria) during COVID-19 pandemic are considered. The third objective function (10) is to maximize social responsibility of staff related to the COVID-19 patients that it is divided into two categories, firstly, balanced service of COVID-19 patients and secondly, balanced economic development. In order to minimize non-resiliency of the proposed network according to the suggested metrics is formulated in the objective function (11).
| 12 |
| 13 |
| 14 |
| 15 |
| 16 |
| 17 |
Constraint (12), (13), and (14) show the inventory of medicines at each DC, at the warehouse, and at each pharmacy are equal to the sum of its inventory left from the previous period minus the amount of medicine transported to warehouses, to all pharmacies and hospitals, and to all hospitals, respectively in each period . In this regard, the inventory of medicines at each MP and LP is equal to the sum of its inventory left from the previous period minus the amount of medicine transported to all DCs, respectively in each period is indicated in constraints (15) and (16). In constraint (17), the inventory of medicines at each MP is equal to the sum of its inventory left from the previous period minus the amount of medicine transported to all LP, in each period is formulated.
| 18 |
| 19 |
| 20 |
| 21 |
| 22 |
| 23 |
| 24 |
| 25 |
| 26 |
| 27 |
The amount of medicines at DC and warehouse with capacity level is among its lower and upper limits of capacity in each time period are formulated in constraints (18) and (19). Constraints (20–25) ensure medicine inventory at each MP, LP, DC, warehouse, pharmacy, and hospital is not more than its maximum medicine capacity, respectively. Hence, at most one DC and warehouse of all capacity levels can be constructed at each location and , respectively are indicated in constraints (26) and (27).
| 28 |
| 29 |
| 30 |
| 31 |
| 32 |
| 33 |
| 34 |
| 35 |
| 36 |
| 37 |
| 38 |
| 39 |
| 40 |
| 41 |
| 42 |
| 43 |
| 44 |
| 45 |
| 46 |
| 47 |
Then, for each pharmacy and hospital are allocated only a warehouse, only an MP and LP are assigned to each DC, and for each warehouse is devoted only a DC, which are considered in constraints (28–32). In constraints (33) and (34), the capacity limitations are shown. The sum of shipped medicines from each MP and LP to a DC, from each MP to an LP, from each DC to a warehouse, from each warehouse to a hospital and pharmacy, and from each pharmacy to a hospital should be equal or more than the medicine demand in each period are provided in constraints (35–40). Constrains (41–47) guarantee all DC demands are satisfied for all medicines by a single MP and LP, all LP demands are satisfied for all medicines by a single MP, all warehouse demands are satisfied for all medicines by a single DC, all pharmacy and hospital demands are satisfied for all medicines by a single warehouse, and all hospital demands are satisfied for all medicines by a single pharmacy.
| 48 |
| 49 |
| 50 |
| 51 |
| 52 |
| 53 |
| 54 |
The link among each of the levels of the network is only opened when a flow stands in the allocated link that is illustrated in constraints (48)–(53). Constraint (54) states the types of the decision variables are binary and positive.
Stochastic chance constraint programming
Chance constraint programming is one of the most widely used approaches to solving stochastic models defined by Charnes and Cooper (1959). In this model, the degree of confidence as is introduced by the decision-maker in order to have an appropriate confidence margin. In this approach, all constraints that have the uncertainty parameter apply to at least the % confidence interval in the corresponding constraint. For more information about this approach can be referred to Ghasemi et al. (2020).
Then, the following minimization model with the parameters ,, and is considered, where the symbol indicates uncertainty and the decision variable. Also, shows the number of objective functions, displays the total number of constraints, and shows the constraint th. The general form of stochastic chance constraint programming is as follows:
| 55 |
| 56 |
| 57 |
| 58 |
A summary of the results of chance constraint programming for minimization and maximization problems are as follows.
| 59 |
So that .
| 60 |
So that
| 61 |
Based on the constraints of (59)–(61), the chance constraint model at the α% level for the constraints (62)–(67) is defined as follows:
| 62 |
| 63 |
| 64 |
| 65 |
| 66 |
| 67 |
Solution methodology
Exact approaches are often considered to be a good method to solve problems, Recently, meta-heuristic and heuristic methods are used to solve complex and NP-hard problems. To solve large-sized problems by using exact approaches are not to be the best way. In other words, the exact solution approaches are ineffectual to obtain the optimal solution in large-sized problems. Thus, three population- and nature-based meta-heuristic algorithms inspired by two-phase (teacher and learner phrases) namely, teaching–learning-based optimization (TLBO), by social behavior of groups of birds namely, Particle Swarm are used to develop heuristic methods called Hybrid multi-objectiveTLBO-PSO-1 (H-MO-1), TLBO-PSO-2 (H-MO-2), TLBO-GA-PSO-3 (H-MO-3), respectively to solve the proposed model and to find the Pareto optimal solutions.
The reasons of the using the proposed algorithms are divided into reasons (1) the proposed algorithms have the ability to handle random types of objectives and constraints and are easy to implement, (2) these algorithms can be used independently to solve a given problem. It does not depend on other algorithms or heuristics, (3) the suggested meta-heuristics utilizes simple operators and can be utilized to solve problems that have high computational complexity, (4) these are useful in scientific research and in engineering, (5) these can be combined with other algorithms, and (6) the presented algorithms are very robust, it converges fast, it needs few parameters and it is flexible.
Multi-objective optimization
The SRHCN problem has four various objective functions in this paper. Then, the interactions among the solutions are seen by Pareto optimal solutions. These solutions contain non-dominated solutions (Goodarzian et al., 2020a). Therefore, four solutions are considered: solutions , , , and . Solution dominates the Solutions , , and , when all solutions are not worse than , , and . Then, there exists at least one of that is better than , , and (Goodarzian et al., 2020a). In this paper, eight assessment metrics to evaluate the Pareto fronts quality are employed according to the Pareto optimal set. Next subsection, the initialize and encoding scheme of the utilized multi-objective meta-heuristic algorithms is addressed.
Initialize and encoding scheme
In terms of the Random-Key (RK) strategy known as an encoding process is utilized to analyze the main solution to provide the proposed hybrid multi-objective algorithm to solve the developed model. The sub-solutions are divided into two sorts in the developed model:
-
(i)
In order to determine open DCs and warehouses, a selection sub-solution is utilized. Hence, firstly, a uniform distribution is used for generating a matrix with elements. In this regard, the first units with the highest values are chosen as open warehouses and DCs. For example, the encoded solution {0.64,0.32,0.05,0.87,0.59, 0.12, 0.71} with shows the analyzed solution {1,0,0,1,1,0, 1}.
-
(ii)
In order to determine of allocating DC to MP and LP, warehouse to DC, pharmacy and hospital to the warehouse, and pharmacy to hospital, we are employed allocation selection sub-solution. In this regard, first of all, we have generated a vector () with uniform distribution in range (1, |allocation|). In order to find the selected allocation, the RK technique rounds the numbers. For instance, the encoded solution {3.21, 2.73, 1.56, 1.29} shows the analyzed solution {4, 3, 2, 2} that indicates the fourth allocation for the first DC, the third allocation for the second DC, and the second allocation for the third and fourth DC.
The presented heuristic methods
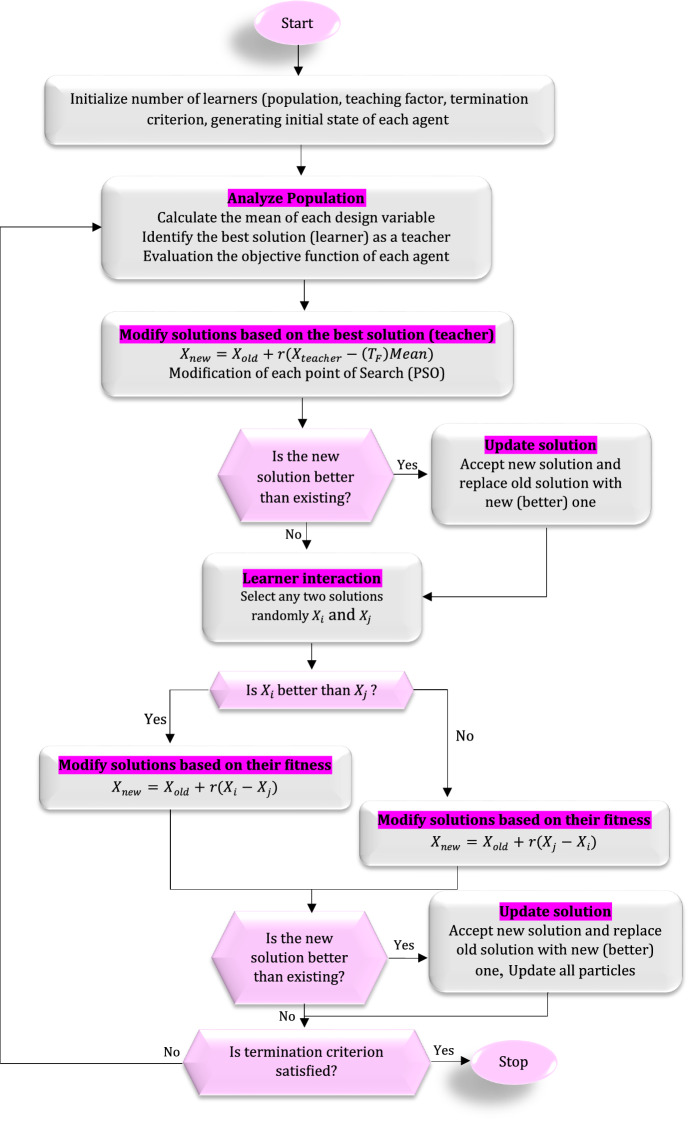
In this subsection, three hybrid multi-objective algorithms to solve the proposed model by integrating TLBO with PSO and TLBO with GA and PSO are developed that three hybrid algorithms are the important and significant contributions in this paper. TLBO, PSO, GA algorithms are introduced and designed by Rao and Patel (2012), Shi (2001), and Goldberg and Holland (1988), respectively. The flowcharts of the TLBO, PSO, and GA algorithms are indicated in Figures A, B, and C, respectively in supplementary materials due to the limitation of page. For more details about these three algorithms, researchers can be referred to Nama et al. (2020), Xu et al. (2020), Zhang et al. (2020), Han et al. (2020), Ang et al. (2020), Mohammed and Duffuaa (2020) and Nezamoddini et al. (2020). These three hybrid algorithms will be stated as follows. All the used basic meta-heuristic algorithms in this paper are to solve the single-objective model. Another important contribution in this paper is added the number of objective function steps in the main loop of all suggested algorithms for fair solving the proposed multi-objective model.
Hybrid multi-objective TLBO-PSO-1 (H-MO-1)
The detailed phases of the H-MO-1 algorithm are explained as follows.
Phase 1: Initialize parameters containing:
-
(i)
= The number of particles,
-
(ii)
= maximal velocity,
-
(iii)
= Inertial weight,
-
(iv)
and =Learning factors
-
(v)
and : Random numbers in interval [0, 1],
-
(vi)
= Initialize the papulation size (TLBO)
-
(vii)
= The number of generations
-
(viii)
= The number of design variables
-
(ix)
= Limits of design variables
Phase 2: Initialize the population:
According to the number of design variables and population size, a random population is generated. The design variables and the population size show the subjects (i.e. courses) and the number of learners, respectively in TLBO. This population is stated as follows.
| 68 |
Therefore, each particle randomly with initial position ( ) within the pre-specified range and speed () in the range of maximal speed () should be initialized. Then, float coding approach to create the random numbers for the upper-level variables is used. Hence, variable y in the lower level is solved. The position for each particle () is formulated in Eq. (69).
| 69 |
Phase 3: Teacher step:
The mean of the population column-wise is calculated, which is expressed the mean for the particular subject as follows;
| 70 |
The best solution will operate as a teacher for that iteration;
| 71 |
The teacher will effort to shift the mean from towards , which will operate as a new mean for the iteration. Therefore,
| 72 |
The various among the two means is stated as follows:
| 73 |
where shows the selected value as 1 or 2. The attained difference is added to the current solution to update its values utilizing.
| 74 |
Then, if it provides a better function value, is accepted.
Phase 4: The value of fitness for each particle is calculated based on Eq. (75).
| 75 |
Phase 5: Learner step:
learners enhance their knowledge through input from the teacher and with the aid of their mutual interaction. Learner modification is stated in Eq. (76).
| 76 |
Phase 6: all the particles are divided into two groups according to the efficiency of the value of the fitness. The first and second groups of the particles are shown with better and worse values of fitness, respectively in Eqs. (77) and (78).
| 77 |
| 78 |
Phase 7: Updating the global best position, , and the current local best position, .
Phase 8: Updating all the particles (69) and Eqs. (79) and (80). Each particle’s position, which should be within the determined range (), and each particle’s velocity is limited by the pre-determined maximal velocity, :
| 79 |
| 80 |
Phase 9: Stopping if the specified generation number is attained; otherwise, repeat from Phase 3.
Moreover, the flowchart of the H-MO-1 algorithm is shown in Fig. 6.
Fig. 6.
The flowchart of the H-MO-1
Hybrid multi-objective TLBO-PSO-2 (H-MO-2)
Phase 1: Initialize parameters containing:
-
(i)
= The number of particles,
-
(ii)
= maximal velocity,
-
(iii)
= Inertial weight,
-
(iv)
and =Learning factors
-
(v)
and : Random numbers in interval [0, 1],
-
(vi)
= Initialize the papulation size (TLBO)
-
(vii)
= The number of generations
-
(viii)
= The number of design variables
-
(ix)
= Limits of design variables
Phase 2: Initialize the population:
According to the number of design variables and population size, a random population is generated. The design variables and the population size show the subjects (i.e. courses) and the number of learners, respectively in TLBO. This population is stated in Eq. (68).
Therefore, each particle randomly with initial position () within the pre-specified range and speed () in the range of maximal speed () should be initialized. Then, float coding approach to create the random numbers for the upper-level variables is used. Hence, variable y in the lower level is solved. Hence, variable y in the lower level is solved. The position for each particle () is formulated in Eq. (69).
Phase 3: The value of fitness for each particle is computed according to the Eq. (75).
Phase 4: Updating the global best position, , the current local best position, , and record the particles with better values of fitness.
Phase 5: Updating all the particles (69) and Eqs. (70) and (80). Each particle’s position, which should be within the determined range (), and each particle’s velocity is limited by the pre-determined maximal velocity, .
Phase 6: Implement Teacher and Learner steps of TLBO algorithm.
Phase 7: Stopping if the specified generation number is attained; otherwise, repeat from Phase 3.
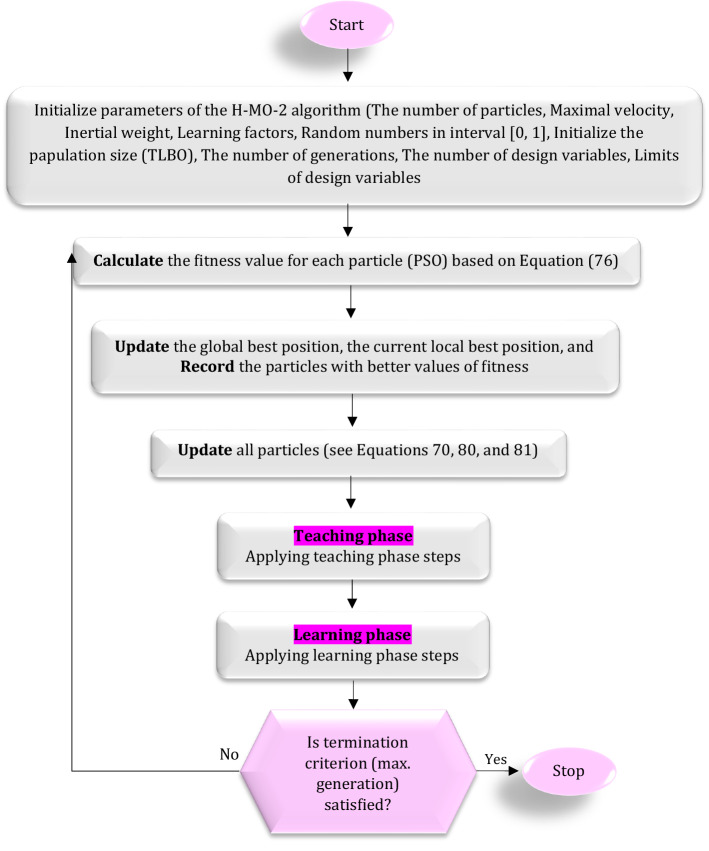
Finally, the flowchart of the H-MO-2 algorithm is demonstrated in Fig. 7.
Fig. 7.
The flowchart of the H-MO-2
Hybrid multi-objective TLBO-GA-PSO-3 (H-MO-3)
In terms of the proposed third algorithm, integrates the crossover mechanism and mutation operator of GA with the TLBO and PSO algorithms, which is developed in this paper for the first time. Hence, the elitist strategy is utilized to boost the evolutionary efficiency. The accurate processes are explained as follows:
Phase 1: Initialize parameters containing:
-
(i)
= Initialize the papulation size (TLBO),
-
(ii)
= The number of generations,
-
(iii)
= The number of design variables,
-
(iv)
= Limits of design variables,
-
(v)
= The number of particles,
-
(vi)
= maximal velocity,
-
(vii)
= Inertial weight,
-
(viii)
and =Learning factors,
-
(ix)
and : Random numbers in interval [0, 1],
-
(x)
= Mutation rate, and
-
(xi)
= Crossover rate.
Phase 2: Initialize the population:
According to the number of design variables and population size, a random population is generated. The design variables and the population size show the subjects (i.e. courses) and the number of learners, respectively in TLBO. This population is stated in Eq. (68).
Therefore, each particle randomly with initial position () within the pre-specified range and speed () in the range of maximal speed () should be initialized. Then, float coding approach to create the random numbers for the upper-level variables is used. Hence, variable y in the lower level is solved. Hence, variable y in the lower level is solved. The position for each particle () is formulated in Eq. (69).
Phase 3: The value of fitness for each particle is calculated based on Eq. (75).
Phase 4: Recording the particles with better values of fitness.
Phase 5: Updating the global best position, , the current local best position, .
Phase 6: Specify whether the current local and global best positions, respectively modify or not. If it is, next, go to Phase 8; otherwise, jump to Phase 7.
Phase 7: Whereas the current local and global best positions do not modify, it is essential to dominating the drawback of getting stuck to the local minimum problem. This phase utilizes the mutation operator of the GA to disturb the particle. Hence, in the local minimum, the mutation mechanism may elude the particle stuck. The updating rule is stated as follows:
| 81 |
While crossover mechanism Equation is:
| 82 |
| 83 |
Phase 8: Update all the particles by using Eqs. (70) and (80) and Eq. (69). Each particle’s position, which should be within the determined range (), and each particle’s velocity is limited by the pre-determined maximal velocity, .
Phase 9: The value of fitness for each particle is calculated based on Eq. (84).
| 84 |
Utilizing elitist policy, replace the worse particles with obtained better particles in Phase 4.
Phase 10: Implement Teacher and Learner steps of TLBO algorithm.
Phase 11: Stop if the specified generation number is attained; otherwise, repeat from Phase 3.
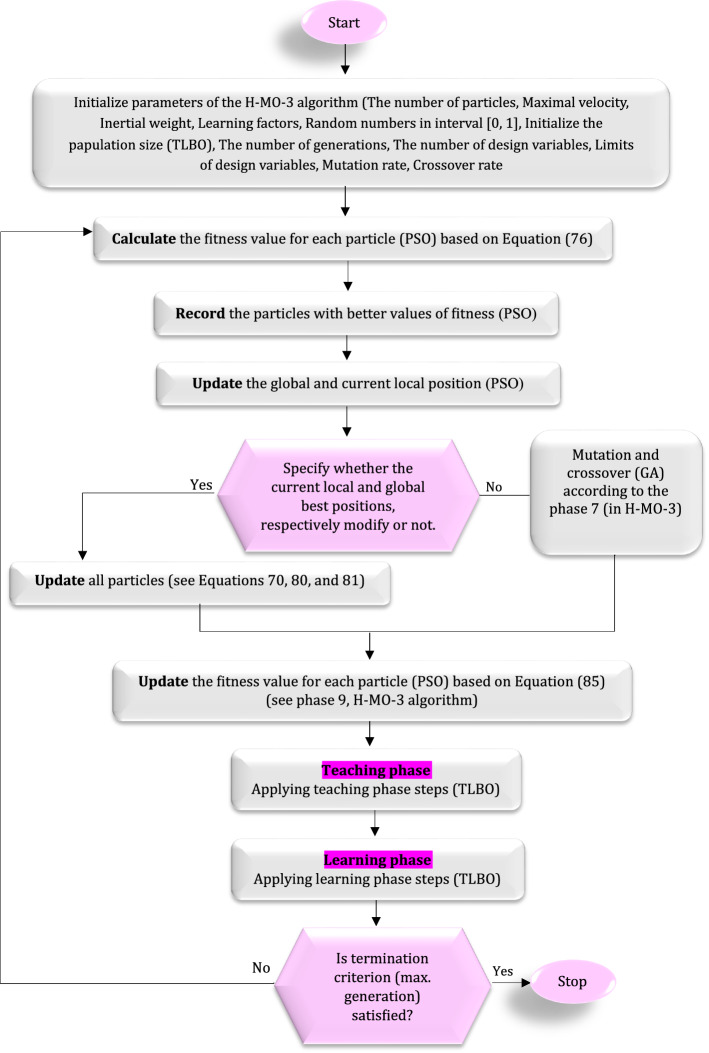
Then, Fig. 8 shows the flowchart of the H-MO-3 algorithm.
Fig. 8.
The flowchart of the H-MO-3
Generally, only the better particles are elected to implement Learner and Teacher phases in the H-MO-1. Then, it does not do anything to the particles with worse efficiency. In terms of the H-MO-2, all particles are updated by utilizing basic PSO updating rules and chased by Learner and Teacher phases. This will cause the particles with better efficiency to be modified. Therefore, in terms of H-MO-3, only the particles which do not evolve are changed for solving the above two algorithms’ disadvantages, as well as elitist strategy, is implemented.
Numerical results
In this part, the outcomes of sample examples, assessment metrics to evaluate heuristic methods, a real case study to validate the presented mathematical model, simulation results and mathematical model, sensitivity analysis on important parameters, and finally the managerial insight will be expressed.
Sample problems
Here, a set of numerical tests are provided to validate the proposed SRHCN as well as to assess the performance of the developed meta-heuristic algorithms in terms of the objective function value, needed CPU time, and eight assessment metrics. Since there were no benchmarks existing in the literature for this particular mathematical modeling, ten experiment examples with different sizes containing small, medium, and large problems that large size will use in the case study section are reported each with thirty iterations including random data. The problem sizes and the values related to the parameters are shown in Tables 2 and 3, respectively.
Table 2.
The experiment problems sizes
| Classification | Example no | Levels | |||||||
|---|---|---|---|---|---|---|---|---|---|
| Small | ES1 | 2 | 3 | 1 | 2 | 2 | 2 | 3 | 1 |
| ES2 | 2 | 3 | 1 | 2 | 2 | 3 | 3 | 1 | |
| ES3 | 3 | 3 | 2 | 2 | 3 | 3 | 4 | 2 | |
| ES4 | 3 | 4 | 2 | 3 | 3 | 4 | 4 | 2 | |
| ES5 | 4 | 5 | 3 | 3 | 4 | 4 | 6 | 2 | |
| Medium | EM1 | 6 | 8 | 4 | 4 | 6 | 5 | 10 | 3 |
| EM2 | 8 | 10 | 8 | 6 | 8 | 6 | 12 | 4 | |
| EM3 | 12 | 14 | 12 | 8 | 10 | 8 | 18 | 5 | |
| EM4 | 14 | 18 | 16 | 12 | 12 | 8 | 26 | 6 | |
| EM5 | 18 | 22 | 22 | 18 | 14 | 10 | 30 | 6 | |
Table 3.
Predetermined intervals to create parameters according to uniform distributions
| Parameter | Value | Parameter | Value |
|---|---|---|---|
| , , , , , , , | (600, 1200) | , , , , , , |
(5, 5000) Part Per Million = PPM = milligram/liter |
| , | (40,000, 45,000)$ | , | (0.1, 0.55) |
| , , , , , | (2000, 2500)$ | , , , , | 120 |
| , , , , , , | (150, 350)$ | , , , , , | (50, 100) |
| , | (100, 400)$ | , | (60, 120) |
| , | (50, 250)$ | , | (5, 50) |
| , , , , | (5, 25) | , | (5, 12) |
|
, , , , , , |
(5, 1000)km | , | (200, 400) |
| , , , , , | (10, 40) | , | (5, 100) |
| , , , , , | (0.2, 0.3, 0.4) | , | (100, 600) |
| , , , , , |
Small capacity (1000, 6000)ton |
, , , , , ,,, ,, | (5, 25) |
| , , , , , |
Medium capacity (6000, 40,000)ton |
, , , , , |
Large capacity (40,000, 70,000)ton |
| ,,,, | (5, 5000)PPM | , | (15, 85) |
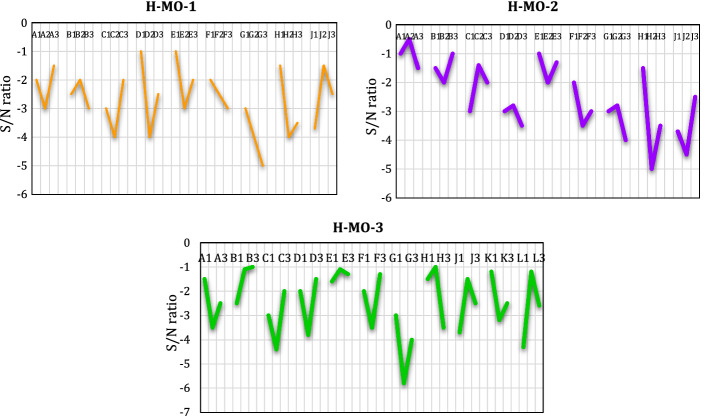
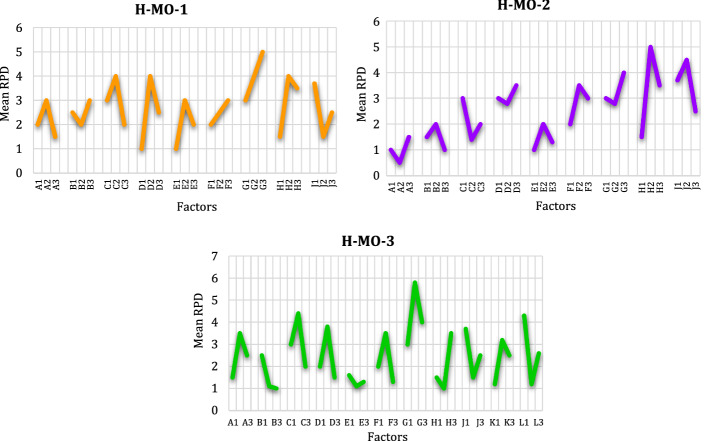
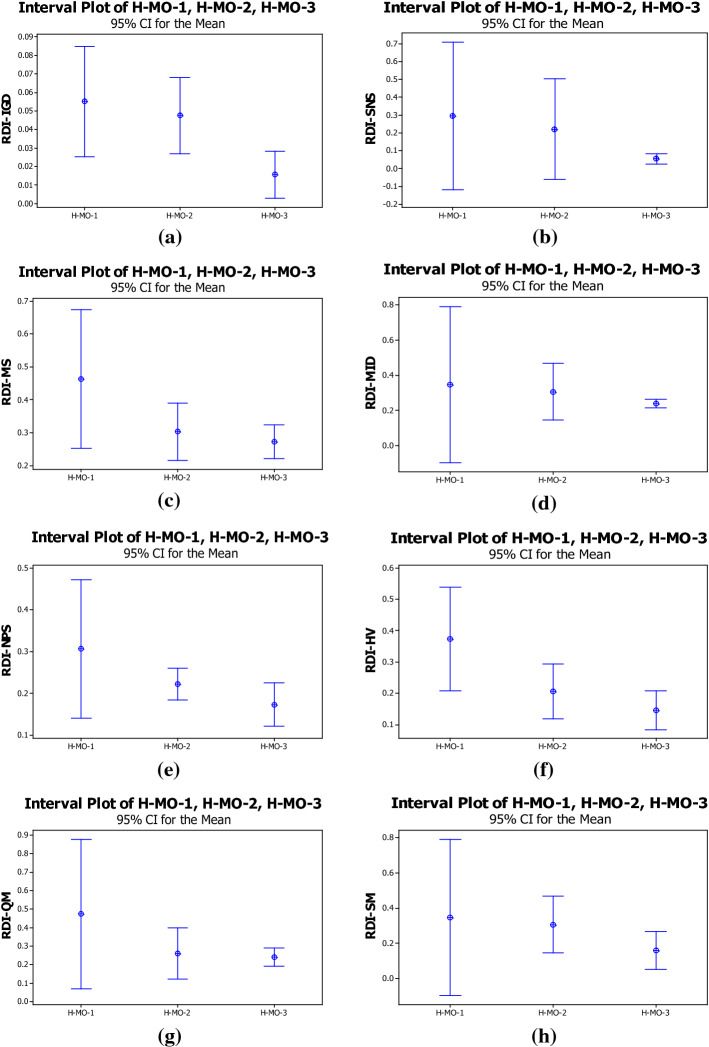
The Taguchi tuning approach was utilized for tuning the parameters to find the best solution because the obtained outcomes from the developed algorithms are sensitive to their initial parameters (Goodarzian et al., 2020a). First of all, the proper factors (initial parameters) were specified and factor levels were chosen using the Taguchi approach. The initial parameters and factor levels of the developed algorithms are provided in Table 4. Each example was repeated three times for each run utilizing the developed meta-heuristic algorithms for more precise computations. Then, a maximum of three levels is provided to the proposed algorithm factors. In terms of the Taguchi approach, this approach declines the whole number of tests by providing several orthogonal arrays for tuning the meta-heuristics in a proper time. This approach suggests Orthogonal Array L27 for three developed algorithms. The details related to orthogonal arrays of the H-MO-1, H-MO-2, and H-MO-3 algorithms are stated in Tables D1 and D2 in supplementary materials due to the limitations of page. In this approach, the features of comparison divided into two categories containing () noise and () control factors. Hence, the value of the response variation according to the signal to noise (S/N) ratio is considered to compute in the Taguchi approach and to obtain the aim of tuning the meta-heuristic algorithms. The chosen value of the S/N ratio in this paper is presented in Eq. (86). Hence, the result of the S/N ratio must be parsed to find the best levels of each H-MO-1, H-MO-2, and H-MO-3. To obtain the performance of the levels in each factor in this approach after carrying out tests and computing the assessment parameters, the S/N figures for each proposed algorithm are shown in Fig. 9. The results of the objective functions and computational (CPU) time for each experiment problem utilizing CPLEX and the H-MO-1, H-MO-2, and H-MO-3 algorithms are reported in Table 5.
| 85 |
Table 4.
The parameter levels for parameter tuning the developed algorithms
| Algorithm | Factor | Level |
|---|---|---|
| H-MO-1 & H-MO-2 | = The number of particles | A1 = 10 A2 = 20 A3 = 30 |
| =maximal velocity | B1 = 5 B2 = 10 B3 = 20 | |
| =Inertial weight | C1 = 0.2 C2 = 0.5 C3 = 0.7 | |
| and =Learning factors | D1 = 0.1 D2 = 0.2 D3 = 0.3 | |
| Max iteration | E1 = 100 E2 = 200 E3 = 300 | |
| =Initialize the papulation size (TLBO) | F1 = 20 F2 = 40 F3 = 60 | |
| =The number of generations | G1 = 50 G2 = 100 G3 = 150 | |
| =The number of design variables | H1 = 2 H2 = 4 H3 = 6 | |
| =Limits of design variables | J1 = (0.1, 0.2) J2 = (0.25, 0,45) J3 = (0.3, 0.75) | |
| H-MO-3 | = The number of particles, | A1 = 10 A2 = 20 A3 = 30 |
| =maximal velocity, | B1 = 5 B2 = 10 B3 = 20 | |
| =Inertial weight, | C1 = 0.2 C2 = 0.5 C3 = 0.7 | |
| and =Learning factors | D1 = 0.1 D2 = 0.2 D3 = 0.3 | |
| Max Iteration | E1 = 100 E2 = 200 E3 = 300 | |
| =Initialize the papulation size (TLBO) | F1 = 20 F2 = 40 F3 = 60 | |
| =The number of generations | G1 = 50 G2 = 100 G3 = 150 | |
| =The number of design variables | H1 = 2 H2 = 4 H3 = 6 | |
| =Limits of design variables | J1 = (0.1, 0.2) J2 = (0.25, 0,45) J3 = (0.3, 0.75) | |
| =Mutation rate | K1 = 0.15 K2 = 0.25 K3 = 0.35 | |
| =Crossover rate | L1 = 0.35 L2 = 0.55 L3 = 0.95 |
Fig. 9.
The S/N ratios of the developed algorithms
Table 5.
The average results of objective functions and CPU times (based on seconds) of the developed method
| Problem size | Objective function | CPLEX | CPU | H-MO-1 | CPU | H-MO-2 | CPU | H-MO-3 | CPU |
|---|---|---|---|---|---|---|---|---|---|
| ES1 | OF1 | 107,122.19 | 17 | 156,789.87 | 17 | 134,509.21 | 15 | 126,738.35 | 12 |
| OF2 | 2230.13 | 2765.32 | 2562.49 | 2459.21 | |||||
| OF3 | 106.12 | 187.29 | 156.13 | 126.07 | |||||
| OF4 | 54.27 | 82.06 | 78.52 | 67.35 | |||||
| ES2 | OF1 | 108,455.45 | 58 | 158,305.13 | 48 | 139,872.28 | 38 | 128,972.29 | 25 |
| OF2 | 2268.32 | 2798.29 | 2588.31 | 2567.34 | |||||
| OF3 | 111.53 | 191.67 | 160.52 | 131.18 | |||||
| OF4 | 58.74 | 85.73 | 81.32 | 71.07 | |||||
| ES3 | OF1 | 112,045.27 | 132 | 162,340.73 | 78 | 140,567.23 | 53 | 128,972.29 | 38 |
| OF2 | 2297.84 | 2834.56 | 2612.76 | 2567.34 | |||||
| OF3 | 117.62 | 209.54 | 167.39 | 131.18 | |||||
| OF4 | 61.89 | 89.21 | 86.41 | 71.07 | |||||
| ES4 | OF1 | 113,512.36 | 468 | 168,709.42 | 82 | 142,221.87 | 71 | 130,413.13 | 58 |
| OF2 | 2367.29 | 2889.06 | 2656.32 | 2589.94 | |||||
| OF3 | 121.03 | 219.88 | 171.12 | 138.53 | |||||
| OF4 | 67.52 | 94.67 | 91.56 | 78.63 | |||||
| ES5 | OF1 | 114,290.02 | 778 | 175,691.39 | 112 | 146,809.31 | 83 | 139,405.21 | 64 |
| OF2 | 2396.31 | 2923.52 | 2698.41 | 2632.16 | |||||
| OF3 | 133.57 | 267.37 | 178.47 | 143.79 | |||||
| OF4 | 74.41 | 112.05 | 98.12 | 83.72 | |||||
| EM1 | OF1 | – | – | 181,230.15 | 134 | 149,886.29 | 96 | 145,821.39 | 78 |
| OF2 | – | 3123.75 | 2723.53 | 2719.64 | |||||
| OF3 | – | 273.28 | 185.28 | 157.35 | |||||
| OF4 | – | 121.89 | 107.72 | 97.24 | |||||
| EM2 | OF1 | – | – | 187,963.65 | 156 | 158,902.29 | 112 | 156,042.52 | 83 |
| OF2 | – | 3623.42 | 2823.53 | 2785.21 | |||||
| OF3 | – | 283.04 | 195.29 | 163.52 | |||||
| OF4 | – | 129.42 | 117.09 | 112.83 | |||||
| EM3 | OF1 | – | – | 192,938.72 | 178 | 169,809.27 | 121 | 168,431.48 | 97 |
| OF2 | – | 3731.56 | 2909.53 | 2826.81 | |||||
| OF3 | – | 292.63 | 215.54 | 171.29 | |||||
| OF4 | – | 134.04 | 130.65 | 123.52 | |||||
| EM4 | OF1 | – | – | 210,453.31 | 193 | 178,659.34 | 138 | 173,980.14 | 110 |
| OF2 | – | 3865.43 | 3278.87 | 2934.76 | |||||
| OF3 | – | 312.78 | 279.32 | 183.03 | |||||
| OF4 | – | 168.78 | 148.29 | 133.67 | |||||
| EM5 | OF1 | – | – | 218,309.47 | 219 | 187,890.32 | 158 | 181,566.23 | 120 |
| OF2 | – | 3963.31 | 3429.89 | 3259.31 | |||||
| OF3 | – | 378.23 | 287.45 | 194.45 | |||||
| OF4 | – | 196.62 | 178.89 | 145.78 | |||||
| Avg. CPU | – | – | 34.2 | – | 121.7 | – | 88.5 | – | 68.5 |
Since the scale of objective functions in each example is various, they could not be utilized directly. Accordingly, the Relative Percent Deviation (RPD) is employed for each example to solve this problem. The RPD value for the data is obtained using Eq. (86).
| 86 |
where and show the achieved best solution and the values of the achieved objective for each iteration of the experiment in a provided example, respectively. Therefore, the mean RPD is computed for each experiment after transforming the values of the objective to RPDs.
Also, the RPD is utilized for confirming the selected best factors based on S/N ratios. Figure 9 demonstrates the outcomes of RPD for each parameter level. It is clear that in Fig. 10, the RPD shows the best factors, which confirm the same outcomes as S/N ratios.
Fig. 10.
Mean RPD plot for each level of the factors
In terms of the CPU time, the trend of the suggested methods is shown in Figs. 11 and 12. It is clear that CPLEX is swifter than the developed meta-heuristic algorithms for small-sizes. Then, the CPU time of H-MO-3 is less than H-MO-1 and H-MO-2, but H-MO-1 is worse than other proposed methods in terms of the CPU time in small and medium-size. In other words, in terms of the developed algorithms, H-MO-3 has the minimum CPU time, while H-MO-1 has the maximum CPU time in all test problems as well as the average of the H-MO-3 is 68.5 s, but the H-MO-1 is 121.7 s in different sizes.
Fig. 11.
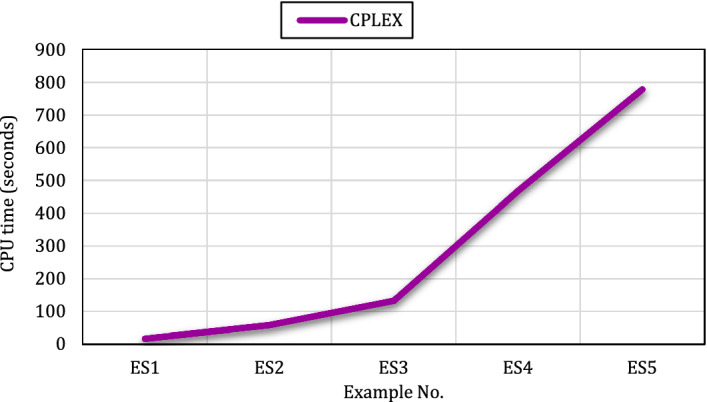
The trend of the CPLEX based on the CPU time in small size
Fig. 12.
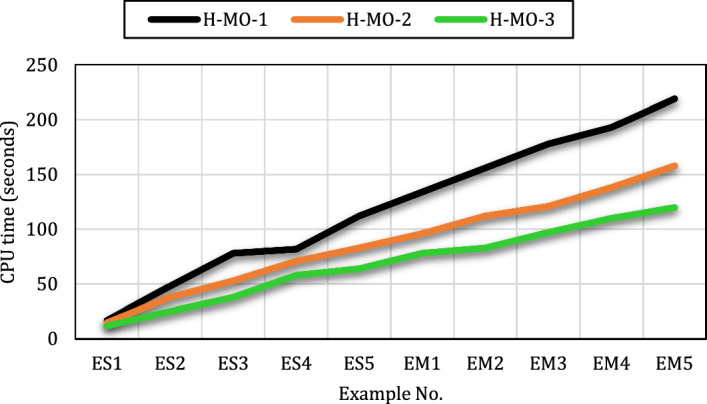
The trend of the proposed meta-heuristic algorithms based on the CPU time in small- and medium-size
Assessment metrics for the SRHCN problem
In the examined papers, authors used a number of assessment metrics to evaluate the quality of Pareto fronts for the meta-heuristic algorithms (Goodarzian et al., 2020a). In this paper, eight metrics are utilized to evaluate the quality of the proposed algorithms that are stated as follows.
Mean Ideal Distance (MID) (Goodarzian et al. (2021a)
Quality Metric (QM) (Goodarzian et al. (2021b)
Spread of Non-Dominance Solution (SNS) (Goodarzian et al. (2021a, 2021b, 2021c)
Hyper Volume (HV) (Goodarzian et al. (2021b)
Number of Pareto Solution (NPS) (Goodarzian et al. (2021b)
Inverted Generational Distance (IGD) (Goodarzian et al. (2021b, 2021c)
Maximum Spread (MS) (Goodarzian et al. (2021a)
Spacing Metric (SM)
According to the eight-evaluation metrics (MID, QM, SNS, HV, NPS, IGD, MS, and SM), the efficiency of the proposed meta-heuristics is addressed by these criteria as the evaluation criteria for attained Pareto in each experiment problems. In Table 6, the outputs of the assessment metrics of the presented algorithms are provided.
Table 6.
The results of the assessment metrics of the H-MO-1, H-MO-2, and H-MO-3 algorithms
| Assessment metrics | Case | H-MO-1 | H-MO-2 | H-MO-3 | Assessment metrics | Case | H-MO-1 | H-MO-2 | H-MO-3 |
|---|---|---|---|---|---|---|---|---|---|
| IGD | ES1 | 0.058 | 0.039 | 0.023 | SNS | ES1 | 4146 | 4321 | 4567 |
| ES2 | 0.061 | 0.042 | 0.026 | ES2 | 4213 | 4398 | 4678 | ||
| ES3 | 0.062 | 0.044 | 0.028 | ES3 | 4356 | 4402 | 4712 | ||
| ES4 | 0.064 | 0.045 | 0.029 | ES4 | 4398 | 4438 | 4769 | ||
| ES5 | 0.067 | 0.046 | 0.032 | ES5 | 4421 | 4476 | 4823 | ||
| EM1 | 0.068 | 0.048 | 0.033 | EM1 | 4482 | 4483 | 4860 | ||
| EM2 | 0.071 | 0.049 | 0.034 | EM2 | 5502 | 4532 | 4917 | ||
| EM3 | 0.073 | 0.051 | 0.035 | EM3 | 5529 | 4571 | 4982 | ||
| EM4 | 0.078 | 0.053 | 0.036 | EM4 | 5578 | 4629 | 5134 | ||
| EM5 | 0.082 | 0.056 | 0.039 | EM5 | 5591 | 4647 | 5283 | ||
| MS | ES1 | 4987 | 5123 | 5687 | MID | ES1 | 8.64 | 7.93 | 5.67 |
| ES2 | 5023 | 5189 | 5762 | ES2 | 8.87 | 8.32 | 5.89 | ||
| ES3 | 5067 | 5239 | 5851 | ES3 | 9.56 | 8.75 | 6.02 | ||
| ES4 | 5093 | 5278 | 5893 | ES4 | 9.78 | 9.42 | 6.21 | ||
| ES5 | 5134 | 5296 | 5931 | ES5 | 10.34 | 9.67 | 6.34 | ||
| EM1 | 5156 | 5367 | 5956 | EM1 | 10.65 | 10.13 | 6.69 | ||
| EM2 | 5179 | 5489 | 6024 | EM2 | 10.89 | 10.57 | 7.21 | ||
| EM3 | 5276 | 5528 | 6239 | EM3 | 11.64 | 11.33 | 7.75 | ||
| EM4 | 5351 | 5673 | 6351 | EM4 | 11.89 | 11.56 | 8.54 | ||
| EM5 | 5403 | 5732 | 6451 | EM5 | 12.78 | 11.78 | 9.23 | ||
| NPS | ES1 | 2 | 3 | 4 | HV | ES1 | 3.04 | 3.59 | 4.78 |
| ES2 | 3 | 4 | 5 | ES2 | 3.14 | 3.82 | 4.92 | ||
| ES3 | 4 | 5 | 6 | ES3 | 3.37 | 4.29 | 5.01 | ||
| ES4 | 3 | 4 | 6 | ES4 | 3.78 | 4.74 | 5.23 | ||
| ES5 | 4 | 6 | 7 | ES5 | 4.12 | 4.83 | 5.78 | ||
| EM1 | 3 | 5 | 6 | EM1 | 4.39 | 5.17 | 6.12 | ||
| EM2 | 7 | 8 | 9 | EM2 | 4.76 | 5.45 | 6.35 | ||
| EM3 | 5 | 6 | 10 | EM3 | 5.14 | 5.79 | 6.98 | ||
| EM4 | 7 | 8 | 10 | EM4 | 5.68 | 6.38 | 7.68 | ||
| EM5 | 9 | 10 | 12 | EM5 | 6.34 | 7.45 | 8.23 | ||
| QM | ES1 | 0.20 | 0.40 | 0.70 | SM | ES1 | 321.12 | 432.49 | 451.56 |
| ES2 | 0.30 | 0.50 | 0.77 | ES2 | 345.78 | 433.56 | 462.12 | ||
| ES3 | 0.40 | 0.58 | 0.80 | ES3 | 356.81 | 434.78 | 473.16 | ||
| ES4 | 0.47 | 0.6 | 0.83 | ES4 | 361.26 | 436.12 | 477.35 | ||
| ES5 | 0.50 | 0.7 | 0.87 | ES5 | 362.78 | 441.71 | 478.89 | ||
| EM1 | 0.59 | 0.76 | 0.90 | EM1 | 368.81 | 443.67 | 489.39 | ||
| EM2 | 0.60 | 0.80 | 0.92 | EM2 | 370.23 | 458.19 | 512.56 | ||
| EM3 | 0.67 | 0.84 | 0.95 | EM3 | 374.27 | 461.43 | 513.67 | ||
| EM4 | 0.70 | 0.9 | 0.97 | EM4 | 376.34 | 468.38 | 524.51 | ||
| EM5 | 0.80 | 0.92 | 0.98 | EM5 | 381.12 | 473.59 | 536.82 |
According to all assessment metrics, H-MO-3 has high quality and more robust than the other presented algorithms. The reason this algorithm is better, in NPS, QM, SNS, MS, HV, and SM metrics, the higher the value of these metrics, the better the efficiency of the algorithm, while in IGD and MID metrics, the lower the value of these metrics, the better the efficiency of the algorithm.
Two samples of non-dominated solutions of the developed algorithms in the experiment problems (ES5 and EM5) are illustrated in Figs. 13 and 14. It is evident that in this figure, H-MO-3 indicates the best performance, while H-MO-1 and H-MO-2 are the same and close to each other in terms of the Pareto solutions.
Fig. 13.
Pareto frontier of developed algorithms in ES5
Fig. 14.
Pareto frontier of developed algorithms in EM5
In this paper, in order to obtain a more robust algorithm according to the Pareto optimal analyses, several statistical comparisons between suggested algorithms considered by assessment metrics. In this regard, the outcomes available in Table 6 are converted to proper criteria called Relative Deviation Index (RDI) that RDI is formulated based on Eq. (87).
| 87 |
where , , , and illustrate the best solution between approaches, the obtained value of the objective function through assessment metrics of the proposed metaheuristics, maximum and minimum values between all attained values through the suggested metaheuristics, respectively. Moreover, the confidence interval of 95% for the assessment metrics in the proposed meta-heuristics is conducted to statistically analyze performance of meta-heuristics. Then, in terms of the developed algorithms, Fig. 15 indicates the results run of the means plot and Least Significant Difference (LSD) by Minitab 20.1 Software.
Fig. 15.
The results of the means plot and LSD based on assessment metrics for developed algorithms
According to Fig. 15, the results of the H-MO-3 algorithm has the best performance and more successful than the other proposed algorithms for all assessment metrics. In contrast, the results of the H-MO-1 show lower quality than the H-MO-2 and H-MO-3 algorithms in Fig. 15.
Case study
South Carolina is a state in the United States of America. It is located in the southeastern part of the United States, extending north to North Carolina, southeast to the Atlantic Ocean, and southwest to Georgia. In this state, the number of COVID-19 patients has been identified as of October 12, 2020, 241,686, the number of deaths is 4,627 and the number of recoveries is 122,417. Figure 16 shows a case study map. As it is known, warehouses, producers, and distribution centers are marked with blue, black, and red dots, respectively. In the case study, 15 warehouses, 14 distribution centers, 24 hospitals, 16 pharmacies, 8 main producers, and 13 local producers are considered.
Fig. 16.
The map of a case study in this paper
Table 7 provides the operating costs in warehouses and distribution centers in dollars. The cost of storing different medicines in hospitals in dollars is indicated in Table 8. For example, the cost of inventory holding a unit of Tocilizumab in hospital 1 is 8 dollars. Table 9 reports the fixed cost of opening distribution centers based on capacity level. As can be seen, the centers can be opened in three capacities including small, medium, and large. For instance, the fixed cost of opening a Pickens distribution center with a small, medium, and large capacity is $ 180,000, $ 340,000, and $ 50,000, respectively. Table 10 shows the distance between the Main producer and the Local producer in kilometers.
Table 7.
The operating cost at the warehouses and distribution centers
| No. | Warehouse | Operating cost ($) | No. | Distribution center | Operating cost ($) |
|---|---|---|---|---|---|
| 1 | Gaffney | 8500 | 1 | Pickens | 18,000 |
| 2 | Anderson | 14,500 | 2 | Union | 16,000 |
| 3 | Greenwood | 10,000 | 3 | Laurens | 13,000 |
| 4 | Aiken | 12,000 | 4 | Mc Cormick | 11,000 |
| 5 | Newberry | 15,000 | 5 | Winnsboro | 18,000 |
| 6 | Chester | 11,000 | 6 | Camden | 19,000 |
| 7 | Columbia | 11,000 | 7 | Bennettsville | 20,000 |
| 8 | Walterboro | 15,000 | 8 | Conway | 15,000 |
| 9 | Florence | 20,000 | 9 | Kingstree | 25,000 |
| 10 | Manning | 22,000 | 10 | Orangeburg | 25,000 |
| 11 | Kingstree | 18,000 | 11 | Branwell | 15,000 |
| 12 | Conway | 9000 | 12 | Charleston | 14,000 |
| 13 | Moncks Corner | 16,000 | 13 | Ridgeland | 18,000 |
| 14 | St. George | 17,000 | 14 | Georgetown | 25,000 |
| 15 | Ridgeland | 14,000 |
Table 8.
Inventory holding cost of medicines at the hospital
| No. | Hospitals | Medicines | |||||||||
|---|---|---|---|---|---|---|---|---|---|---|---|
| Chloroquine phosphate | Tocilizumab | Interpherone | Umifenovir | Atazanavir | Robavirin | Favipiravir | Remdesivir | Hydroxy | Lopinavir | ||
| 1 | Hospital 1 | 8 | 8 | 4 | 9 | 9 | 7 | 8 | 7 | 2 | 3 |
| 2 | Hospital 2 | 5 | 5 | 8 | 7 | 2 | 2 | 9 | 2 | 9 | 8 |
| 3 | Hospital 3 | 7 | 4 | 8 | 8 | 3 | 6 | 5 | 5 | 3 | 8 |
| 4 | Hospital 4 | 2 | 3 | 6 | 7 | 6 | 2 | 2 | 6 | 5 | 3 |
| 5 | Hospital 5 | 5 | 2 | 5 | 3 | 3 | 4 | 6 | 5 | 8 | 8 |
| 6 | Hospital 6 | 6 | 8 | 2 | 9 | 7 | 5 | 5 | 3 | 9 | 3 |
| 7 | Hospital 7 | 3 | 5 | 3 | 4 | 7 | 8 | 3 | 2 | 5 | 9 |
| 8 | Hospital 8 | 2 | 6 | 9 | 5 | 4 | 6 | 3 | 9 | 7 | 4 |
| 9 | Hospital 9 | 6 | 4 | 6 | 8 | 2 | 7 | 6 | 3 | 3 | 5 |
| 10 | Hospital 10 | 8 | 8 | 2 | 4 | 7 | 3 | 2 | 2 | 7 | 3 |
| 11 | Hospital 11 | 2 | 8 | 4 | 2 | 6 | 7 | 5 | 6 | 3 | 7 |
| 12 | Hospital 12 | 4 | 5 | 4 | 2 | 9 | 6 | 7 | 4 | 6 | 2 |
| 13 | Hospital 13 | 2 | 3 | 6 | 3 | 4 | 2 | 4 | 9 | 8 | 8 |
| 14 | Hospital 14 | 9 | 8 | 3 | 2 | 5 | 3 | 5 | 6 | 5 | 5 |
| 15 | Hospital 15 | 5 | 7 | 8 | 2 | 3 | 6 | 8 | 9 | 3 | 8 |
| 16 | Hospital 16 | 3 | 8 | 4 | 7 | 7 | 9 | 5 | 2 | 4 | 3 |
| 17 | Hospital 17 | 7 | 5 | 5 | 8 | 3 | 3 | 2 | 9 | 6 | 6 |
| 18 | Hospital 18 | 4 | 6 | 5 | 4 | 3 | 3 | 6 | 2 | 6 | 8 |
| 19 | Hospital 19 | 7 | 3 | 4 | 7 | 3 | 3 | 4 | 5 | 4 | 7 |
| 20 | Hospital 20 | 7 | 2 | 6 | 7 | 7 | 4 | 8 | 9 | 2 | 4 |
| 21 | Hospital 21 | 7 | 9 | 5 | 6 | 3 | 8 | 6 | 4 | 8 | 9 |
| 22 | Hospital 22 | 2 | 8 | 5 | 8 | 4 | 4 | 4 | 2 | 3 | 8 |
| 23 | Hospital 23 | 7 | 5 | 5 | 4 | 3 | 6 | 8 | 8 | 5 | 2 |
| 24 | Hospital 24 | 4 | 6 | 3 | 8 | 8 | 4 | 5 | 5 | 9 | 7 |
Table 9.
The fixed cost of opening DC ($)
| Distribution center | Capacity level | ||
|---|---|---|---|
| Small | Medium | Large | |
| Pickens | 180,000 | 340,000 | 500,000 |
| Union | 160,000 | 350,000 | 520,000 |
| Laurens | 150,000 | 300,000 | 515,000 |
| Mc Cormick | 200,000 | 380,000 | 500,000 |
| Winnsboro | 170,000 | 400,000 | 550,000 |
| Camden | 200,000 | 370,000 | 590,000 |
| Bennettsville | 220,000 | 410,000 | 500,000 |
| Conway | 150,000 | 300,000 | 500,000 |
| Kingstree | 210,000 | 330,000 | 550,000 |
| Orangeburg | 200,000 | 350,000 | 620,000 |
| Branwell | 150,000 | 350,000 | 600,000 |
| Charleston | 190,000 | 400,000 | 650,000 |
| Ridgeland | 200,000 | 420,000 | 600,000 |
| Georgetown | 230,000 | 340,000 | 550,000 |
Table 10.
Distance between main and local producers (KM)
| Local producer | Main producer | ||||||
|---|---|---|---|---|---|---|---|
| M1 | M2 | M3 | M5 | M6 | M7 | M8 | |
| Walhalla | 27 | 17 | 10 | 25 | 19 | 42 | 33 |
| Anderson | 19 | 24 | 50 | 50 | 38 | 34 | 48 |
| Laurens | 37 | 34 | 30 | 50 | 24 | 11 | 45 |
| Winnsboro | 29 | 29 | 41 | 22 | 40 | 19 | 34 |
| Lexington | 35 | 32 | 33 | 23 | 33 | 31 | 23 |
| Edgefield | 47 | 27 | 18 | 33 | 29 | 26 | 36 |
| Aiken | 25 | 15 | 24 | 19 | 40 | 20 | 27 |
| Matthews | 31 | 24 | 30 | 13 | 46 | 38 | 20 |
| Darlington | 11 | 22 | 32 | 24 | 27 | 16 | 33 |
| Florence | 21 | 32 | 18 | 32 | 21 | 34 | 20 |
| Conway | 26 | 34 | 28 | 31 | 16 | 20 | 28 |
| Moncks Corner | 14 | 37 | 38 | 32 | 27 | 45 | 45 |
| Hampton | 34 | 29 | 26 | 28 | 34 | 50 | 38 |
Simulation results
Figure 20 shows an estimate of the distribution functions of the required medicines (see “Appendix A”). As can be seen, the values of Chloroquine phosphate, Tocilizumab, Interpherone, and Umifenovir follow the Normal distribution, Logistic, Normal, and Lognormal functions with correlation coefficients of 0.963, 0.950, 0.985, and 0.964, respectively. The values of Atazanavir, Robavirin, Favipiravir, and Remdesivir follow the Normal distribution functions, Lognormal, Weibull, and Normal with correlation coefficients of 0.977, 0.986, 0.985, and 0.995, respectively. Finally, the values of Hydroxy Chloroquine and Lopinavir follow the Normal distribution function with a correlation coefficient of 0.969.
Fig. 20.
An estimate of the distribution functions of the required medicines
In order to prove the performance accuracy of the suggested simulation system, the simulation results are compared with the real-world results. Figure 21 indicates the comparison results of the simulation with the real-world with a 95% confidence interval (see “Appendix B”). For this purpose, the simulation model has been run 200 times for 1,000,000 and the average outcomes have been shown. It should be noted that the results of the real system are taken from the reports of the Ministry of Health of Iran on the demand for the required medicines in the first 9 months of 2020. It is clear that the results indicate that the simulation model with 95% reliability can have a good estimate of the real-world. Also, the Maan Whitney nonparametric test has been used. The null and two-sided research hypotheses for the Maan Whitney nonparametric test are stated as follows: H0: The two populations are equal versus, H1: The two populations are not equal. Also, the calculated P-values are 0.197, 0.411, 0.348, 0.375, 0.257, 0.311, 0.345, 0.274, 0.408 and 0.338 respectively. According to results, we do not reject H0 because sig (p-value) > 0.05. Therefore, we do not have sufficient evidence to conclude that two populations are not equal.
Fig. 21.
A 95% confidence interval for obtained outcomes by simulation and real system
Case study results
This section discusses the decision variables of the proposed model for a Pareto point for the first period. Table 11 represents how the allocation of warehouses to pharmacies. It is clear that Gaffney Warehouse is dedicated to pharmacies 1, 4, 7 and 2.
Table 11.
The allocation of the warehoused to pharmacies
| Warehouse | Pharmacy | Warehouse | Pharmacy |
|---|---|---|---|
| Gaffney | 1–4–7–2 | Florence | 6 |
| Anderson | 2–6–9 | Manning | 6–4–8 |
| Greenwood | 3–5 | Kingstree | 8–11–15–16 |
| Aiken | 13–16 | Conway | 9 |
| Newberry | 9–11–12–13 | Moncks Corner | 5 |
| Chester | 4–8–10 | St. George | 4–5 |
| Columbia | 14–15 | Ridgeland | 8 |
| Walterboro | 2–6–8 |
Additionally, the location of distribution centers and the allocation of capacity to them are reported in Table 12. As you can see, 13 distribution centers have been established. McCormick, Winnsboro, and Bennettsvill are distribution centers with small-capacity, Pickens, Kingstree, Branwell, and Ridgeland are distribution centers with medium-capacity, and Union, Laurens, Conway, Orangeburg, and Georgetown are distribution centers with large-capacity.
Table 12.
The location of distribution centers and the allocation of capacity to them
| DC | Capacity |
|---|---|
| Pickens | Medium |
| Union | Large |
| Laurens | Large |
| Mc Cormick | Small |
| Winnsboro | Small |
| Camden | large |
| Bennettsville | Small |
| Conway | Large |
| Kingstree | Medium |
| Orangeburg | Large |
| Branwell | Medium |
| Charleston | – |
| Ridgeland | Medium |
| Georgetown | Large |
Table 13 shows the amount of produced medicine by the main manufacturers. For example, main manufacturer 1 produces 2968 of Tocilizumab.
Table13.
The amount of produced medicines in the Main producers
| Main producer/medicine | Chloroquine phosphate | Tocilizumab | Interpherone | Umifenovir | Atazanavir | Robavirin | Favipiravir | Remdesivir | Hydroxy | Lopinavir |
|---|---|---|---|---|---|---|---|---|---|---|
| M1 | 4206 | 2968 | 3024 | 4467 | 2090 | 3746 | 3596 | 3733 | 1480 | 1757 |
| M2 | 3577 | 1747 | 1456 | 994 | 2443 | 3403 | 4003 | 1134 | 909 | 1600 |
| M3 | 2732 | 2053 | 1876 | 734 | 760 | 3304 | 3812 | 1842 | 4419 | 3646 |
| M4 | 3709 | 3315 | 3905 | 3835 | 4214 | 541 | 2071 | 3441 | 3712 | 2703 |
| M5 | 4127 | 770 | 3082 | 2059 | 2171 | 3226 | 1489 | 1249 | 3269 | 2329 |
| M6 | 3387 | 2615 | 2176 | 3749 | 2319 | 1330 | 3691 | 1824 | 1872 | 2054 |
| M7 | 2628 | 4428 | 3329 | 2235 | 3353 | 3825 | 3410 | 1457 | 911 | 676 |
| M8 | 1488 | 4459 | 3661 | 4414 | 4362 | 2360 | 2629 | 1005 | 3497 | 4254 |
Sensitivity analyses on significant parameters of the proposed mathematical model
In this subsection, the effect of transportation costs (,,,,, ,) and demand parameters (,,,,,, ) on the four objective functions are stated for sensitivity analyses. H-MO-3 algorithm as the more robust method in this paper to analyze the suggested model is used.
In order to analyze in terms of the transportations costs, the objective function values are examined in various modes (between − 20 and + 20%). The results of the sensitivity analysis of transportation costs parameters are shown in Fig. 17.
Fig. 17.
The results of the sensitivity analysis of transportation costs
By raising the transportation costs, the first and second objective functions increased steadily and upward from 0 to + 20% according to Fig. 17a, b. In contrast, the trend of the third objective function rose gradually between − 20 and 0%, but, dropped suddenly from 0 to + 20% in Fig. 17c. In terms of the fourth objective function, the trends climbed slightly and steadily in Fig. 17d.
For analyzing in terms of the demand, the four objective function values are reviewed in different cases (from − 20 to + 20%). The outputs of the sensitivity analysis of demand parameters are indicated in Fig. 18.
Fig. 18.
The results of the sensitivity analysis of demand parameters
By rising the demand parameters in the suggested model, in terms of the first objective function, from − 20 to + 10% causes a rose suddenly and upward, but the trend of the first objective fell downward between + 10 and + 20% in Fig. 18a. It is clear that in Fig. 18b, the behavior of the second objective function rose gradually by increasing demand parameters. In terms Fig. 18c, 10% rose in demand parameters causes that the third objective function go up gradually and a 10% decline in demand parameters makes that the third objective function dropped sharply. However, it is noticeable that the trend of the third objective function does not change and it remains fixed by dropping and rising more than ten percent. The behavior of the fourth objective function shows a gradual and slow increase from − 20 to + 20% in Fig. 18d.
Managerial insights
In this paper, the managerial insights of the system on resilience and sustainability in the healthcare network can be explained as follows:
We designed for the first time the resilience-sustainable healthcare network problem to minimize economic impacts (the total costs) and environmental aspects, to maximize social effects, and to minimize resiliency concepts during the COVID-19 pandemic. We believe that such a problem would be beneficial for healthcare systems during and after a global pandemic.
In the network resiliency, the capacity level of main and local producers, warehouses, and DCs have an important role. Moreover, raising the capacity levels will instantly decline the needed number of main and local producers, warehouses, and DCs in the SRHCN as well as decline the node and flow complexities (determined as resiliency metrics). Besides, the levels of the higher capacity convert to the level of the higher predetermined threshold in the criticality of the node metric that makes a decline in the number of the related nodes in the SRHCN.
Hence, this paper concentrates on investigating the COVID-19 effect on the environment. The current condition has obtained negative and positive impacts on the environment. The positives impacts involving a water purifier and an air purifier in the world. On the other hand, the negative effects are including the decrease of waste recycling and the raised volume of waste of the plastic products that wastes are containing masks, shields, plastic/glass cover of pharmaceutical products, etc. Thus, air quality has changed in many parts of the world after the stop of transport systems and the closure of production industries and companies. This situation of clean air will be short-lived. It is clear that it is exactly due to the COVID-19 pandemic, which can be realized how swiftly people are able change the quality of air through their activities. Additionally, in the future, it is essential to be aware of the subsequences of transport and companies' activity. Producers of medicine products (managers) in companies have a chance to re-assess their activities as well as quality, volume, utilized material and so on for sustainability in healthcare network have been directed. This variation in producers' decision-making will make a proper precondition for a trend of the successful sustainability towards a better and cleaner life on earth. These considerations make for the evaluation of the COVID-19 pandemic effects on the social and economic aspects, which are related to the mentioned environmental impacts.
It is obvious that the whole world from sustainable development by the COVID-19 pandemic has been affected. It is up to all people to boost decisions and views according to the suitable cooperation among all fields of the development of sustainability without concentrating particularly on one field of the development of sustainability. A set of documents for producers of medicine products (managers) have been created in recent months, which form the strategic pillars in this impellent period. For instance: workforce principles for the COVID-19 pandemic stakeholder capitalism in a time of the crisis and COVID-19 and the world of work: impact and policy responses, which in practice adjust proactive measures and standards for restart medical industries. First of all, the documents concentrate on strengthening the economic-social condition in the companies that it leads to solving problems caused by the COVID-19 pandemic. Secondly, according to the end of the COVID-19 pandemic outbreak, the environmental effects are only minimally. In order to eliminate the consequences of the financial crisis and save the economy, most of the measures that are being promoted are mainly of an economic feature. Therefore, in connection with this problem, the requirement for more search concentrated on the creation of documents defining measures and standards related to the environmental area is called for.
COVID-19 pandemic has affected climate and environmental issues. Then, air quality has improved in many cities with a decline in water pollution in various areas of the world because of a considerable slowdown of economic and social activities and movement restrictions. Further, increased utilize medicines for the COVID-19 patients and personal protective equipment including hand gloves, face mask, etc., generation of a massive amount of hospital waste and their haphazard disposal have negative effects on the environment. Figure 19 shows the negative and positive effects of the CPVID-19 on environmental issues.
As shown in the simulation, by increasing the capacity of hospitals along with effective quarantine, it can reduce the demand for COVID-19 medicines. Also, reducing demand reduces supply chain costs, environmental pollution, and social impacts. Therefore, managers are suggested to help reduce environmental pollution and supply chain costs by increasing the capacity of the hospital and establishing spacing rules.
According to the results of the sensitivity analysis, an increase in transportation costs outcomes in the following: an increase in the total costs in the healthcare network; a raise in environmental aspects (second objective function) including CO2 emissions and air pollutants, an increase in the social effects and then a decrease in the third objective function, and a raise in the resiliency concepts (the fourth objective function). This means that when transportation costs increase, air pollutants and carbon emissions are increased which has a negative effect on the environment by raising air pollutants and emissions during the COVID-19 pandemic in the real world.
If the demand for medicines raises, firstly the economic impacts (total costs) will raise, and secondly will decrease. Then, environmental effects and resilience aspects will increase. Finally, between − 20 and -10% and between 10 and 20%, the third objective function (social aspects) will be without change and will increase between − 10 and + 10%. In terms of the managerial perspective, if the demand for medicines during the COVID-19 pandemic increase, it is possible pharmacies and hospitals face shortages.
The findings and results of our paper can be utilized by the pharmaceutical industry, healthcare systems, pharmacies, and hospitals toward recovery and to advance decision-making systems during the COVID-19 pandemic outbreak
Fig. 19.
The negative and positive effects of the CPVID-19 on environmental issues
Conclusion and future works
In this research, the optimization of a multi-objective multi-period multi-products multi-echelon resilience-sustainable health care network considering to minimize economic impacts (the total costs) and environmental aspects, to maximize social effects, and to minimize resiliency concepts simultaneously have been presented. In this regard, a MILP model for a new production-allocation-location-distribution-inventory holding-flow problem under uncertainty has been formulated and designed. In order to compare with examined studies in the literature, the sustainability, resiliency, and Fuel consumption aspects of health care network during COVID-19 pandemic simultaneously was developed and highlighted for the first time. The current network has been divided into five levels containing main and local producers, warehouses, distribution centers, pharmacies, and hospitals. To cope with uncertain parameters, stochastic chance constraint programming method has been used. In addition, a simulation method has been used to estimate the amount of the needed demand of medicines. To solve the developed model and to find Pareto and near optimal solutions, three heuristic methods including H-MO-1, H-MO-2, and H-MO-3 were developed. To calibrate and tune the heuristic parameters, the Taguchi method was applied. According to eight assessment metrics including MID, QM, SNS, HV, NPS, IGD, MS, and SM, the heuristic methods were evaluated. In terms of the computational time, it is clear that the H-MO-3 method has the high quality and convergence in the medium-sized problems with average CPU time 68.5 s, but the average CPU time for H-MO-1 and H-MO-2 were 121.7 and 88.5 s respectively. Additionally, H-MO-3 method has better performance, high quality, and more powerful and robust than the other proposed heuristics for obtaining Pareto solutions/near optimal solutions according to the outcomes of the assessment metrics and RDI. Formulating a new MILP model to design a sustainable-resilience healthcare network during the COVID-19 pandemic and developing three hybrid meta-heuristic algorithms are among the most important contributions of this research. The sensitivity analysis shows that by raising the transportation costs, the first and second objective functions increased steadily and upward from 0 to + 20% and the trend of the third objective function rose gradually between − 20% and 0%, but, dropped suddenly from 0 to + 20%. Also in terms of the fourth objective function, the trends climbed slightly and steadily. This research, like other cases, has its own limitations and assumptions, which are expressed as it follows:
Due to several ways of COVID-19 transmission, in the system dynamic structure of the simulation model, only two ways of physical contact and transmission through sneezing and coughing are discussed. Therefore, other ways of transmission such as eating food contaminated with the virus or touching contaminated objects have been neglected.
Usually, numerous runs are required for each simulation model, and this can lead to high costs for using a computer. Simulation also requires access to a computer system equipped with features such as high RAM and CPU.
For future works, we recommend considering ordering policy to improve the current mathematical model. Also, we suggest new heuristic approaches and exact methods such as logic-based Benders decomposition and Lagrangian relaxation methods in comparison with these presented heuristic methods. Finally, uncertainty programming methods such as possibility, fuzzy, robust, etc., can be added in this research.
Electronic supplementary material
Below is the link to the electronic supplementary material.
Acknowledgements
The present investigation is supported under the University of Tehran, Tehran, Iran, Postdoctoral Fellowship granted by the Iran National Science Foundation (INSF) (Grant No. 99011233).
Appendix A
See Fig. 20.
Appendix B
See Fig. 21.
Footnotes
Publisher's Note
Springer Nature remains neutral with regard to jurisdictional claims in published maps and institutional affiliations.
Contributor Information
Fariba Goodarzian, Email: fariba.goodarzian@mirlabs.org, Email: faribagoodarzian7070@gmail.com.
Peiman Ghasemi, Email: st_p_ghasemi@azad.ac.ir.
Angappa Gunasekaren, Email: aqg6076@psu.edu.
Ata Allah Taleizadeh, Email: Taleizadeh@ut.ac.ir.
Ajith Abraham, Email: ajith.abraham@ieee.org.
References
- Ang KM, Lim WH, Isa NAM, Tiang SS, Wong CH. A constrained multi-swarm particle swarm optimization without velocity for constrained optimization problems. Expert Systems with Applications. 2020;140:112882. doi: 10.1016/j.eswa.2019.112882. [DOI] [Google Scholar]
- Babaee Tirkolaee E, Aydın NS. A sustainable medical waste collection and transportation model for pandemics. Waste Management & Research. 2021;39:34–44. doi: 10.1177/0734242X211000437. [DOI] [PubMed] [Google Scholar]
- Babaeinesami, A., & Ghasemi, P. (2020). Ranking of hospitals: A new approach comparing organizational learning criteria. International Journal of Healthcare Management, 1–9.
- Barbosa-Póvoa AP, da Silva C, Carvalho A. Opportunities and challenges in sustainable supply chain: An operations research perspective. European Journal of Operational Research. 2018;268(2):399–431. doi: 10.1016/j.ejor.2017.10.036. [DOI] [Google Scholar]
- Betti, F., & Ni, J. (2020). How China can rebuild global supply chain resilience after COVID-19. In World Economic Forum. Retrieved from: https://www.weforum.org/agenda/2020/03/coronavirus-and-global-supply-chains.
- Charnes A, Cooper WW. Chance-constrained programming. Management Science. 1959;6(1):73–79. doi: 10.1287/mnsc.6.1.73. [DOI] [Google Scholar]
- Dragojevic Simic, V., Miljkovic, M., Stamenkovic, D., Vekic, B., Ratkovic, N., Simic, R., & Rancic, N. (2020). An overview of antiviral strategies for coronavirus 2 (SARS‐CoV‐2) infection with special reference to antimalarial drugs chloroquine and hydroxychloroquine. International Journal of Clinical Practice, e13825. [DOI] [PubMed]
- Franco C, Alfonso-Lizarazo E. Optimization under uncertainty of the pharmaceutical supply chain in hospitals. Computers & Chemical Engineering. 2020;135:106689. doi: 10.1016/j.compchemeng.2019.106689. [DOI] [Google Scholar]
- Ghasemi P, Khalili-Damghani K. A robust simulation-optimization approach for pre-disaster multi-period location–allocation–inventory planning. Mathematics and Computers in Simulation. 2020;179:69–95. doi: 10.1016/j.matcom.2020.07.022. [DOI] [Google Scholar]
- Ghasemi P, Khalili-Damghani K, Hafezalkotob A, Raissi S. Stochastic optimization model for distribution and evacuation planning (A case study of Tehran earthquake) Socio-Economic Planning Sciences. 2020;71:100745. doi: 10.1016/j.seps.2019.100745. [DOI] [Google Scholar]
- Goldberg, D. E., & Holland, J. H. (1988). Genetic algorithms and machine learning.
- Goodarzian F, Hosseini-Nasab H, Fakhrzad MB. A multi-objective sustainable medicine supply chain network design using a novel hybrid multi-objective metaheuristic algorithm. International Journal of Engineering. 2020;33(10):1986–1995. [Google Scholar]
- Goodarzian F, Hosseini-Nasab H, Muñuzuri J, Fakhrzad MB. A multi-objective pharmaceutical supply chain network based on a robust fuzzy model: A comparison of meta-heuristics. Applied Soft Computing. 2020;92:106331. doi: 10.1016/j.asoc.2020.106331. [DOI] [Google Scholar]
- Goodarzian F, Kumar V, Ghasemi P. A set of efficient heuristics and meta-heuristics to solve a multi-objective pharmaceutical supply chain network. Computers & Industrial Engineering. 2021;158:107389. doi: 10.1016/j.cie.2021.107389. [DOI] [Google Scholar]
- Goodarzian F, Taleizadeh AA, Ghasemi P, Abraham A. An integrated sustainable medical supply chain network during COVID-19. Engineering Applications of Artificial Intelligence. 2021;100:104188. doi: 10.1016/j.engappai.2021.104188. [DOI] [PMC free article] [PubMed] [Google Scholar]
- Goodarzian, F., Wamba, S. F., Mathiyazhagan, K., & Taghipour, A. (2021a). A new bi-objective green medicine supply chain network design under fuzzy environment: Hybrid metaheuristic algorithms. Computers & Industrial Engineering, 107535.
- Grassmann WK. Factors affecting warm-up periods in discrete event simulation. SIMULATION. 2014;90(1):11–23. doi: 10.1177/0037549713508334. [DOI] [Google Scholar]
- Han, F., Li, L., Cai, W., Li, C., Deng, X., & Sutherland, J. W. (2020). Parameters optimization considering the trade-off between cutting power and MRR based on linear decreasing particle swarm algorithm in milling. Journal of Cleaner Production, 121388.
- Ivanov, D. (2020). Viable supply chain model: integrating agility, resilience and sustainability perspectives—Lessons from and thinking beyond the COVID-19 pandemic. Annals of Operations Research, 1–21. [DOI] [PMC free article] [PubMed]
- Jánošová P. Decision making process of managers towards sustainability and environment affected by COVID-19. FORCE: Focus on Research in Contemporary Economics. 2020;1(1):19–30. [Google Scholar]
- Kaya O, Urek B. A mixed integer nonlinear programming model and heuristic solutions for location, inventory and pricing decisions in a closed loop supply chain. Computers & Operations Research. 2016;65:93–103. doi: 10.1016/j.cor.2015.07.005. [DOI] [Google Scholar]
- Law, A. M. (2020). Statistical analysis of simulation output data: The practical state of the art. In 2020 Winter Simulation Conference (WSC) (pp. 1117–1127). IEEE.
- Li, Y., Chen, K., Collignon, S., & Ivanov, D. (2020). Ripple effect in the supply chain network: Forward and backward disruption propagation, network health and firm vulnerability. European Journal of Operational Research. [DOI] [PMC free article] [PubMed]
- Mardani A, Kannan D, Hooker RE, Ozkul S, Alrasheedi M, Tirkolaee EB. Evaluation of green and sustainable supply chain management using structural equation modelling: A systematic review of the state of the art literature and recommendations for future research. Journal of Cleaner Production. 2020;249:119383. doi: 10.1016/j.jclepro.2019.119383. [DOI] [Google Scholar]
- Mardani A, Saraji MK, Mishra AR, Rani P. A novel extended approach under hesitant fuzzy sets to design a framework for assessing the key challenges of digital health interventions adoption during the COVID-19 outbreak. Applied Soft Computing. 2020;96:106613. doi: 10.1016/j.asoc.2020.106613. [DOI] [PMC free article] [PubMed] [Google Scholar]
- Mohammed AM, Duffuaa SO. A Tabu search based algorithm for the optimal design of multi-objective multi-product supply chain networks. Expert Systems with Applications. 2020;140:112808. doi: 10.1016/j.eswa.2019.07.025. [DOI] [Google Scholar]
- Mousazadeh M, Torabi SA, Zahiri B. A robust possibilistic programming approach for pharmaceutical supply chain network design. Computers & Chemical Engineering. 2015;82:115–128. doi: 10.1016/j.compchemeng.2015.06.008. [DOI] [Google Scholar]
- Nagurney, A. (2021). Supply chain game theory network modeling under labor constraints: Applications to the Covid-19 pandemic. European Journal of Operational Research. [DOI] [PMC free article] [PubMed]
- Nama, S., Saha, A. K., & Sharma, S. (2020). A hybrid TLBO algorithm by quadratic approximation for function optimization and Its Application. In Recent trends and advances in artificial intelligence and internet of things (pp. 291–341). Springer
- Nasrollahi, M., & Razmi, J. (2019). A mathematical model for designing an integrated pharmaceutical supply chain with maximum expected coverage under uncertainty. Operational Research, 1–28.
- Nematollahi M, Hosseini-Motlagh SM, Ignatius J, Goh M, Nia MS. Coordinating a socially responsible pharmaceutical supply chain under periodic review replenishment policies. Journal of Cleaner Production. 2018;172:2876–2891. doi: 10.1016/j.jclepro.2017.11.126. [DOI] [Google Scholar]
- Nezamoddini N, Gholami A, Aqlan F. A risk-based optimization framework for integrated supply chains using genetic algorithm and artificial neural networks. International Journal of Production Economics. 2020;225:107569. doi: 10.1016/j.ijpe.2019.107569. [DOI] [Google Scholar]
- Nikolopoulos K, Punia S, Schäfers A, Tsinopoulos C, Vasilakis C. Forecasting and planning during a pandemic: COVID-19 growth rates, supply chain disruptions, and governmental decisions. European Journal of Operational Research. 2021;290(1):99–115. doi: 10.1016/j.ejor.2020.08.001. [DOI] [PMC free article] [PubMed] [Google Scholar]
- Rao R, Patel V. An elitist teaching-learning-based optimization algorithm for solving complex constrained optimization problems. International Journal of Industrial Engineering Computations. 2012;3(4):535–560. doi: 10.5267/j.ijiec.2012.03.007. [DOI] [Google Scholar]
- Rastegar M, Tavana M, Meraj A, Mina H. An inventory-location optimization model for equitable influenza vaccine distribution in developing countries during the COVID-19 pandemic. Vaccine. 2021;39(3):495–504. doi: 10.1016/j.vaccine.2020.12.022. [DOI] [PMC free article] [PubMed] [Google Scholar]
- Roshan M, Tavakkoli-Moghaddam R, Rahimi Y. A two-stage approach to agile pharmaceutical supply chain management with product substitutability in crises. Computers & Chemical Engineering. 2019;127:200–217. doi: 10.1016/j.compchemeng.2019.05.014. [DOI] [Google Scholar]
- Sabouhi F, Pishvaee MS, Jabalameli MS. Resilient supply chain design under operational and disruption risks considering quantity discount: A case study of pharmaceutical supply chain. Computers & Industrial Engineering. 2018;126:657–672. doi: 10.1016/j.cie.2018.10.001. [DOI] [Google Scholar]
- Salehi-Amiri, A., Jabbarzadeh, A., Zahedi, A., Akbarpour, N., & Hajiaghaei-Keshteli, M. (2021). Relief supply chain management using internet of things to address COVID-19 outbreak. Computers & Industrial Engineering, 107429. [DOI] [PMC free article] [PubMed]
- Savadkoohi E, Mousazadeh M, Torabi SA. A possibilistic location-inventory model for multi-period perishable pharmaceutical supply chain network design. Chemical Engineering Research and Design. 2018;138:490–505. doi: 10.1016/j.cherd.2018.09.008. [DOI] [Google Scholar]
- Schmidt, H., Weintraub, R., Williams, M. A., Miller, K., Buttenheim, A., Sadecki, E., et al. (2021). Equitable allocation of COVID-19 vaccines in the United States. Nature Medicine, 1–10. [DOI] [PubMed]
- Shamsuzzoha A, Ndzibah E, Kettunen K. Data-driven sustainable supply chain through centralized logistics network: Case study in a Finnish pharmaceutical distributor company. Current Research in Environmental Sustainability. 2020;2:100013. doi: 10.1016/j.crsust.2020.100013. [DOI] [Google Scholar]
- Sharma R, Kamble SS, Gunasekaran A, Kumar V, Kumar A. A systematic literature review on machine learning applications for sustainable agriculture supply chain performance. Computers & Operations Research. 2020;119:104926. doi: 10.1016/j.cor.2020.104926. [DOI] [Google Scholar]
- Shi, Y. (2001). Particle swarm optimization: developments, applications and resources. In Proceedings of the 2001 congress on evolutionary computation (IEEE Cat. No. 01TH8546) (Vol. 1, pp. 81–86). IEEE.
- Shirazi H, Kia R, Ghasemi P. Ranking of hospitals in the case of COVID-19 outbreak: A new integrated approach using patient satisfaction criteria. International Journal of Healthcare Management. 2020;13(4):312–324. doi: 10.1080/20479700.2020.1803622. [DOI] [Google Scholar]
- Tat, R., Heydari, J., & Rabbani, M. (2020). A mathematical model for pharmaceutical supply chain coordination: Reselling medicines in an alternative market. Journal of Cleaner Production, 121897.
- Tavana, M., Govindan, K., Nasr, A. K., Heidary, M. S., & Mina, H. (2021). A mathematical programming approach for equitable COVID-19 vaccine distribution in developing countries. Annals of Operations Research, 1–34. [DOI] [PMC free article] [PubMed]
- Tirkolaee EB, Abbasian P, Weber GW. Sustainable fuzzy multi-trip location-routing problem for medical waste management during the COVID-19 outbreak. Science of the Total Environment. 2021;756:143607. doi: 10.1016/j.scitotenv.2020.143607. [DOI] [PMC free article] [PubMed] [Google Scholar]
- Valizadeh, J., & Mozafari, P. (2021). A novel cooperative model in the collection of infectious waste in COVID-19 pandemic. Journal of Modelling in Management.
- Weraikat D, Zanjani MK, Lehoux N. Improving sustainability in a two-level pharmaceutical supply chain through Vendor-Managed Inventory system. Operations Research for Health Care. 2019;21:44–55. doi: 10.1016/j.orhc.2019.04.004. [DOI] [Google Scholar]
- World Health Organization. (2020). Coronavirus disease 2019 (COVID-19): situation report, 75.
- Xu Y, Yang Z, Li X, Kang H, Yang X. Dynamic opposite learning enhanced teaching–learning-based optimization. Knowledge-Based Systems. 2020;188:104966. doi: 10.1016/j.knosys.2019.104966. [DOI] [Google Scholar]
- Zahiri B, Jula P, Tavakkoli-Moghaddam R. Design of a pharmaceutical supply chain network under uncertainty considering perishability and substitutability of products. Information Sciences. 2018;423:257–283. doi: 10.1016/j.ins.2017.09.046. [DOI] [Google Scholar]
- Zandkarimkhani, S., Mina, H., Biuki, M., & Govindan, K. (2020). A chance constrained fuzzy goal programming approach for perishable pharmaceutical supply chain network design. Annals of Operations Research, 1–2.
- Zhang S, Lee CKM, Wu K, Choy KL. Multi-objective optimization for sustainable supply chain network design considering multiple distribution channels. Expert Systems with Applications. 2016;65:87–99. doi: 10.1016/j.eswa.2016.08.037. [DOI] [Google Scholar]
- Zhang X, Liu H, Tu L. A modified particle swarm optimization for multimodal multi-objective optimization. Engineering Applications of Artificial Intelligence. 2020;95:103905. doi: 10.1016/j.engappai.2020.103905. [DOI] [Google Scholar]
Associated Data
This section collects any data citations, data availability statements, or supplementary materials included in this article.


