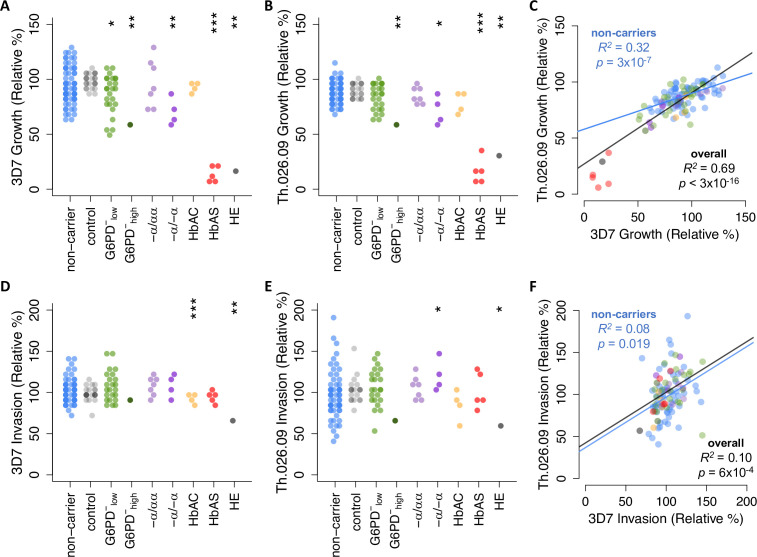
Figure 2. Plasmodium falciparum replication rate varies widely among donor RBCs.
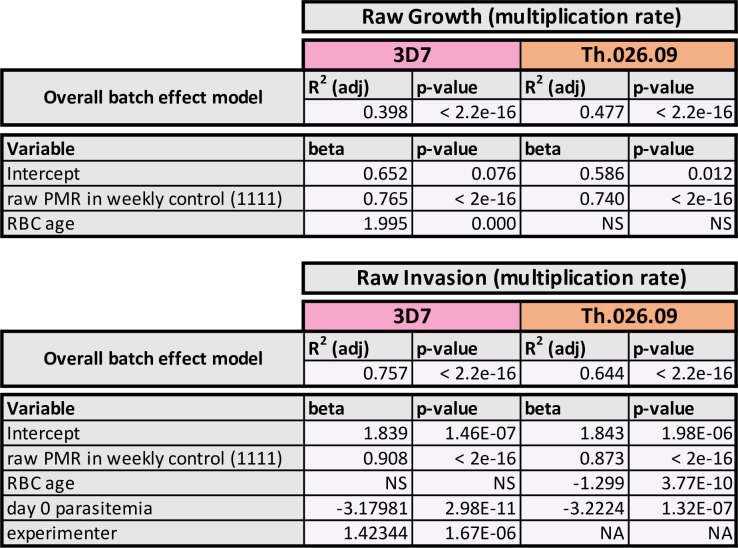
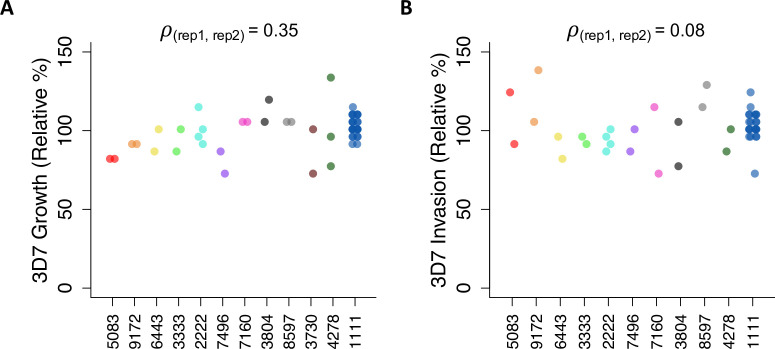
(A, B) Growth of P. falciparum lab strain 3D7 (A) or clinical isolate Th.026.09 (B) over a full 48-hr cycle in donor RBCs (see Figure 1C). Growth is presented relative to the average non-carrier rate after correction for batch effects (Figure 2—figure supplement 1; see Materials and methods), including comparison to a repeated RBC control shown in gray. Each carrier group was compared to unrelated non-carriers using Student’s t-test, except in cases where N=1, where asterisks instead indicate the percentile of the non-carrier distribution. Repeated measurements of 11 donors are shown in Figure 2—figure supplement 2. (C) Per-sample growth rates are correlated between the two P. falciparum strains. (D–F) As in (A–C) but for P. falciparum invasion efficiency (see Figure 1C). R2 and p-values are derived from OLS regression. *p<0.1; **p<0.05; ***p<0.01. RBC, red blood cell.


