Abstract
Prions have been linked to neurodegenerative diseases that affect various species of mammals including humans. The prion protein, located mainly in neurons, is believed to play the role of metal ion transporter. High levels of copper ions have been related to structural changes. A 32-residue region of the N-terminal domain, known as octarepeat, can bind up to four copper ions. Different coordination modes have been observed and are strongly dependent on Cu2+ concentration. Many theoretical studies carried out so far have focused on studying the coordination modes of a single copper ion. In this work we investigate the octarepeat region coordinated with four copper ions. Molecular dynamics (MD) and hybrid quantum mechanics/molecular mechanics (QM/MM) simulations using the polarizable AMOEBA force field have been carried out. The polarizable MD simulations starting from a fully extended conformation indicate that the tetra-Cu2+/octarepeat complex forms a globular structure. The globular form is stabilized by interactions between Cu2+ and tryptophan residues resulting in some coordination sites observed to be in close proximity, in agreement with experimental results. Subsequent QM/MM simulations on several snapshots suggests the system is in a high-spin quintet state, with all Cu2+ bearing one single electron, and all unpaired electrons are ferromagnetically coupled. NMR simulations on selected structures provides insights on the chemical shifts of the first shell ligands around the metals with respect to inter-metal distances.
1. Introduction
Neurodegenerative diseases such as Creutzfeldt–Jakob disease in humans, mad cow disease in cattle, chronic wasting disease in deer or scrapie in sheep are related to the accumulation of prion protein (PrP) in the brain.1 Prion diseases are part of a larger group of protein aggregation disorders including Alzheimer’s and Parkinson’s disease. These diseases usually take many years to develop. The disorder progresses asymptomatically during the incubation period until the onset of degeneration of the nervous system causing tremendous damage to cognitive processes and high fatality rates in both humans and animals. Disorders can occur sporadically or arise from infection by contaminated material.2 Significant efforts have been made to develop therapies against prion disease, including small molecules, vaccination, and antibody-based therapies.3–5 The origin of prion diseases has been related to the conversion of the PrP from its normal cellular form (PrPC) to the β-sheet rich infectious scrapie isoform (PrPSc).6 PrPC and PrPSc share an identical primary sequence, but they have different physicochemical and structural characteristics. PrPSc forms detergent insoluble amyloid aggregates whereas PrPC is detergent soluble.7 The formation of proteinase K-sensitive PrPSc oligomers is associated with serious pathological changes in the brain.8
PrPC is found in several mammal species such as mice, hamsters, monkeys, sheep, goats, minks, cattle, deer and humans.9–13 PrP is a typical component of many types of tissues such as lung and kidney. In the central nervous system it is expressed at pre- and post-synaptic membranes of neurons where it is found as a glycophosphatidylinositol (GPI) anchored glycoprotein.14 It is located in detergent-resistant lipid rafts on the cell surface.15 The function of PrPC in healthy tissues is not clear because mice without prion protein expression do not show symptoms of prion disease, suggesting that neurodegeneration is due to an increase in toxic compounds, rather than a loss of activity.16 However, it has been proposed that PrPC modulates various synaptic mechanisms through interaction with different proteins as well as cell-protective mechanisms against oxidative stress, neuronal maintenance, and metal ion homeostasis.17,18 For example, PrPC modulates receptors involved in memory and learning, such as the N-methyl-d-aspartate receptor (NMDAR), and it does it in a Cu-dependent manner.19,20
Prior to post-translational modifications, PrPC is a protein of about 254 residues.17 Once the signal peptide has been removed, the protein consists of 209 residues. PrPC has two well differentiated domains, a structured C-terminal domain (residues 121–231) and an unstructured N-terminal domain (residues 23–120).21 The C-terminal domain is composed of two short antiparallel β-sheets and three α-helices (see Fig. 1). The N-terminal domain of the protein is glycine-rich and some regions can be distinguished, such as the polybasic regions.22 PrPC has the ability to bind various metal ions, including copper, zinc, iron, and manganese.23
Fig. 1.
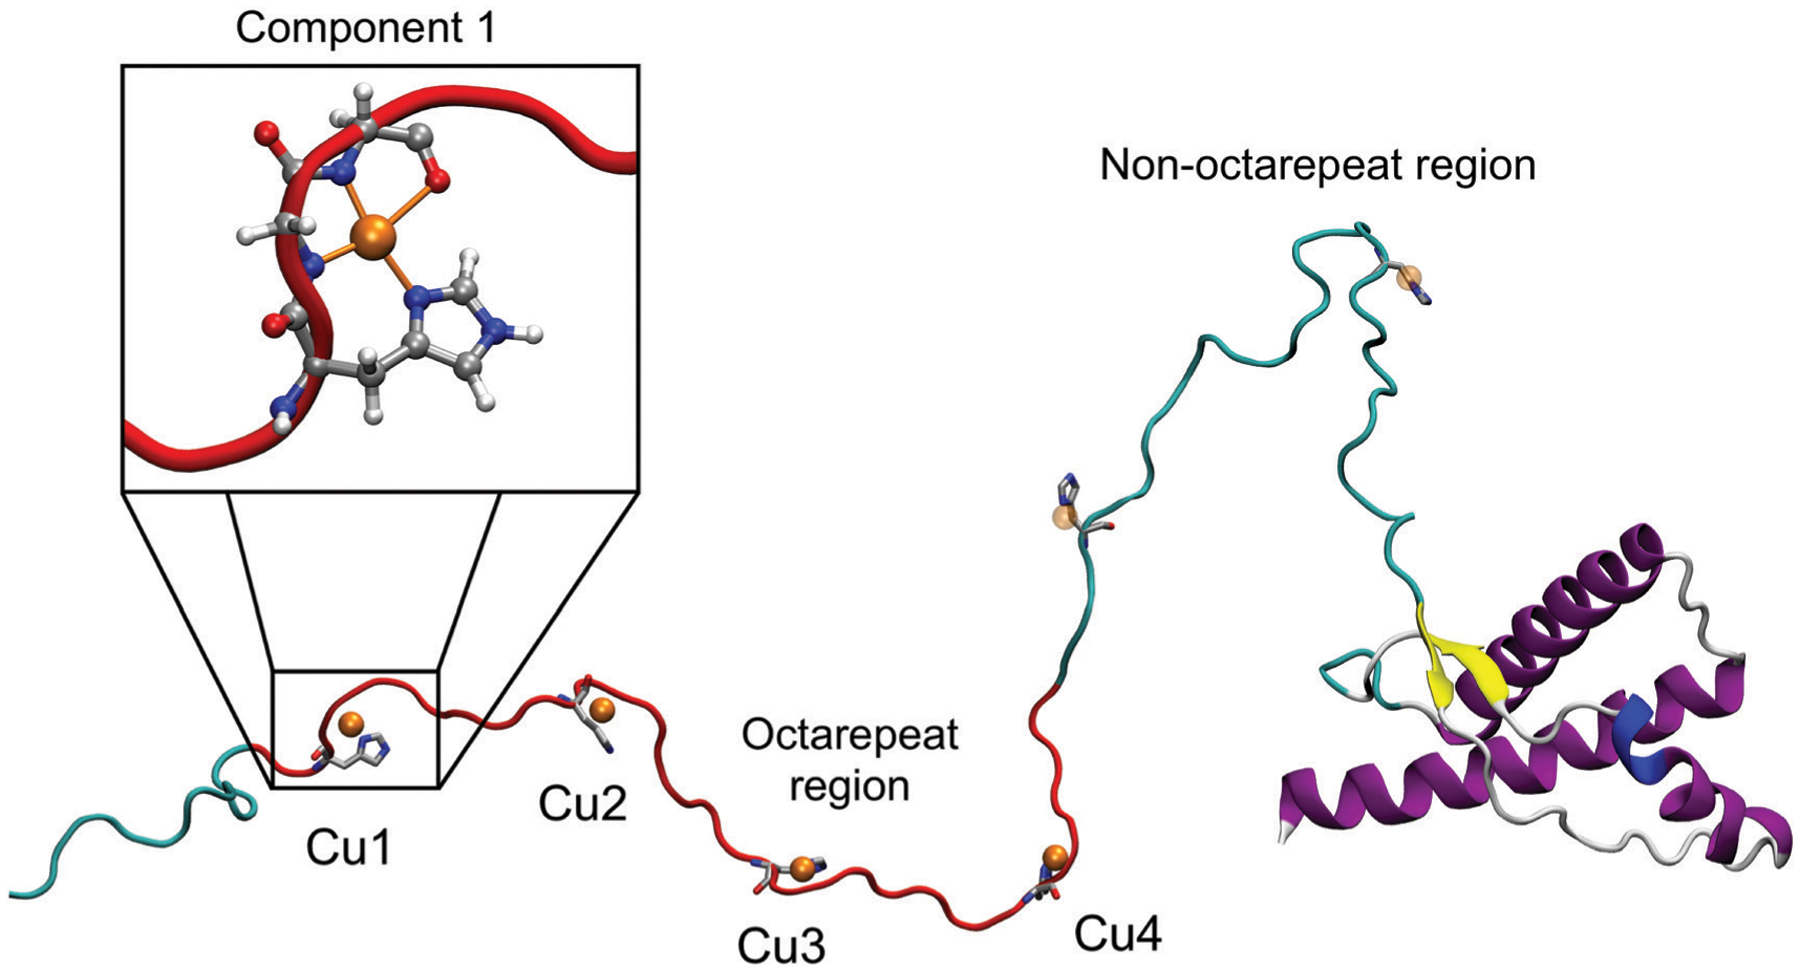
Prion protein model. The structured (right) and unstructured (left) domains are displayed. The red ribbons represent the octarepeat region within the N-terminal domain.
One of the most studied fragments is the octarepeat region (residues 60 to 91), composed by four octapeptides (PHGGGWGQ).24 The octarepeat region contains four histidine residues able to bind divalent cations, such as Cu2+ or Zn2+ ions.25,26 In addition, other binding sites outside of the octarepeat region involving His96 and His111 residues have also been observed.27,28 Changes in copper concentrations occur during synaptic transmission, varying from nanomolar to micromolar concentration range.29,30 In addition, it has been suggested that copper ions could cause conformational changes in the octarepeat region and promote the interaction between amyloid-beta (Aβ) and prion protein.31–33 The Aβ–Cu–PrP interaction is highly site-specific and is dependent on the copper occupancy.34 It has also been proposed that the binding of Cu ions to PrP favors the interactions between the N-terminal and C-terminal domains.35 Furthermore, Cu ions compete with other divalent ions.36
Different modes of octarepeat coordination have been identified, controlled by the ratio of Cu2+/protein concentration. At physiological pH, the octarepeat region binds Cu2+ ions in three distinct coordination modes, referred to as components 1, 2, and 3.37–39 Component 1 arises at full copper occupancy where each octarepeat segment binds a single Cu2+ ion through an imidazole nitrogen of histidine, two deprotonated amide nitrogens from glycines immediately adjacent to the histidine, and a carbonyl oxygen from the second glycine. The component 3 coordination mode, observed at low copper occupancy, involves up to four octapeptides binding a single Cu2+ through the histidine imidazoles. In component 2, at intermediate occupancy, two or more His imidazoles can coordinate a single Cu2+.38
The different coordination modes for single cations have been studied with density functional theory,40–42 and with classical approaches.43 Component 1 has been the most studied coordination mode,44 due to the availability of a crystallographic structure for the Cu-HGGGW segment.45 In the crystal structure, the copper ion in the single Cu-HGGGW segment is penta-coordinated with the deprotonated nitrogens of the two sequential glycines, the δ-nitrogen of histidine, the carbonyl oxygen of the second glycine and an oxygen from a water molecule that interacts with the NH of the indole ring of tryptophan. Theoretical results have shown that the coordination geometry in component 1 is planar when it is tetracoordinated.46 Furthermore, the interactions with these three equatorial nitrogen donors are not equivalent. In fact, the copper nitrogen bonds with the amide groups are more covalent than the copper nitrogen bond in histidine.44 On the other hand, theoretical results have shown that the coordination of the copper ion forming the component 3 is mainly planar, with N–Cu–N angles close to 90°.47 The electron configuration of the copper ion is d9 with an unpaired electron. Electronic structure calculations have shown that the highest occupied molecular orbital involves the orbital of copper.48 Results from ab initio molecular dynamics have shown that copper ions in the [Cu(HGGG)]2 dimer can interact with each other.49
In this contribution, we present results from polarizable MD and QM/MM simulations on models of the full octarepeat region in the component 1 coordination mode aiming to better understand the molecular and electronic structure of the octarepeat region in full copper concentration. The remainder of the paper is organized as follows. The Methods section describes the development of the AMOEBA parameters for two models, and details of the classical and QM/MM simulations. Subsequently, the results section presents a discussion of the structural and dynamical results obtained from the MD simulations, followed by a detailed analysis of the electronic structure results from the QM/MM simulations, including NMR calculations for selected snapshots. Our study shows that: (i) The interactions between tryptophan and copper ions observed in the crystal structure are possible in solution, and (ii) The Cu-highly occupied octarepeat region is an open shell system where each copper ion has one unpaired electron.
2. Methods
We studied the octarepeat region (residues 60–91) in the hamster prion protein coordinated with four copper ions, where each copper ion is forming component 1. All calculations involving a classical potential were performed with the 2018 AMOEBA (Atomic Multipole Optimized Energetics for Biomolecular) polarizable force field.50,51 We built a 32-residue peptide (PHGGGWGQ × 4) using Tinker tools. The N-terminal and C-terminal were capped with acetyl and N-methylamide, respectively. An ε-protonated histidine (HIE), a Cu2+ ion, and two glycines with deprotonated backbone amines were considered in each Cu2+ binding site (see Fig. S1a, ESI†). For the parametrization we have used the acetyl-HIS–GLY–GLY–N-methylamide peptide coordinating a copper ion (see Fig. S1b, ESI†). This peptide was optimized with the ωB97-XD52 functional and the 6–311G(d,p)53 basis set as implemented in Gaussian16.54 The short peptide shares the main characteristics of the OR peptide, that is, each copper ion is coordinated with two deprotonated nitrogens of two adjacent glycines, a carbonyl oxygen atom, and a nitrogen atom of the imidazole ring of histidine. In all cases, the considered systems are neutral since the charge of each Cu2+ ion is neutralized by the negative charges of the deprotonated backbone nitrogens. The bonded and non-bonded parameters were obtained according to the procedure described in ref. 55. The Tholé factor and the polarizability of the copper ion were taken from ref. 56. The parameters obtained for the copper ion and its closest atoms were adapted to the OR peptide (see ESI†).
Two octarepeat models were developed: model 1 includes bonded interactions between the copper ion and the deprotonated nitrogens, as well as with the nitrogen atom of the imidazole ring of the coordinating histidine (see Fig. S2a, ESI†). The second model, considers only bonded interactions between the copper ion and the deprotonated backbone nitrogen atoms (see Fig. S2b, ESI†). That is, in model 2 the histidine imidazole ring interacts with Cu2+ only via non-bonded interactions. In other words, model 2 allows us to see the effect of increasing the number of degrees of freedom. In both models the carbonyl oxygen coordinates the copper ion only via non-bonded interactions.
The OR peptide with four copper ions was relaxed via molecular dynamics in vacuum for 2 ns to obtain a starting structure for our simulations. Complementary simulations using implicit water with the GBSA model57 were also performed. The 32-residue peptide obtained after the relaxation in implicit solvent was placed in the center of a 60 × 60 × 60 Å box containing 8000 water molecules. After the equilibration step, MD simulations were carried out for 100 ns in an NPT ensemble (1 atm and 298 K). The Monte Carlo barostat58 and the Bussi59 thermostat were used. The duration of the time step was 2 fs using RESPA60 integrator. The smooth particle mesh Ewald (PME) method61 was used in the calculation of charge, atomic multipole and polarization interactions. A value of 9 Å was used for the cutoff distance value for van der Waals potential energy interactions and the real-space distance cutoff in the Ewald summation. Geometry sampling was done every 5 ps. In total 20 000 structures were obtained.
Root mean squared deviation (RMSD) with respect to the initial (GBSA relaxed) structure, radius of gyration (Rg), and root mean squared fluctuation (RMSF) were calculated for both systems to compare structural features between the models. A six-dimensional cluster analysis using the k-means method was carried out for each model. Each dimension corresponds to a distance between two copper ions. We evaluated six distances corresponding to the distances between the adjacent copper ions (Cu1–Cu2, Cu2–Cu3 and Cu3–Cu4) and the non-adjacent copper ions (Cu1–Cu3, Cu2–Cu4 and Cu1–Cu4). The ordering of the copper ions follows the direction from the N-terminal to the C-terminal (see Fig. 1). The total data set was divided into 10 clusters. Additionally, we included the structure where the average distances between the copper ions are minimized, because we expect any electronic effects to be exacerbated in this structure.
We used the LICHEM62,63 (Layered Interacting CHEmical Models) code to perform a single point QM/MM analysis of the structures closest to the centroids of each cluster. QM subsystem calculations were carried out with the ωB97-XD functional and the Def2-SVP basis set using Gaussian16.54 The MM calculations were performed with Tinker 8 using the AMOEBABIO18 force field. We have used the long-range electrostatic corrections (LREC) method,64 for multipolar/polarizable QM/MM simulations using a LREC cutoff of 25 Å for the smoothing function. We have use the Ewald summation and periodic boundary conditions for the MM calculations.
In all cases, the pseudobond approach65 was employed for covalent bonds across the QM/MM boundary. In this approach, only 3 residues per OR unit are considered in the QM region, that is, histidine and adjacent glycines that participate in the coordination of the copper ion (see Fig. 2). The remaining residues (PRO and GLY–TRP–GLY–GLN per OR unit) and all solvent molecules were described by the AMOEBABIO18 potential. The structure with the pseudobond approximation was used to perform non-relativistic nuclear magnetic resonance calculations using Gaussian1654 and combined ELF/NCI analysis66 using the MultiWFN67 and TopMod68 software packages. We calculated NMR shifts using the Gauge-Independent Atomic Orbital (GIAO) method69–71 implemented in Gaussian code. In addition, we have calculated spin–spin coupling constants for the copper ions. Both calculations were performed with the converged SCF density in the external field provided by AMOEBA using the LICHEM procedure, which allows the polarization of the wavefunction.
Fig. 2.
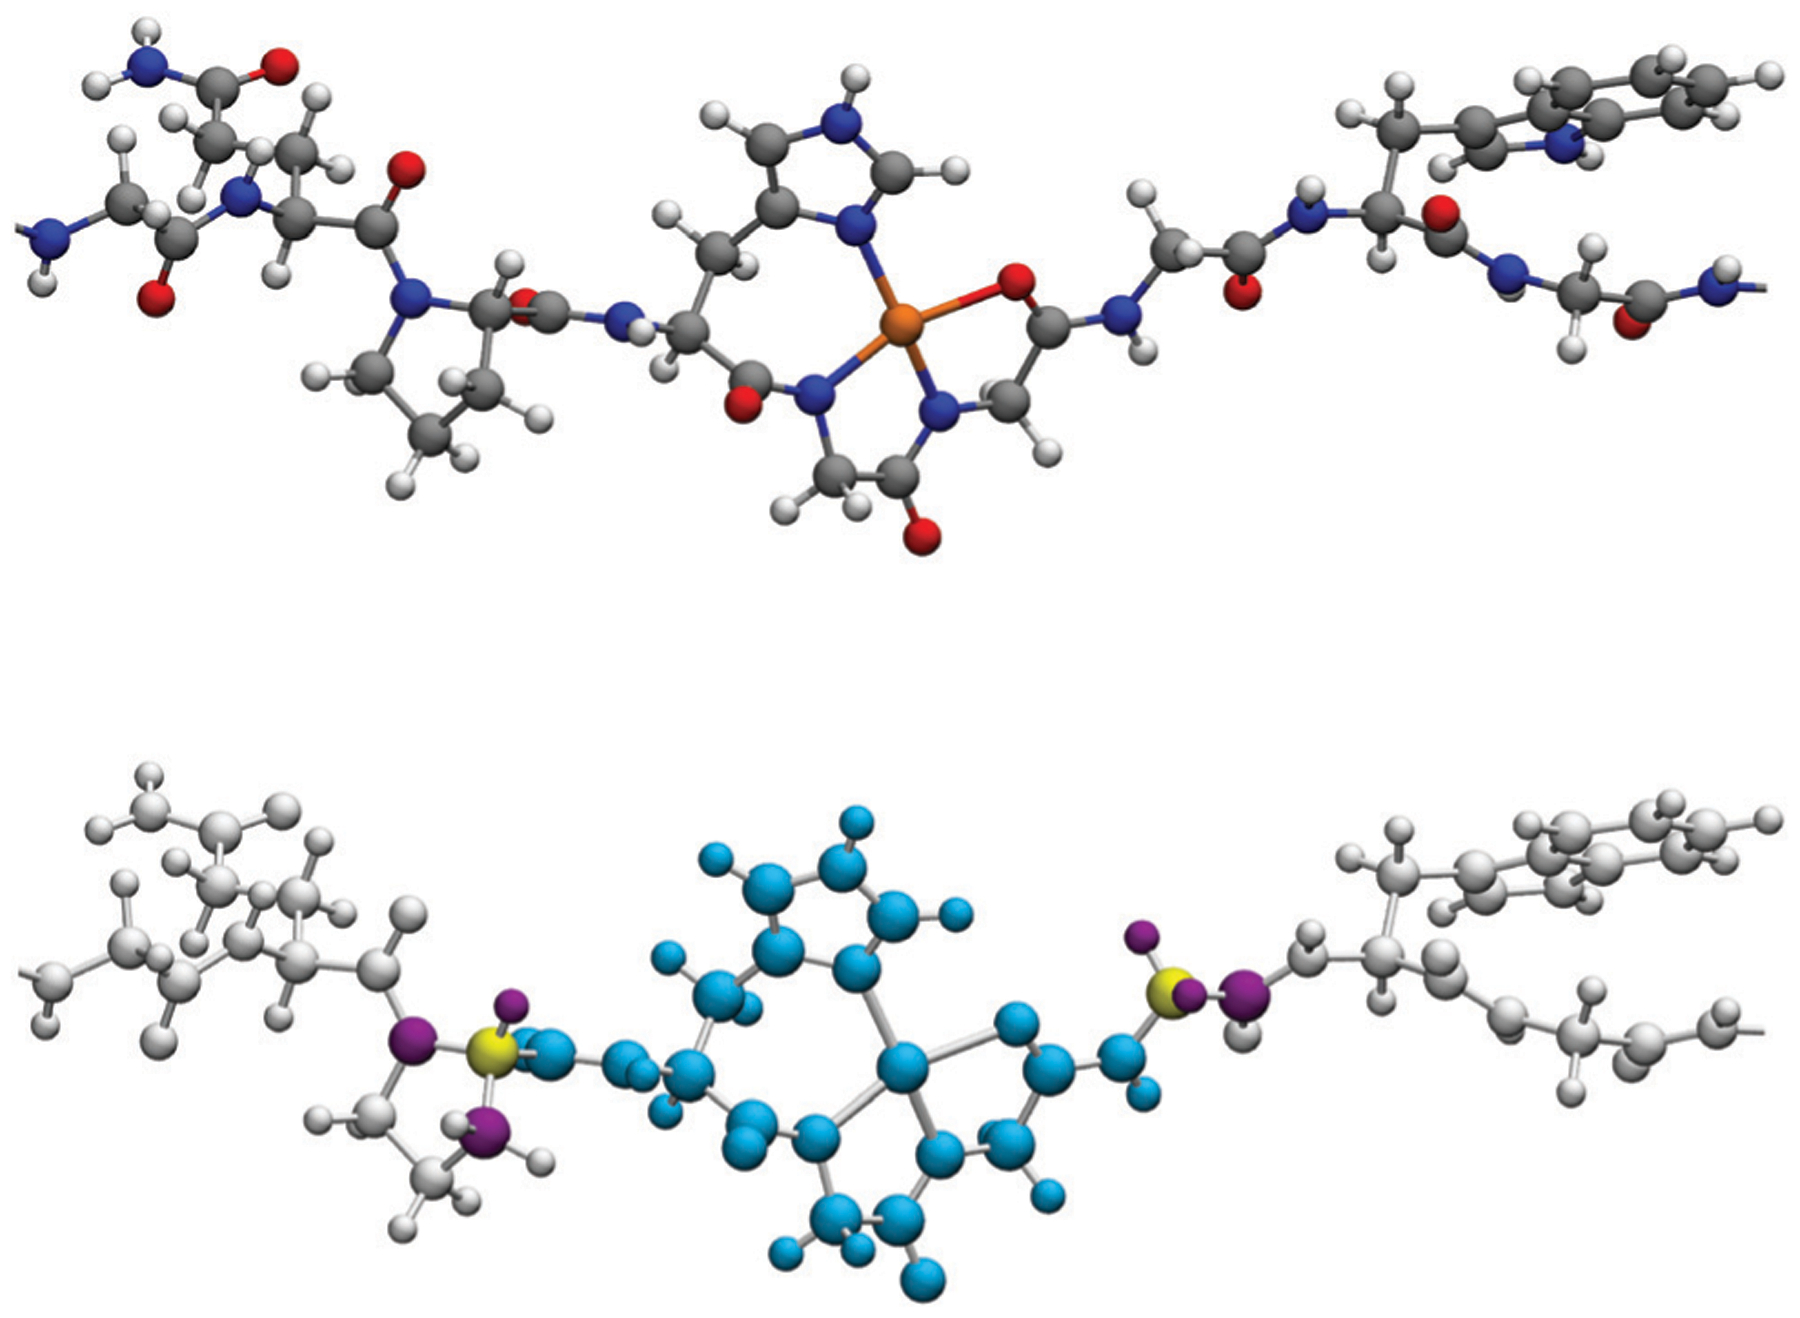
Fragment formed by the His–Gly–Gly residues in the octarepeat sequence using the pseudobond aproach. The atoms in cyan represent the atoms in the QM region. The two atoms in yellow correspond to the pseudoatoms. The six atoms in purple indicate the boundary atoms. Atoms in grey are described in the MM region. Note that the pseudobonds are representing the α-carbons of the proline and glycine residues. The top image is shown for reference.
3. Results and discussion
MD simulations of the octarepeat region (residues 60–91) in vacuum and using the GBSA solvation model were performed from an extended conformation to generate a starting structure for an explicitly solvated model (see Fig. S3, ESI†). In both cases, the extended structure rapidly contracts to a globular conformation, with radius of gyration reaching values less than 10 Å. As would be expected, the OR peptide in implicit solvent achieves smaller radius of gyration values compared with the gas phase system. The implicit solvation structure served as the basis for the explicitly hydrated production simulations.
Fig. 3 shows the radius of gyration and RMSD of the 32-residue peptide in a box of water calculated using the average geometry as reference for models 1 and 2 (see Methods). The radius of gyration shows values from 8.4 to 12.8 Å with mean values of 10.0 Å for model 1 and from 8.8 to 11.4 Å with mean values also of 10.0 Å for model 2. the RMSD, calculated ignoring hydrogen atoms, shows values from 7.2 to 23.3 Å with mean values of 14.6 Å for model 1 and 1.5 to 6.0 Å with mean values of 3.1 Å for model 2. Interestingly, although model 2 does not include an explicit bonded interaction between the His and the Cu ion, the Rg in model 2 oscillates less than for model 1.
Fig. 3.
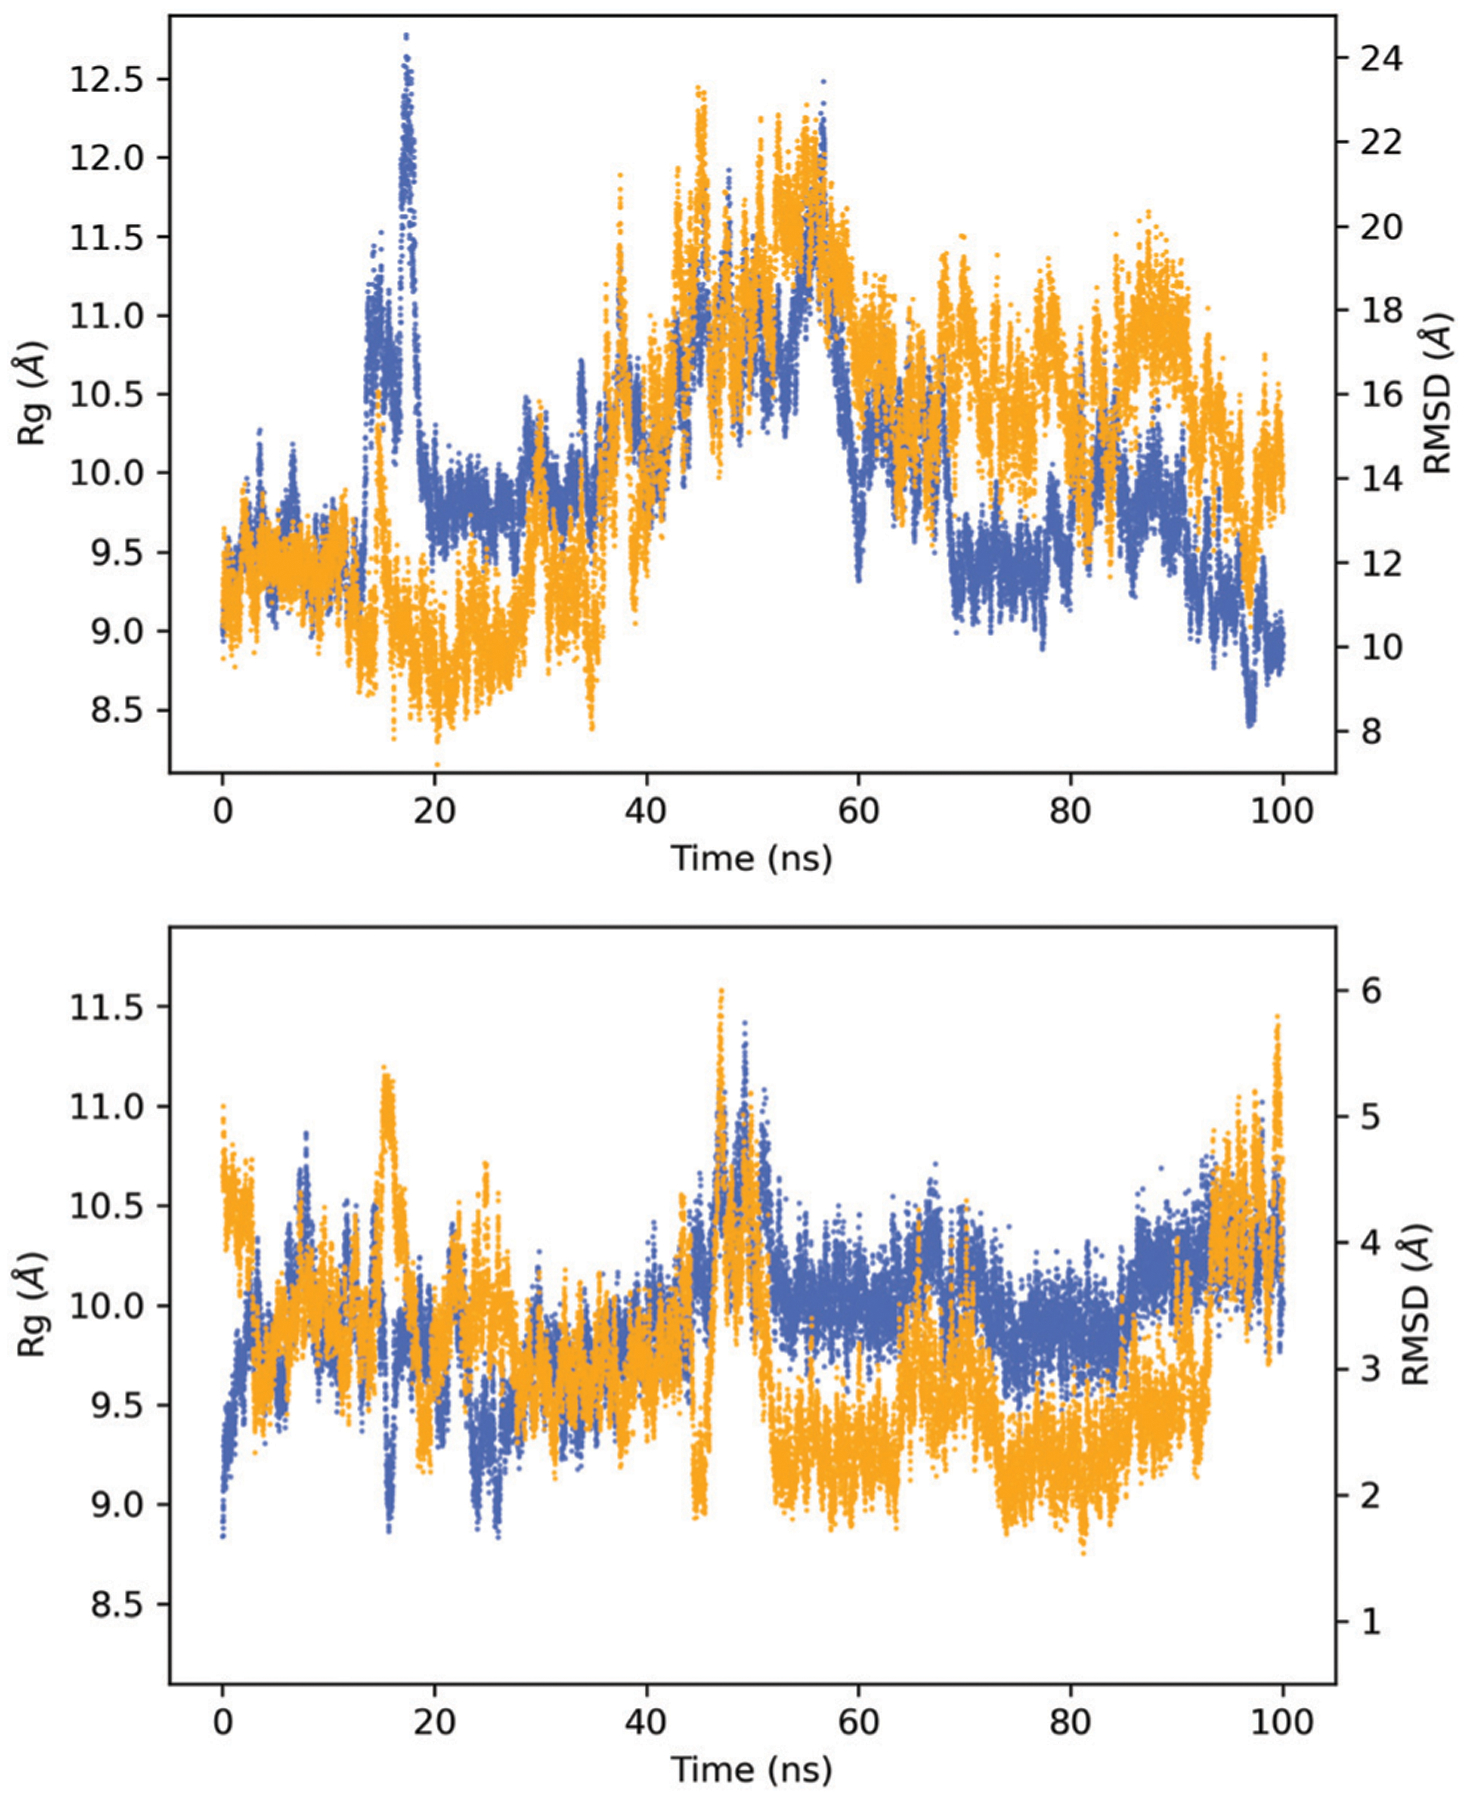
Radius of gyration (Rg) (blue trace) and RMSD (orange trace) for model 1 (above) and model 2 (bottom). Note that the scales used are different for each case.
The RMSF of the side chain for the two models is shown in Fig. 4. In model 1, the most significant fluctuations occur at the ends, and between Cu2 and Cu3. The GGW sequence of the second octarepeat appears to be very mobile. In model 2, the C-terminal end is the most flexible compared to the N-terminal end. In this model the side chains of residues between the Cu binding sites show large fluctuations compared with model 1, albeit the section between Cu2 and Cu3 has overall smaller fluctuations than the same region in model 1.
Fig. 4.
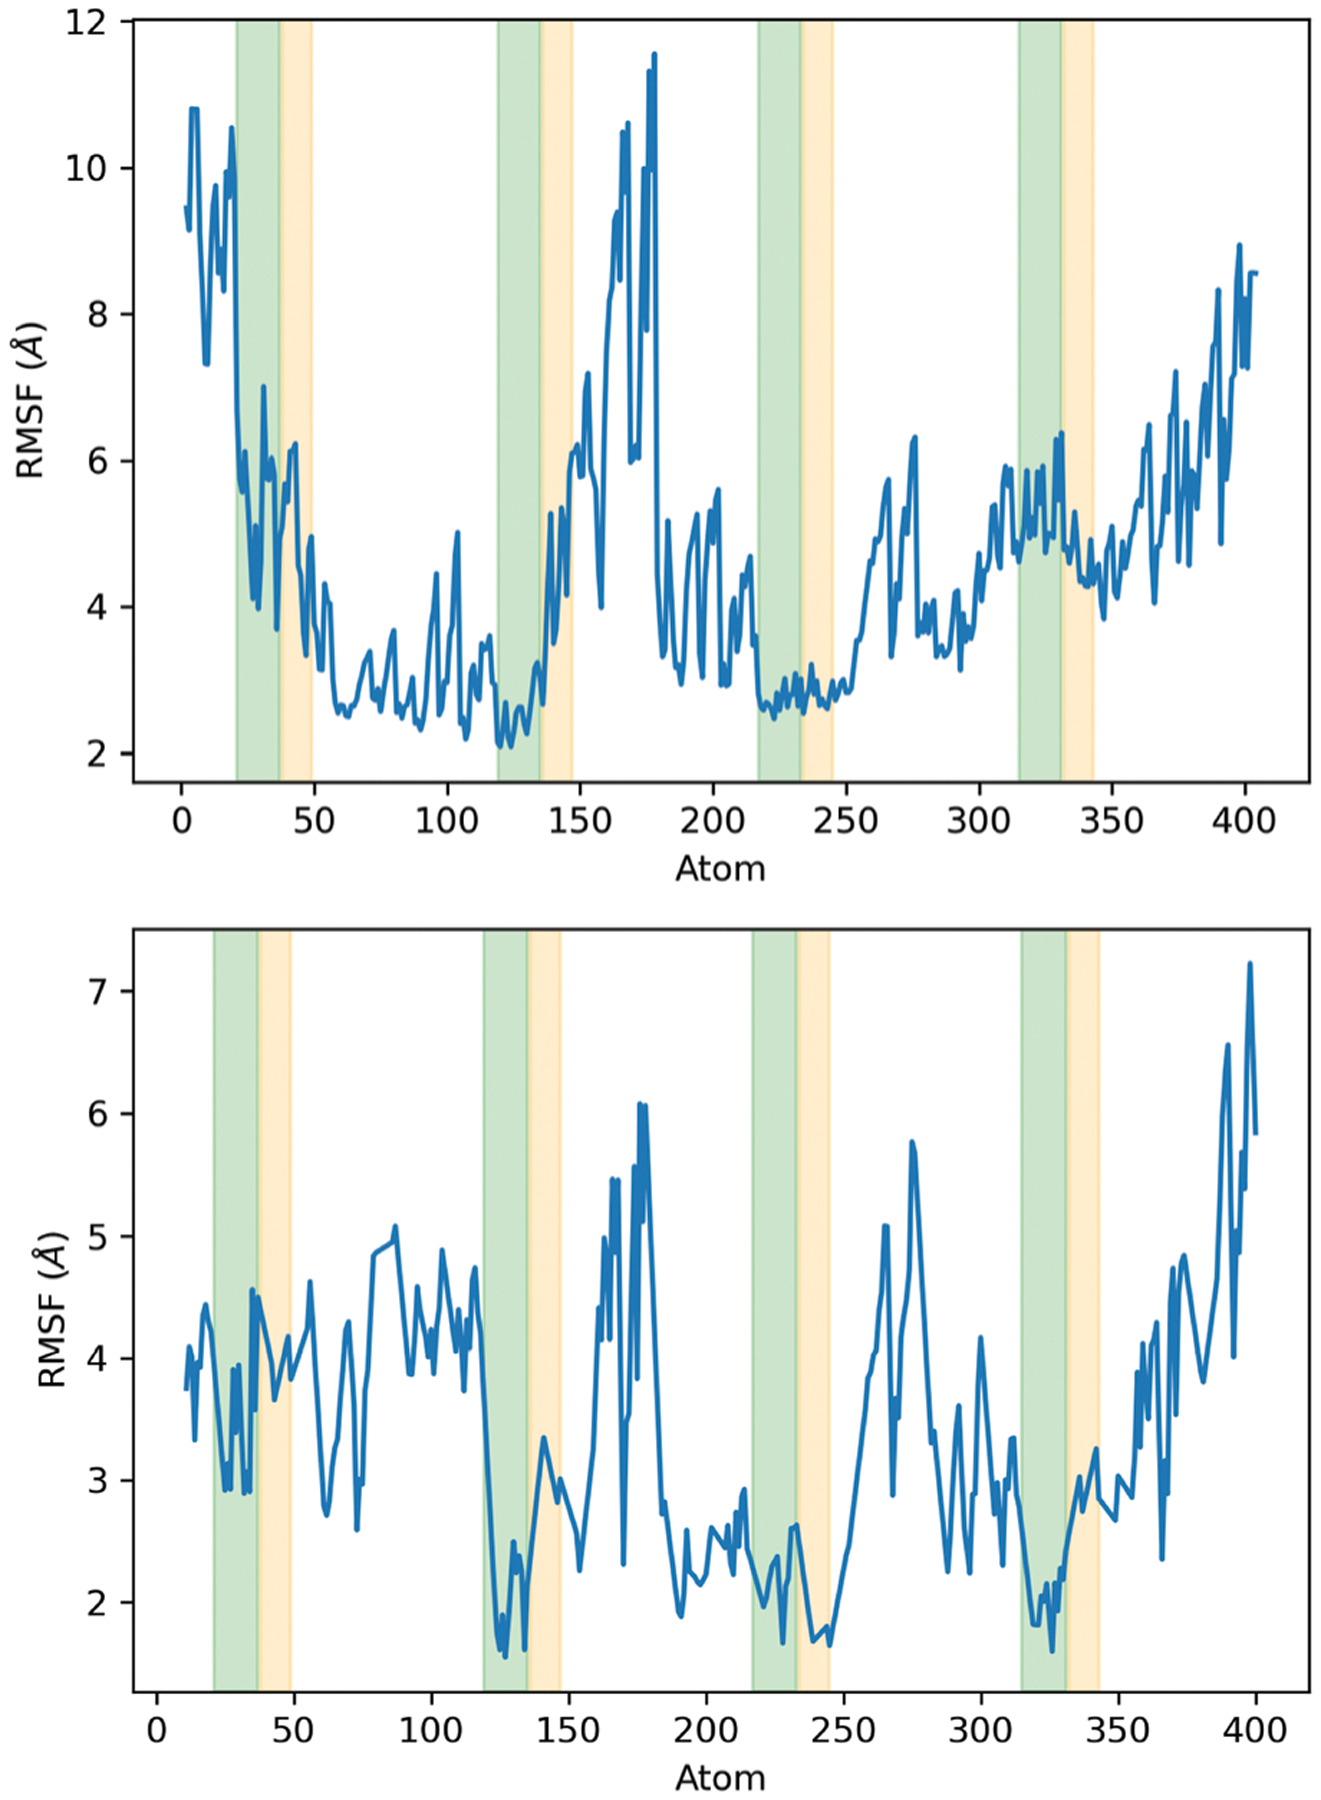
Side chain RMSF for model 1 (above) and model 2 (bottom). The green and orange shaded areas indicate the atoms corresponding to the side chains of histidines and glycines in each coordination site, respectively.
Distance analysis of the copper ions for each model shows that the separation between the different copper binding sites vary depending on their location in the peptide. For model 1, the analysis of the Cu1–Cu2 distance shows different regions starting with low values that increase after 40 ns (red trace in Fig. 5 and Fig. S4, ESI†). The Cu2–Cu3 distance starts with intermediate values but reaches the lowest values at the end of the simulation (green trace in Fig. 5 and Fig. S4, ESI†). The Cu3–Cu4 distance shows low values during most of the simulation time (navy trace in Fig. 5 and Fig. S4, ESI†).
Fig. 5.
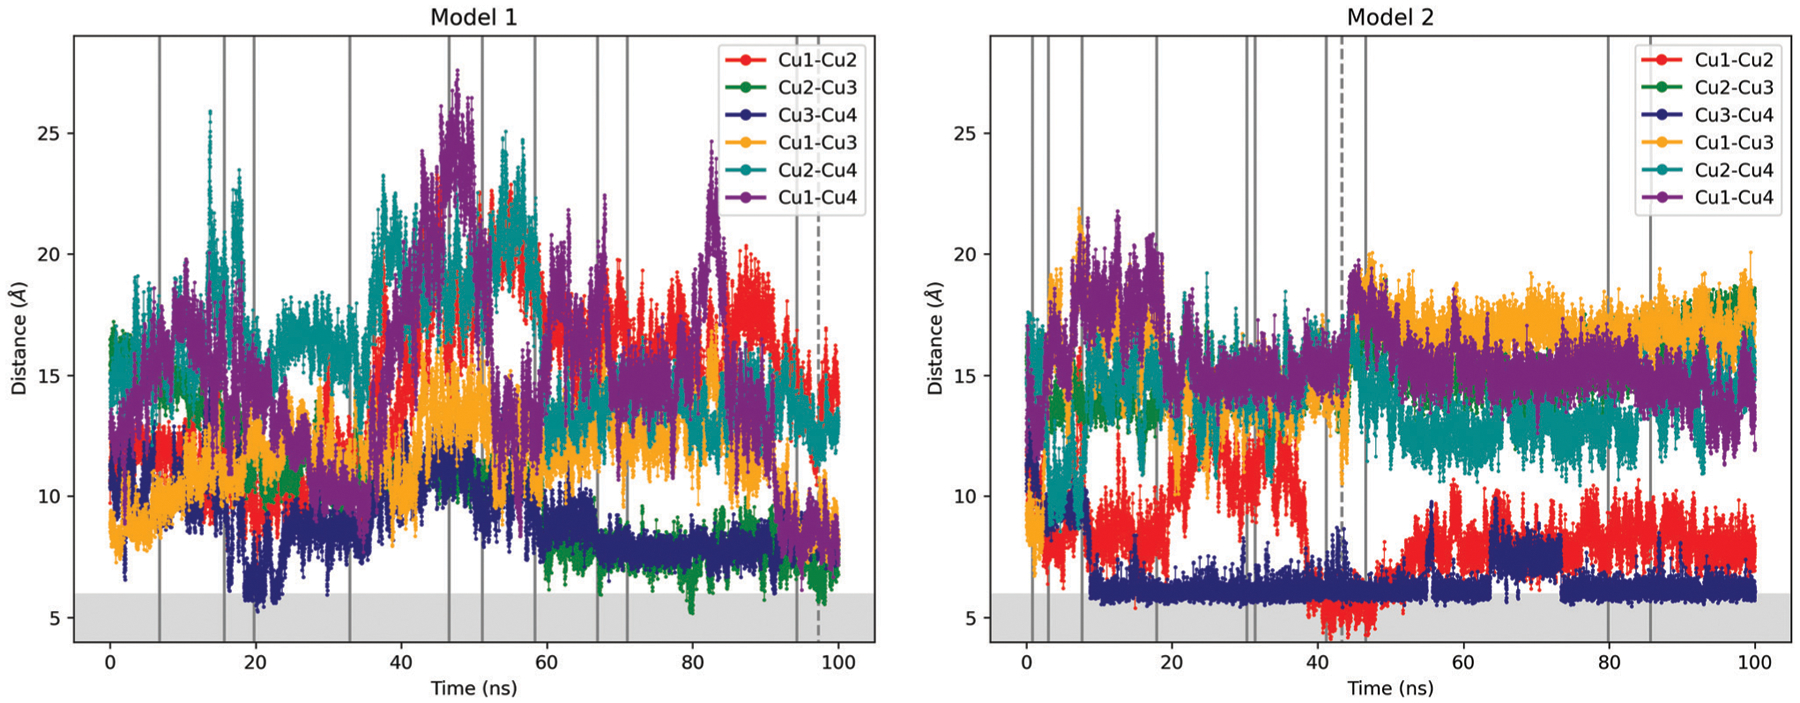
Distances between copper ions in models 1 (left) and 2 (right). The vertical lines indicate the representative points according to the k-means analysis. The dashed line indicates the minimum of the average of the distances. The shaded area indicates distances less than 6 Å. The labeling of the coppers corresponds to the Fig. 1.
With respect to the distances between non-adjacent copper ions, the Cu1–Cu3, Cu2–Cu4 and Cu1–Cu4 distances show a bell shape (orange, cyan and purple traces in Fig. 5 and Fig. S5, ESI†). In other words, the distances between these sites oscillate throughout the simulations, with maximum distances reached almost half of the simulation time.
In general, the oscillations of the distances in model 2 are smaller than in model 1. This is likely due to the additional bonded parameter between the cations and the coordinating His in model 1 for each Cu2+ site. In fact, only the Cu1–Cu2 distance shows the greatest changes in model 2 (red trace in Fig. 5 and Fig. S6, ESI†). The rest of the distances remain relatively constant (green and navy traces in Fig. S6 and orange, cyan and purple traces in Fig. S7, ESI†).
These analyses indicate that the structural changes in model 1 show larger variations than in model 2, which is more structurally homogeneous. Although both models show an average Rg around 10 Å, the side chain RMSF for model 1 is more pronounced, especially in the region between Cu2 and Cu3. Moreover, the average distances between adjacent Cu ions for model 1 is larger (9–15 Å), compared with model 2 where two of the adjacent ion pairs show distances below 10 Å (Fig. S4 and S6, ESI†). The average distances between distant Cu ions are also more homogeneous and with shorter values for model 2 compared with model 1 (Fig. S5 and S7, ESI†).
Part of the stability in model 2 is due to interactions between adjacent Cu coordination sites. For example, an interaction between the backbone carbonyl from one of the glycines that coordinates Cu3 is observed to interact with Cu4, with a distance <4 Å for 80% of the simulation (see Fig. S8, ESI†). This interaction is enabled by the flexibility of the His ligand on the Cu sites. These results are consistent with experimental results showing that copper promotes the formation of compact structures in the non-octarepeat region, with reported inter-Cu2+ distances of 3–6 Å from EPR measurements.38 The possibility that these interactions may arise from close contacts between two different octarepeat molecules cannot be discarded; however this is not possible to calculate in our simulation setup.
The analysis of the distances of each copper ion with the first coordination shell atoms provides further structural insights (see Fig. 6a for atom labels). As expected, the distances of the atoms including bonded contributions change very little compared with the distances where the interaction is modeled only using non-bonded contributions in the parametrization. For example, for model 1 the distance between N1–Cu and N3–Cu ranges between 1.9 and 2.1 Å. The N2–Cu distance shows values from 1.8 to 2.0 Å, and are equally observed for any octapeptide. On the other hand, the O1–Cu distance shows slight differences depending on the position of the copper ion considered (see Fig. S9, ESI†). Although the range of values is between 1.9 and 3.3 Å, more than 95% of the time, the distance is observed to vary between 2.0 and 2.5 Å for any octapeptide.
Fig. 6.
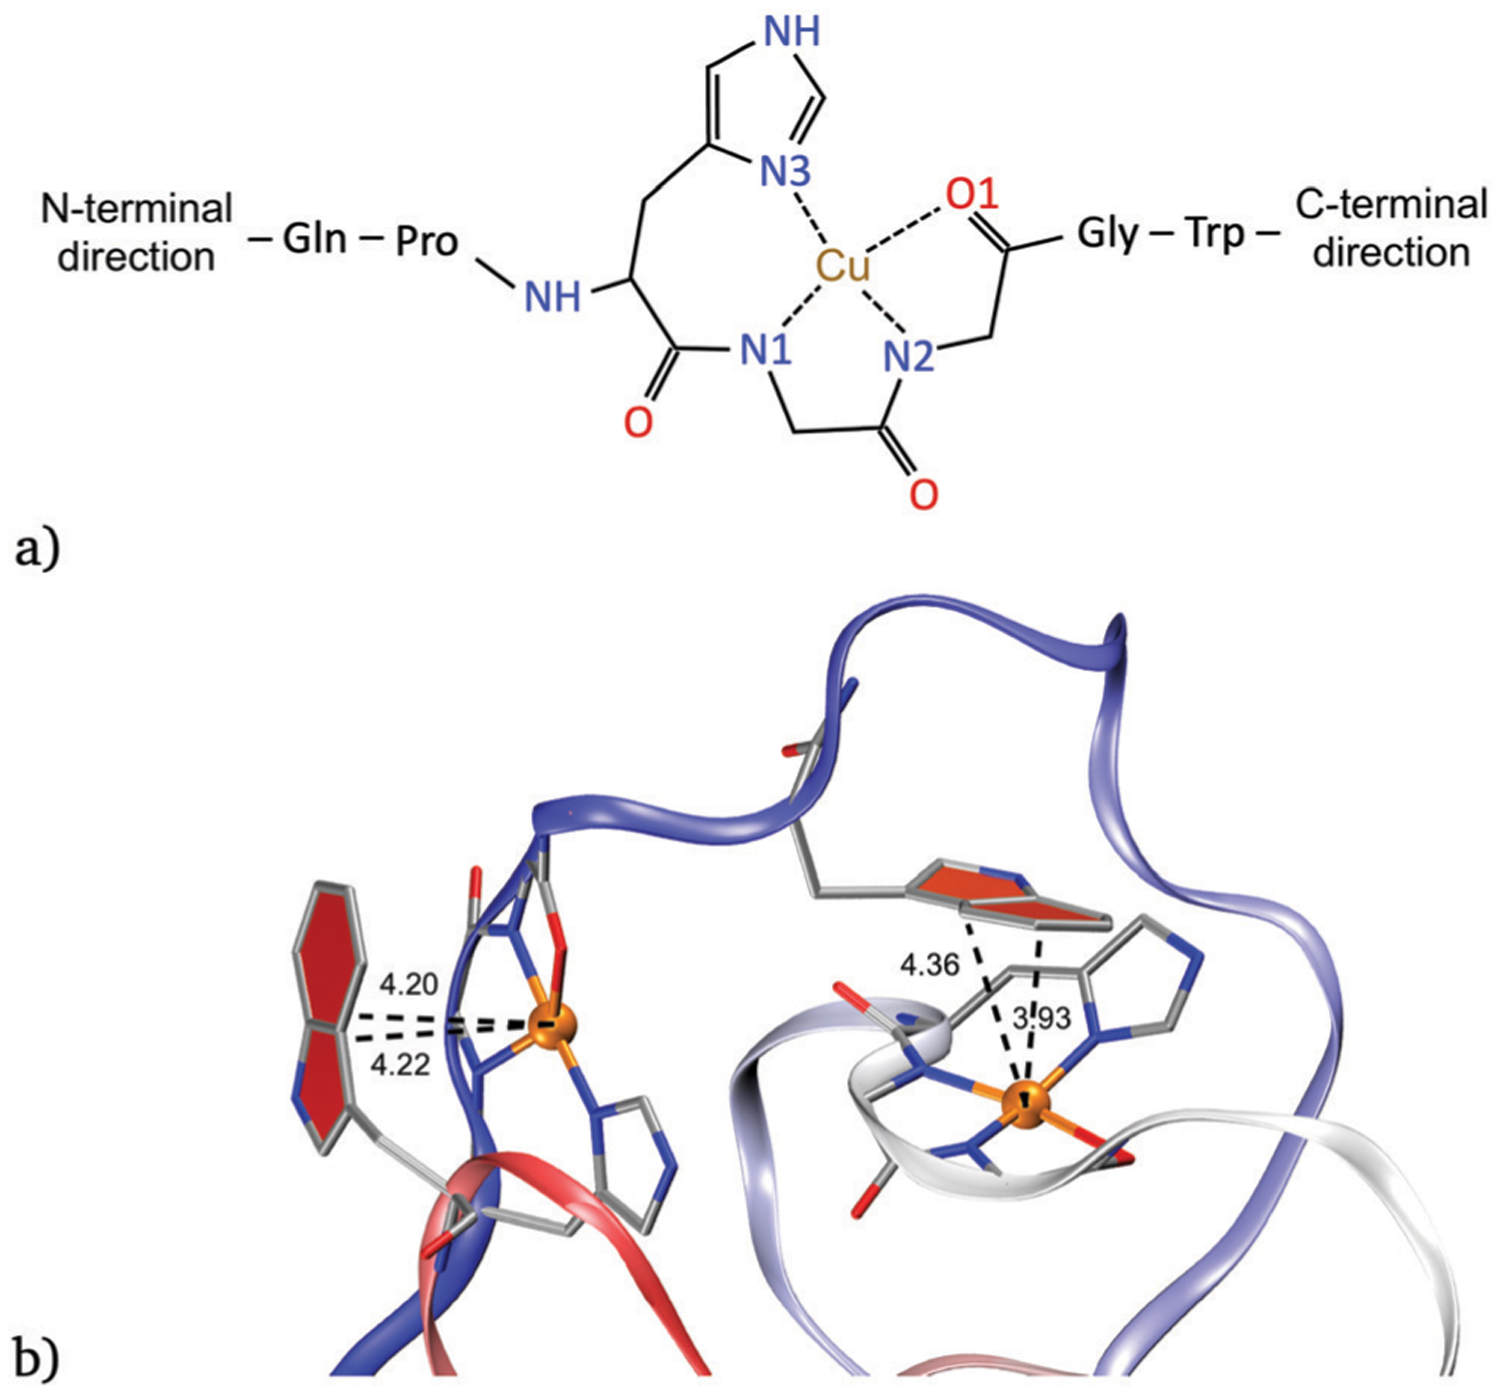
(a) Labeling of the closest atoms to each copper ion. N1 and N2 are the nitrogen atoms of the first and second deprotonated glycine, respectively. N3 is the nitrogen atom of the imidazole ring of histidine and O1 denotes the carbonyl oxygen atom. (b) Copper-tryptophan interaction in model 1 between tryptophan from OR 4 with copper 1 (left) and tryptophan from OR 1 with copper 3 (right). Distances are given in angstroms.
Similar results were obtained for model 2. The only difference is that the N3–Cu distance shows wider range of values, between 2.0 and 7.0 Å depending on the octapeptide (see Fig. S10, ESI†). Although the distance range for the His and Cu shows a very wide variation in model 2, a more moderate range of 2.0 to 4.8 is observed for 95% of the simulation time for the first Cu ion. By contrast, the distance between the His and the second copper ion is greater than 2.6 Å in less than 5% of the simulation time. The N3–Cu3 distance shows the widest interval with a range between 2.0 to 5.8 Å for 95% of the simulation time. On the other hand, the N3–Cu4 distance is observed to vary between 2.0 Å to 4.0 Å.
Tables 1 and 2, corresponding to models 1 and 2, respectively, show the results of the clustering analysis including the number of clusters, position of the centroid in the trajectory, percentage, and average distance. The summary of the k-means clustering of the trajectory into 10 clusters can be seen in Fig. S11 and S12 (ESI†). A smaller distance interval was obtained for model 2 than model 1, with average distances ranging from 12 to 14 Å. Conversely, for model 1 the average distance distribution for the clusters covers a wider range, from 10 to 16 Å. We did a second MD simulation for the model 1. Here the clustering analysis, the radius of gyration and the average distances show similar results (see Fig. S13–S15, ESI†).
Table 1.
Clusters in model 1. See main text for details
| No. cluster | Pos. (ns) | Perc. (%) | Avg. dist. (Å) |
|---|---|---|---|
| 1 | 46.55 | 5.5 | 16.12 |
| 2 | 58.34 | 8.1 | 14.35 |
| 3 | 15.70 | 7.7 | 13.63 |
| 4 | 32.94 | 10.0 | 11.61 |
| 5 | 71.04 | 21.1 | 12.09 |
| 6 | 6.82 | 12.8 | 12.77 |
| 7 | 94.3 | 8.8 | 10.11 |
| 8 | 19.75 | 9.3 | 11.63 |
| 9 | 66.96 | 11.0 | 12.64 |
| 10 | 51.12 | 5.7 | 15.15 |
Table 2.
Clusters in model 2. See main text for details
| No. cluster | Pos. (ns) | Perc. (%) | Avg. dist. (Å) |
|---|---|---|---|
| 1 | 30.26 | 7.2 | 12.11 |
| 2 | 3.02 | 5.0 | 12.30 |
| 3 | 85.70 | 15.8 | 12.81 |
| 4 | 0.85 | 2.5 | 12.33 |
| 5 | 17.87 | 9.6 | 13.14 |
| 6 | 31.43 | 11.9 | 12.65 |
| 7 | 46.56 | 6.7 | 13.07 |
| 8 | 7.67 | 1.4 | 14.06 |
| 9 | 41.21 | 7.1 | 12.22 |
| 10 | 79.87 | 32.9 | 12.36 |
Our results agree with previously described interactions between tryptophan side chains and Cu ions observed experimentally.45 However, unlike what is observed in the HGGGW peptide crystals, here the interactions occur between residues that belong to different octapeptide regions and not with successive tryptophans. For example, Fig. 6b shows that copper ions 1 and 3 are interacting with tryptophan 4 and 1, respectively. This type of interaction was observed in different representative structures (see Fig. S16, ESI†) in model 1. Similar results were obtained for model 2 (results not shown).
Representative structures from each cluster for model 1 were selected based on the information in the previous tables for subsequent QM/MM single point calculations. Model 1 was selected given the broader average distance distribution, to investigate the effect of inter-metal center distances with respect to the electronic interactions between the metal centers. Fig. 7 shows the QM and QM/MM energies calculated with ωB97-XD/Def2-SVP//AMOEBABIO18 for the full, and pseudobond-based systems for the selected representative structures. In all cases, the quintet state was observed to converge to a stable wavefunction after wavefunction optimization.72 Triplet and singlet (broken spin solution) systems were also considered, however, the self-consistent solution converged to the quintet state, or to spin contaminated, unstable wavefuntions based on wavefunction stability optimization. The calculated relative QM energies are in a range of 170 kcal mol−1 for the complete structure and 200 kcal mol−1 for the systems with pseudobonds. If the contribution of water molecules (QM/MM energy) is taken into account, the interval is wider.
Fig. 7.
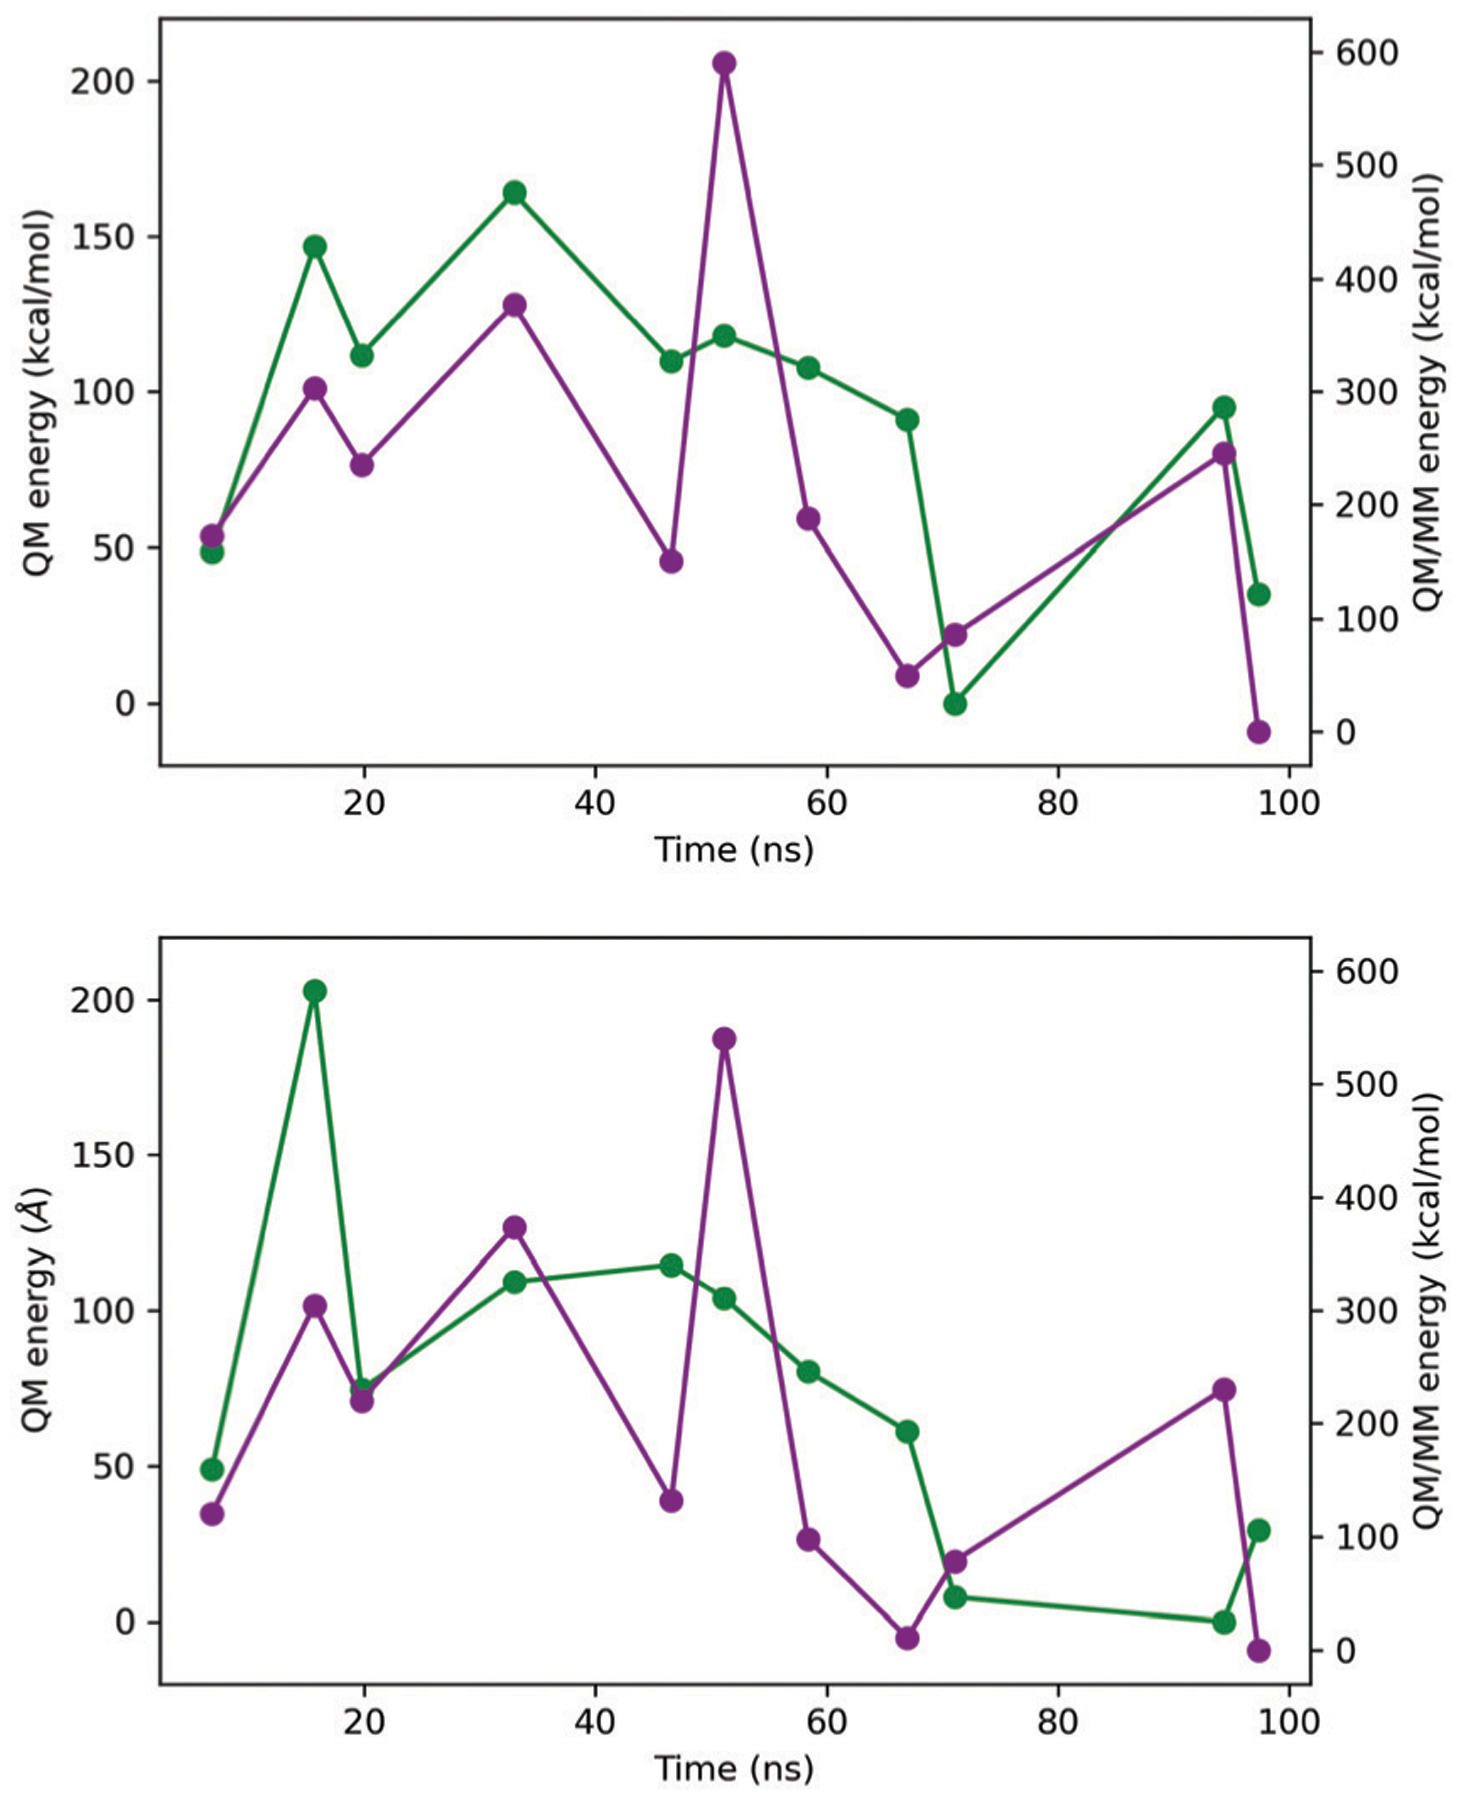
QM (green line) and QMMM (purple line) relative energies corresponding to the full structure (above) and the pseudobond approach (bottom). The energies are relative to the lowest energy structure in each case. Energies were calculated with ωB97XD/Def2-SVP//AMOEBABIO18.
Fig. 8 shows the calculated absolute chemical shifts for the N atoms around the Cu ions for the centroid structures and a structure where the average of the inter-Cu distances is minimized. All NMR calculations were performed using the pseudobond approach.
Fig. 8.
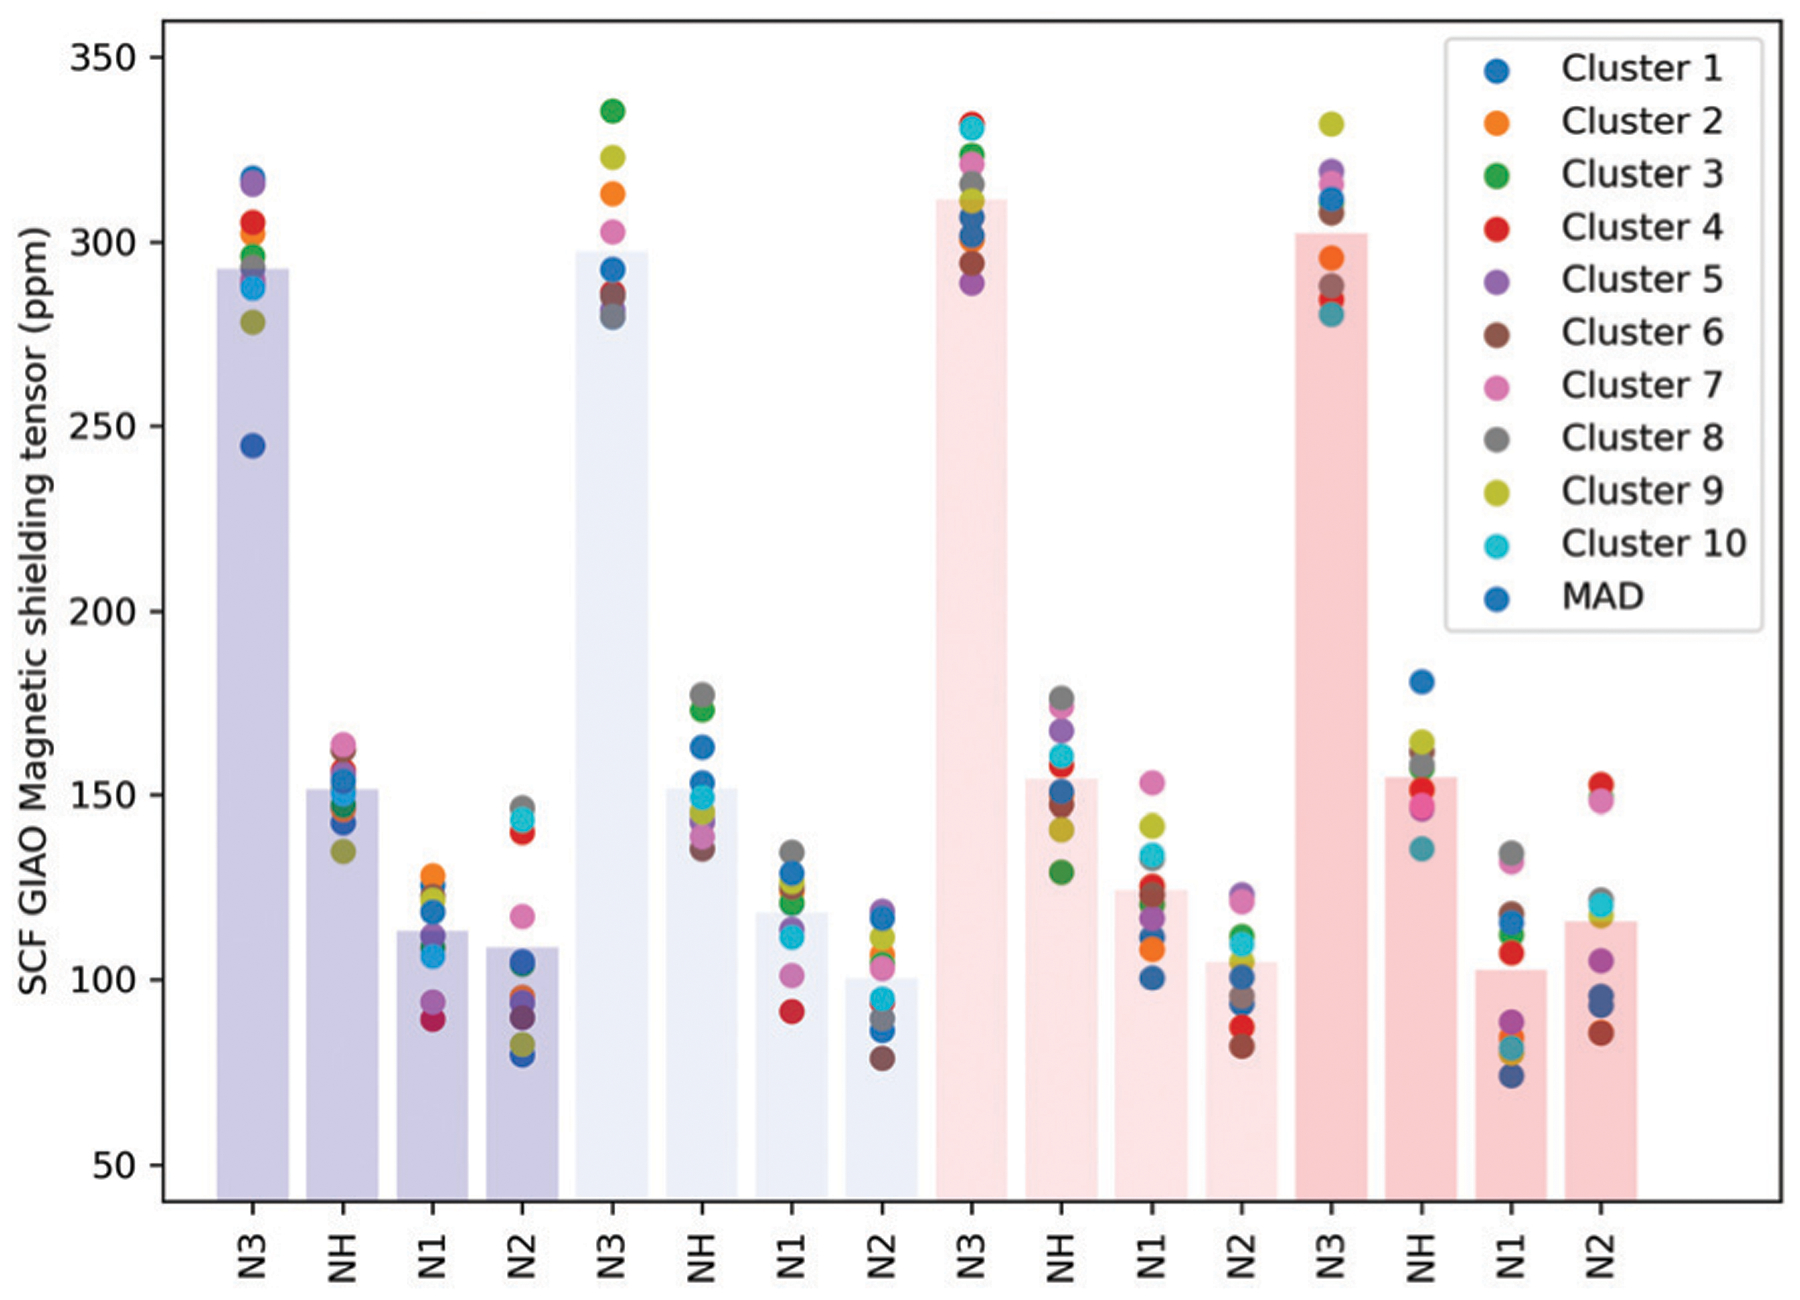
Magnetic shielding tensor calculated for the nitrogens around each copper ion. The protonated nitrogen of histidine is also included. The labeling of the Fig. 6a has been followed. Vertical bars indicate average values.
The results show that similar results are obtained for the different structures considered. For all Cu binding sites, the highest shieldings are observed for the His nitrogen (N3) that coordinates the copper ion, and the lowest values correspond to the deprotonated Gly nitrogens (N1 and N2). The calculated chemical shifts appear to be uncorrelated to gross structural changes such as inter-Cu distances or to structural changes within the first coordination shell (see Fig. S17 and S18, ESI†).
The different contributions to the non-relativistic spin–spin coupling between copper ions of the most compact structure of model 1 obtained with our MD simulations are reported in Table 3. The term corresponding to the Fermi contact (FC) to J is the dominant contribution to the total nuclear spin–spin coupling. The largest values correspond to the Cu3–Cu4 and Cu1–Cu4 interactions. However, these values do not exceed 0.3 Hz. The Cu2–Cu3 and Cu2–Cu4 interactions show the most significant values in the paramagnetic spin–orbit (PSO) contribution to J. An anti-correlation of −0.91 is obtained between the Cu–Cu – distances and the diamagnetic spin–orbit contributions. The correlation between Cu–Cu distances and the rest of the spin–spin contributions is less than 0.7 (see Fig. S19, ESI†). We are aware of the importance for an adequate description of the electron density near the nuclei in the accuracy of the spin–spin coupling constants. However, due to the size of the system, we were only able to perform a single step calculation based on the Gaussian16 procedure, without uncontracting the basis and adding extra polarization core functions for the calculation of Fermi Contact terms.
Table 3.
Spin–spin coupling contritutions. Distances and coupling contributions are given in angstroms and Hz, respectively
| Interaction | Distance | FC-K | FC-J | SD-K | SD-J | PSO-K | PSO-J | DSO-K | DSO-J | TS-K | TS-J |
|---|---|---|---|---|---|---|---|---|---|---|---|
| Cu1–Cu2 | 11.985 | −0.0256 | −0.0562 | 0.0011 | 0.0025 | −0.0163 | −0.0357 | −0.0003 | −0.0008 | −0.0411 | −0.0902 |
| Cu2–Cu3 | 6.045 | −0.0767 | −0.1685 | 0.0055 | 0.0120 | −0.0487 | −0.1071 | 0.0134 | 0.0294 | −0.1066 | −0.2341 |
| Cu3–Cu4 | 7.833 | −0.1437 | −0.3156 | −0.0063 | −0.0139 | −0.0197 | −0.0432 | 0.0054 | 0.0119 | −0.1642 | −0.3608 |
| Cu1–Cu3 | 8.182 | −0.0364 | −0.0799 | −0.0027 | −0.0059 | 0.0013 | 0.0028 | 0.0046 | 0.0102 | −0.0331 | −0.0728 |
| Cu2–Cu4 | 11.563 | −0.0013 | −0.0029 | −0.0026 | −0.0057 | −0.0011 | −0.0024 | −0.0014 | −0.0031 | −0.0064 | −0.0142 |
| Cu1–Cu4 | 7.814 | −0.1210 | −0.2659 | −0.0100 | −0.0221 | 0.0160 | 0.0352 | 0.0038 | 0.0083 | −0.1113 | −0.2445 |
FC-K: Fermi contact (FC) contribution to K; FC-J: Fermi contact (FC) contribution to J; SD-K: spin-dipolar (SD) contribution to K; SD-J: spin-dipolar (SD) contribution to J; PSO-K: paramagnetic spin–orbit (PSO) contribution to K; PSO-J: paramagnetic spin–orbit (PSO) contribution to J; DSO-K: diamagnetic spin–orbit (DSO) contribution to K; DSO-J: diamagnetic spin–orbit (DSO) contribution to J; TS-K: total nuclear spin–spin coupling K; TS-J: total nuclear spin–spin coupling J.
Analysis of the Mulliken spin density and corresponding orbitals (Fig. 9) shows that both are aligned in the direction of the bonds formed between each copper ion with its closest atoms. Similar results in other systems have been previously reported.73 The spin density suggests that the unpaired electron in each center is delocalized around the Copper ion (around 0.6 electrons), with a significant component shared with the deprotonated nitrogens, showing values of 0.13 to 0.17 electrons, and a small component on the remaining two atoms in the 1st coordination-shell (see Table S1, ESI†). These results are similar for the pseudobond, and full protein systems.
Fig. 9.
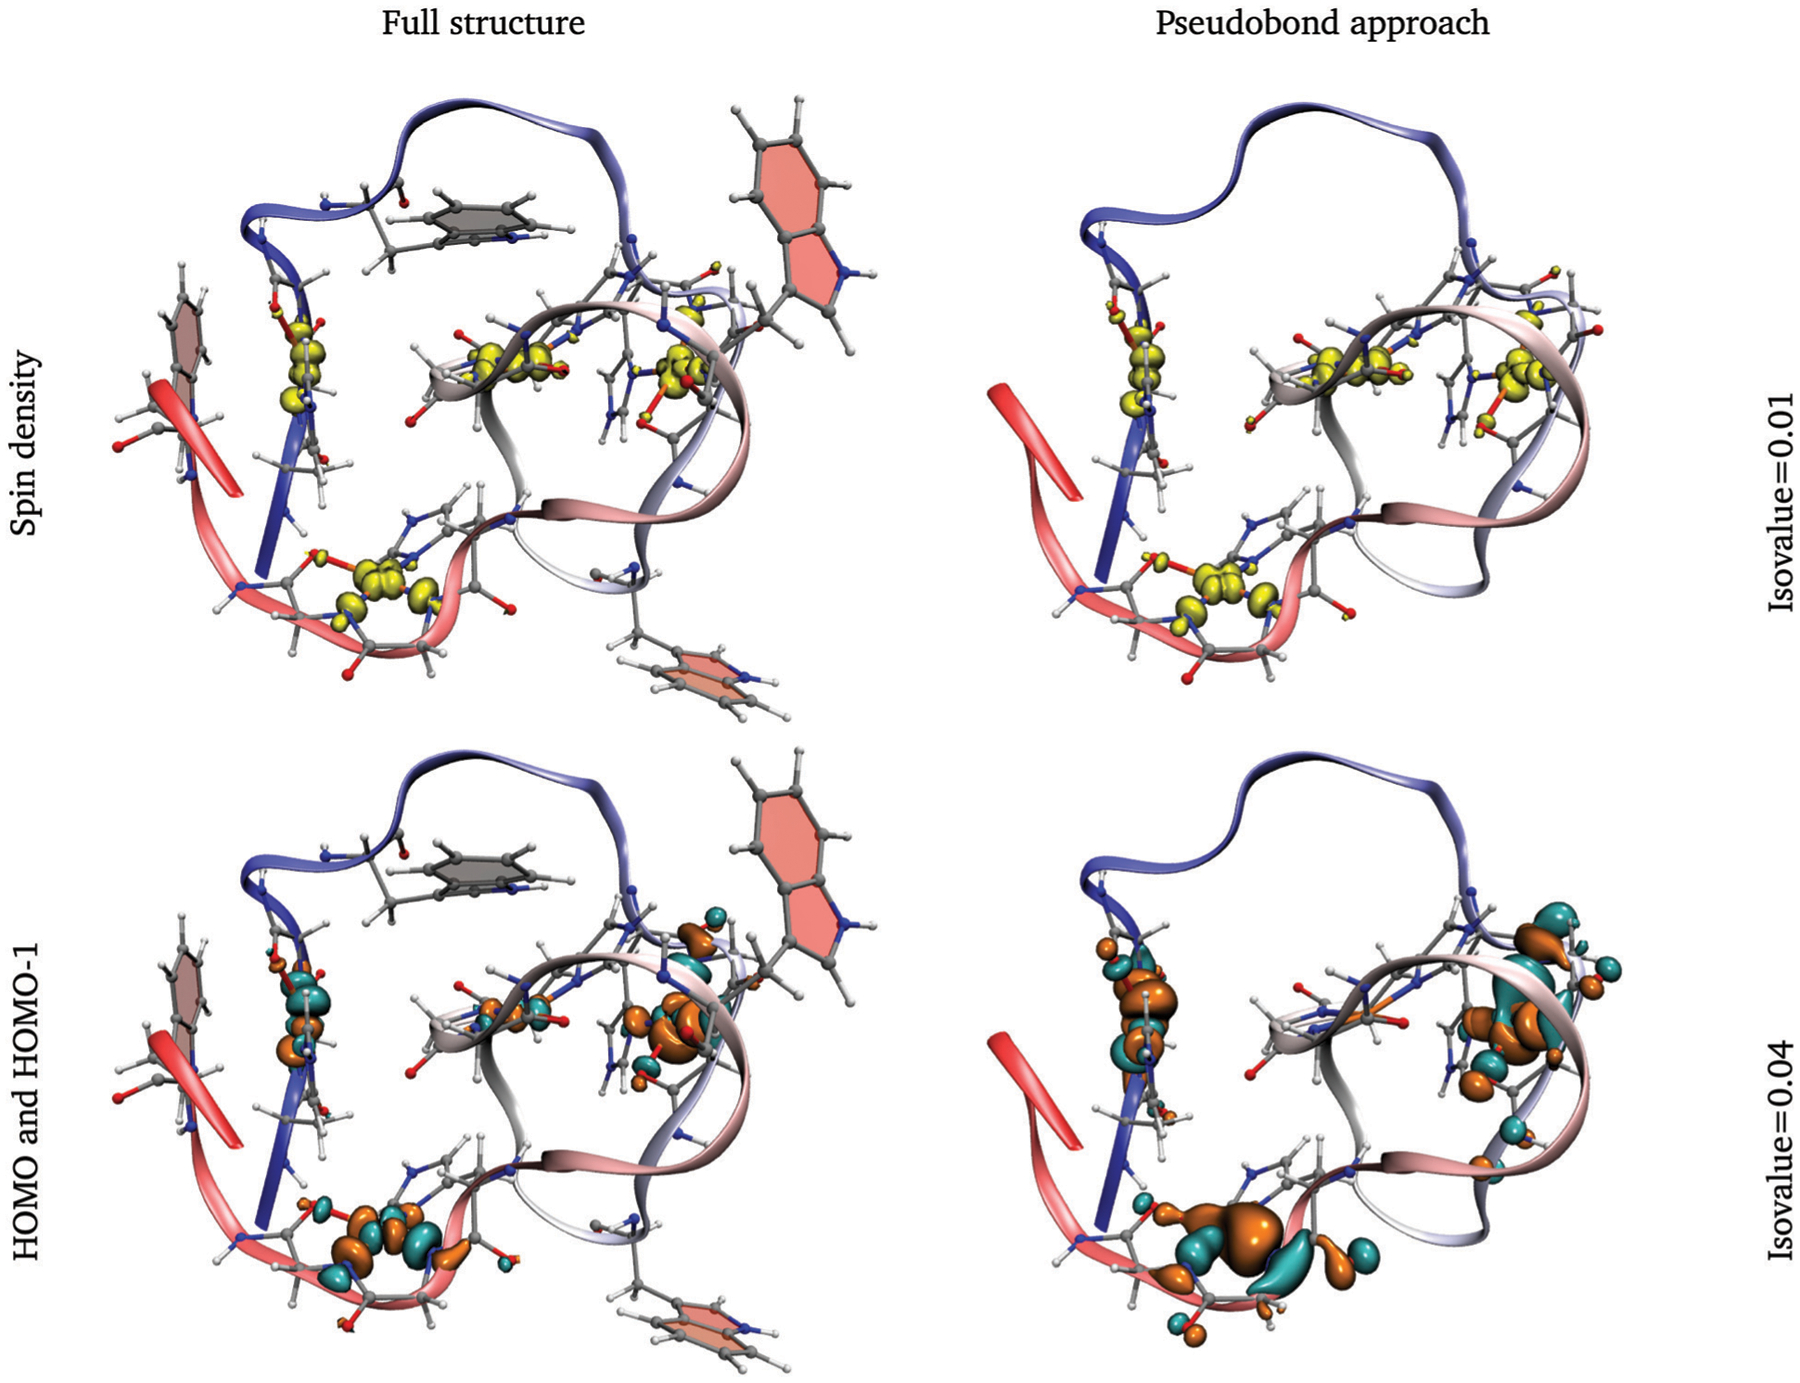
Spin density and HOMO/HOMO–1 biorthogonal orbitals of the structure with the lowest average distance of copper ions. Full structure and the pseudobond approach are shown. Tryptophan residues are displayed in the full structure. Some residues have been hidden for easy visualization.
The delocalization of the unpaired electron from the Cu centers mainly to the deprotonated nitrogens (N1 and N2) helps explain the small calculated magnetic shielding of these nuclei in all four octapeptide regions. Conversely, the N atom on the His, which bares almost no spin density, shows a 3 fold larger magnetic shielding compared with N1 and N2. These results are consistent with previous reports indicating N1 and N2 show more covalent bonding character with the Cu cations.44
Combined ELF/NCI analysis on a single octapeptide site (Fig. 10a and Fig. S20 and S21, ESI†) further supports that the bonds between the deprotonated nitrogens (N1 and N2) and the Cu have stronger covalent character, compared with the N atom from the histidine. In both cases, the ELF analysis for N1 and N2 shows disynaptic basins shared with Cu, with populations around 0.4 to 0.6 electrons larger than the N3–Cu basin (see Table S2, ESI†). Conversely, the carbonyl O in the fourth ligand position shows a strong non-covalent (blue) surface between the O and Cu, and no disynaptic basin between these atoms. We also did a non-covalent interaction analysis to find out the type of interaction between tryptophan residues and metal centers. Fig. 10b shows that the interactions are attractive and consistent with vdW forces.
Fig. 10.
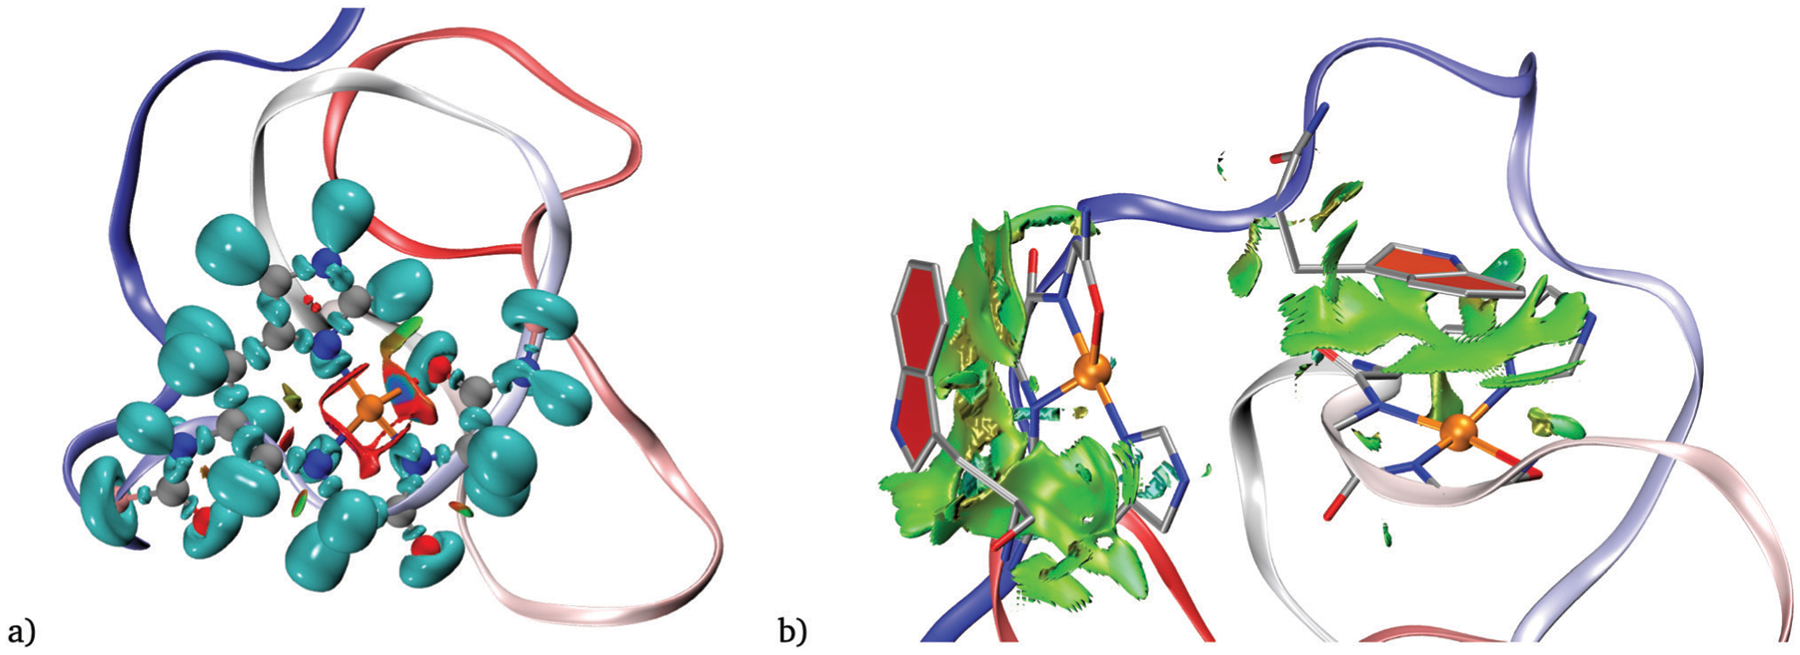
(a) NCI and ELF plot for one coordination site at the structure with the minimum average distance of model 1. The isovalues are 0.82 and 0.6 for the ELF and NCI analysis, respectively. (b) NCI analysis to show copper-tryptophan interactions between TRP from OR 4 with Cu1 (left) and TRP from OR 1 with Cu3 (right). Only sign(λ2)ρ values between −0.02 and 0.01 are displayed. The RDG isovalue is 0.6.
4. Conclusions
Polarizable MD and QM/MM simulations have been performed to investigate the structural and electronic properties of the fully Cu-loaded octarepeat region of the prion protein Two sets of parameters were developed, one with (model 1) and one without (model 2) an explicit bonded term between the Cu2+ and the His N. The model based on parameters without this term showed broader conformational sampling including loss of one coordination site to the ion, which affected local and global peptide dynamics. Although model 2 has fewer restrictions, the RMSD and RMSF analysis showed lower values than in model 1. The distances between the copper ions were sensitive enough to detect structural changes. The bonding distances of copper ions with their closest atoms agree with the values previously reported. MD simulations are consistent with the crystal structure of the single Cu site and suggest that an interaction of copper with tryptophan is also possible in solution. In the full octarepeat case, the interaction between the Cu ions and the tryptophans is observed to occur with Trp from other octarepeat regions, in contrast to crystallographic data. Our QM-MM results clearly show that the Cu high occupancy mode of the OR region of the prion protein adopts a compact globular conformation where the Cu–Cu distances are in the range of 5 to 25 Å. Some of these distances are within the range of 3.5 to 6 Å determined by dipolar couplings and half field EPR.38
The RMSF analysis shows that in addition to the N-terminal and C-terminal regions, the glycine-containing segments are quite mobile. Electronic structure analysis from polarizable QM/MM shows that when the octarepeat region is fully coordinated, the unpaired electrons on the Cu atoms preferentially adopt a ferromagnetically coupled configuration, resulting in an overall quintet state for the system. NMR calculations showed that regardless of the conformation of the peptide, similar results were obtained for the different structures analyzed. The imidazole ring nitrogens show the largest values of the magnetic shielding tensor than the deprotonated nitrogens. The differences in the magnetic shielding values are consistent with the calculated Mulliken spin densities, and ELF/NCI analyses. These results agree with experimentally reported observations regarding higher covalent bonding character between the deprotonated N atoms and the Cu dications.
The location of PrPC is determined by the interaction of Cu with the OR region: while PrPC is located in lipid rafts, its lateral exit is induced at high Cu concentrations and requires the OR region.33,74 Hence, the fully Cu-loaded OR is the species that exits lipid rafts and undergoes endocytosis. Hence, it is tempting to propose that the compact conformation induced by Cu loading into the OR region of PrPC as described in this study, is the physiologically needed conformation for the protein to be dissociated from lipid rafts and endocytosed, a process that is important for cell signaling, memory and learning processes. On the other hand, it is important to note that PrPC undergoes proteolytic cleavage by α- and β-secretases. In both types of proteolytic processing, the OR region is shredded from the membrane bound prion protein, releasing into the synaptic cleft fragments of PrPC that include the full OR region. In the case of the β -cleavage, the released fragment contains the N-terminal residues 23–89, and it corresponds to the species studied here.
While the pathological implications of the β -cleavage processing of PrPC remain to be understood, our study of the fully Cu-loaded OR region contributes to understanding the impact of metal binding to the conformation of this fragment that is involved in the pathology of prion disease. In contrast, the alpha/cleavage of PrPC is considered to be neuroprotective, and it releases a fragment that also includes the His96 Cu binding site.75–77 Further studies expanding the OR region to include the His96 site would be needed to understand the neuroprotective nature of this fragment, and most importantly, to compare the impact of Cu binding in the conformation of both proteolytic products and gain insight into their apparently opposite effects on neural function.
Supplementary Material
Acknowledgements
This work was supported by R01GM108583 and NSF-CHEM/CLP 1856162. Computational time was provided by the XSEDE University of North Texas CASCaMs CRUNTCh3 high-performance cluster partially supported by NSF grant CHE-1531468 and XSEDE supported by project TG-CHE160044.
Footnotes
Conflicts of interest
There are no conflicts to declare.
Electronic supplementary information (ESI) available: Structures used for the parametrization, definitions of the studied models and results from MD simulations, representative structures from k-means clustering analysis, NCI and ELF plots. See DOI: 10.1039/d1cp03187b
Notes and references
- 1.Scheckel C and Aguzzi A, Nat. Rev. Genet, 2018, 19, 405–418. [DOI] [PubMed] [Google Scholar]
- 2.Prusiner SB, Proc. Natl. Acad. Sci. U. S. A, 1998, 95, 13363–13383. [DOI] [PMC free article] [PubMed] [Google Scholar]
- 3.Bolognesi ML, Ai Tran HN, Staderini M, Monaco A, López-Cobeñas A, Bongarzone S, Biarnés X, López-Alvarado P, Cabezas N, Caramelli M, Carloni P, Menéndez JC and Legname G, ChemMedChem, 2010, 5, 1324–1334. [DOI] [PubMed] [Google Scholar]
- 4.Zaccagnini L, Rossetti G, Tran TH, Salzano G, Gandini A, Colini Baldeschi A, Bolognesi ML, Carloni P and Legname G, Eur. J. Med. Chem, 2020, 196, 112295. [DOI] [PubMed] [Google Scholar]
- 5.Ma Y and Ma J, Pathogens, 2020, 9, 1–18. [Google Scholar]
- 6.Collinge J, Annu. Rev. Neurosci, 2001, 24, 519–550. [DOI] [PubMed] [Google Scholar]
- 7.Spagnolli G, Rigoli M, Orioli S, Sevillano AM, Faccioli P, Wille H, Biasini E and Requena JR, PLoS Pathog, 2019, 15, 1–18. [DOI] [PMC free article] [PubMed] [Google Scholar]
- 8.Eskandari-Sedighi G, Cortez LM, Yang J, Daude N, Shmeit K, Sim V and Westaway D, Mol. Neurobiol, 2021, 58, 375–390. [DOI] [PMC free article] [PubMed] [Google Scholar]
- 9.Hagiwara K, Hara H and Hanada K, J. Biochem, 2013, 153, 139–145. [DOI] [PubMed] [Google Scholar]
- 10.Morales R, PLoS Pathog, 2017, 13, e1006323. [DOI] [PMC free article] [PubMed] [Google Scholar]
- 11.Le Dur A, Laï TL, Stinnakre M-G, Laisné A, Chenais N, Rakotobe S, Passet B, Reine F, Soulier S, Herzog L, Tilly G, Rézaei H, Béringue V, Vilotte J-L and Laude H, Nat. Commun, 2017, 8, 14170. [DOI] [PMC free article] [PubMed] [Google Scholar]
- 12.Liberski PP, Gajos A, Sikorska B and Lindenbaum S, Viruses, 2019, 11, 1–25. [DOI] [PMC free article] [PubMed] [Google Scholar]
- 13.Houston F and Andréoletti O, Brain Pathol, 2019, 29, 248–262. [DOI] [PMC free article] [PubMed] [Google Scholar]
- 14.Barmada S, Piccardo P, Yamaguchi K, Ghetti B and Harris DA, Neurobiol. Dis, 2004, 16, 527–537. [DOI] [PubMed] [Google Scholar]
- 15.Watt NT, Griffiths HH and Hooper NM, Front. Cell Dev. Biol, 2014, 2, 41. [DOI] [PMC free article] [PubMed] [Google Scholar]
- 16.Schilling KM, Tao L, Wu B, Kiblen JTM, Ubilla-Rodriguez NC, Pushie MJ, Britt RD, Roseman GP, Harris DA and Millhauser GL, J. Mol. Biol, 2020, 432, 4408–4425. [DOI] [PMC free article] [PubMed] [Google Scholar]
- 17.Legname G, PLoS Pathog, 2017, 13, 1–6. [DOI] [PMC free article] [PubMed] [Google Scholar]
- 18.Evans EGGB, Pushie MJ, Markham KAA, Lee HW and Millhauser GLL, Structure, 2016, 24, 1057–1067. [DOI] [PMC free article] [PubMed] [Google Scholar]
- 19.You H, Tsutsui S, Hameed S, Kannanayakal TJ, Chen L, Xia P, Engbers JDT, Lipton SA, Stys PK and Zamponi GW, Proc. Natl. Acad. Sci. U. S. A, 2012, 109, 1737–1742. [DOI] [PMC free article] [PubMed] [Google Scholar]
- 20.Gasperini L, Meneghetti E, Pastore B, Benetti F and Legname G, Antioxid. Redox Signaling, 2015, 22, 772–784. [DOI] [PMC free article] [PubMed] [Google Scholar]
- 21.Donne DG, Viles JH, Groth D, Mehlhorn I, James TL, Cohen FE, Prusiner SB, Wright PE and Dyson HJ, Proc. Natl. Acad. Sci. U. S. A, 1997, 94, 13452–13457. [DOI] [PMC free article] [PubMed] [Google Scholar]
- 22.Hara H and Sakaguchi S, Int. J. Mol. Sci, 2020, 21, 1–14. [DOI] [PMC free article] [PubMed] [Google Scholar]
- 23.Kawahara M, Kato-Negishi M and Tanaka K-I, Int. J. Mol. Sci, 2021, 22, 1–15. [Google Scholar]
- 24.Sánchez-López C, Rossetti G, Quintanar L and Carloni P, Int. J. Mol. Sci, 2019, 20, 1–15. [DOI] [PMC free article] [PubMed] [Google Scholar]
- 25.Walter ED, Chattopadhyay M and Millhauser GL, Biochemistry, 2006, 45, 13083–13092. [DOI] [PMC free article] [PubMed] [Google Scholar]
- 26.Markham KA, Roseman GP, Linsley RB, Lee H-W and Millhauser GL, Biophys. J, 2019, 116, 610–620. [DOI] [PMC free article] [PubMed] [Google Scholar]
- 27.Klewpatinond M, Davies P, Bowen S, Brown DR and Viles JH, J. Biol. Chem, 2008, 283, 1870–1881. [DOI] [PubMed] [Google Scholar]
- 28.Csire G, Turi I, Sóvágó I, Kárpáti E and Kállay C, J. Inorg. Biochem, 2020, 203, 110927. [DOI] [PubMed] [Google Scholar]
- 29.Kardos J, Kovács I, Hajós F, Kálmán M and Simonyi M, Neurosci. Lett, 1989, 103, 139–144. [DOI] [PubMed] [Google Scholar]
- 30.D’Ambrosi N and Rossi L, Neurochem. Int, 2015, 90, 36–45. [DOI] [PubMed] [Google Scholar]
- 31.Grayson JD, Baumgartner MP, Santos Souza CD, Dawes SJ, El Idrissi IG, Louth JC, Stimpson S, Mead E, Dunbar C, Wolak J, Sharman G, Evans D, Zhuravleva A, Roldan MS, Colabufo NA, Ning K, Garwood C, Thomas JA, Partridge BM, de la Vega de Leon A, Gillet VJ, Rauter AP and Chen B, Chem. Sci, 2021, 12, 3768–3785. [DOI] [PMC free article] [PubMed] [Google Scholar]
- 32.Magrì A, Di Natale G and Rizzarelli E, Inorg. Chim. Acta, 2018, 472, 93–102. [Google Scholar]
- 33.Taylor DR, Watt NT, Perera WSS and Hooper NM, J. Cell Sci, 2005, 118, 5141–5153. [DOI] [PubMed] [Google Scholar]
- 34.Posadas Y, Parra-Ojeda L, Perez-Cruz C and Quintanar L, Inorg. Chem, 2021, 0, 0. [DOI] [PubMed] [Google Scholar]
- 35.Thakur AK, Srivastava AK, Srinivas V, Chary KVR and Rao CM, J. Biol. Chem, 2011, 286, 38533–38545. [DOI] [PMC free article] [PubMed] [Google Scholar]
- 36.Hiraoka W, Inanami O and Murakami S, Free Radical Biol. Med, 2020, 159, S23. [Google Scholar]
- 37.Millhauser GL, Acc. Chem. Res, 2004, 37, 79–85. [DOI] [PMC free article] [PubMed] [Google Scholar]
- 38.Chattopadhyay M, Walter ED, Newell DJ, Jackson PJ, Aronoff-Spencer E, Peisach J, Gerfen GJ, Bennett B, Antholine WE and Millhauser GL, J. Am. Chem. Soc, 2005, 127, 12647–12656. [DOI] [PMC free article] [PubMed] [Google Scholar]
- 39.Millhauser GL, Annu. Rev. Phys. Chem, 2007, 58, 299–320. [DOI] [PMC free article] [PubMed] [Google Scholar]
- 40.Dunbar RC, Martens J, Berden G and Oomens J, J. Phys. Chem. A, 2018, 122, 5589–5596. [DOI] [PMC free article] [PubMed] [Google Scholar]
- 41.Sciortino G, Lubinu G, Maréchal J-D and Garribba E, Magnetochemistry, 2018, 4, 1–19. [Google Scholar]
- 42.Nowakowski Michałand Czapla-Masztafiak J, Zhukov I, Zhukova L, Kozak M and Kwiatek WM, Metallomics, 2019, 11, 632–642. [DOI] [PubMed] [Google Scholar]
- 43.Chen K, Li W, Wang J and Wang W, J. Phys. Chem. B, 2019, 123, 5216–5228. [DOI] [PubMed] [Google Scholar]
- 44.Quintanar L, Rivillas-Acevedo L, Grande-Aztatzi R, Gómez-Castro CZ, Arcos-López T and Vela A, Coord. Chem. Rev, 2013, 257, 429–444. [Google Scholar]
- 45.Burns CS, Aronoff-Spencer E, Dunham CM, Lario P, Avdievich NI, Antholine WE, Olmstead MM, Vrielink A, Gerfen GJ, Peisach J, Scott WG and Millhauser GL, Biochemistry, 2002, 41, 3991–4001. [DOI] [PMC free article] [PubMed] [Google Scholar]
- 46.Bruschi M, De Gioia L, Mitrić R, Bonačić-Koutecký V and Fantucci P, Phys. Chem. Chem. Phys, 2008, 10, 4573–4583. [DOI] [PubMed] [Google Scholar]
- 47.Hodak M, Chisnell R, Lu W and Bernholc J, Proc. Natl. Acad. Sci. U. S. A, 2009, 106, 11576–11581. [DOI] [PMC free article] [PubMed] [Google Scholar]
- 48.Ames WM and Larsen SC, JBIC, J. Biol. Inorg. Chem, 2009, 14, 547–557. [DOI] [PubMed] [Google Scholar]
- 49.Furlan S, La Penna G, Guerrieri F, Morante S and Rossi GC, JBIC, J. Biol. Inorg. Chem, 2007, 12, 571–583. [DOI] [PubMed] [Google Scholar]
- 50.Shi Y, Xia Z, Zhang J, Best R, Wu C, Ponder JW and Ren P, J. Chem. Theory Comput, 2013, 9, 4046–4063. [DOI] [PMC free article] [PubMed] [Google Scholar]
- 51.Zhang C, Lu C, Jing Z, Wu C, Piquemal J-P, Ponder JW and Ren P, J. Chem. Theory Comput, 2018, 14, 2084–2108. [DOI] [PMC free article] [PubMed] [Google Scholar]
- 52.Chai J-D and Head-Gordon M, Phys. Chem. Chem. Phys, 2008, 10, 6615–6620. [DOI] [PubMed] [Google Scholar]
- 53.Krishnan R, Binkley JS, Seeger R and Pople JA, J. Chem. Phys, 1980, 72, 650–654. [Google Scholar]
- 54.Frisch MJ, Trucks GW, Schlegel HB, Scuseria GE, Robb MA, Cheeseman JR, Scalmani G, Barone V, Petersson GA, Nakatsuji H, Li X, Caricato M, Marenich AV, Bloino J, Janesko BG, Gomperts R, Mennucci B, Hratchian HP, Ortiz JV, Izmaylov AF, Sonnenberg JL, Williams-Young D, Ding F, Lipparini F, Egidi F, Goings J, Peng B, Petrone A, Henderson T, Ranasinghe D, Zakrzewski VG, Gao J, Rega N, Zheng G, Liang W, Hada M, Ehara M, Toyota K, Fukuda R, Hasegawa J, Ishida M, Nakajima T, Honda Y, Kitao O, Nakai H, Vreven T, Throssell K, Montgomery JA Jr., Peralta JE, Ogliaro F, Bearpark MJ, Heyd JJ, Brothers EN, Kudin KN, Staroverov VN, Keith TA, Kobayashi R, Normand J, Raghavachari K, Rendell AP, Burant JC, Iyengar SS, Tomasi J, Cossi M, Millam JM, Klene M, Adamo C, Cammi R, Ochterski JW, Martin RL, Morokuma K, Farkas O, Foresman JB and Fox DJ, Gaussian’16 Revision C.01, 2016.
- 55.Ren P, Wu C and Ponder JW, J. Chem. Theory Comput, 2011, 7, 3143–3161. [DOI] [PMC free article] [PubMed] [Google Scholar]
- 56.Xiang JY and Ponder JW, J. Comput. Chem, 2013, 34, 739–749. [DOI] [PMC free article] [PubMed] [Google Scholar]
- 57.Qiu D, Shenkin PS, Hollinger FP and Still WC, J. Phys. Chem. A, 1997, 101, 3005–3014. [Google Scholar]
- 58.Åqvist J, Wennerström P, Nervall M, Bjelic S and Brandsdal BO, Chem. Phys. Lett, 2004, 384, 288–294. [Google Scholar]
- 59.Bussi G, Donadio D and Parrinello M, J. Chem. Phys, 2007, 126, 14101. [DOI] [PubMed] [Google Scholar]
- 60.Qian X and Schlick T, J. Chem. Phys, 2002, 116, 5971–5983. [Google Scholar]
- 61.Essmann U, Perera L, Berkowitz ML, Darden T, Lee H and Pedersen LG, J. Chem. Phys, 1995, 103, 8577–8593. [Google Scholar]
- 62.Kratz EG, Walker AR, Lagardère L, Lipparini F, Piquemal J-P and Andrés Cisneros G, J. Comput. Chem, 2016, 37, 1019–1029. [DOI] [PMC free article] [PubMed] [Google Scholar]
- 63.Gökcan H, Vázquez-Montelongo EA and Cisneros GA, J. Chem. Theory Comput, 2019, 15, 3056–3065. [DOI] [PMC free article] [PubMed] [Google Scholar]
- 64.Kratz EG, Duke RE and Cisneros GA, Theor. Chem. Acc, 2016, 135, 166. [DOI] [PMC free article] [PubMed] [Google Scholar]
- 65.Zhang Y, Lee T-S and Yang W, J. Chem. Phys, 1998, 110, 46–54. [Google Scholar]
- 66.Fang D, Chaudret R, Piquemal J-P and Cisneros GA, J. Chem. Theory Comput, 2013, 9, 2156–2160. [DOI] [PubMed] [Google Scholar]
- 67.Lu T and Chen F, J. Comput. Chem, 2012, 33, 580–592. [DOI] [PubMed] [Google Scholar]
- 68.Noury S, Krokidis X, Fuster F and Silvi B, Comput. Chem, 1999, 23, 597–604. [Google Scholar]
- 69.Ditchfield R, Mol. Phys, 1974, 27, 789–807. [Google Scholar]
- 70.Wolinski K, Hinton JF and Pulay P, J. Am. Chem. Soc, 1990, 112, 8251–8260. [Google Scholar]
- 71.Cheeseman JR, Trucks GW, Keith TA and Frisch MJ, J. Chem. Phys, 1996, 104, 5497–5509. [Google Scholar]
- 72.Bauernschmitt R and Ahlrichs R, J. Chem. Phys, 1996, 104, 9047–9052. [Google Scholar]
- 73.La Penna G, Machetti F, Proux O, Rossi G, Stellato F and Morante S, J. Phys. Chem. C, 2021, 125, 1483–1492. [Google Scholar]
- 74.Hooper N, Taylor D and Watt N, Biochem. Soc. Trans, 2008, 36, 1272–1276. [DOI] [PubMed] [Google Scholar]
- 75.Altmeppen HC, Puig B, Dohler F, Thurm DK, Falker C, Krasemann S and Glatzel M, J. Neurodegener. Dis, 2012, 1, 15–31. [PMC free article] [PubMed] [Google Scholar]
- 76.Mangé A, Béranger F, Peoc’h K, Onodera T, Frobert Y and Lehmann S, Biol. Cell, 2004, 96, 125–132. [DOI] [PubMed] [Google Scholar]
- 77.Chen SG, Teplow DB, Parchi P, Teller JK, Gambetti P and Autilio-Gambetti L, J. Biol. Chem, 1995, 270, 19173–19180. [DOI] [PubMed] [Google Scholar]
Associated Data
This section collects any data citations, data availability statements, or supplementary materials included in this article.


