

Abstract
The diversity of cell lineages that comprise mature blood in vertebrate animals arise from the differentiation of hematopoietic stem and progenitor cells (HSPCs). This is a critical process that occurs throughout the lifespan of organisms, and disruption of the molecular pathways involved during embryogenesis can have catastrophic long-term consequences. For a multitude of reasons, zebrafish (Danio rerio) has become a model organism to study hematopoiesis. Zebrafish embryos develop externally, and by 7 days post-fertilization (dpf) have produced most of the subtypes of definitive blood cells that will persist for their lifetime. Assays to assess the number of hematopoietic cells have been developed, mainly utilizing specific histological stains, in situ hybridization techniques, and microscopy of transgenic animals that utilize blood cell-specific promoters driving the expression of fluorescent proteins. However, most staining assays and in situ hybridization techniques don’t accurately quantitate the number of blood cells present; only large differences in cell numbers are easily visualized. Utilizing transgenic animals and analyzing individuals with fluorescent or confocal microscopy can be performed, but the quantitation of these assays relies on either counting manually or utilizing expensive imaging software, both of which can make errors. Development of additional methods to assess blood cell numbers would be economical, faster, and could even be automated to quickly assess the effect of CRISPR-mediated genetic modification, morpholino-mediated transcript reduction, and the effect of drug compounds that affect hematopoiesis on a large scale. This novel assay to quantitate blood cells is performed by dissociating whole zebrafish embryos and analyzing the amount of fluorescently labelled blood cells present. These assays should allow elucidation of molecular pathways responsible for blood cell generation, expansion, and regulation during embryogenesis, which will allow researchers to further discover novel factors altered during blood diseases, as well as pathways essential during the evolution of vertebrate hematopoiesis.
Keywords: Blood cells, zebrafish, morpholinos, CRISPR, hematopoiesis, development, stem cells, flow cytometry, FACS
SUMMARY:
This assay is a simple method to quantitate hematopoietic cells in developing embryonic zebrafish. Blood cells from dissociated zebrafish are subjected to flow cytometry analysis. This allows the detection of blood defects in mutant animals and after genetic modification.
INTRODUCTION:
Blood production (hematopoiesis) is an essential developmental process that first starts in the early embryo. This process begins by generating primitive red blood cells and macrophages directly from mesoderm, and later shifts towards the production of hematopoietic stem and progenitor cells (HSPCs). These stem cells, which are multipotent, generate all of the varieties of mature blood cells in the organism. Capable of self-renewal, the system is continually replenished through these HSPCs. While this process starts early in development, hematopoiesis continues for the life of the animal, providing the ability to transport oxygen to distant sites of the body, to stop bleeding after injury, and to protect the body from infection. The development of this complex system is controlled temporally and spatially during development and any perturbations in blood cell production can be catastrophic for the organism, resulting in anemia, thrombocytopenia, leukopenia, and leukemia.
A popular animal model used for hematopoietic research is the zebrafish (Danio rerio) because they have similar blood development when compared to humans. In fact, many of the genes and molecular pathways used during hematopoiesis are conserved throughout vertebrate evolution, allowing us to learn about human genes by studying zebrafish. Importantly, zebrafish embryos develop outside the body and within 7 days have generated most mature blood cell types, allowing for direct visualization of the hematopoietic system in a short amount of time. Zebrafish are also extremely fecund, which allows researchers to observe a larger number of samples in a short time frame, which is also important for generating reproducible data. The zebrafish’s short generation time and external development provides for easier manipulation and observation during mutagenesis studies1–5 and drug screening6–10. This allows a panel of promising therapeutic compounds for human blood disorders to be quickly and efficiently tested.
Importantly, zebrafish are also genetically amenable, and the genome is sequenced and annotated. This tractability allows reverse genetics techniques such as morpholino- (MO) mediated knockdown and CRISPR-mediated genetic ablation to be performed. Zebrafish have also proven their utility as a model to perform forward genetic screens; many essential genes and pathways involved in vertebrate blood formation have been discovered in this manner. Numerous methods of observing blood cells have also been developed in zebrafish. While traditional histological staining techniques exist, it is also possible to perform in situ hybridization for blood-specific transcripts. Importantly, numerous transgenic lines of fish also exist whereby fluorescent proteins are expressed by lineage-specific promoters, allowing the labelling of specific blood cells with fluorescent proteins11. This allows researchers to perform up-to-the-minute observation of blood cell genesis, expansion, and regulation in a living organism over time.
Overall, conservation of the hematopoietic system, the presence and easy development of transgenic lines, easy visualization, and short generation time has made the zebrafish an economical, fast, and adaptable model of hematopoiesis. To improve upon the toolbox of techniques available for zebrafish researchers, we developed this assay to robustly quantitate the number of blood cells in embryos. The method involves digesting transgenic animals and performing flow cytometry for fluorescent blood cells. In this way, blood cells from mutant animals, the effect of MO and CRISPR modification, and the effect of small molecules can be quantitatively analyzed in a quick and reproducible manner. In essence, these assays are user-friendly and economical ways to enumerate blood cells, allowing examination of their generation, proliferation, and maintenance over time.
PROTOCOL:
The Institutional Animal Care and Use Committee (IACUC) advisory board at California State University, Chico, approved all methods described below.
Note: It is advised to treat embryos with 1-phenyl 2-thiourea (PTU; see Table 1) at 24 hpf to prevent pigmentation which negatively affects fluorescence discrimination by flow cytometry.
Note: All procedures listed below are acceptable for flow cytometry and FACS. However, if one’s goal is to culture the hematopoietic cells after FACS, then adhere to sterile practices when processing samples. The protocol for bleaching and preparing embryo samples in a sterile manner has been described previously12.
Table 1:
Recipes for solutions.
| Solution | Ingredients | Notes |
|---|---|---|
| E3 (50x) | 14.61 g of NaCl, 0.63 g KCI, 1.99 g MgSO4 * 7H20, 1.83 g CaCl2 * 2H20 | To a 2000 mL graduated cylinder add the ingredients and enough distilled water to bring the total volume to 1000 mL. |
| E3 (1x) | 40 mL of 50x E3 | To a 2000 mL graduated cylinder add enough distilled water to bring the total volume to 2000 mL. |
| PTU in E3 | 40 mL 50x E3 in 2000 mL bottle, 40 mg PTU (1-Phenyl-2-thiourea) | To a 2000 mL graduated cylinder add enough distilled water to bring the total volume to 2000 mL. Stir for at least 2 days to completely dissolve PTU. |
-
Dechorionate 48 hpf zebrafish embryos
-
1.1.
With embryos in a 10 cm plastic petri dish, tilt the dish so that the embryos sink to the bottom edge. Use at least 5, but no more than 200 embryos at this stage. It is easy to tilt the dish by removing its lid and placing the lid underneath one edge of the petri dish.
-
1.2.
Remove and discard as much E3 as possible and add 500 μL of dechorionation protease (10 mg/mL). Incubate at room temperature for 5 min.
-
1.3.
After 5 min, pick up the petri dish (keeping all the embryos at the bottom edge of the plate), and gently tap the side of the petri dish, allowing embryos to gently rub against the bottom of the plate to completely remove chorions.
-
1.4.
With a squeeze bottle, add ~20 mL E3 to dilute protease. Allow embryos to settle, and remove the E3 by decanting.
-
1.5.
Repeat step 1.4 three times to remove all traces of the dechorionation protease.
Note: For each individual sample to analyze, at least 5 embryos are required. This dechorionation procedure can accommodate up to 200 embryos per petri dish. Samples can be grouped at this stage and separated later if desired. Alternatively, manual dechorionation can be performed by gently tearing the chorions with watchmaker forceps. This is advantageous when there are small numbers of embryos.
Note: Usually zebrafish will usually hatch from their chorions by 72 hpf. Severely malformed embryos may not, however, and will require dechorionation (either manual or chemical) after that time.
-
1.1.
-
Preparing embryo samples
-
2.1.
Using a P1000 pipette, place 5–10 embryos into a single 1.5 mL microcentrifuge (mcf) tube.
-
2.2.
Remove E3 with a pipette and discard.
Caution: Pipette with care as embryos can easily be discarded during the following steps.
-
2.1.
-
Embryo dissociation
-
4.1.
Wash sample 3 times with 1 mL DPBS with Ca2+ and Mg2+ to remove traces of DTT. After the last wash add 500 μL of DPBS with Ca2+ and Mg2+ and 5 μL of 5 mg/mL (26 U/mL) dissociation protease.
Note: Other isotonic buffered solutions may be used, but they must contain Ca2+ and Mg2+ for the dissociation enzyme to function properly.
-
4.2.
Incubate samples at 37°C on a horizontal orbital shaker at 185 rpm for 60 min. Triturate embryos with a P1000 until samples are fully dissociated.
Caution: Take care not to over digest the embryos- some solid tissue should be present; it should not be completely homogenous. It is possible to over-digest, which will destroy the blood cells you are trying to observe on the flow cytometer (Supplemental Figure 1).
Note: This procedure works best for 48–72 hpf embryos. Later stages may require longer incubation with dissociation protease. Timing for different stages must be determined empirically.
Note: There are quicker alternative methods to dissociate embryonic tissue, but we found empirically that this method, although it takes 60 minutes, is gentle and thorough enough to allow efficient isolation of live hematopoietic cells.
-
4.1.
-
Preparation of dissociated embryos for flow cytometry
-
5.1.
Pipette the 5 dissociated embryos onto the top reservoir of a 5 mL polystyrene round bottom tube with a 35 μM cell strainer cap.
-
5.2.
Rinse cells by adding 4 ml PBS (with no Ca2+ or Mg2+) to the strainer cap of the 5ml polystyrene tube containing the filtered cells.
Note: Other isotonic buffered solutions may also be utilized, but they should lack Ca2+ or Mg2+ as to dilute and render the dissociation enzyme ineffective.
-
5.3.
Centrifuge tubes at 4°C and 300 g for 5 min to pellet the cells. With a pipette, remove and discard supernatant. Resuspend the cells in 500 μL of PBS (with no Ca2+ or Mg2+).
-
5.1.
-
Flow cytometry
-
6.1.
Gently vortex the cell suspension and add 1:1000 SYTOX Red to the sample. SYTOX Red is a cell-permeable dye that allows exclusion of dead cells and debris from the cells of interest.
Note: SYTOX Red is an excellent choice of dye for dead cell discrimination, as it is excited by the 633nm laser, which is different from the 488 nm laser used to excite common fluorophores such as GFP and DsRed. In this way, there is no spectral overlap from dead cells and transgenic blood cells.
Caution: When analyzing blood cells, be aware that after 30 minutes cells certain cell types will begin to phagocytose SYTOX Red. Be prepared to keep cells protected from light and on ice until analysis and perform flow cytometry within 30 minutes of adding the dye.
Note: Propidium iodide (PI) at 1 mg/ml is an inexpensive alternative to SYTOX Red, but be sure to reserve some samples stained only with PI as well as samples only with your fluorophore of interest to set the instrument’s compensation. Otherwise, the signals of PI and fluorophores such as GFP will overlap, resulting in false-positive results. If the flow cytometer also has a 405 nm laser, other dyes such as SYTOX Blue are also an excellent choice.
-
6.2.
Embryonic cells are now ready for flow cytometry analysis.
Note: Every flow cytometer is a little different, but the following steps will assist you in preparing your sample for analysis on most machines. If you are new to flow cytometry, seek the advice of someone that is an expert on your particular piece of equipment. The following instructions pertain to the BD FACSAria Fusion.
-
6.2.1.
Turn on cytometer and allow lasers to warm up for 20 minutes. Empty waste tank, fill sheath tank with appropriate solution (varies based on flow cytometer), and start the fluidics system. There is usually a particular start up procedure for each type of flow cytometer- follow that start up procedure carefully.
-
6.2.2.
In the analysis software, draw five plots (see Figure 1A). Have the first dot plot measure forward scatter (FSC) on the x-axis and side scatter (SSC) on the y-axis. FSC is a measurement of cell size, and SSC is a measurement of granularity; this will allow the discrimination of cells from debris. Set FSC as “linear” and SSC as “log.”
Note: Embryonic zebrafish blood cell populations do not separate by size and granularity in the same manner as adult zebrafish blood cells described previously15. Instead they will appear in the same population with all the other digested embryonic cells.
Set the second plot to examine FSC Height (H) versus FSC (W). Set the third plot to measure SSC (H) versus SSC (W). This step is utilized to exclude doublets (cells that are stuck together when they pass through the laser).
-
Set the fourth dot plot to measure SYTOX-Red on the x-axis (depending on your cytometer this is usually equivalent to the filter used for Allophycocyanin [APC]) and SSC on the y-axis. This will allow the discrimination of live cells from dead cells.
Note: Every cytometer’s filter sets are a little different. Make sure to use the correct detection filter for your dead cell discrimination dye.
-
The fifth plot measures your fluorophore of choice. Visualize this as a histogram of the fluorophore (Figure 1) or utilize a dot plot (Supplemental Figure 2).
Note: When examining more than one fluorophore in the same animal, it is advisable to use a dot plot to see both parameters at the same time. It is also advisable to use a dot plot if there is any chance that the fluorophores have spectral overlap with each other (Supplemental Figure 2).
Note: Use the “Area (A)” settings (this calculates the area under the curve generated by the laser pulse of the cytometer) for all parameters, as they are more accurate.
-
6.2.3.
Load sample and turn down the flow rate so the sample is not rapidly used up. Adjust the FSC and SSC settings so that you can see the bulk of the cell population clearly (See Figure 1A). Draw a gate around the cell population and label it “cells.” Making sure that your second dot plot is gated on “cells,” exclude doublets by first gating on FSC and then on SSC “singlets”. On the fourth plot adjust the SYTOX-Red setting so that there is clearly a negative population. Draw a gate around these cells, and label them “live cells.” On the fifth plot, gate on “live cells” and examine fluorophore negative and positive cells. Draw a gate around the positive cells.
Note: This hierarchical gating strategy examines single “fluorophore+” cells that reside in the “live cells” gate, which also reside in the “cell” gate. Take care to set gates properly. These gates can be customized depending on the experiment.
-
6.2.4.
Run each sample, collecting at least 25,000 “live cell” events. These data can be examined on the cytometer’s software or with 3rd party applications at a later time.
-
6.2.5.
Follow the cytometer’s shutdown procedure to turn off the fluidics. Refill sheath tank and empty the waste tank.
Note: It is often difficult to visualize fluorophore+ cells when the protein expression is low or the cell population is rare. To ensure the machine’s parameters are set properly, fluorophore− sibling embryos should be prepared alongside to properly draw gates and adjust laser voltages (Supplemental Figure 2).
Note: If your cell population of interest is rare, you should collect more that 25,000 events. With 5–10 digested animals, one should be capable of collecting millions of events.
Note: Total numbers of fluorophore+ cells can also be obtained with these data. Simply count the total number of cells in the sample with a hemocytometer and multiply the percentage of fluorophore+ cells to get the absolute number of fluorophore+ cells per fish.
-
6.2.1.
-
6.1.
Figure 1: ism1 MO reduces the number of red blood cells produced during embryogenesis.
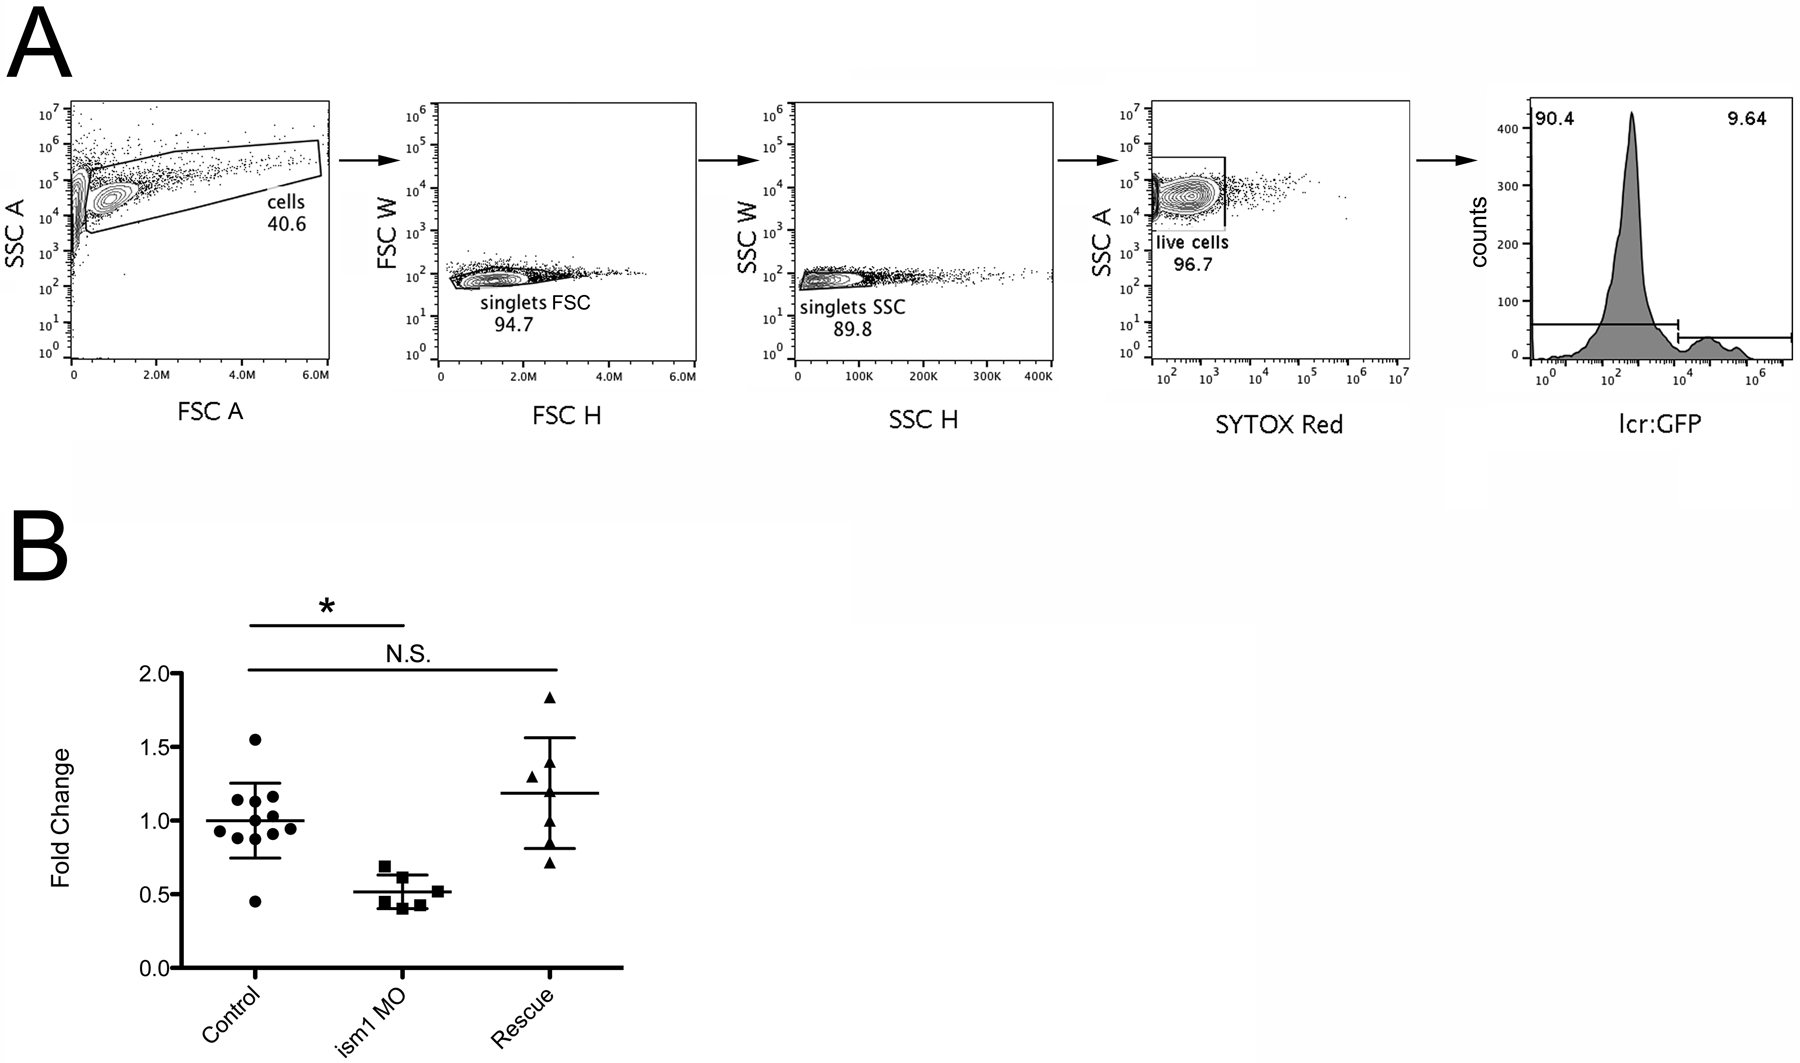
(A) lcr:GFP16 embryos were injected with PBS and subjected to flow cytometry analysis. First, size and granularity is determined and a gate is drawn around the cell population of interest (“cells”, left panel). Then, FSC H and FSC W is evaluated to eliminate cells stuck together (“singlets FSC”). SSC H and W is also evaluated to reduce the possibility of evaluating cells stuck together (“singlets SSC”). SYTOX Red fluorescence is then examined to determine live cells (“live cells”). Finally, live cells are examined for GFP fluorescence (right panel). (B) lcr:GFP12 embryos were injected with PBS (control, circles), ism1 MO (ism1 MO, squares), or ism1 MO + ism1 mRNA12 (Rescue, triangles) at the one-cell-stage of development. 48 hours later they were collected, digested, and subjected to flow cytometry as shown in (A). Each point represents five randomly chosen individual embryos. Fold change is calculated by taking the average percentage of GFP+ cells of the control sample, and setting that as “1.” All other samples are compared to that average. * represents p < 0.005, and N.S. represents not significant.
REPRESENTATIVE RESULTS:
To enumerate red blood cells in embryonic zebrafish, lcr:GFP16 embryos were injected at the one-cell-stage with PBS, 7.0 ng/nL ism1 MO, or 7.0 ng/nL ism1 MO with 7.0 ng ism1 mRNA12. At 48 hpf they were digested and subjected to flow cytometry analysis. After analyzing the percentage of GFP+ red blood cells from each sample (each sample is 5 randomly selected embryos; Figure 1A), the average of all the control group was calculated. This average was set as “1,” and all percentages were calculated from that reference point. These data indicate that reducing ism1 transcript with a specific MO reduced the number of GFP+ red blood cells present in the 48 hpf embryo. Additionally, rescuing this reduction in ism1 levels with exogenous mRNA returned the number of red blood cells to normal.
DISCUSSION:
Zebrafish are an excellent model system for studying primitive and definitive vertebrate hematopoiesis. Over the past few decades, multiple assays have been developed and refined, allowing zebrafish to become a quick and economical model for testing drugs, generating and testing genetic mutants, and overall allowing researchers to analyze molecular pathways essential for hematopoiesis. This protocol utilizes embryonic zebrafish which allows quick data collection, the use of less physical space than adult animals, and the use of less drugs for large-scale chemical screens. It also allows quantitation after overexpression of mRNA, generation of CRISPR mutants, and MO-induced transcript reduction to alter specific genetic pathways that occur during early embryonic development. Importantly, it allows sensitive, robust quantitation of blood cells, which is difficult to do with in situ hybridization or histological staining techniques.
This assay is flexible and can be modified to answer many research questions. One modification of this protocol can be performed whereby the developmental stage of the animal is manipulated to quantitate different blood cell types. For example, red blood cells arise early in zebrafish development, and with transgenic animals such as the lcr:GFP16 transgenic line can be detected as early as the 16-somite stage. If one is interested in studying thrombocytes, however, the itga2b:GFP18 (also known as cd41:GFP) transgenic line starts expressing GFP at 48 hpf, with mature circulating thrombocytes observed at 72 hpf. If one desires to quantitate B cells with this assay then it can be performed with ighm:EGFP19 transgenic animals closer to 20 dpf. Importantly, this assay can also be used to follow blood cells over time. For example, by analyzing the numbers of lcr:GFP+ cells at 24 hpf, 48 hpf, 72 hpf, one could determine if a genetic modification (or drug) is regulating the maintenance of red blood cells versus just their generation.
These assays allow researchers to reduce gene expression with CRISPR or MOs or overexpress gene expression by injecting mRNA at the one-cell-stage of development and accurately compare the number of blood cells produced in these modified embryos. Care should always be taken to perform proper controls for these experiments at the same time by injecting sibling animals with non-specific guide RNAs or mismatched MOs and examining their blood alongside the experimental groups. The developmental stage is critical; alterations of only a few hours during development could show vastly different numbers of blood cells present in an embryo. In other words, make sure to carefully monitor the hours of development when comparing embryos. To ensure that embryos are age-matched, morphological cues should be utilized. In early embryos, consider counting somites to age-match. Later in development, other markers such as the beginning of the heart beating, the size of the otic vesicle, or length of the body can be used to match the stages of modified fish to control fish. Furthermore, the numbers of total cells can be enumerated from digested embryos to ensure the same number of cells are present in experimental and control animals. In addition to using these assays to examine genetic modification, these assays can also be modified to perform large scale drug screens. Embryos can be exposed to different concentrations of compounds temporally during development to see if the chemicals in question have any effect on hematopoiesis. If the experiment is designed to test the effect of a particular drug, then animals treated with vehicle only should also be included as a control. In these ways, researchers can determine if gain- or loss-of-function of specific genes or signaling pathways play an essential role in hematopoiesis.
It is essential that when examining different transgenes that the number of animals digested per sample is optimized; too few animals may generate little or no fluorescence. This is especially true when examining HSPCs which are not abundant at a particular timepoint. It is also critical when examining transgenics that have weak promoters driving fluorescence. To counteract these issues more animals (and hence, more cells) are required for accurate counts. When altering developmental stages it is also critical to optimize the digestion time. This protocol is optimized for 5 individual 48 hpf embryos per tube. Digesting more mature embryos will likely require longer time.
Some potential problems can arise during the procedure. If there is no fluorescence observed, there could be a technical issue with the cytometer that needs to be resolved. For this reason, it is essential to verify that the embryos are fluorescent before beginning the procedure by quickly checking them under a microscope. Another common issue is over-digesting the embryos, which destroys the cells. Take care at the digestion step and alter the timing if too many dead cells are observed.
These assays have a few limitations. The largest issue is that these assays are relying on the expression of a transgenic marker. Potentially the change of the transgenic marker’s expression may not reflect the biology of what is occurring in the embryo. Additionally, flow cytometry may not be the best method to quantitate cells if the target cell population is extremely low. To deal with these possibilities, other assays such as in situs or histological staining techniques could be utilized. If specific antibodies exist for the cell type of interest immunohistochemistry can also be performed. Embryos could also be subjected to qRT-PCR to measure lineage specific genes, and if these assays are performed on a FACS machine, the cells could be isolated and studied individually with even more sensitive methods. Excluding these issues, this quantitative flow cytometry assay can generate a lot of useful information for researchers.
With these assays, researchers can easily observe hematopoietic defects in vertebrate animals. Modifying genetic pathways with MOs or CRISPR and then performing flow cytometry to elucidate if the gene plays a role in hematopoiesis can be done quickly and is quantitative. Additionally, forward genetic screens (as long as the animals have a fluorescent tag) can be performed and defects assessed. Zebrafish have also become an excellent model for large scale drug screens6–10, allowing efficient drug screening assays on living organisms to observe if the drugs are efficacious and if they have negative effects on development/survival. Coupling this assay with automated flow cytometry technology enhanced by robotics would make it even more efficient20–22, allowing truly large-scale analysis and screening of pathways important in blood cell genesis, growth, and regulation that remain obscure.
Supplementary Material
Supplemental Figure 2: Evaluation of two fluorophores in 5 dpf embryos. Gates are drawn to evaluate FSC and SSC to determine the cell population of interest (“cells,” left column), to evaluate singlets (not shown), to determine live cells (“live,” middle column), and fluorophore expression (mpx:GFP17 and gata1:DsRed15). First, gates are set on an animal that has no fluorophores (top row). Then mpx:GFP+ (with no gata1:DsRed) animals are evaluated to set the gates and compensation for GFP (second row). gata1:DsRed+ (with no mpx:GFP) animals are evaluated to set the gates and compensation for DsRed (third row). Finally, the two colors can be evaluated in double positive animals that are mpx:GFP+ and gata1:DsRed+.
Supplemental Figure 1: Digestion of embryos with dissociation protease. (A) Images of 10 embryos not properly digested (left; undigested), after adequate digestion (middle; digested), and after excess digestion (right; overdigested).
| Name of Material/Equipment | Company | Catalog Number | Comments/Description |
|---|---|---|---|
| Dithiolthreitol (DTT) | Sigma-Aldrich | 646563 | |
| DPBS (10X) with Caclium2+ and Magnesium2+ | Life Technologies | 14080–055 | |
| FBS 500 ml | Gemini Bio-Products | 100–108 | |
| HyClone PBS (1X) | GE Healthcare Life Sciences | sh30256.01 | |
| Librease TM | Roche Sigma-Aldrich | 5401119001 | dissociation protease |
| 1.5 ml MCF tube | FisherBrand | 05-408-129 | |
| 10mm Polystyrene easygrip petri dish | Corning Falcon | 351008 | |
| 5 ml Polystyrene round bottom tube with cell strainer cap | Corning Falcon | 352235 | |
| Pronase | Roche Sigma-Aldrich | 11459643001 | dechorionation protease |
ACKNOWLEDGMENTS:
Funding was provided by the National Institutes of Health (NIH: R15 DK114732-01 to D.L.S.), the National Science Foundation (NSF: MRI 1626406 to D.L.S.), and from the Honor’s Program at California State University Chico (to K.F.R.).
We thank Betsey Tamietti for laboratory management and Kathy Johns for administrative assistance.
Footnotes
DISCLOSURES:
D.L.S. is a scientific consultant and has received compensation from Finless Foods, Inc. and Xytogen Biotech, Inc. K.F.R. declares no competing interests.
REFERENCES:
- 1.Driever W et al. A genetic screen for mutations affecting embryogenesis in zebrafish. Development 123, 37–46 (1996). [DOI] [PubMed] [Google Scholar]
- 2.Weinstein BM et al. Hematopoietic mutations in the zebrafish. Development 123, 303–309 (1996). [DOI] [PubMed] [Google Scholar]
- 3.Ransom DG et al. Characterization of zebrafish mutants with defects in embryonic hematopoiesis. Development 123, 311–319 (1996). [DOI] [PubMed] [Google Scholar]
- 4.Amsterdam A et al. A large-scale insertional mutagenesis screen in zebrafish. Genes Dev 13, 2713–2724, doi: 10.1101/gad.13.20.2713 (1999). [DOI] [PMC free article] [PubMed] [Google Scholar]
- 5.Gaiano N et al. Insertional mutagenesis and rapid cloning of essential genes in zebrafish. Nature 383, 829–832, doi: 10.1038/383829a0 (1996). [DOI] [PubMed] [Google Scholar]
- 6.Yeh JR et al. Discovering chemical modifiers of oncogene-regulated hematopoietic differentiation. Nat Chem Biol 5, 236–243, doi: 10.1038/nchembio.147 (2009). [DOI] [PMC free article] [PubMed] [Google Scholar]
- 7.Paik EJ, de Jong JL, Pugach E, Opara P & Zon LI A chemical genetic screen in zebrafish for pathways interacting with cdx4 in primitive hematopoiesis. Zebrafish 7, 61–68, doi: 10.1089/zeb.2009.0643 (2010). [DOI] [PMC free article] [PubMed] [Google Scholar]
- 8.Ridges S et al. Zebrafish screen identifies novel compound with selective toxicity against leukemia. Blood 119, 5621–5631, doi: 10.1182/blood-2011-12-398818 (2012). [DOI] [PMC free article] [PubMed] [Google Scholar]
- 9.North TE et al. Prostaglandin E2 regulates vertebrate haematopoietic stem cell homeostasis. Nature 447, 1007–1011, doi: 10.1038/nature05883 (2007). [DOI] [PMC free article] [PubMed] [Google Scholar]
- 10.Astuti Y et al. A Functional Bioluminescent Zebrafish Screen for Enhancing Hematopoietic Cell Homing. Stem Cell Reports 8, 177–190, doi: 10.1016/j.stemcr.2016.12.004 (2017). [DOI] [PMC free article] [PubMed] [Google Scholar]
- 11.Stachura DL & Traver D Cellular dissection of zebrafish hematopoiesis. Methods Cell Biol 133, 11–53, doi: 10.1016/bs.mcb.2016.03.022 (2016). [DOI] [PubMed] [Google Scholar]
- 12.Berrun AC & Stachura DL Development of an In Vitro Assay to Quantitate Hematopoietic Stem and Progenitor Cells (HSPCs) in Developing Zebrafish Embryos. J Vis Exp, doi: 10.3791/56836 (2017). [DOI] [PMC free article] [PubMed] [Google Scholar]
- 13.Westerfield M, Z. LI, Detrich HW. Essential Zebrafish Methods: Cell and Developmental Biology. 517 (Academic Press, 2009). [Google Scholar]
- 14.Drummond IA, D. AJ Methods in Cell Biology. Vol. 100 (Elsevier, 2010). [Google Scholar]
- 15.Traver D et al. Transplantation and in vivo imaging of multilineage engraftment in zebrafish bloodless mutants. Nat Immunol 4, 1238–1246, doi: 10.1038/ni1007 (2003). [DOI] [PubMed] [Google Scholar]
- 16.Ganis JJ et al. Zebrafish globin switching occurs in two developmental stages and is controlled by the LCR. Dev Biol 366, 185–194, doi: 10.1016/j.ydbio.2012.03.021 (2012). [DOI] [PMC free article] [PubMed] [Google Scholar]
- 17.Renshaw SA et al. A transgenic zebrafish model of neutrophilic inflammation. Blood 108, 3976–3978, doi: 10.1182/blood-2006-05-024075 (2006). [DOI] [PubMed] [Google Scholar]
- 18.Lin HF et al. Analysis of thrombocyte development in CD41-GFP transgenic zebrafish. Blood 106, 3803–3810, doi: 10.1182/blood-2005-01-0179 (2005). [DOI] [PMC free article] [PubMed] [Google Scholar]
- 19.Page DM et al. An evolutionarily conserved program of B-cell development and activation in zebrafish. Blood 122, e1–11, doi: 10.1182/blood-2012-12-471029 (2013). [DOI] [PMC free article] [PubMed] [Google Scholar]
- 20.Ding M et al. Application of High-Throughput Flow Cytometry in Early Drug Discovery: An AstraZeneca Perspective. SLAS Discov 23, 719–731, doi: 10.1177/2472555218775074 (2018). [DOI] [PubMed] [Google Scholar]
- 21.Ding M, Kaspersson K, Murray D & Bardelle C High-throughput flow cytometry for drug discovery: principles, applications, and case studies. Drug Discov Today 22, 1844–1850, doi: 10.1016/j.drudis.2017.09.005 (2017). [DOI] [PubMed] [Google Scholar]
- 22.Joslin J et al. A Fully Automated High-Throughput Flow Cytometry Screening System Enabling Phenotypic Drug Discovery. SLAS Discov 23, 697–707, doi: 10.1177/2472555218773086 (2018). [DOI] [PMC free article] [PubMed] [Google Scholar]
Associated Data
This section collects any data citations, data availability statements, or supplementary materials included in this article.
Supplementary Materials
Supplemental Figure 2: Evaluation of two fluorophores in 5 dpf embryos. Gates are drawn to evaluate FSC and SSC to determine the cell population of interest (“cells,” left column), to evaluate singlets (not shown), to determine live cells (“live,” middle column), and fluorophore expression (mpx:GFP17 and gata1:DsRed15). First, gates are set on an animal that has no fluorophores (top row). Then mpx:GFP+ (with no gata1:DsRed) animals are evaluated to set the gates and compensation for GFP (second row). gata1:DsRed+ (with no mpx:GFP) animals are evaluated to set the gates and compensation for DsRed (third row). Finally, the two colors can be evaluated in double positive animals that are mpx:GFP+ and gata1:DsRed+.
Supplemental Figure 1: Digestion of embryos with dissociation protease. (A) Images of 10 embryos not properly digested (left; undigested), after adequate digestion (middle; digested), and after excess digestion (right; overdigested).