

Abstract
Most individuals with obesity or overweight have difficulty maintaining weight loss. The weight-reduced state induces changes in many physiological processes that appear to drive weight regain. Here, we review the use of cell biology, genetics, and imaging techniques that are being used to begin understanding why weight regain is the normal response to dieting. As with obesity itself, weight regain has both genetic and environmental drivers. Genetic drivers for “thinness” and “obesity” largely overlap, but there is evidence for specific genetic loci that are different for each of these weight states. There is only limited information regarding the genetics of weight regain. Currently, most genetic loci related to weight point to the central nervous system as the organ responsible for determining the weight set point. Neuroimaging tools have proved useful in studying the contribution of the central nervous system to the weight-reduced state in humans. Neuroimaging technologies fall into three broad categories: functional, connectivity, and structural neuroimaging. Connectivity and structural imaging techniques offer unique opportunities for testing mechanistic hypotheses about changes in brain function or tissue structure in the weight-reduced state.
Introduction
The presentations in this session focused on technologies to understand the biological factors underlying obesity, weight loss, and weight regain. The marked increase in the median weight of individuals in the United States over the past 50 years is due, in large part, to changes in the environment, primarily the easy availability of highly palatable, energy-dense food (1). Once the overweight or obesity state is established, individuals have a difficult time in achieving and maintaining a weight-reduced state (2). As reviewed by Rosenberg, Hall, and Leibel and summarized by Klein (vide supra), there are important molecular, physiological, and behavioral changes that occur in individuals who reduce their weight.
The physiological changes in the weight-reduced state include changes in nervous system activity; hormonal changes, including decreases in leptin and thyroid hormone levels; and reductions in total energy expenditure, highlighted by reductions in spontaneous physical activity and rises in muscle efficiency quantifiable at low levels of physical activity in both lean individuals and individuals with obesity. With weight loss, there is a reduction in the respiratory exchange ratio, indicating increased fatty acid oxidation, and a marked reduction in the ratio of glycolytic to cytochrome C oxidase activity without significant changes in mitochondrial mass (3). These changes can be reversed by administration of leptin and triiodothyronine, with the latter proposed to be the common mediator (4), suggesting changes in intrinsic activity of mitochondria.
Dr. Debra Muoio, Duke University, provided a potential path to understanding the molecular nature of alterations in mitochondrial energetics in normal physiology and disease states. As recently published in Cell Reports (5), the approach to assessing mitochondrial “phenomics” is performed by carrying out a series of validated sets of biochemical assays under defined conditions that reflect “physiologically relevant energy demands and thermodynamic constraints”. The platform uses a modification of the creatine kinase energetic clamp technique mimic variable extramitochondrial ATP:ADP ratios seen in the cell under different energetic conditions. The approach was used to evaluate the role of lysine acetylation of mitochondrial proteins. Increased acetylation has different metabolic states, including dietary overload and insulin resistance (6-8), and associates with increases in protein acetylation. However, using the protein platform, Muoio and collaborators investigated three models of mitochondrial hyperacetylation (genetic knockouts of malonyl coenzyme A decarboxylase, SIRT5 demalonylase and desuccinylase, and SIRT3 deacetylase) and found that mitochondrial function showed only a small, but significant, 15% decrease in ATP synthase activity (9). The absence of other marked defects on mitochondrial function suggested that other pathways of mitochondrial dysfunction besides acetylation are likely playing a role in mitochondrial dysfunction in obesity.
Dr. Ruth Loos from the Icahn School of Medicine at Mount Sinai outlined the state of knowledge of genetic association studies related to obesity. She reviewed the studies that show an important genetic contribution in the development of obesity as well as evidence that many of the genetic loci that are associated with obesity partially, but not completely, overlap with those associated with thinness. Mapping of these genes suggests a primacy of the central nervous system (CNS) in a person’s weight. Dr. Loos also highlighted the importance of careful phenotyping when performing gene–weight association studies. However, studies performed to detect genetic associations with the maintenance of weight loss have been limited by small sample sizes, and as such, only the relationships of loci previously discovered to be associated with body weight have been tested. Interestingly, a minor allele at the MTIF3 (mitochondrial translational initiation factor 3) loci was the most statistically associated with weight maintenance, and preliminary studies have provided some evidence for variation of expression in adipose tissue and not the CNS.
Dr. Ellen Schur from the University of Washington reviewed techniques and applications of neuroimaging by functional magnetic resonance imaging (MRI) employed to localize brain areas that are activated in response to feeding and other cues. This allows for evaluation of potential structural and functional brain areas responsible for appetitive and cognitive behavior related to feeding behavior. The approaches were categorized into three categories: (a) functional neuroimaging, which can quantify neural activity in response to a range of stimuli in lean individuals, individuals with obesity, and weight-reduced individuals; (b) connectivity imaging by blood oxygen-level dependent (BOLD) functional MRI (fMRI) to identify regions that are in communication with each other by identifying oscillations that occur in parallel in separate brain regions, with the presumption that this indicates “cross-talk” between distinct anatomical locations; and (c) structural neuroimaging, which uses technologies used in clinical neuroradiology to assess tissue volume, composition, and microstructure and correlates these measures with a variety of clinical outcomes.
Presenting the strengths and limitations of these technologies, including small sample sizes, statistical biases, and poor reproducibility, Dr. Schur provided a balanced assessment of the state of the art and the potential for deriving new, potentially actionable insights into the neurobiology of “leanness,” obesity, and alterations that occur in response to weight loss.
Genetics of Healthy Thinness and Weight Loss Maintenance
By discovering genes, human geneticists aim to gain insight into the biology that underlies disease. The paradigm is straightforward: genes translate into proteins and biological pathways, which in turn represent the innate mechanisms that determine susceptibility to disease. In the context of body weight regulation, genetic studies have predominantly focused on obesity (10-12), at the higher end of the body weight distribution, as it is a major risk factor for a range of diseases and thus clinically relevant. Very few studies have examined the genetic contribution to healthy thinness, at the lower end of the distribution, as it is considered the “normal state” for which no causes or cures need to be sought (13-15). Healthy thinness is often defined by BMI below 18 kg/m2 or below the 10th percentile and absence of medical conditions or eating disorders (13-15). It can be argued that insights into the physiology that determines healthy thinness and resistance to weight gain (in an obesogenic environment or after weight loss) may unlock the secrets to obesity prevention and weight loss maintenance.
Because of the lack of research into persistent healthy thinness and weight loss maintenance, it is unclear whether the genes and biological pathways that cause obesity also determine a person’s ability to remain of normal/low weight. Specifically, can we assume that healthy thinness is simply the “flip side” of obesity and thus determined by the same genes? Or is healthy thinness its own “condition,” defined by another set of genes and a different biology? Furthermore, it is not known whether the genes that underlie healthy thinness are the same as those that determine weight loss maintenance after intervention (e.g., lifestyle, medication, surgery).
This short review summarizes the key findings of studies that have examined the role of genes in healthy thinness and in the maintenance of weight loss after intervention. The discovery of genes that determine people’s resistance to gaining weight in an obesogenic environment may identify new targets for the prevention and treatment of obesity.
Genetic contribution to healthy thinness and weight loss maintenance
Before the initiation of gene-discovery efforts, it is critical to establish whether the traits or diseases of interest are heritable. A large number of twin and family studies have estimated that 40% to 70% of the interindividual variation in obesity susceptibility is due to genetic variations (16). While such heritability estimates are not available for healthy thinness and weight loss maintenance, evidence for a genetic component has come from family studies, showing that the likelihood of being thin is higher when you have a thin relative, in particular if this relative is a monozygotic twin sibling (Figure 1) (14,17). No studies have estimated the genetic contribution to weight loss maintenance or regain after intervention, which is likely due to a lack of genetic research in this field. Intervention studies have predominantly focused on weight loss, for which there is evidence of a genetic component (18-20).
Figure 1.
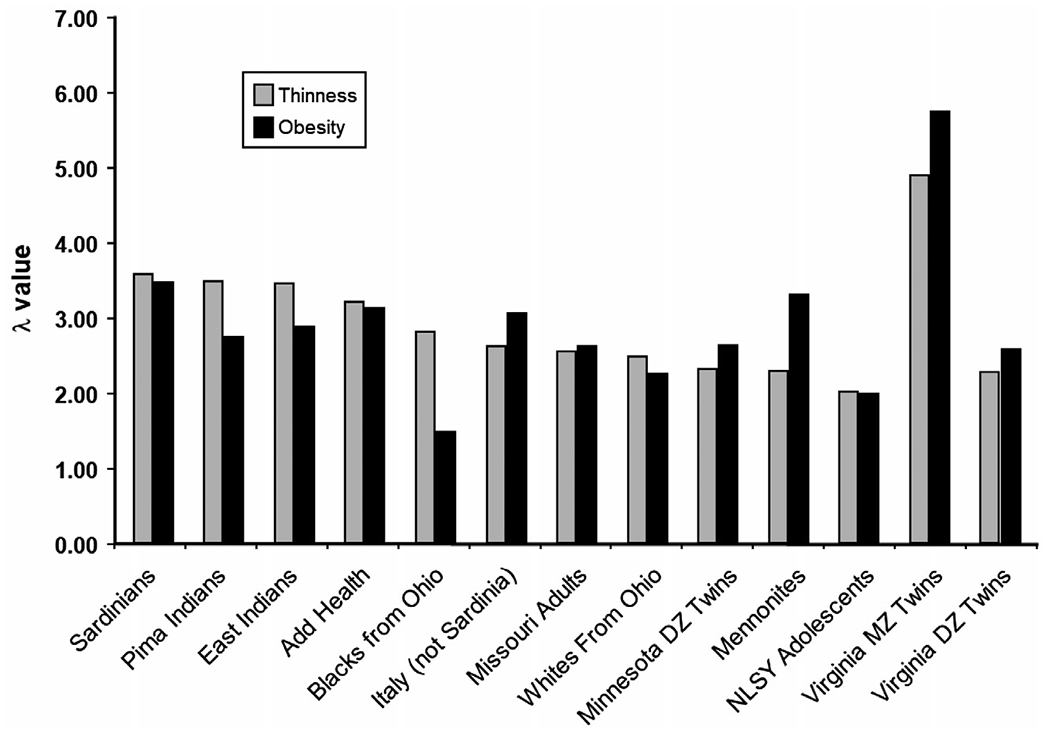
Thinness and obesity among relatives. Risch’s Lambda (λ) represents the risk of being thin or having obesity, given a relative who is thin or has obesity, divided by the population risk. From Bulik and Allison (14). For example, a Lambda of 3 means that a person is three times more likely to be thin if a relative is thin as well.
Therefore, although there is evidence for a role of genes in resistance to weight gain, the extent of the genetic contribution remains to be examined.
Genes for healthy thinness overlap with genes for obesity
Once a genetic component is established, genome-wide association studies (GWAS) are a common approach to identify the actual genes and/or genetic variants that affect variation in traits or disease susceptibility. Millions of genetic variants across the whole genome are tested for association with the outcome, without any a priori hypothesis, with the aim of identifying new genes and pathways that were not previously assumed to be involved.
GWAS have identified more than 1,000 genetic loci robustly associated with BMI in the general population (10-12). Tissue enrichment and pathway analyses based on these genetic loci have provided strong support for a role of the CNS in body weight regulation (10,12). In addition to the hypothalamus and pituitary gland, which are known sites in appetite regulation, the hippocampus and limbic system (involved in learning, cognition, and emotion) and the insula and substantia nigra (related to addiction and reward) have also been implicated (10-12,21-23). Even though BMI is used to define obesity (BMI ≥ 30 kg/m2), in GWAS, BMI is mostly treated as a continuous trait, representing the full distribution of body weight, from underweight to severe obesity. Yet genetic variants associated with BMI are typically interpreted in the context of obesity susceptibility; for example, the minor allele of the fat mass and obesity associated (FTO) gene variant is associated with a 0.39 kg/m2 higher BMI and a 1.2-fold increased risk of obesity. However, because the genetic variants tested in a GWAS are bi-allelic, findings can also be interpreted as a function of the major allele; for example, the major allele of the same FTO variant is associated with a −0.39 kg/m2 lower BMI and a 0.83 reduced risk of obesity. By design, this means that genetic loci associated with higher BMI are the same as those associated with lower BMI.
In an analysis of the extremes of the BMI distribution, the Genetic Investigation of Anthropometric Traits (GIANT) Consortium performed a GWAS that compared genotypes of people in the top 5% of the BMI distribution to those in the bottom 5% (24). It was hypothesized that the extremes of the distribution represent distinct groups enriched with carriers of low-frequency variants with large effects. Despite a large sample size (N > 25,000), no new loci were identified for the extremes beyond those already identified in GWAS for BMI (24). This may be due to the fact that the extremes compose a heterogenous group of individuals who, at the bottom 5%, may have been thin for a variety of reasons (disease, older age, healthy thin, etc.) or due to the fact that the top and bottom 5% extremes were compared to each other rather than to a normal-weight control group.
In a more recent GWAS study, cases of “persistent thinness” were more carefully ascertained and defined as individuals with a BMI ≤ 18 kg/m2 who have no medical conditions or eating disorders (13). Genome-wide genotypes of 1,471 persistently thin individuals were compared to the genotypes of 6,460 controls. Besides thin individuals, the study also included 1,456 severe childhood-onset obesity cases that were compared to the same controls. While the genome-wide analyses did not reveal any new loci for either trait (Figure 2), all of the 97 previously established BMI loci were associated with thinness and severe obesity in the direction expected from their association with BMI. Of these 97 loci, 40 reached nominal significance (P < 0.05) for association with severe obesity and only 15 for association with thinness. Consistently, the 97 loci explained more of the variance in severe obesity susceptibility (10.8%) than in persistent thinness (4.3%). While these findings suggest that the BMI-associated loci better represent severe obesity than persistent thinness, the authors argue that the difference in explained variance may be due to the fact the “severe obesity” phenotype is more extreme (with greater BMI range) than the “persistent thinness” phenotype. The single nucleotide polymorphism-heritability (h2SNP), which is the heritability attributable to all genetic variants tested in a GWAS, is similar for thinness (28%) and severe obesity (33%). By design, the h2SNP tends to be lower than the heritability estimated in twin- and family-based studies. For comparison, the h2SNP for BMI is 22%-27% (25), whereas the h2twin/family is ~40%-70% (16).
Figure 2.
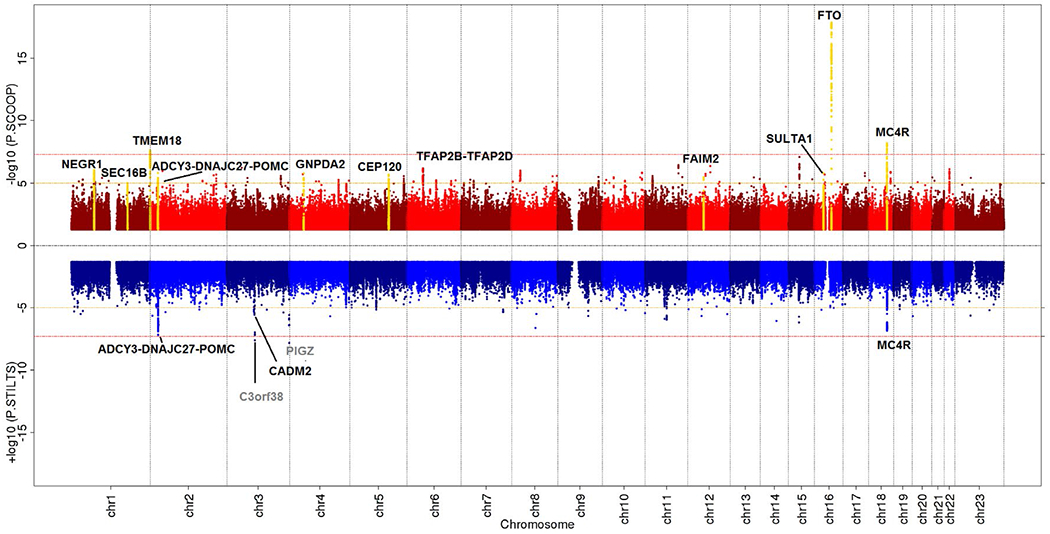
Miami plot of GWAS for severe early onset obesity (top) and persistent thinness (bottom). Red lines indicate genome-wide significance threshold at P = 5 × 10⁻⁸. Black labels highlight known BMI/obesity-associated loci that were taken forward for replication, and yellow peaks indicate those that met genome-wide significance after replication. Gray labels highlight novel loci that did not replicate. From Riveros-McKay et al. (13).
The genetic correlations of persistent thinness with severe obesity (r = −0.49) and BMI (r = −0.69) were moderate to high, which suggests that thinness and severe obesity have a shared genetic component but that the overlap is incomplete (13). Specifically, although most loci exert an effect across the full BMI spectrum, some loci seem to have a more pronounced effect on severe obesity, whereas others (e.g., in cell adhesion molecule 2 [CADM2]) have a larger effect on thinness. CADM2 encodes a cell adhesion protein that mediates synaptic assembly in the CNS (26). CADM2 represents an interesting candidate gene, as deletion of the gene in obese mice results in increased locomotor activity and energy expenditure, as well as reduced adiposity and an improved glycemic profile (27).
There was no genetic correlation between persistent thinness and anorexia nervosa (r = 0.13), confirming the careful ascertainment of persistently healthy thin individuals in this study (13).
The latest GWAS for thinness compared 881 metabolically healthy thin individuals (lowest 6th percentile of BMI distribution) with 3,173 controls (30th-50th percentile) from the Estonian Biobank (15). Although none of the genetic associations reached genome-wide significance (P < 5 × 10⁻⁸), five loci showed suggestive evidence of association (P < 1 × 10⁻⁶), of which one is located in anaplastic lymphoma kinase (ALK), a plausible candidate gene (15). ALK is a member of the insulin receptor superfamily of tyrosine kinases and is expressed widely in the brain and pituitary. Deletion of Alk in mice results in thin animals that are resistant to diet- and leptin-mutation-induced obesity. ALK appears to regulate sympathetic output, influencing energy expenditure (15). However, the relatively weak GWAS association (P = 1.4 × 10⁻⁶), and the lack of replication, warrant caution and the need for additional follow-up analyses to confirm ALK’s role in human thinness.
Genes for weight loss maintenance
Gene discovery for weight maintenance after weight loss intervention (e.g., behavioral, pharmaceutical, surgical) provides an alternative approach to gain insight into the physiology that underlies resistance to weight gain and obesity. This approach, however, has faced some important challenges. First of all, although the intervention studies are large given the intensive study design, they are often still too small to have sufficient statistical power for successful gene discovery. As such, most studies have avoided genome-wide discovery screens and have focused instead on loci that have been previously identified for their association with BMI. This approach assumes that weight maintenance/regain and BMI (assessed cross-sectionally) are determined by the same biology, which may not (always) be the case. This approach does not allow for the discovery of new loci. Furthermore, because the study designs of intervention studies vary widely in type of intervention, duration, and follow-up after weight loss, replication or meta-analyses of genetic associations are challenging, and as such, findings are often weak. Lastly, most intervention studies have focused on weight loss as the key outcome, instead of also examining the genetic underpinning of weight loss maintenance. Because of these limitations, very few reported loci show robust, replicated associations with weight loss maintenance.
Some of the larger studies that have examined the genetics of weight loss maintenance after intervention include the Diabetes Prevention Program (DPP) (28,29) and the Action for Health in Diabetes (Look AHEAD) study (29-31). The DPP includes 3,234 individuals with overweight and obesity at risk for type 2 diabetes who either underwent an intensive lifestyle intervention program (weight loss ~7%), took metformin twice daily (weight loss ~2.4%), or received no intervention (no weight loss) for 1 year (28,29). All participants were offered group classes to promote a healthy lifestyle from the second year onward. In the Look AHEAD study, 5,145 individuals with overweight or obesity with type 2 diabetes followed either an intensive lifestyle (diet and exercise) intervention (weight loss ~9% at 1 year) or a diabetes support and education program (weight loss ~0.9%) for the first year. All participants were followed individually for up to 4 years (29-31).
In participants who had lost ≥3% of their baseline weight, a small set of genetic candidate loci were tested for association with weight regain following 1 year of weight loss in the Look AHEAD study and the DPP, separately (28,30,31). In the DPP, three loci (in/near neuronal growth regulator 1 [NEGR1], brain-derived neurotrophic factor [BDNF], and peroxisome proliferator-activated receptor gamma [PPARG]) were associated with weight regain, irrespective of treatment, whereas two other loci (in/near transmembrane protein 18 [TMEM18] and potassium channel tetramerization domain containing 15 [KCTD15]) showed treatment-specific effects (28). In the Look AHEAD study, the FTO locus was associated with weight regain, but only in the diabetes support and education group (30). Despite similar study designs, none of the loci reported in the DPP were replicated in the Look AHEAD study, or vice versa (28,30). In a subsequent analysis, more than 30,000 variants across the genome were tested for association with weight regain in the Look AHEAD study, using the Candidate Gene Association Resource SNP array, which is designed to test loci relevant for a range of cardiovascular, metabolic, and inflammatory syndromes (31). However, none of the associations reached array-wide significance (31).
In a joint effort by the Look AHEAD study and the DPP, summary statistics for 91 candidate loci and their association with weight regain were combined in a meta-analysis (29). The 91 tested loci had previously been reported for association with BMI in the GIANT Consortium (10). Although none of the loci reached the study-wide significance threshold, the minor allele of rs1885988 in MTIF3 was the most strongly associated with reduced weight in the lifestyle intervention group (P = 0.002), but not in the control group (29). These findings suggest that minor allele carriers of the MTIF3 variant (rs1885988) benefit more from intensive lifestyle changes than the major allele homozygotes. Even though this association was not extremely robust, findings from other studies corroborate this observation. Specifically, a large-scale gene–environment interaction study (N ~ 68,000) that examined whether the favorable effect of a healthy diet on BMI is attenuated or exacerbated by genotype status for known BMI-associated loci also highlighted the MTIF3 locus (32). Of the 32 loci tested, only the interaction for the MTIF3 locus (rs4771122; r2EUR with rs1885988 ~ 0.72) was significant (P = 0.008); that is, the protective effect of a healthy diet on BMI is stronger in minor allele carriers of the MTIF3 locus (32). Further support for the MTIF3 locus came from a bariatric surgery study (33). Out of 34 loci tested, minor allele carriers of the MTIF3 locus (rs4771122) experienced greater long-term (up to 9.5 years) weight loss, or less weight regain, after bariatric surgery (33).
More in-depth analyses are needed to confirm whether MTIF3 is indeed the causal gene in this locus. Nevertheless, the fact that the minor allele of the MTIF3 locus, which prevents weight regain, is associated with increased MTIF3 expression in subcutaneous adipose tissue (P = 4 × 10⁻⁸ for rs4771122) suggests that MTIF3 might indeed be implicated in the underlying physiology (34). MTIF3 is a plausible candidate gene, as it is essential for ATP synthesis, energy balance, and modulation of reactive oxygen species production in the mitochondria by the electron transport chain (35). Nevertheless, additional replication of the observed associations in carefully designed and sufficiently large studies is needed to more firmly confirm the MTIF3 locus. Furthermore, in silico and in vivo fine-mapping analyses are needed to pinpoint the causal gene within this locus before they can be taken forward for more experimental work (e.g., in animal models) to reveal the mechanisms through which the candidate gene(s) affect body weight regulation.
Besides the DPP and the LOOK Ahead study, several other studies, such as the POUNDS LOST (Preventing Overweight Using Novel Dietary Strategies) (36), Diogenes (Diet, Obesity, and Genes) (37), SOS (Swedish Obese Subjects) (38), and others (39), have reported on the association of established obesity-associated variants with weight regain or weight maintenance after intervention. However, none of the findings were very robust or replicated in other studies.
Conclusions and future directions
Current research suggests that the genes that determine healthy thinness overlap largely with those that determine obesity, emphasizing the central role of the brain in controlling body weight across the body weight spectrum (13,24). Yet the genetic correlation between thinness and severe obesity was shown to be incomplete, implying that there are genes that affect thinness but not obesity, and vice versa (13). Preliminary findings highlight CADM2 as a thinness-specific gene that may affect body weight through increased energy expenditure (13). A meta-analysis of two larger intervention studies found suggestive evidence that genetic variation in MTIF3 may affect a person’s susceptibility to weight regain after weight loss (29). Nevertheless, the current findings are weak, and too little data are available to assess the extent to which the genes and physiology for thinness, weight loss maintenance, and obesity overlap or are indeed distinct.
This short review did not focus on the genetics of weight loss during intervention, which has been summarized by others before (40). While this is an equally important research question, this paper assumes that genes that act in weight-reduced states (persistent thinness, weight loss maintenance) differ from those that promote weight loss. However, this hypothesis remains to be tested.
In all, more longitudinal research into the genetic underpinning of body weight change and maintenance is needed. In particular, the genetics of persistent thinness and weight loss maintenance after intervention deserves more attention, as genes that underlie the weight-reduced state may provide new targets for the treatment and prevention of obesity. To that end, we need more genetic association studies that are sufficiently large and purposely designed to study the weight-reduced state (i.e., persistently thin, after weight loss intervention). Since these types of refined outcomes are not easy to collect, gathering sufficiently large populations will be challenging. Therefore, replication and/or meta-analyses will be key to produce robust findings, which will require careful harmonization of outcomes across studies.
Promise and Perils of Human Neuroimaging to Understand the Weight-Reduced State
The purpose of this review is to provide an overview of neuroimaging tools that might prove useful to researchers studying the CNS contribution to the weight-reduced state in humans. It focuses on three broad categories: functional, connectivity, and structural neuroimaging, providing an overview of each approach, including its broad purpose, what it measures, the study objectives that researchers might utilize the methodology for, and the common techniques. Examples from the literature in which the techniques were applied in studies of obesity and/or weight loss are used to illustrate both the promise and the perils of these approaches. Given the multitude of paradigms available, in fMRI in particular, the review cannot be comprehensive, but it attempts to provide a condensed tutorial on commonly used and promising new applications in our field. Other methodologies, including those utilizing radioligand binding and positron emission tomography (PET) to assess brain neurochemistry or magnetic resonance spectroscopy to measure brain metabolites, are reviewed elsewhere (41,42).
Functional neuroimaging
Purpose and use.
Functional neuroimaging strategies (Table 1) measure neural activity in response to the stimulus of interest (the “task”). The types of study objectives that might be met through this technique include mapping a particular brain function to the anatomic locations in the brain that mediate the function or behavior. Functional neuroimaging techniques are also used to (1) phenotype group differences in CNS response to a task or (2) measure the CNS response to a physiologic stimulus. Most techniques use indirect measures of neural activity; BOLD imaging measures changes in blood oxygenation that follow a burst of neural activity, arterial spin labeling measures cerebral perfusion, 18F-fluorodeoxyglucose PET measures glucose metabolism, and 15O-labeled water measures regional cerebral blood flow. Electroencephalography and magnetoencephalography, moreover, directly measure electrical signals in the brain or detect the magnetic fields they produce, respectively.
TABLE 1.
Functional neuroimaging
| Purpose |
| Measure change in neural activity in response to a stimulus |
| Study objective |
| Map function to anatomic location |
| Test group differences in CNS response |
| CNS response to physiologic stimulus |
| Techniques |
| BOLD fMRI |
| ASL |
| PET (FDG, 15O-water) |
| EEG, MEG |
| Common tasks |
| Food cues |
| Task + physiologic manipulation |
| Food-specific modifications of behavioral tasks (e.g., Go/No-Go) |
ASL = arterial spin labeling; BOLD = blood oxygen-level dependent; CNS = central nervous system; EEG = electroencephalography; FDG = fluorodeoxyglucose; fMRI = functional magnetic resonance imaging; MEG = magnetoencephalography; PET = positron emission tomography.
Functional neuroimaging is predicated upon assessing brain response to a task. Food or taste cues are frequently utilized in the literature, but physiologic manipulation (i.e., consuming food, pharmacologic manipulation) alone or in combination with a task is another common method. A number of standard behavioral tasks assessing general traits or cognitive abilities (e.g., impulsivity) have also been adapted to be food specific. In actuality, all indirect measures of neural activity compare the brain response to two different tasks, because these measures are not quantitative. For example, early fMRI mapping studies compared BOLD response to images of food versus object (tools) cues and found hunger-dependent activation by the food cues in amygdala, parahippocampal regions, and the anterior fusiform gyrus (n = 17 participants) (43). The same comparative principle is applied, albeit with a slower temporal resolution, using PET or arterial spin labeling. An individual’s response is compared between a control versus a test condition or a basal measure of neuronal activity versus a postintervention acquisition (e.g., before and after ingesting a satiating meal in Gautier et al. (44)). For all techniques, maps are derived that define the anatomic locations of areas within the brain that differed significantly in the indirect measure chosen (e.g., BOLD response, regional cerebral blood flow). The term “activation” is used to distinguish differences in BOLD response as an indirect marker of underlying neural activity. “Clusters” of activation represent brain areas in which differences in the indirect measure of neural activity surpass a designated level of statistical significance (usually combined with an extent or cluster size criterion), corrected for the multiple comparisons conducted across all the voxels in which statistical testing was performed.
The extent of the brain over which inferential testing is applied is a critical issue in design and interpretation. Region of interest approaches restrict hypothesis testing to selected brain areas, which, to avoid bias, should be designated prior to study completion. While providing enhanced power to detect prehypothesized effects, region of interest approaches supply no insight into brain response outside the designated anatomic area. In contrast, whole-brain analyses are conducted across all brain voxels and, ideally, they represent an unbiased approach to discover the neural substrates of a particular task. Owing to the multiple comparisons involved in testing across all the voxels of the brain, whole-brain analyses require larger sample sizes to have sufficient statistical power and they are at risk of failing to detect physiologically significant responses when power is insufficient.
Concerns related to small sample size and poor reproducibility for neuroimaging studies have been raised (45). Performing multiple comparisons across the whole brain or across many regions of the brain in a relatively small sample size increases the possibility of false-positive results. Moreover, flexibility and variability in the multistep image processing and statistical analytic methods used in fMRI can influence study results (46). When combined with a lack of transparency in the image processing methods applied, such factors can significantly hamper the reproducibility of neuroimaging studies (45). Authors and institutions have proposed steps to ameliorate these concerns (47,48). Recommendations include preregistration and complete reporting of study methods and analytic strategies, open sharing of unthresholded data, validation and publication of all custom software code, replication studies, and larger sample sizes (45,48).
Application of functional neuroimaging techniques.
Initial studies in the field focused on identifying the neural correlates of response to food cues. It became apparent early on that fMRI readily distinguished regions with differential response between visual images of food versus objects (43,49) and that, among all foods, energy density also elicits divergent responses (49). To illustrate, using a region of interest approach among a restricted set of brain areas, we found that brain reward centers, including the midbrain ventral tegmental area and areas of the striatum such as the nucleus accumbens, had clusters of greater activation by energy-dense foods than objects, as did the hypothalamus, insular cortex (involved in taste processing), and visual cortex (50). In comparison, only the visual cortex region demonstrated activation by low-calorie food images compared with objects and not regions involved in reward processing or appetite regulation. The central point for studies of the neurophysiology of weight loss is that the choice of task, including what images are presented, is a critical determinant of the brain areas that are engaged or activated in functional neuroimaging. Systematic reviews and meta-analyses are available for guidance on accumulated evidence as to the anatomic substrates responsive to particular tasks (51-53).
Functional neuroimaging studies were instrumental in documenting how brain response to food cues is altered by physiologic manipulations. To study appetitive responses, Goldstone et al. imaged 20 individuals without obesity using a protocol measuring response to visual food cues in both the fasted and fed states (54). By focusing on particular regions of interest, they revealed that activation by high-calorie food images is enhanced by fasting within the amygdala, ventral striatum, insula, medial orbitofrontal cortex (OFC), and lateral OFC, whereas response to low-calorie food images may even be suppressed during fasting. Differences in activation between high- and low-calorie food cues were markedly reduced when participants were in the fed condition, for which participants consumed a filling breakfast of their own choice that, on average, consisted of 47% of their estimated daily caloric needs. The authors concluded that fasting biases attentional and reward processes toward highly energy-dense food in our environment. Moreover, in a study of 23 normal-weight adults (55), the degree of activation by high- versus low-calorie foods in areas including the amygdala, which plays a role in cue-related eating (56), and medial OFC positively correlated with subjective ratings of hunger. Regional activation by high-calorie food cues is enhanced by hunger (43) or ghrelin infusion (57) and is suppressed by leptin (58,59), glucagon-like peptide-1 plus peptide YY (60), liraglutide (61), intranasal insulin (62), and food intake (63-65). Such findings suggest that activation by high-calorie food cues in key appetitive regulation regions is an objective marker of appetitive drive in the brain. In fact, the degree of activation within selected corticolimbic and insular areas positively predicts choice of higher-fat foods (55) and caloric intake (64) at an ad libitum buffet meal immediately following fMRI acquisition.
Functional neuroimaging has also been applied to study weight loss (52). A recent study of 37 children with obesity undergoing a 6-month family-based behavioral weight loss program found worse treatment outcomes among children who, at baseline, failed to suppress activation by high-calorie food cues in key appetite-regulating brain regions after a meal (66). As an example of a group phenotyping approach, individuals who formerly had obesity were compared with women with obesity and women of normal weight using PET. Le et al. found an enhanced response to a meal in the dorsolateral prefrontal cortex among women (n = 8) who formerly had obesity compared with women with obesity (n = 9) (67). Because of its role in cognitive control, the authors interpreted the findings as indicative of enhanced inhibitory control following a meal. Similar findings were found in studies of successful weight loss maintainers using PET (68) and BOLD fMRI (69).
Using a within-participants approach, Holsen et al. studied 18 patients before and 12 months after weight loss by sleeve gastrectomy (70). Regions regulating motivation and reward, such as the nucleus accumbens, amygdala, and striatum, were demonstrated by fMRI after surgery to have reduced activation during a task in which participants focused on their desire for highly palatable foods, whereas the dorsolateral prefrontal cortex showed increased activation. Among 14 women imaged before and 1 month following Roux-en-Y gastric bypass, reductions in desire to eat high-calorie foods were correlated with reductions in activation by high-calorie food cues in the dorsal striatum and dorsolateral prefrontal cortex (71). The latter finding was hypothesized to be related to a decline in need to evoke cognitive control as the physiologic urge for highly energetic foods dissipated (71). Other studies of bariatric surgery patients have supported that weight loss via bariatric surgery broadly alters food cue responsiveness in neural circuits governing attention, motivation, and reward processing (72-76); inhibitory control (76); and interoceptive awareness (72,74) and gustatory processing (74). Studies have noted more robust changes in bariatric surgery patients than groups undergoing weight loss via gastric banding (72) or weight-stable controls (73). Using fMRI with food cues, Rosenbaum et al. studied six participants with obesity before and after a 10% reduction in body weight accomplished by caloric restriction. At 10% weight reduction, they further evaluated participants with or without replacement of leptin. Although the small sample size and low statistical threshold utilized limit conclusions about the neural substrates involved, their findings nonetheless provide initial support for the concept that neural responses to food cues are altered in the weight-reduced state consistent with a “long-range pattern” across distributed, functionally related brain regions and that such changes might derive from a relative leptin deficiency (77). Cumulatively, this literature suggests that effective bariatric surgery procedures fundamentally shift brain processing of appetite and satiety in a manner that reduces the appeal of high-calorie foods, combat the neurophysiology driving weight regain in the weight-reduced state when weight loss is evoked by energy deficit alone, and, ultimately, help with successful weight maintenance.
The neural correlates of behavioral weight loss via calorie restriction were tested using a whole-brain approach by Neselier et al. (78). Among 20 participants, there was a direct correlation between the amount of weight loss achieved and the degree of increase in activation by appetizing food cues (versus scenery) from baseline to 1 month of weight loss in regions including the dorsolateral prefrontal cortex, inferior frontal gyrus, and dorsal anterior cingulate cortex, among others. Moreover, increasing activation to food cues (versus scenery) within cognitive control regions predicted continued weight loss between 1 and 3 months. Among those with available data (n = 14), the superior frontal gyrus, in particular, emerged as a region in which participants who did not sustain increased activation to food cues regained weight at 24 months of follow-up. These studies illustrate the importance of assessing inhibitory control and self-regulatory capacity in studies of the weight-reduced state. These cognitive processes influence the ability to sustain weight reductions over time despite compensatory responses by adiposity and gut hormones (78) that promote weight regain.
Another important example of neural predictors of weight maintenance was an fMRI study by Murdaugh et al. conducted in 25 adults with obesity imaged both before and after 12 weeks of weight loss (79). The degree of activation by high-calorie food images within regions of interest in the ventral tegmental area/substantia nigra (which houses key dopaminergic neurons driving motivated behavior) and putamen was predictive of the degree of weight regain over a 9-month period of weight maintenance, as was activation within the fusiform cortex as identified on whole-brain analyses. Other regions potentially influencing weight maintenance have been identified, including the operculum and middle and inferior frontal gyrus (80), but additional data derived from larger sample sizes are required for definitive evaluation.
Promise and perils.
Functional neuroimaging can be a potent tool with which to study CNS function in vivo. In terms of its promise for understanding the weight-reduced state, the response to high-calorie food cues specifically appears to offer investigators an objective measure of the appetitive state, which can be an important adjunct to our admittedly poorly reliable subjective appetite and self-reported food intake measures. Functional neuroimaging techniques simultaneously assess cognitive and appetitive contributors, both of which appear to be important to weight loss and maintenance. fMRI is now more widely accessible and can be implemented in multisite studies (81). Finally, a body of literature has emerged from studies of both bariatric surgery and behavioral weight loss, albeit much of it in small samples, that supports the relevance of these measures to understanding weight loss and their potential for revealing CNS factors driving weight regain versus maintenance.
Sample size, reproducibility, and transparency are critical issues that researchers need to consider in their study designs. As in all functional neuroimaging, the choice of task influences which areas of the brain are most responsive. Furthermore, all studies related to appetite should include careful management and assessment of the state of satiety of participants (51,55), among other measures required to reduce confounding and variability in brain response to food cues (52,82,83). Standard techniques may lack the anatomic resolution to target small structures particularly in subcortical regions or the nuclei or subnuclei of critical regions such as the amygdala or hypothalamus. High-resolution fMRI may be needed to achieve resolution on the order of 1 mm3. Finally, functional neuroimaging results can be subject to genetic confounding (84), which can lead to faulty interpretations that, for example, obesity itself is characterized by a particular CNS response, whereas the signal instead represents genetic predispositions to both obesity and the identified CNS response (85).
Connectivity studies
Purpose and use.
Using fMRI, functional connectivity studies assess functional neural circuits within the brain (Table 2). It is now well recognized that distributed brain regions work together in networks that can be defined by their function (86,87). Functional connectivity studies have been used in our field to map a network to a particular element of appetite regulation, test group differences in functional network connectivity, or test the change in network function with a physiologic stimulus. The most common technique is BOLD fMRI obtained during a resting state scan, but functional connectivity can also be analyzed from task data and used in a psychophysiological interaction analysis.
TABLE 2.
Functional connectivity studies
| Purpose |
| Assess functional connections within the brain |
| Study objective |
| Map distributed networks and define their function |
| Test group differences in connectivity |
| Test change with physiologic stimulus |
| Techniques |
| BOLD functional magnetic resonance imaging |
| Common tasks |
| None during resting state scan |
| During task conduction (PPI analysis) |
BOLD = blood oxygen-level dependent; PPI = psychophysiological interactions.
Resting state data acquisitions are used for intrinsic functional connectivity analyses. Participants lie still in the scanner and “let the mind wander.” This resting pattern of neural activity has natural, random-appearing low-frequency oscillations. However, regions that are in communication with each other will tend to oscillate in parallel (88,89). The degree of synchronicity between distributed brain regions is called the functional connectivity. Functional connectivity is reduced in neurodegenerative disorders (90).
Application of connectivity techniques.
The role of intrinsic connectivity networks in appetite and body weight regulation is not yet fully understood. A recent study by Sewaybricker et al. supported a role for the salience network in feeding and appetite regulation (91). The salience network encompasses a group of nodes (e.g., anterior insula, hypothalamus, ventral tegmental area, prefrontal cortex) that take in interceptive information from the body and then marshal our attentional and cognitive resources to address the greatest immediate homeostatic need (92). Using a predefined set of nodes derived from a separate sample, the authors found that salience network connectivity was reduced after a meal (n = 110), perhaps reflecting the fact that these nodes are no longer actively addressing nutritional needs and therefore direct cognitive resources toward other functions (93). Other studies have also shown reductions in connectivity by nutrient intake (94-96), further supporting that acute changes in regional connectivity reflect the appetitive state.
As opposed to defining an entire network, it is also possible to interrogate functional connectivity of a selected brain region using it as a “seed.” In an example of this approach, Neseliler et al. chose a seed region within the ventral medial prefrontal cortex, an area implicated in value coding during choice, and then tested whether connectivity with other regions of the brain was altered during voluntary weight loss. Individuals with the greatest weight loss success at 1 month showed reduced connectivity to visual association areas in the lingual gyrus and lateral occipital cortex and increased connectivity to the dorsolateral prefrontal cortex (78), potentially reflecting fundamental shifts in the neural organization of self-regulatory capacity during weight loss. As demonstrated by this study, a seed approach can be applied to a select brain region as a predefined analytic strategy for hypothesis testing to map the neurophysiologic changes or adaptions in connectivity of that region related to a task or intervention.
Promise and perils.
Connectivity analyses are informative because they have a mechanistic aspect. In studying the weight-reduced state, they could reveal how network strength or regional patterns of communication might evolve during weight loss or persist in the weight-reduced state in a way that predicts weight maintenance. These network analyses are complementary to task fMRI and are accessible, and the sequences have been standardized to make them amenable to large, multisite studies such as the Human Connectome Project (97).
Connectivity studies can also suffer from issues of reproducibility and sample size, because considerable variability in postprocessing methods and analytic strategies persists, without proper transparency. A potential pitfall in interpretation is that, for dynamic connectivity studies, increasing or decreasing connectivity does not reliably equate to abnormal brain function, meaning that normal brain function can involve enhancing connectivity to one region while disengaging from another. Finally, because their reliability is dependent on the duration of the acquisition (98), resting state acquisitions are not well suited to assessing shifts in connectivity because of rapid stimuli such as taste.
Structural neuroimaging
Purpose and use.
Structural neuroimaging techniques (Table 3) noninvasively assess tissue volume or composition. They are the mainstay of clinical neuroradiology for which they are used to detect disease states. In research, structural neuroimaging is used to assess tissue volume, composition, and microstructure. Common techniques include the basic sequences of T1-, T2-, and T2*-weighted images, but many other sequences are available that, when used in a complementary manner, provide insights into tissue composition and can be quantified for use in research studies. For studies of gray or white matter volume, voxel-based morphometry is the common analytic technique. From the technique of diffusion-weighted imaging, researchers can define the structural connectivity of white matter tracks or assess tissue microstructure. There are no tasks during structural neuroimaging.
TABLE 3.
Structural neuroimaging
| Purpose |
| Assess tissue volume or composition |
| Assess structural connectivity |
| Study objective |
| Detect disease states (clinical neuroradiology) |
| Test group differences in tissue volume or composition |
| Noninvasively assess tissue microstructure |
| Techniques |
| T1-weighted, T2-weighted, FLAIR, etc. |
| VBM |
| Diffusion-weighted imaging |
| Diffusion tensor imaging (fiber tractography) |
| Tasks |
| None |
FLAIR = fluid attenuation inversion recovery; VBM = voxel-based morphometry.
Applications of structural neuroimaging.
Volumetric studies assessing brain volume have yielded mixed findings in weight loss. Several have shown no change in overall gray matter volume with weight loss (99) or after 6 weeks of very low-calorie diet (100). Other findings include greater 3-month reductions in gray matter volume in prefrontal cortex with greater weight loss (n = 72) (101) as well as regional changes in white matter (100,102).
Clinical neuroradiologists routinely evaluate tissue composition based on the degree of brightness or darkness on structural MRI studies to detect CNS disease in individual patients. Both normal tissue and disease processes infiltrating brain tissue have signature radiologic appearances characterized by how bright or dark the area looks. The appearance of brain structures on MRI reflects their biochemical and magnetic properties (e.g., water, lipid, iron content) and the measured energy they emit when subjected to a particular technique or “sequence.” Sequences accentuate the brightness of certain tissues by varying the duration, orientation, and/or strength of the excitatory radiofrequency pulses applied within the magnetic field generated by the scanner. Unlike computed tomography methods, the scale of brightness and darkness in a structural image generated by MRI is not quantitative and therefore is not comparable from one person to another or even from one scan acquisition to the next. Therefore, a quantitative approach is required to measure tissue characteristics for research purposes. Structural images can be quantified through the use of a signal ratio; the parameter measured from the region of interest is compared with a control region, allowing a relative measure of the degree of brightness or darkness in the region of interest that is, in effect, normalized to that of the control tissue. Alternatively, a multi-echo sequence can be implemented that allows researchers to fit a curve that quantifies the parameter, for example, the T2 relaxation time.
Structural neuroimaging has been applied to document the translational relevance of preclinical studies establishing that a reactive gliosis occurs in the arcuate nucleus of the hypothalamus during high-fat diet feeding in rodent models of diet-induced obesity. Reactive gliosis consists of activation and expansion of microglial and astrocyte populations and occurs early after initiation of high-fat diet feeding, preceding weight gain (103). These microglial and astrocyte inflammatory responses are necessary and sufficient for the hyperphagia and weight gain that result in diet-induced obesity (104,105), suggesting a role for hypothalamic gliosis in obesity pathogenesis (106). Advanced gliosis forms glial scars that inhibit normal neuronal functions such as dendrite outgrowth (107,108). Tissue remodeling by glial cell infiltration might therefore significantly alter neuronal function within this critical region for energy homeostasis.
Using structural neuroimaging, robust reactive gliosis can be visually identified on T2-weighted images as bright-appearing lesions within healthy background tissue. Quantitatively, this high T2 signal (brightness) is measured via T2 signal ratios or T2 relaxation times. Histopathologic studies have determined that T2 signal correlates with increased number of glial cells as well as a reactive astrocytosis and decreased neuron populations (109-111). In the mediobasal hypothalamus (MBH), glial fibrillary acid protein staining intensity positively correlates with T2 relaxation time in high-fat-diet-fed rodents (112) and postmortem human brain slices (113). Using quantitative structural neuroimaging techniques, several studies have found radiologic evidence of gliosis of the MBH in association with obesity in adults (103,113,114) and children (115). Moreover, longer MBH T2 relaxation times correlate with greater visceral adiposity (115,116) and insulin resistance independent of obesity (113) and were observed in women with obesity with type 2 diabetes mellitus relative to women with obesity who were nondiabetic (102).
In mice, switching from high-fat to chow diet reverses gliosis (112). Two human studies have examined the effects of weight loss on gliosis using structural neuroimaging. Van de Sande-Lee et al. found that Roux-en-Y gastric bypass resulted in significant declines in MBH T2 relaxation time postoperatively in women with obesity (102). In contrast, Kreutzer et al. found no significant decrease in MBH/amygdala signal ratio (n = 7) from before to after bariatric surgery (114). Additional studies are required to establish whether hypothalamic gliosis persists or reverses after weight loss in humans.
Diffusion-weighted imaging can be acquired and processed to reveal tissue microstructure and/or to describe the structural connectivity of white matter tracts via diffusion tensor imaging and fiber tractography. This technique detects the propensity for directional diffusion of water molecules through a tissue (i.e., isotropy). Variability in tissue microstructure owing to cellularity, axonal alignment, or pathological processes such as ischemia, inflammation, tumor, or brain injury alters diffusivity, which can be interrogated using analytic models to calculate parameters such as mean diffusivity, apparent diffusion coefficients, and fractional anisotropy as well as newer metrics such as neurite density. Several of these measures were found to be altered in obesity (117-120), including in the hypothalamus (118,120). Whether tissue microstructure is altered by weight loss or in the weight-reduced state is currently undefined.
Promise and perils.
One caution with volumetric techniques is that they can be influenced by nutrition and hydration status; early studies in eating disorders suggested cerebral atrophy, but these were subsequently shown to principally resolve after refeeding (121-123). Measures of tissue composition and microstructure are relatively nonspecific (124). Therefore, these tools provide only indirect evidence of the underlying neuropathological alterations occurring in obesity or in the weight-reduced state. Complementary studies of animal models or postmortem samples are needed to support causal inference. Nonetheless, structural neuroimaging offers the only feasible means of testing hypotheses in vivo in humans about whether structural reorganization, brain inflammation, or brain injury contribute to the physiology of the weight-reduced state.
Conclusion
Neuroimaging in humans provides a wealth of strategies for enhancing our understanding of the brain’s role in defending elevated body adiposity in obesity. Existing studies support its promise for revealing CNS appetitive responses to weight loss via fMRI, both in terms of motivational and reward pathways as well as cognitive control and self-regulation. These fundamental brain processes rely on regional communication within neural networks, assessment of which is amenable to functional connectivity techniques. Moreover, structural neuroimaging suggests that cellular inflammatory responses occur in body-weight-regulating areas of the brain in obesity, but the extent to which such chronic CNS inflammation inhibits weight loss or promotes weight regain remains unknown.
A broader understanding of the weight-reduced state could be attained by combining neuroimaging approaches. Structural neuroimaging is ideal for uncovering long-term changes in the CNS that might contribute to defense of elevated body adiposity, whereas functional neuroimaging and connectivity approaches reveal the functional consequences of any structural changes for regulation of appetite and energy balance. For example, future studies could use T2- and diffusion-weighted imaging to assess whether hypothalamic tissue composition and structural connectivity contribute to individual variability in changes in energy expenditure in the weight-reduced state. Complementary resting state and fMRI response to food cue approaches could provide mechanistic insights into the neural circuits regulating these physiologic responses to weight reduction. Future studies should also focus on how the physiology of the weight-reduced state affects structure or function within the executive control regions and networks that support self-regulatory capacity during weight maintenance. Regardless of approach, attention to sample size and transparency in analytic methods will be required to meet current standards for rigor in neuroscience. In sum, multimodal neuroimaging is a critical tool for uncovering the neurophysiology that characterizes the weight-reduced state and the extent to which this neurophysiology compels a return to elevated body adiposity. Treatment strategies that overcome or modify CNS-mediated biological drives will likely be required for patients to sustain substantial weight losses long term.
Acknowledgments
Dr. Schur would like to acknowledge Drs. Natalia Kleinhans and Susan Melhorn for their critical feedback on the manuscript.
Funding agencies:
Funding (to EAS) provided by the National Institutes of Health (DK089036, DK098466, DK117623, HL144917), the Nutrition and Obesity Research Center (P30 DK035816), and the American Diabetes Association (1-17-ICTS-085).
Footnotes
Disclosure: The authors declared no conflict of interest.
References
- 1.Speakman JR. Obesity: the integrated roles of environment and genetics. J Nutr 2004;134:2090S–2105S. [DOI] [PubMed] [Google Scholar]
- 2.Greenway FL. Physiological adaptations to weight loss and factors favouring weight regain. Int J Obes (Lond) 2015;39:1188–1196. [DOI] [PMC free article] [PubMed] [Google Scholar]
- 3.Goldsmith R, Joanisse DR, Gallagher D, et al. Effects of experimental weight perturbation on skeletal muscle work efficiency, fuel utilization, and biochemistry in human subjects. Am J Physiol Regul Integr Comp Physiol 2010;298:R79–R88. [DOI] [PMC free article] [PubMed] [Google Scholar]
- 4.Rosenbaum M, Goldsmith RL, Haddad F, et al. Triiodothyronine and leptin repletion in humans similarly reverse weight-loss-induced changes in skeletal muscle. Am J Physiol Endocrinol Metab 2018;315:E771–E779. [DOI] [PMC free article] [PubMed] [Google Scholar]
- 5.Fisher-Wellman KH, Davidson MT, Narowski TM, Lin CT, Koves TR, Muoio DM. Mitochondrial diagnostics: a multiplexed assay platform for comprehensive assessment of mitochondrial energy fluxes. Cell Rep 2018;24:3593–3606.e10. [DOI] [PMC free article] [PubMed] [Google Scholar]
- 6.Softic S, Meyer JG, Wang GX, et al. Dietary sugars alter hepatic fatty acid oxidation via transcriptional and post-translational modifications of mitochondrial proteins. Cell Metab 2019;30:735–753.e4. [DOI] [PMC free article] [PubMed] [Google Scholar]
- 7.Carrer A, Parris JL, Trefely S, et al. Impact of a high-fat diet on tissue Acyl-CoA and histone acetylation levels. J Biol Chem 2017;292:3312–3322. [DOI] [PMC free article] [PubMed] [Google Scholar]
- 8.Lantier L, Williams AS, Williams IM, et al. SIRT3 is crucial for maintaining skeletal muscle insulin action and protects against severe insulin resistance in high-fat-fed mice. Diabetes 2015;64:3081–3092. [DOI] [PMC free article] [PubMed] [Google Scholar]
- 9.Fisher-Wellman KH, Draper JA, Davidson MT, et al. Respiratory phenomics across multiple models of protein hyperacylation in cardiac mitochondria reveals a marginal impact on bioenergetics. Cell Rep 2019;26:1557–1572.e8. [DOI] [PMC free article] [PubMed] [Google Scholar]
- 10.Locke AE, Kahali B, Berndt SI, et al. Genetic studies of body mass index yield new insights for obesity biology. Nature 2015;518:197–206. [DOI] [PMC free article] [PubMed] [Google Scholar]
- 11.Yengo L, Sidorenko J, Kemper KE, et al. Meta-analysis of genome-wide association studies for height and body mass index in approximately 700000 individuals of European ancestry. Hum Mol Genet 2018;27:3641–3649. [DOI] [PMC free article] [PubMed] [Google Scholar]
- 12.Akiyama M, Okada Y, Kanai M, et al. Genome-wide association study identifies 112 new loci for body mass index in the Japanese population. Nat Genet 2017;49:1458–1467. [DOI] [PubMed] [Google Scholar]
- 13.Riveros-McKay F, Mistry V, Bounds R, et al. Genetic architecture of human thinness compared to severe obesity. PLoS Genet 2019;15:e1007603. doi: 10.1371/journal.pgen.1007603 [DOI] [PMC free article] [PubMed] [Google Scholar]
- 14.Bulik CM, Allison DB. The genetic epidemiology of thinness. Obes Rev 2001;2:107–115. [DOI] [PubMed] [Google Scholar]
- 15.Orthofer M, Valsesia A, Mägi R, et al. Identification of ALK in thinness. Cell 2020;181:1246–1262.e22. [DOI] [PubMed] [Google Scholar]
- 16.Elks CE, den Hoed M, Hua Zhao J, et al. Variability in the heritability of body mass index: a systematic review and meta-regression. Front Endocrinol (Lausanne) 2012;3:29. [DOI] [PMC free article] [PubMed] [Google Scholar]
- 17.Whitaker KL, Jarvis MJ, Boniface D, Wardle J. The intergenerational transmission of thinness. Arch Pediatr Adolesc Med 2011;165:900–905. [DOI] [PubMed] [Google Scholar]
- 18.Bouchard C, Tremblay A, Després J-P, et al. The response to exercise with constant energy intake in identical twins. Obes Res 1994;2:400–410. [DOI] [PubMed] [Google Scholar]
- 19.Hainer V, Stunkard AJ, Kunešová M, Parízková J, Štich V, Allison DB. Intrapair resemblance in very low calorie diet-induced weight loss in female obese identical twins. Int J Obes Relat Metab Disord 2000;24:1051–1057. [DOI] [PubMed] [Google Scholar]
- 20.Hatoum IJ, Greenawalt DM, Cotsapas C, Reitman ML, Daly MJ, Kaplan LM. Heritability of the weight loss response to gastric bypass surgery. J Clin Endocrinol Metab 2011;96:E1630–E1633. [DOI] [PMC free article] [PubMed] [Google Scholar]
- 21.Finucane HK, Reshef YA, Anttila V, et al. Heritability enrichment of specifically expressed genes identifies disease-relevant tissues and cell types. Nat Genet 2018;50:621–629. [DOI] [PMC free article] [PubMed] [Google Scholar]
- 22.Ndiaye FK, Huyvaert M, Ortalli A, et al. The expression of genes in top obesity-associated loci is enriched in insula and substantia nigra brain regions involved in addiction and reward. Int J Obes (Lond) 2020;44:539–543. [DOI] [PMC free article] [PubMed] [Google Scholar]
- 23.Timshel PN, Thompson JJ, Pers TH. Genetic mapping of etiologic brain cell types for obesity. Elife 2020;9:e55851. doi: 10.7554/eLife.55851 [DOI] [PMC free article] [PubMed] [Google Scholar]
- 24.Berndt SI, Gustafsson S, Mägi R, et al. Genome-wide meta-analysis identifies 11 new loci for anthropometric traits and provides insights into genetic architecture. Nat Genet 2013;45:501–512. [DOI] [PMC free article] [PubMed] [Google Scholar]
- 25.Robinson MR, English G, Moser G, et al. Genotype-covariate interaction effects and the heritability of adult body mass index. Nat Genet 2017;49:1174–1181. [DOI] [PubMed] [Google Scholar]
- 26.Biederer T, Sara Y, Mozhayeva M, et al. SynCAM, a synaptic adhesion molecule that drives synapse assembly. Science 2002;297:1525–1531. [DOI] [PubMed] [Google Scholar]
- 27.Yan X, Wang Z, Schmidt V, et al. Cadm2 regulates body weight and energy homeostasis in mice. Mol Metab 2018;8:180–188. [DOI] [PMC free article] [PubMed] [Google Scholar]
- 28.Delahanty LM, Pan Q, Jablonski KA, et al. Genetic predictors of weight loss and weight regain after intensive lifestyle modification, metformin treatment, or standard care in the Diabetes Prevention Program. Diabetes Care 2012;35:363–366. [DOI] [PMC free article] [PubMed] [Google Scholar]
- 29.Papandonatos GD, Pan Q, Pajewski NM, et al. Genetic predisposition to weight loss and regain with lifestyle intervention: analyses from the Diabetes Prevention Program and the Look AHEAD randomized controlled trials. Diabetes 2015;64:4312–4321. [DOI] [PMC free article] [PubMed] [Google Scholar]
- 30.McCaffery JM, Papandonatos GD, Huggins GS, et al. FTO predicts weight regain in the Look AHEAD clinical trial. Int J Obes (Lond) 2013;37:1545–1552. [DOI] [PMC free article] [PubMed] [Google Scholar]
- 31.McCaffery JM, Papandonatos GD, Huggins GS, et al. Human cardiovascular disease IBC chip-wide association with weight loss and weight regain in the Look AHEAD trial. Hum Hered 2013;75:160–174. [DOI] [PMC free article] [PubMed] [Google Scholar]
- 32.Nettleton JA, Follis JL, Ngwa JS, et al. Gene × dietary pattern interactions in obesity: analysis of up to 68 317 adults of European ancestry. Hum Mol Genet 2015;24:4728–4738. [DOI] [PMC free article] [PubMed] [Google Scholar]
- 33.Rasmussen-Torvik LJ, Baldridge AS, Pacheco JA, et al. rs4771122 predicts multiple measures of long-term weight loss after bariatric surgery. Obes Surg 2015;25:2225–2229. [DOI] [PMC free article] [PubMed] [Google Scholar]
- 34.GTEx Consortium. Human genomics. The Genotype–Tissue Expression (GTEx) pilot analysis: multitissue gene regulation in humans. Science 2015;348:648–660. [DOI] [PMC free article] [PubMed] [Google Scholar]
- 35.Sharma MR, Koc EC, Datta PP, Booth TM, Spremulli LL, Agrawal RK. Structure of the mammalian mitochondrial ribosome reveals an expanded functional role for its component proteins. Cell 2003;115:97–108. [DOI] [PubMed] [Google Scholar]
- 36.Bray GA, Krauss RM, Sacks FM, Qi L. Lessons learned from the POUNDS Lost study: genetic, metabolic, and behavioral factors affecting changes in body weight, body composition, and cardiometabolic risk. Curr Obes Rep 2019;8:262–283. [DOI] [PubMed] [Google Scholar]
- 37.Larsen LH, Ängquist L, Vimaleswaran KS, et al. Analyses of single nucleotide polymorphisms in selected nutrient-sensitive genes in weight-regain prevention: the DIOGENES study. Am J Clin Nutr 2012;95:1254–1260. [DOI] [PubMed] [Google Scholar]
- 38.Sarzynski MA, Jacobson P, Rankinen T, et al. Associations of markers in 11 obesity candidate genes with maximal weight loss and weight regain in the SOS bariatric surgery cases. Int J Obes (Lond) 2011;35:676–683. [DOI] [PubMed] [Google Scholar]
- 39.Hinney A, Wolters B, Pütter C, et al. No impact of obesity susceptibility loci on weight regain after a lifestyle intervention in overweight children. J Pediatr Endocrinol Metab 2013;26:1209–1213. [DOI] [PubMed] [Google Scholar]
- 40.McCaffery JM. Precision behavioral medicine: implications of genetic and genomic discoveries for behavioral weight loss treatment. Am Psychol 2018;73:1045–1055. [DOI] [PMC free article] [PubMed] [Google Scholar]
- 41.Zimmer L, Luxen A. PET radiotracers for molecular imaging in the brain: past, present and future. Neuroimage 2012;61:363–370. [DOI] [PubMed] [Google Scholar]
- 42.Buonocore MH, Maddock RJ. Magnetic resonance spectroscopy of the brain: a review of physical principles and technical methods. Rev Neurosci 2015;26:609–632. [DOI] [PubMed] [Google Scholar]
- 43.LaBar KS, Gitelman DR, Parrish TB, Kim YH, Nobre AC, Mesulam MM. Hunger selectively modulates corticolimbic activation to food stimuli in humans. Behav Neurosci 2001;115:493–500. [DOI] [PubMed] [Google Scholar]
- 44.Gautier JF, Del Parigi A, Chen K, et al. Effect of satiation on brain activity in obese and lean women. Obes Res 2001;9:676–684. [DOI] [PubMed] [Google Scholar]
- 45.Poldrack RA, Baker CI, Durnez J, et al. Scanning the horizon: towards transparent and reproducible neuroimaging research. Nat Rev Neurosci 2017;18:115–126. [DOI] [PMC free article] [PubMed] [Google Scholar]
- 46.Botvinik-Nezer R, Holzmeister F, Camerer CF, et al. Variability in the analysis of a single neuroimaging dataset by many teams. Nature 2020;582:84–88. [DOI] [PMC free article] [PubMed] [Google Scholar]
- 47.Gorgolewski KJ, Poldrack RA. A practical guide for improving transparency and reproducibility in neuroimaging research. PLoS Biol 2016;14:e1002506. doi: 10.1371/journal.pbio.1002506 [DOI] [PMC free article] [PubMed] [Google Scholar]
- 48.Nichols TE, Das S, Eickhoff SB, et al. Best practices in data analysis and sharing in neuroimaging using MRI. Nat Neurosci 2017;20:299–303. [DOI] [PMC free article] [PubMed] [Google Scholar]
- 49.Killgore WD, Young AD, Femia LA, Bogorodzki P, Rogowska J, Yurgelun-Todd DA. Cortical and limbic activation during viewing of high- versus low-calorie foods. Neuroimage 2003;19:1381–1394. [DOI] [PubMed] [Google Scholar]
- 50.Schur EA, Kleinhans NM, Goldberg J, Buchwald D, Schwartz MW, Maravilla K. Activation in brain energy regulation and reward centers by food cues varies with choice of visual stimulus. Int J Obes Relat Metab Disord 2009;33:653–661. [DOI] [PMC free article] [PubMed] [Google Scholar]
- 51.van der Laan LN, de Ridder DT, Viergever MA, Smeets PA. The first taste is always with the eyes: a meta-analysis on the neural correlates of processing visual food cues. Neuroimage 2011;55:296–303. [DOI] [PubMed] [Google Scholar]
- 52.Pursey KM, Stanwell P, Callister RJ, Brain K, Collins CE, Burrows TL. Neural responses to visual food cues according to weight status: a systematic review of functional magnetic resonance imaging studies. Front Nutr 2014;1:7. [DOI] [PMC free article] [PubMed] [Google Scholar]
- 53.Han JE, Boachie N, Garcia-Garcia I, Michaud A, Dagher A. Neural correlates of dietary self-control in healthy adults: a meta-analysis of functional brain imaging studies. Physiol Behav 2018;192:98–108. [DOI] [PubMed] [Google Scholar]
- 54.Goldstone AP, de Hernandez CGP, Beaver JD, et al. Fasting biases brain reward systems towards high-calorie foods. Eur J Neurosci 2009;30:1625–1635. [DOI] [PubMed] [Google Scholar]
- 55.Mehta S, Melhorn SJ, Smeraglio A, et al. Regional brain response to visual food cues is a marker of satiety that predicts food choice. Am J Clin Nutr 2012;96:989–999. [DOI] [PMC free article] [PubMed] [Google Scholar]
- 56.Petrovich GD, Setlow B, Holland PC, Gallagher M. Amygdalo-hypothalamic circuit allows learned cues to override satiety and promote eating. J Neurosci 2002;22:8748–8753. [DOI] [PMC free article] [PubMed] [Google Scholar]
- 57.Malik S, McGlone F, Bedrossian D, Dagher A. Ghrelin modulates brain activity in areas that control appetitive behavior. Cell Metab 2008;7:400–409. [DOI] [PubMed] [Google Scholar]
- 58.Farooqi IS, Bullmore E, Keogh J, Gillard J, O’Rahilly S, Fletcher PC. Leptin regulates striatal regions and human eating behavior. Science 2007;317:1355. doi: 10.1126/science.1144599 [DOI] [PMC free article] [PubMed] [Google Scholar]
- 59.Baicy K, London ED, Monterosso J, et al. Leptin replacement alters brain response to food cues in genetically leptin-deficient adults. Proc Natl Acad Sci USA 2007;104:18276–18279. [DOI] [PMC free article] [PubMed] [Google Scholar]
- 60.De Silva A, Salem V, Long CJ, et al. The gut hormones PYY 3–36 and GLP-1 7–36 amide reduce food intake and modulate brain activity in appetite centers in humans. Cell Metab 2011;14:700–706. [DOI] [PMC free article] [PubMed] [Google Scholar]
- 61.Ten Kulve JS, Veltman DJ, van Bloemendaal L, et al. Liraglutide reduces CNS activation in response to visual food cues only after short-term treatment in patients with type 2 diabetes. Diabetes Care 2016;39:214–221. [DOI] [PubMed] [Google Scholar]
- 62.Guthoff M, Grichisch Y, Canova C, et al. Insulin modulates food-related activity in the central nervous system. J Clin Endocrinol Metab 2010;95:748–755. [DOI] [PubMed] [Google Scholar]
- 63.Roth CL, Melhorn SJ, Elfers CT, et al. Central nervous system and peripheral hormone responses to a meal in children. J Clin Endocrinol Metab 2019;104:1471–1483. [DOI] [PMC free article] [PubMed] [Google Scholar]
- 64.Melhorn SJ, Askren MK, Chung WK, et al. FTO genotype impacts food intake and corticolimbic activation. Am J Clin Nutr 2018;107:145–154. [DOI] [PMC free article] [PubMed] [Google Scholar]
- 65.Bruce AS, Holsen LM, Chambers RJ, et al. Obese children show hyperactivation to food pictures in brain networks linked to motivation, reward and cognitive control. Int J Obes 2010;34:1494–1500. [DOI] [PMC free article] [PubMed] [Google Scholar]
- 66.Schur EA, Melhorn SJ, Scholz K, et al. Child neurobiology impacts success in family-based behavioral treatment for children with obesity. Int J Obes 2020;44:2011–2022. [DOI] [PMC free article] [PubMed] [Google Scholar]
- 67.Le DS, Pannacciulli N, Chen K, et al. Less activation in the left dorsolateral prefrontal cortex in the reanalysis of the response to a meal in obese than in lean women and its association with successful weight loss. Am J Clin Nutr 2007;86:573–579. [DOI] [PMC free article] [PubMed] [Google Scholar]
- 68.DelParigi A, Chen K, Salbe AD, et al. Successful dieters have increased neural activity in cortical areas involved in the control of behavior. Int J Obes 2007;31:440–448. [DOI] [PubMed] [Google Scholar]
- 69.McCaffery JM, Haley AP, Sweet LH, et al. Differential functional magnetic resonance imaging response to food pictures in successful weight-loss maintainers relative to normal-weight and obese controls. Am J Clin Nutr 2009;90:928–934. [DOI] [PMC free article] [PubMed] [Google Scholar]
- 70.Holsen LM, Davidson P, Cerit H, et al. Neural predictors of 12-month weight loss outcomes following bariatric surgery. Int J Obes 2018;42:785–793. [DOI] [PMC free article] [PubMed] [Google Scholar]
- 71.Ochner CN, Stice E, Hutchins E, et al. Relation between changes in neural responsivity and reductions in desire to eat high-calorie foods following gastric bypass surgery. Neuroscience 2012;209:128–135. [DOI] [PMC free article] [PubMed] [Google Scholar]
- 72.Scholtz S, Miras AD, Chhina N, et al. Obese patients after gastric bypass surgery have lower brain-hedonic responses to food than after gastric banding. Gut 2014;63:891–902. [DOI] [PMC free article] [PubMed] [Google Scholar]
- 73.Faulconbridge LF, Ruparel K, Loughead J, et al. Changes in neural responsivity to highly palatable foods following Roux-en-Y gastric bypass, sleeve gastrectomy, or weight stability: an fMRI study. Obesity (Silver Spring) 2016;24:1054–1060. [DOI] [PMC free article] [PubMed] [Google Scholar]
- 74.Ten Kulve JS, Veltman DJ, Gerdes VEA, et al. Elevated postoperative endogenous GLP-1 levels mediate effects of Roux-en-Y gastric bypass on neural responsivity to food cues. Diabetes Care 2017;40:1522–1529. [DOI] [PubMed] [Google Scholar]
- 75.Ochner CN, Kwok Y, Conceicao E, et al. Selective reduction in neural responses to high calorie foods following gastric bypass surgery. Ann Surg 2011;253:502–507. [DOI] [PMC free article] [PubMed] [Google Scholar]
- 76.Zoon HFA, de Bruijn SEM, Jager G, et al. Altered neural inhibition responses to food cues after Roux-en-Y gastric bypass. Biol Psychol 2018;137:34–41. [DOI] [PubMed] [Google Scholar]
- 77.Rosenbaum M, Sy M, Pavlovich K, Leibel RL, Hirsch J. Leptin reverses weight loss-induced changes in regional neural activity responses to visual food stimuli. J Clin Invest 2008;118:2583–2591. [DOI] [PMC free article] [PubMed] [Google Scholar]
- 78.Neseliler S, Hu W, Larcher K, et al. Neurocognitive and hormonal correlates of voluntary weight loss in humans. Cell Metab 2019;29:39–49.e34. [DOI] [PubMed] [Google Scholar]
- 79.Murdaugh DL, Cox JE, Cook EW 3rd, Weller RE. fMRI reactivity to high-calorie food pictures predicts short- and long-term outcome in a weight-loss program. Neuroimage 2012;59:2709–2721. [DOI] [PMC free article] [PubMed] [Google Scholar]
- 80.Drummen M, Dorenbos E, Vreugdenhil ACE, et al. Associations of brain reactivity to food cues with weight loss, protein intake and dietary restraint during the PREVIEW intervention. Nutrients 2018;10:1771. doi: 10.3390/nu10111771 [DOI] [PMC free article] [PubMed] [Google Scholar]
- 81.Glover GH, Mueller BA, Turner JA, et al. Function biomedical informatics research network recommendations for prospective multicenter functional MRI studies. J Magn Reson Imaging 2012;36:39–54. [DOI] [PMC free article] [PubMed] [Google Scholar]
- 82.Charbonnier L, van Meer F, van der Laan LN, Viergever MA, Smeets PAM. Standardized food images: a photographing protocol and image database. Appetite 2016;96:166–173. [DOI] [PubMed] [Google Scholar]
- 83.Frank TC, Kim GL, Krzemien A, Van Vugt DA. Effect of menstrual cycle phase on corticolimbic brain activation by visual food cues. Brain Res 2010;1363:81–92. [DOI] [PubMed] [Google Scholar]
- 84.Melhorn SJ, Mehta S, Kratz M, et al. Brain regulation of appetite in twins. Am J Clin Nutr 2016;103:314–322. [DOI] [PMC free article] [PubMed] [Google Scholar]
- 85.Schur E, Carnell S. What twin studies tell us about brain responses to food cues. Curr Obes Rep 2017;6:371–379. [DOI] [PMC free article] [PubMed] [Google Scholar]
- 86.Damoiseaux JS, Rombouts SA, Barkhof F, et al. Consistent resting-state networks across healthy subjects. Proc Natl Acad Sci USA 2006;103:13848–13853. [DOI] [PMC free article] [PubMed] [Google Scholar]
- 87.Power JD, Cohen AL, Nelson SM, et al. Functional network organization of the human brain. Neuron 2011;72:665–678. [DOI] [PMC free article] [PubMed] [Google Scholar]
- 88.Shulman GL, Fiez JA, Corbetta M, et al. Common blood flow changes across visual tasks: II. Decreases in cerebral cortex. J Cogn Neurosci 1997;9:648–663. [DOI] [PubMed] [Google Scholar]
- 89.Raichle ME, Snyder AZ. A default mode of brain function: a brief history of an evolving idea. Neuroimage 2007;37:1083–1090. Discussion 1097-1089. [DOI] [PubMed] [Google Scholar]
- 90.Seeley WW, Crawford RK, Zhou J, Miller BL, Greicius MD. Neurodegenerative diseases target large-scale human brain networks. Neuron 2009;62:42–52. [DOI] [PMC free article] [PubMed] [Google Scholar]
- 91.Sewaybricker LE, Melhorn SJ, Askren MK, et al. Salience network connectivity is reduced by a meal and influenced by genetic background and hypothalamic gliosis. Int J Obes (Lond) 2020;44:167–177. [DOI] [PMC free article] [PubMed] [Google Scholar]
- 92.Seeley WW, Menon V, Schatzberg AF, et al. Dissociable intrinsic connectivity networks for salience processing and executive control. J Neurosci 2007;27:2349–2356. [DOI] [PMC free article] [PubMed] [Google Scholar]
- 93.Menon V, Uddin LQ. Saliency, switching, attention and control: a network model of insula function. Brain Struct Funct 2010;214:655–667. [DOI] [PMC free article] [PubMed] [Google Scholar]
- 94.Lips MA, Wijngaarden MA, van der Grond J, et al. Resting-state functional connectivity of brain regions involved in cognitive control, motivation, and reward is enhanced in obese females. Am J Clin Nutr 2014;100:524–531. [DOI] [PubMed] [Google Scholar]
- 95.Ryan JP, Karim HT, Aizenstein HJ, Helbling NL, Toledo FGS. Insulin sensitivity predicts brain network connectivity following a meal. Neuroimage 2018;171:268–276. [DOI] [PMC free article] [PubMed] [Google Scholar]
- 96.Paolini BM, Laurienti PJ, Norris J, Rejeski WJ. Meal replacement: calming the hot-state brain network of appetite. Front Psychol 2014;5:249. [DOI] [PMC free article] [PubMed] [Google Scholar]
- 97.Smith SM, Beckmann CF, Andersson J, et al. Resting-state fMRI in the human connectome project. Neuroimage 2013;80:144–168. [DOI] [PMC free article] [PubMed] [Google Scholar]
- 98.Birn RM, Molloy EK, Patriat R, et al. The effect of scan length on the reliability of resting-state fMRI connectivity estimates. Neuroimage 2013;83:550–558. [DOI] [PMC free article] [PubMed] [Google Scholar]
- 99.Bohon C, Geliebter A. Change in brain volume and cortical thickness after behavioral and surgical weight loss intervention. Neuroimage Clin 2019;21:101640. doi: 10.1016/j.nicl.2018.101640 [DOI] [PMC free article] [PubMed] [Google Scholar]
- 100.Haltia LT, Viljanen A, Parkkola R, et al. Brain white matter expansion in human obesity and the recovering effect of dieting. J Clin Endocrinol Metab 2007;92:3278–3284. [DOI] [PubMed] [Google Scholar]
- 101.Honea RA, Szabo-Reed AN, Lepping RJ, et al. Voxel-based morphometry reveals brain gray matter volume changes in successful dieters. Obesity (Silver Spring) 2016;24:1842–1848. [DOI] [PMC free article] [PubMed] [Google Scholar]
- 102.van de Sande-Lee S, Melhorn SJ, Rachid B, et al. Radiologic evidence that hypothalamic gliosis is improved after bariatric surgery in obese women with type 2 diabetes. Int J Obes (Lond) 2020;44:178–185. [DOI] [PMC free article] [PubMed] [Google Scholar]
- 103.Thaler JP, Yi CX, Schur EA, et al. Obesity is associated with hypothalamic injury in rodents and humans. J Clin Invest 2012;122:153–162. [DOI] [PMC free article] [PubMed] [Google Scholar]
- 104.Douglass JD, Dorfman MD, Fasnacht R, Shaffer LD, Thaler JP. Astrocyte IKKbeta/NF-kappaB signaling is required for diet-induced obesity and hypothalamic inflammation. Molecular Metabolism 2017;6:366–373. [DOI] [PMC free article] [PubMed] [Google Scholar]
- 105.Valdearcos M, Douglass JD, Robblee MM, et al. Microglial inflammatory signaling orchestrates the hypothalamic immune response to dietary excess and mediates obesity susceptibility. Cell Metab 2018;27:1356. doi: 10.1016/j.cmet.2018.04.019 [DOI] [PubMed] [Google Scholar]
- 106.Douglass JD, Dorfman MD, Thaler JP. Glia: silent partners in energy homeostasis and obesity pathogenesis. Diabetologia 2017;60:226–236. [DOI] [PMC free article] [PubMed] [Google Scholar]
- 107.Sofroniew MV. Molecular dissection of reactive astrogliosis and glial scar formation. Trends Neurosci 2009;32:638–647. [DOI] [PMC free article] [PubMed] [Google Scholar]
- 108.Karimi-Abdolrezaee S, Billakanti R. Reactive astrogliosis after spinal cord injury-beneficial and detrimental effects. Mol Neurobiol 2012;46:251–264. [DOI] [PubMed] [Google Scholar]
- 109.Briellmann RS, Kalnins RM, Berkovic SF, Jackson GD. Hippocampal pathology in refractory temporal lobe epilepsy: T2-weighted signal change reflects dentate gliosis. Neurology 2002;58:265–271. [DOI] [PubMed] [Google Scholar]
- 110.Chung YL, Williams A, Ritchie D, et al. Conflicting MRI signals from gliosis and neuronal vacuolation in prion diseases. Neuroreport 1999;10:3471–3477. [DOI] [PubMed] [Google Scholar]
- 111.Jackson GD, Williams SR, Weller RO, et al. Vigabatrin-induced lesions in the rat brain demonstrated by quantitative magnetic resonance imaging. Epilepsy Res 1994;18:57–66. [DOI] [PubMed] [Google Scholar]
- 112.Berkseth KE, Guyenet SJ, Melhorn SJ, et al. Hypothalamic gliosis associated with high-fat diet feeding is reversible in mice: a combined immunohistochemical and magnetic resonance imaging study. Endocrinology 2014;155:2858–2867. [DOI] [PMC free article] [PubMed] [Google Scholar]
- 113.Schur EA, Melhorn SJ, Oh SK, et al. Radiologic evidence that hypothalamic gliosis is associated with obesity and insulin resistance in humans. Obesity (Silver Spring) 2015;23:2142–2148. [DOI] [PMC free article] [PubMed] [Google Scholar]
- 114.Kreutzer C, Peters S, Schulte DM, et al. Hypothalamic inflammation in human obesity is mediated by environmental and genetic factors. Diabetes 2017;66:2407–2415. [DOI] [PubMed] [Google Scholar]
- 115.Sewaybricker LE, Schur EA, Melhorn SJ, et al. Initial evidence for hypothalamic gliosis in children with obesity by quantitative T2 MRI and implications for blood oxygen-level dependent response to glucose ingestion. Pediatr Obes 2019;14:e12486. doi: 10.1111/ijpo.12486 [DOI] [PMC free article] [PubMed] [Google Scholar]
- 116.Berkseth KE, Rubinow KB, Melhorn SJ, et al. Hypothalamic gliosis by MRI and visceral fat mass negatively correlate with plasma testosterone concentrations in healthy men. Obesity (Silver Spring) 2018;26:1898–1904. [DOI] [PMC free article] [PubMed] [Google Scholar]
- 117.Alkan A, Sahin I, Keskin L, et al. Diffusion-weighted imaging features of brain in obesity. Magn Reson Imaging 2008;26:446–450. [DOI] [PubMed] [Google Scholar]
- 118.Puig J, Blasco G, Daunis IEJ, et al. Hypothalamic damage is associated with inflammatory markers and worse cognitive performance in obese subjects. J Clin Endocrinol Metab 2015;100:E276–E281. [DOI] [PubMed] [Google Scholar]
- 119.Cazettes F, Cohen JI,Yau PL, Talbot H, Convit A. Obesity-mediated inflammation may damage the brain circuit that regulates food intake. Brain Res 2011;1373:101–109. [DOI] [PMC free article] [PubMed] [Google Scholar]
- 120.Thomas K, Beyer F, Lewe G, et al. Higher body mass index is linked to altered hypothalamic microstructure. Sci Rep 2019;9:17373. doi: 10.1038/s41598-019-53578-4 [DOI] [PMC free article] [PubMed] [Google Scholar]
- 121.Golden NH, Ashtari M, Kohn MR, et al. Reversibility of cerebral ventricular enlargement in anorexia nervosa, demonstrated by quantitative magnetic resonance imaging. J Pediatr 1996;128:296–301. [DOI] [PubMed] [Google Scholar]
- 122.del Parigi A, Schur E. Eating disorders. In: Cohen R, Sweet LH, eds. Brain Imaging in Behavioral Medicine and Clinical Neuroscience. New York: Springer; 2011:179–191. [Google Scholar]
- 123.Sein P, Searson S, Nicol AR, Hall K. Anorexia nervosa and pseudo-atrophy of the brain. Br J Psychiatry 1981;139:257–258. [PubMed] [Google Scholar]
- 124.Mukherjee P, Berman JI, Chung SW, Hess CP, Henry RG. Diffusion tensor MR imaging and fiber tractography: theoretic underpinnings. AJNR Am J Neuroradiol 2008;29:632–641. [DOI] [PMC free article] [PubMed] [Google Scholar]